
Abstract
In this study, detailed uniaxial and biaxial central tearing tests of a type of PVC coated polyester fiber fabric for buildings were carried out. The characteristics of the damage morphology, the formation of the triangle area at the crack tip, crack propagation, and failure modes during the entire tearing process were studied. The influence of crack orientation, crack length, and load ratio on tearing behaviors were analyzed, and it was found that the two parameters of crack orientation and length could be combined into a single variable of the number of cutting-off yarns in the direction perpendicular to crack propagation. For the uniaxial central tearing test, four widely used theoretical models were used to fit the experimental results, which led to the conclusion that Thiele’s empirical formula was the most suitable theory for predicting the tearing strength of PVC fabrics. Finally, the strain of all yarns across the crack section before and at the moment of crack propagation was recorded by the DIC equipment, and the load borne by each yarn was calculated based on the uniaxial tension curve of this material. In this way, the strain and load distributions were obtained for the first time, from which it was observed that the maximum strain almost always concentrated in the del-zone at crack tips, and the number of cutting-off yarns significantly affected the strain distribution. Specifically, the more yarns were cut off, the more difficult it was for other yarns far from the crack to exert their load-carrying capacity.
Keywords
Introduction
The membrane structure is a new form of building construction that has good development prospects owing to its beautiful shape, light weight, and excellent quality. After the completion of Shanghai stadium in 1997, which had a capacity of 80,000 people, thousands of membrane structures including stadiums, transportation facilities, shopping, and exhibition centers have been built. However, along with the extensive application of membrane structures, damage accidents also occur from time to time [1,2]. A series of investigations revealed that the reason for failures is generally not due to the ultimate tensile strength obtained from the material without any damage being exceed but to the damage of broken wires, cracks, and creases during the production, processing, and construction of the membrane material, which resulted in stress concentration under excessive snow or wind loads. The onset of tearing propagation might lead to an overall failure of the membrane structures.
The weak properties of the membrane material upon damage were first studied by scholars in the industrial field about 90 years ago. At that time, uniaxial tearing tests, including single tongue, double tongue, trapezoid-shaped methods and so on, were commonly used to test the tearing performance of coated and uncoated fabrics. Krook and Fox [3] focused on the behavior of tongue tearing of woven fabrics and first proposed the concept of del-shaped opening when they observed the tearing process of tongue specimens. They found that the del-shaped opening formed due to the slip of transverse yarns across the longitudinal yarns and it increased, as more and more yarns crowded together until some of them suddenly failed, and this is led to the start of tear propagation. Hager et al. [4] proposed a general equation relating the tear strength to the breaking strength and extensibility of a given fabric based on the trapezoid tear-strength test. A micromechanical analysis of damaged filamentary structures was first provided by Hedgepeth [5], who assumed that the fibers carry axial loads and the matrix was assumed to carry only shear, resulting in a stress concentration factor at the crack tip, which can be used to predict the tearing strength of the material. Scelzo et al. [6] examined the influence of tearing speed, yarn properties, and weaving structure on single-tongue tearing and established a spring model to predict the tearing strength of a single tongue. Chu and Chen [7] proposed two mathematical models to predict the tearing strength of trapezoid and single-rip specimens and adopted five test standard methods to test the tearing behaviors of sixteen fabrics, concluding that the theoretical methods are in good agreement with the experimental results. Zhong et al. [8] combined the Ising model and Monte Carlo method to simulate the tongue tearing failure of coated woven fabrics. The model considered the interfacial properties between fabric reinforcement and coating. The experiments showed that the model can effectively predict the mechanical properties of inhomogeneous materials. In the research of Witkowska and Frydrych [9], several standard tearing measurement methods were conducted, and the correlation relationships between the results obtained by them were revealed based on test results. Triki et al. [10] conducted tongue tear and tensile central crack tear tests on plain and twill woven fabrics, and the tearing energy from the variation of the work as a function of the tear crack surface area was obtained. The test results proved that this tearing energy criterion can be used as a valuable tool for the in-depth study of the tearing resistance of woven textiles. Wang et al. [11] established a geometric model of woven fabric meso-structure, and combined it with the mechanical parameters of fiber bundles and matrix, and constructed a finite element model of trapezoidal tearing of woven fabrics. Gao et al. [12] studied the tearing properties of multi-axis warp knitted fabrics using the trapezoidal tearing method and established a theoretical model reflecting the tearing strength of this kind of material. Wang et al. [13] studied the mechanical response and failure mode of a flexible composite trapezoidal tearing test. A simplified geometric model was established according to the fabric structure, and the tear resistance of warp and weft yarns and coatings was obtained.
In recent years, research studies on the tearing properties of membrane materials have attracted increasing attention in civil engineering and aerospace fields, and most studies have mainly focused on uniaxial and biaxial central tearing tests, in which the plane tearing mode and stress state are closer to the actual tearing failure process of fabrics, and the single-edge notched tearing test, which can be regarded as a simplified uniaxial central tearing test. Godfrey and Rossettos [14] and Godfrey et al. [15] proposed a simple micromechanical model to predict the onset of tear propagation at slit-like damage sites in biaxially stressed plain weave fabrics under increasing loading. This theoretical model showed great agreement with the test results. Bigaud et al. [16] systematically studied the tearing performance of PVC membrane materials for buildings by using uniaxial and biaxial central tearing methods, explained the tearing failure modes, and the main factors affecting the tearing strength, and analyzed the test results by using the finite element method and fracture mechanics theory. Maekawa et al. [17] studied the mode I tearing characteristics of high-performance Vectran fiber bundle reinforced high-altitude balloon membrane materials by biaxial central tearing and inflatable cylinder tests. Thiele’s empirical formula and the method of stress field consideration used to predict the tearing strength based on test results were found to fit well to this envelope material. Bai et al. [18] studied the tearing properties of aramid-reinforced polyurethane coatings used in balloons at high altitudes, and calculated the fracture toughness of the coatings. Liu et al. [19] established a physical model for crack tip tearing of airship envelope material based on a single-edge notched membrane experiment, and it was found that the tear strengths obtained from the physical model and experiment tests are close. Chen et al. [20,21] and Wang et al. [22,23] carried out systematic experiments and theoretical studies on the tearing properties of airship envelope materials under uniaxial and biaxial central tearing tests. The effects of crack length, crack angle, off-axis angles, stress ratio, and tensile speed on the tearing strength of membrane materials were investigated, and several theoretical methods including the finite element method were used to fit the test results. Xu et al. [24] performed single-edge notched tensile specimens (SENT) to measure the fracture toughness of a woven textile composite. During the process, various theoretical methods including Bao et al.’s SIF solution, FEA, LEFM, and Bazant’s size effect law are used, and their applicability was demonstrated. Zhang et al. [25] conducted uniaxial central tearing tests on PVC coated fabrics using experimental and theoretical methods to reveal the influence of crack shape, crack size, tensile rate, and specimen dimension on tearing behaviors, and an analytical model based on the exponential stress field theory was proposed to predict the tear propagation model of this material. In the research of He et al. [26], uniaxial tearing tests on PTFE coated fabric were carried out, and the critical energy release rate GIC, which can be treated as an inherent index to evaluate the tearing resistance of this material was obtained based on the numerical method virtual crack closure technique (VCCT). At the same time, the effects of boundary condition and shear modulus were discussed.
However, as the coated fabric is a composite material composed of plain weaved warp and weft yarns and coatings, it is more complex than common materials such as steel, and its mechanical response seems difficult to grasp. Furthermore, the introduction of damages makes the problem more complicated and confusing. Various mathematical and finite element models have been proposed to evaluate the tear resistance of fabrics, but most of them are based on many idealized assumptions. Therefore, only a few aspects of the tearing properties can be considered at a time. However, the actual tearing behavior of the membrane material is a very complex nonlinear process, which has many factors to consider, including material nonlinearity, friction and contact, stripping and slippage of yarns and coating, etc. Therefore, the theoretical and numerical simulations are often different from the actual situation, as we can imagine. True information, such as the actual strain and stress distribution on the membrane surface during tearing needs to be revealed through experiments, which means that the studies on tearing resistance mentioned above are far from sufficient, directly leading to the lack of convincing and practical theoretical theories that can be applied to guide membrane structural design.
In this study, uniaxial and biaxial central tearing tests on a type of coated fabric were carried out, and the effects of crack orientation, crack length, number of cutting-off yarns, and load ratio on tearing strength were systematically studied. As most of the external load is borne by yarns in the substrate, we measured the strain of each yarn, based on which the load of yarns can also be calculated across the crack section before and at the moment of tearing propagation with the help of DIC equipment. The obtained strain and load distribution is of great significance to understand the mechanical response of slotted membrane material under external load, and provides basic data for improving tearing theories in the future.
Experimental program
Materials
In this study, the tested membrane material is made of polyester fibers and PVC coating, which is commonly used in China. The thickness is 0.83 mm, and the surface layer is made of PVDF. The tensile test refers to the specification listed in DG/TJ08-2019-2007 [27] for obtaining the uniaxial tensile properties of this fabric, in which the specimen size is 300 mm × 50 mm, while the tensile speed is set to 2 mm/min instead of 100 mm/min in the code for making it consistent with those used in the uniaxial central tearing test. Through the extensometers clamped at both ends of the gauge distance of the specimen, the deformation within the gauge distance in the process of tension is measured, and then the logarithmic strain value is calculated by relevant formula. However, the load-logarithmic strain curve obtained by this method is generally characterization of fabric. The approximate curve of single yarn can be obtained by dividing the load value by the number of yarns in the tensile direction within the width of the specimen. The average load-logarithmic strain curves of single warp and weft yarn are shown in Figure 1. For the fabric, the average ultimate tensile strength is 102.95 N/mm and 93.41 N/mm in warp and weft direction, respectively. On the other hand, the ultimate tensile strength for warp and weft yarn is 160.9 N and 141.5 N, respectively, and the corresponding average logarithmic strain at break is 0.235 and 0.285, respectively.

Load-logarithmic strain curve of single warp and weft yarn.
Specimens and test setup
The fabrication of uniaxial central tearing specimens is carried out with reference to the guidelines outlined by FAA-8110-2 [28], as shown in Figure 2(a). The entire length and the measuring length are set to 700 mm and 76.2 mm, respectively, while the width is set to 70 mm due to the limitation of the fixture of the uniaxial stretching machine. In the process of specimen preparation, the cut direction and external load are all parallel with respect to warp or weft yarns. The former is defined as the warp specimen, while the latter is defined as the weft specimen. The cutting should be carried out in a careful manner along the middle of the two adjacent groups of yarns. In this way, there should be no loss of fibers on either side of the specimen. Subsequently, the cracks with different initial crack orientations θ, which represent the angle between the crack and the transverse direction (width direction), and macro length 2a, in which a represents the half length of the crack, are made in the center based on the experimental design. This uniaxial tearing test is conducted in the universal testing machine CMT4204 (Figure 2(c)) and is controlled by a constant tension speed of 2 mm/min to ensure static loading. The displacement data are obtained by clamping the extensometer at both ends of the measuring length of the specimen.

Test setup: (a) uniaxial central tearing specimen (mm); (b) biaxial central tearing specimen (mm); (c) universal testing machine; and (d) biaxial testing machine with the DIC equipment.
Upon referring to the provisions regarding the biaxial tensile tests in related membrane standard [27], the biaxial central tearing test is carried out using cross-shaped specimens, as shown in Figure 2(b). The specimens are fabricated carefully along the warp and weft yarns with a rectangular membrane area (160 mm × 160 mm) in the center that is connected with four extension arms to transfer the external load. The arm width is set to 160 mm, and a slit is made on it at every 3-5 cm to guarantee a uniform load transmission to the central region. Four transitional arcs with a radius of 15 mm are set at the angle between the adjacent arms to reduce the stress concentration. Similar to the uniaxial specimens, the cracks with different initial crack orientations θ, which represent the angle between the crack and the warp direction, and macro length 2a are made in the middle of the central region in the biaxial specimens. The biaxial central tearing test is performed using a biaxial test machine, as shown in Figure 2(d), which is developed by Tongji University and which has an automatic control and data acquisition function. The tensile speed and the load ratio in both warp and weft directions can be controlled during the entire test process. In this case, the warp tensile speed is constant at 2 mm/min, and the tensile speed in the weft direction would be automatically adjusted to maintain a fixed load ratio. As a preparatory work, the cross-shaped specimen without cracks should be tensioned three times repeatedly in accordance with the load ratio of 1:1 for eliminating yarn buckling before the tearing test.
A three-dimensional digital speckle dynamic strain measurement and analysis system (Figure 2(d)) is used to obtain the displacement and strain field distribution on the membrane surface during the entire tearing process. The basic principle of this system comprises of the digital image correlation DIC (Digital Image Association) method combined with binocular stereo vision technology and two high-speed cameras to acquire speckle images at each deformation stage of the object in real time. Subsequently, the image correlation algorithm plays a role in stereo matching the deformed points on the surface of the object, and the three-dimensional coordinates of the matched points are reconstructed. Finally, by smoothening the displacement field data and visualizing the deformation information, a non-contact full-field strain measurement can be carried out quickly, accurately, and in real-time. The strain measurement range of the DIC equipment used in our study is 0.005% - 2000%, and the spatial 3 D deformation can be measured.
Test procedure
The test layout of the uniaxial and biaxial central tearing tests is shown in Table 1. The initial macro crack length 2a is selected to be approximately 5, 10 and 20 mm in the uniaxial tests and 20, 40 mm in the biaxial tests. However, as the yarns bear most of the applied load, the number of yarns is used instead of the usual international unit length to avoid damage to the yarn during specimen preparation, to ensure the stability of the tearing tests. Upon referring to relevant literature on PVC fabrics [16] we could find that the mechanical behavior of central tearing specimens are mainly affected by “equivalent crack length”. This essentially denotes the number of cutting-off yarns in the direction perpendicular to the crack propagation, represented by nc in this article. Thus, the macro crack length 2a would be replaced by nc in the following part. In this way, the warp specimen in the uniaxial central tearing test could be represented by warp-θ-nc, and the weft specimen by weft-θ-nc. In the biaxial central tearing test, the warp to weft load ratio maintained throughout the loading process can be written as m:n; therefore, the biaxial specimen can be represented by m:n-θ- nc.
Layout of central tearing tests.

Environmental conditions
All tests are conducted at a temperature of 20 ± 2.0 °C and a relative humidity of 65 ± 3.0% according to DG/TJ08-2019-2007 [27].
Uniaxial tearing analysis
Tearing process
Taking the specimens warp-0-6 and warp-60-6 as examples, the tearing process can be roughly divided into three stages: Initial loading stage: the yarns in the drawing direction began to be stretched gradually from crimp to straight as the external load is applied, and the shape of the crack changed from an initial closed state to an ellipse, as shown in Figure 3(a) and (b). Tearing process of warp-0-6 in (a) original stage (b) initial loading stage (c) del-zone formation stage, (d) crack propagation and failure stage, and warp-60-6 in (e) original stage and (f) initial loading stage (g) del-zone formation stage, and (h) crack propagation and failure stage. Del-zone formation stage: With the increase in load, the warp yarns near the crack tip start slipping across the transverse yarns and stripping from the coating. In this manner, an approximately triangle-shaped area called the del-zone is formed, as shown in Figure 3(c). A further increase in the load would lead to more yarns participating in the del-zone. The crack propagation and failure stage: the crack starts to propagate when the strain of the warp yarn closest to the crack in the del-zone climbs to its elongation at the breakage. After that, the specimens exhibited two main failure modes. When less yarns are cut off, the crack propagates rapidly after the first yarn breaks, and leads to an instantaneous overall failure of the specimen. The corresponding stress-displacement curve shows almost no descending section. We defined this failure mode as brutal failure mode (represented by “B” in the following article). As more yarns are cut off, the tear propagation occurs alternately at both tips of the crack and new del-zones are formed continuously. Therefore, the specimen can continue to bear external load, and the stress-displacement curve shows a long descending section with a zigzag fluctuation, and this mode is defined as progressive failure mode (represented by “P” in the following article).
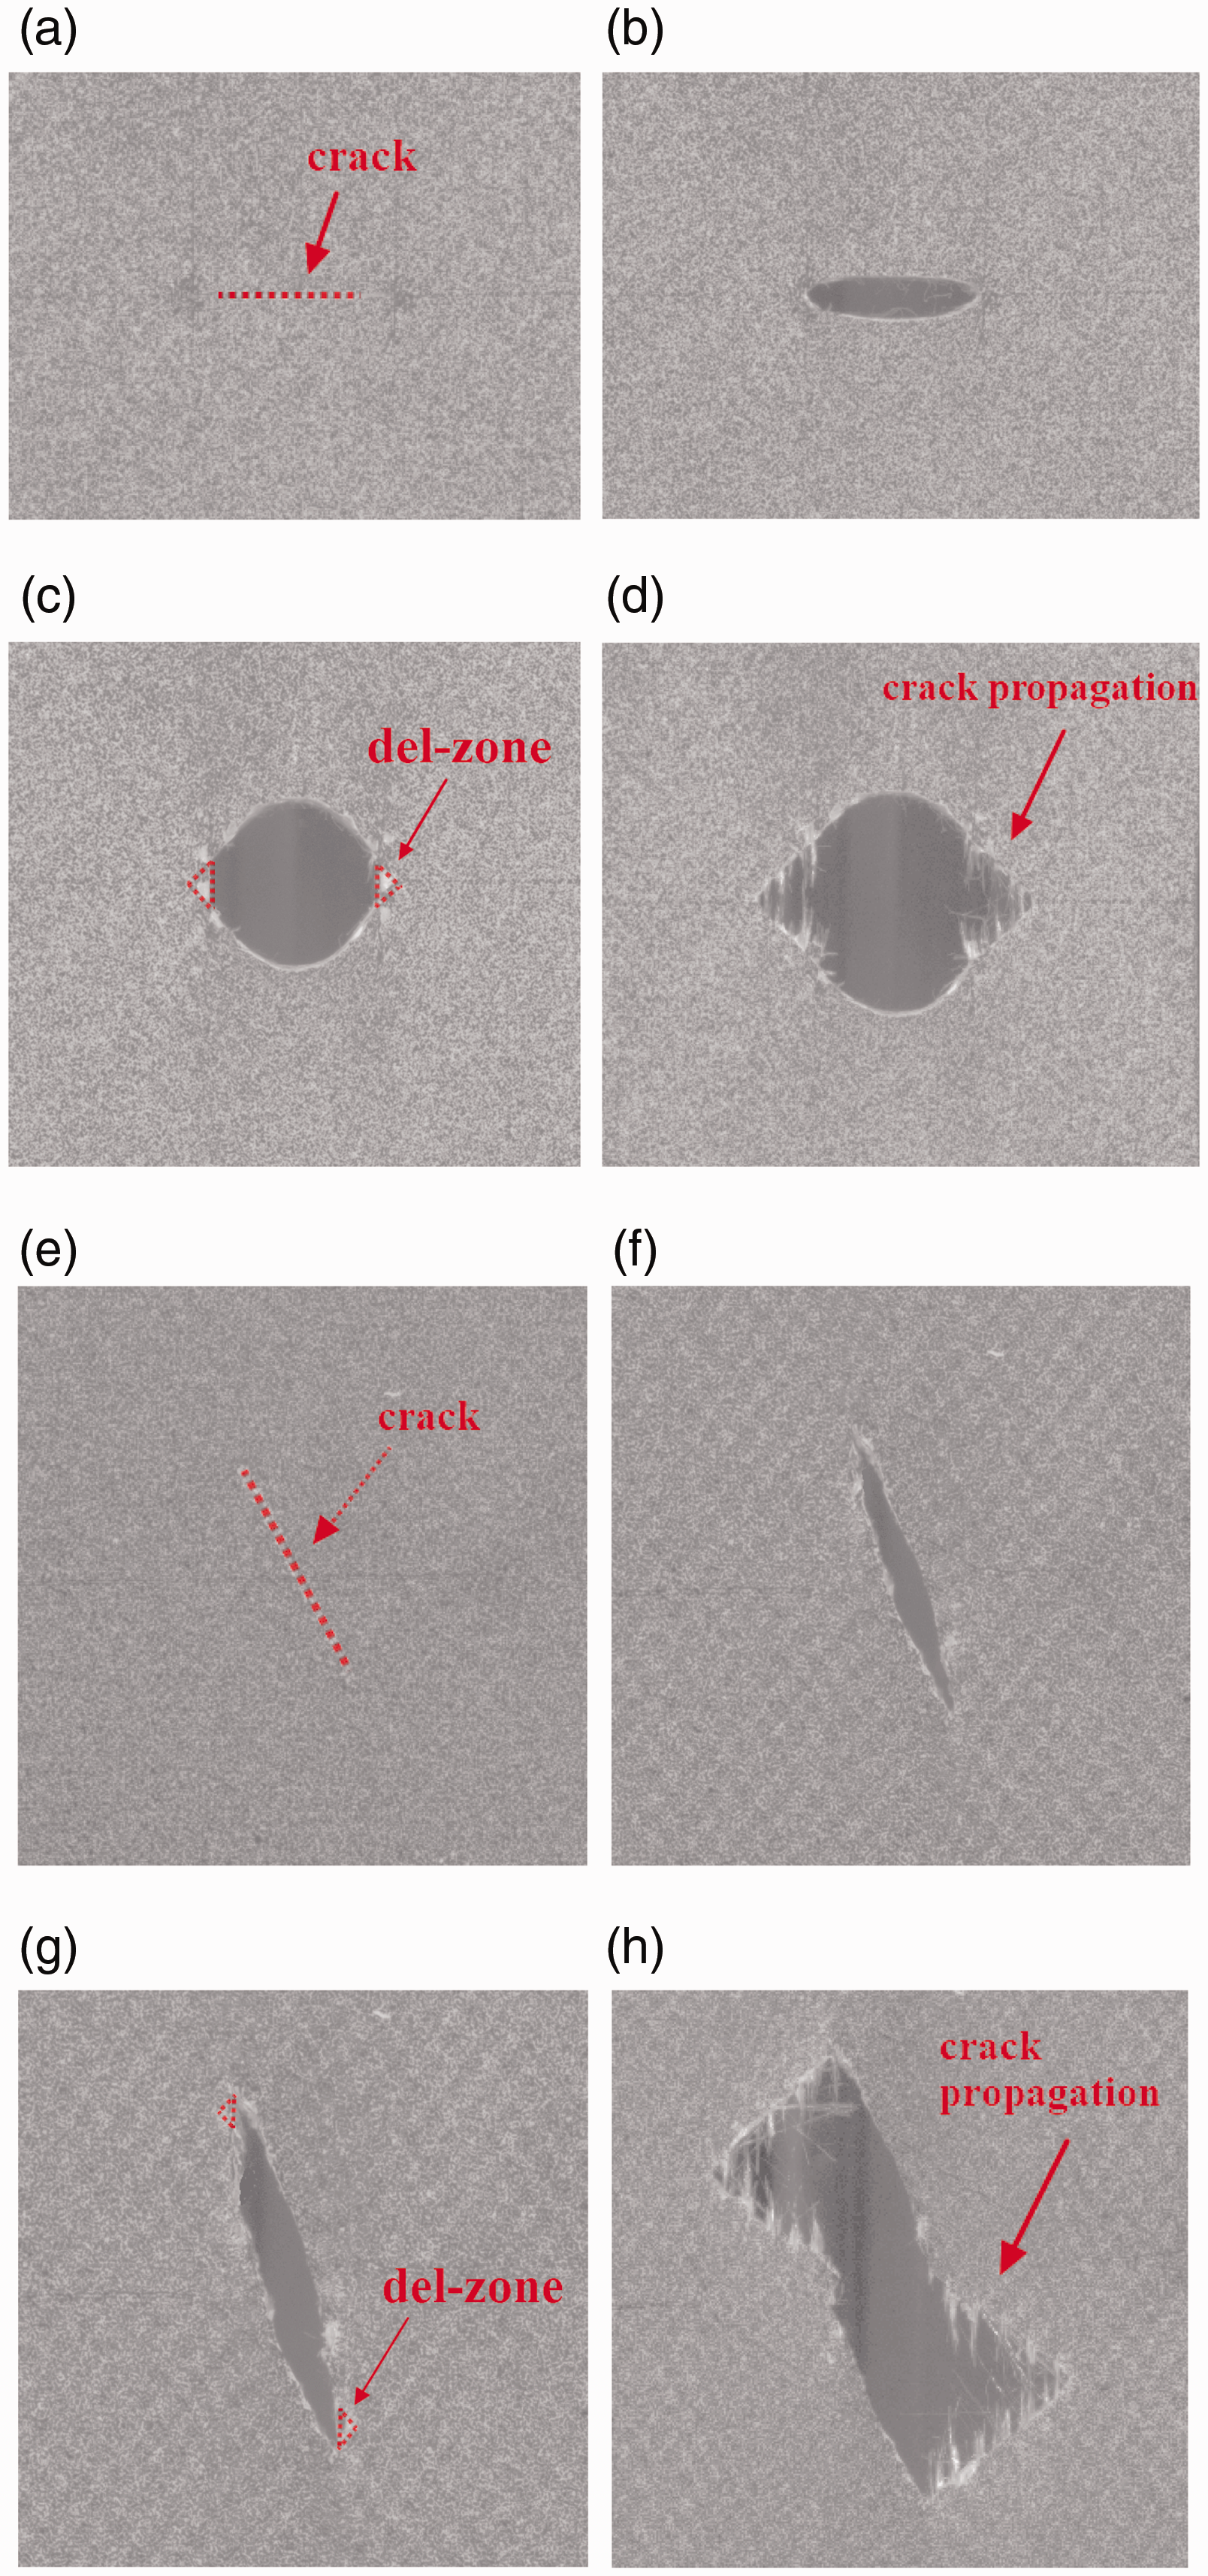
From the tearing behavior of warp-60-6 (Figure 3(e) to (h)), we can find that regardless of the initial crack orientation, the direction of evolution of del-zone and crack propagation are always perpendicular to the direction of the external load. Upon combining with Figure 4, it can be concluded that the stress, which is defined as the external load divided by the initial width of the specimen to eliminate the effect of specimen size, at the moment the crack propagation is almost equal to the peak stress the specimen can bear. Therefore, we noted this threshold stress at the beginning of the propagation of crack, as the tearing strength of the uniaxial central tearing.
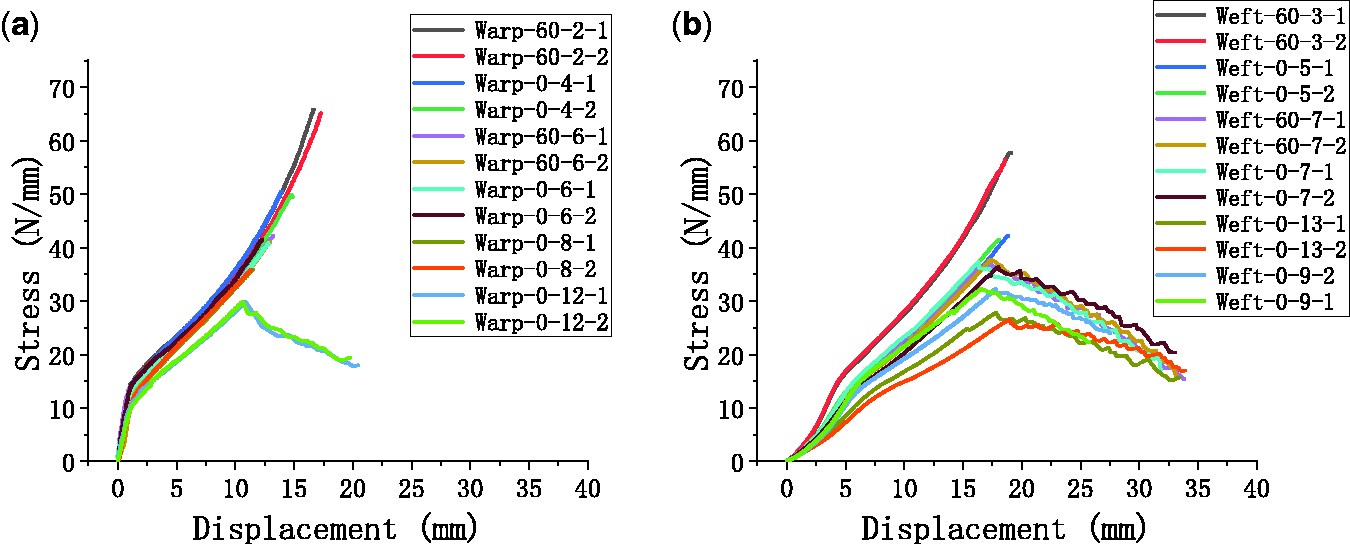
Stress–displacement curves of uniaxial central tearing tests in (a) warp specimens and (b) weft specimens.
Influence of the number of cutting-off yarns
The results of the uniaxial central tearing tests are summarized in Table 2, and the measured stress-displacement curves are shown in in Figure 4. First, we found that, although warp-60-6 and warp-0-6 have different cutting-off yarns in the weft direction owing to their different crack orientations, their tearing strengths are very close and share the same failure mode, as they have the same value of nc. A similar phenomenon can be observed in the comparison between weft-60-7 and weft-0-7. In conclusion, we can replace the two variables of initial crack length 2a and initial crack orientation θ with only one variable nc or an equivalent crack length mentioned in previous paper [16]. Second, it is obvious that the tearing strength of the coated fabrics decreased greatly with the existence of nc. For example, for specimen warp-0-12, there are 27.3% warp yarns being cut, while the tensile strength decreased by 71%, and the strength of weft-0-13 also decreased by the same extent. The unnoticeable cracks could lead to a sharp decrease in the material strength, and enough attention should be given to the capacity of fabrics to resist tearing.
Test results of uniaxial central tearing tests.

However, as compared with warp specimens, Figure 4 illustrates that as more and more yarns are cut off, the stiffness of weft specimens decreases more prominently. The stress-displacement curves of warp specimens with 2, 4, 6 and 8 cutting-off yarns almost coincide with each other and show typical features of brutal failure, while the curve of warp-0-12 is obviously different having a lower stiffness with a long descending section that represents progressive failure. For the weft specimens, the slopes of the curve decrease by varying degrees when 3, 5, 7, 9 and 13 yarns are cut off, and the failure mode changes from brutal to progressive when the cutting-off number ranges from 5 to 7.
Figure 5 shows that the tearing strength of warp and weft specimens declines nonlinearly as the number of cutting-off yarns increases. As the total yarn count in the width range is 44 in warp specimens and 45 in weft specimens, warp-0-4 and weft-0-5 have the same number of intact yarns, and this correspondence is also valid for other specimens. Therefore, the tearing behaviors of warp and weft specimens can be compared under such conditions. From Figure 5, we can observe that when the number of intact yarns is the same, the tearing strength of warp specimens is higher than that of the weft specimens. However, as the intact yarns decrease, this difference becomes increasingly insignificant because when more yarns are cut, it is increasingly difficult for the warp yarns to exert their load-carrying advantages, which would be explained further in the next section.

Relationship between tearing strength and the number of intact yarns.
Strain field distribution across the crack section
The strain value of every yarn across the crack section before and at the moment of tear propagation can be obtained based on the photos taken by DIC equipment by marking the position of all yarns on the surface of the uniaxial central tearing specimens. The first yarn in the del-zone breaks in a moment; therefore, to minimize the error caused by shooting, the equipment is set to take photos at a larger frequency of 10 photos per second, when approaching the propagation, while the shooting frequency is 1 photo per 5 seconds at the beginning to reduce the cost of software calculation and processing. We chose the last picture before the first yarn breakage as the moment of tear propagation to study to avoid the consideration of dynamics because yarn breakage is an abrupt process with high speed, which inevitably contains dynamic effects. Subsequently, the strain value is substituted into the load–strain curve of a single yarn in Figure 1 to obtain the load borne by each yarn. In addition, the total load F of all yarns across the crack section can be calculated according to the following formula in Figure 6, where n represents the total number of intact yarns in this cross section. The flowchart is shown in Figure 6. We selected three representative crack lengths from the warp and weft specimens for research. The comparison between the calculated total load F and the experimental values at the moment of crack propagation is listed in Table 3, from which we can find that the deviations are very small, all within 5%. To some extent, it can be concluded that the strain distribution obtained by the DIC equipment is very close to the actual situation, thus proving the rationality of this method.

The flowchart of calculation of load borne by yarns.
Comparison between the calculated and test load.

Figure 7 shows the distribution of yarn strain on warp-0-6 and weft-0-7 when the external load is 1/3, 2/3 and full tearing strength, respectively; therefore, we can clearly understand the evolution of the strain field during the entire tearing process. The results revealed that the strain began to concentrate in the del-zone as soon as the specimen is stretched, and the strain dropped rapidly, when away from the crack tip. With the increase in load, the strain distribution across the crack section became increasingly uneven, which means that the difference between the strains in the del-zone and in a distance tends to be obvious. Figure 8 displays the strain of all yarns in the warp and weft specimens with different values of nc at the moment of propagation. It can be observed that, no matter how many yarns are cut off, the crack starts to propagate when the strain of the first yarn closest to the crack tip reaches the breaking strain of the yarn, that is 0.235 for warp yarn and 0.285 for weft yarn, while the strain in the distant yarns varies significantly as the values of nc changes. Specifically, the more the yarns are cut off, the smaller the strain in the distant yarns. In other words, it is more difficult for specimens to bear an external load. In addition, the strain of weft specimens is generally larger than that of warp specimens.
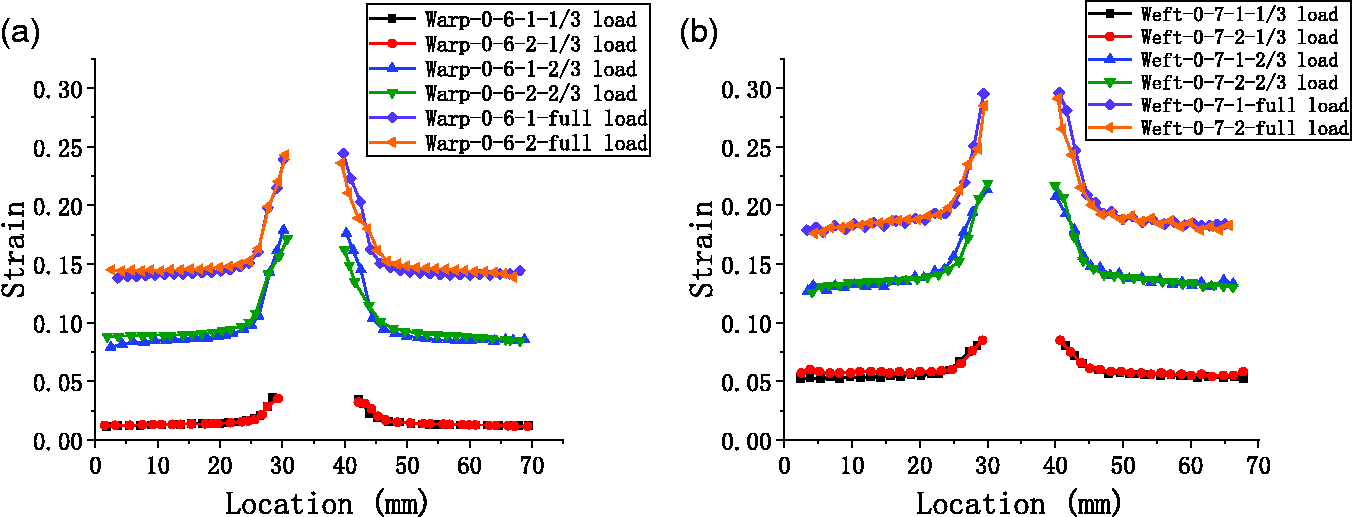
Strain distributions under different external loads in (a) warp specimens and (b) weft specimens.

Influence of cutting off yarns on strain distributions in (a) warp specimens and (b) weft specimens.
In Figure 9, the load borne by each yarn across the crack section based on the strain field is calculated. When the number of intact yarns is the same, the strain value across the crack section in weft specimens is generally higher than that in warp specimens. However, the tearing strength of warp specimens is higher than that of the weft specimens, as the corresponding relationship between the strain and load is different for warp and weft yarns, as shown in Figure 1. The smaller strain in the warp yarn often corresponds to a higher load level. However, within a certain range, the above difference in the uniaxial tensile properties between the warp and weft directions tends to decrease at the low strain level. This explains the cause of the phenomenon where with the increase in nc, the difference in the tearing strength becomes less significant in warp and weft uniaxial tearing tests.

Load distributions in (a) warp specimens and (b) weft specimens.
Theoretical simulations
In the past several decades, numerous scholars have tried to put forward a reasonable theoretical model to predict the tearing strength of coated fabrics in order to avoid endless experiments to simulate every situation in practical use. Among them, the stress field consideration method, Thiele’s empirical formula, stress intensity factor theory, and Hedgepeth stress concentration factor theory are widely accepted fracture theory models used for the coated fabrics. In order to demonstrate the applicability of these fracture models to this PVC membrane, they are tried as follows. In the following section, tearing strength and ultimate tensile strength are represented as σc and σult, respectively.
The stress field consideration assumes that the stress field near the crack tip is exponentially distributed. Therefore, we can obtain the tearing strength σc, represented by the ultimate tensile strength σult by integral operation, as follows [17]:
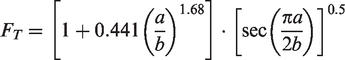
The general expression of Thiele’s empirical formula for a flat specimen can be written as follows, in which the bulge effect can be ignored as the curvature is infinite for flat specimens [17]:
The stress intensity factor theory is based on linear elastic fracture mechanics and is proposed as a parameter to effectively characterize the stress field strength near the crack tip; therefore, the trouble caused by stress singularity at the crack tip can be avoided. The theory states that when the stress intensity factor KI reaches the fracture toughness KIC of materials, cracks begin to propagate. Therefore, the tearing strength σc can be obtained by [29]
Hedgepeth proposed a new calculation model from the mesoscopic point of view, assuming that the matrix bears all the shear load, and the yarns are discretized, resulting in the formula of stress concentration factor Ф(m) at the crack tip, which can be written as follows [5]:

Based on the above theories, the relationship between the equivalent initial crack length and tearing strength can be plotted in Figure 10. By comparing the results with the test results, we can evaluate the applicability of each theory to predict the tearing strength of this coated fabric.

Comparisons between theoretical simulations and test results in (a) warp specimens; (b) weft specimens.
From Figure 10, we can observe that when equivalent initial crack length is small, the results of the above four theories in warp and weft specimens are all close to test results, except for Hedgepeth’s theory in the weft specimen. However, the deviation emerges when the equivalent initial crack length increases. The proximity of fitting in the weft specimens is better than that in the warp specimens. Among these four theories, Thiele’s empirical formula agrees best with the experimental data and almost completely fits in. The deviation of Hedgepeth’s stress concentration factor theory mainly comes from the assumption that the material is a linear elastic material, neglecting its nonlinear properties, and the obtained concentration factor has nothing to do with the material properties. The fitting results with the stress intensity factor theory are slightly closer to the test data than those obtained with the method of stress field concentration when the slit width is increasing. This might due to the consideration of the width correction parameter in the former case, although their theoretical values are both less than the test results. In conclusion, Thiele’s empirical formula is the most suitable theory for predicting the tearing strength of this PVC fabric.
Biaxial tearing analysis
Tearing process
There are many similarities in tearing characteristics between the uniaxial and biaxial central tearing tests. Taking 1:1-0-26 and 1:1-60-21 as examples to describe tearing failure of biaxial specimens in Figure 11, the entire process can also be roughly divided into three stages. First, the crack also develops into an ellipse shape from the initial closed state, as displayed in Figure 11(a) and (b). Then, the two del-zones form at both tips of the crack, as shown in Figure 11(c). Finally, when the first yarn closest to the crack tip reaches the elongation at breakage, the crack begins to propagate. The external stress obtained by dividing the load by the initial width of the intermediate membrane surface (i.e., 160 mm) at the moment of crack propagation is almost equal to the peak stress during the entire process. We also consider the critical stress that causes the crack to expand as the tearing strength in biaxial specimens. The test results of all biaxial specimens are listed in Table 4. From Figure 11(e) and (f) and Table 4, we can conclude that the propagation direction is always parallel to warp or weft yarns, and the failure modes also include brutal and progressive failures. In the following section, for ease of expression, we denote the biaxial central tearing specimens with cracks propagation along warp direction as “warp direction specimens”, and cracks propagation along weft direction as “weft direction specimens”. Despite many similarities, the biaxial central tearing tests seem to be more complicated than uniaxial ones. For example, the direction of propagation and the failure modes in biaxial tests are affected by multiple factors, such as load ratio, and the tearing strength in both directions interact with each other. The marking points are made on both sides of the cracks on the surface of the cross-shaped specimens at a distance of 4 cm from the center point, denoted by points A, B, C, and D, in Figure 11. During the tearing process, the relative displacements of A and B in the warp direction, and C and D in weft direction are measured by the DIC equipment, and the stress-displacement curves in two directions can be drawn after the external loads in corresponding directions are obtained, respectively.
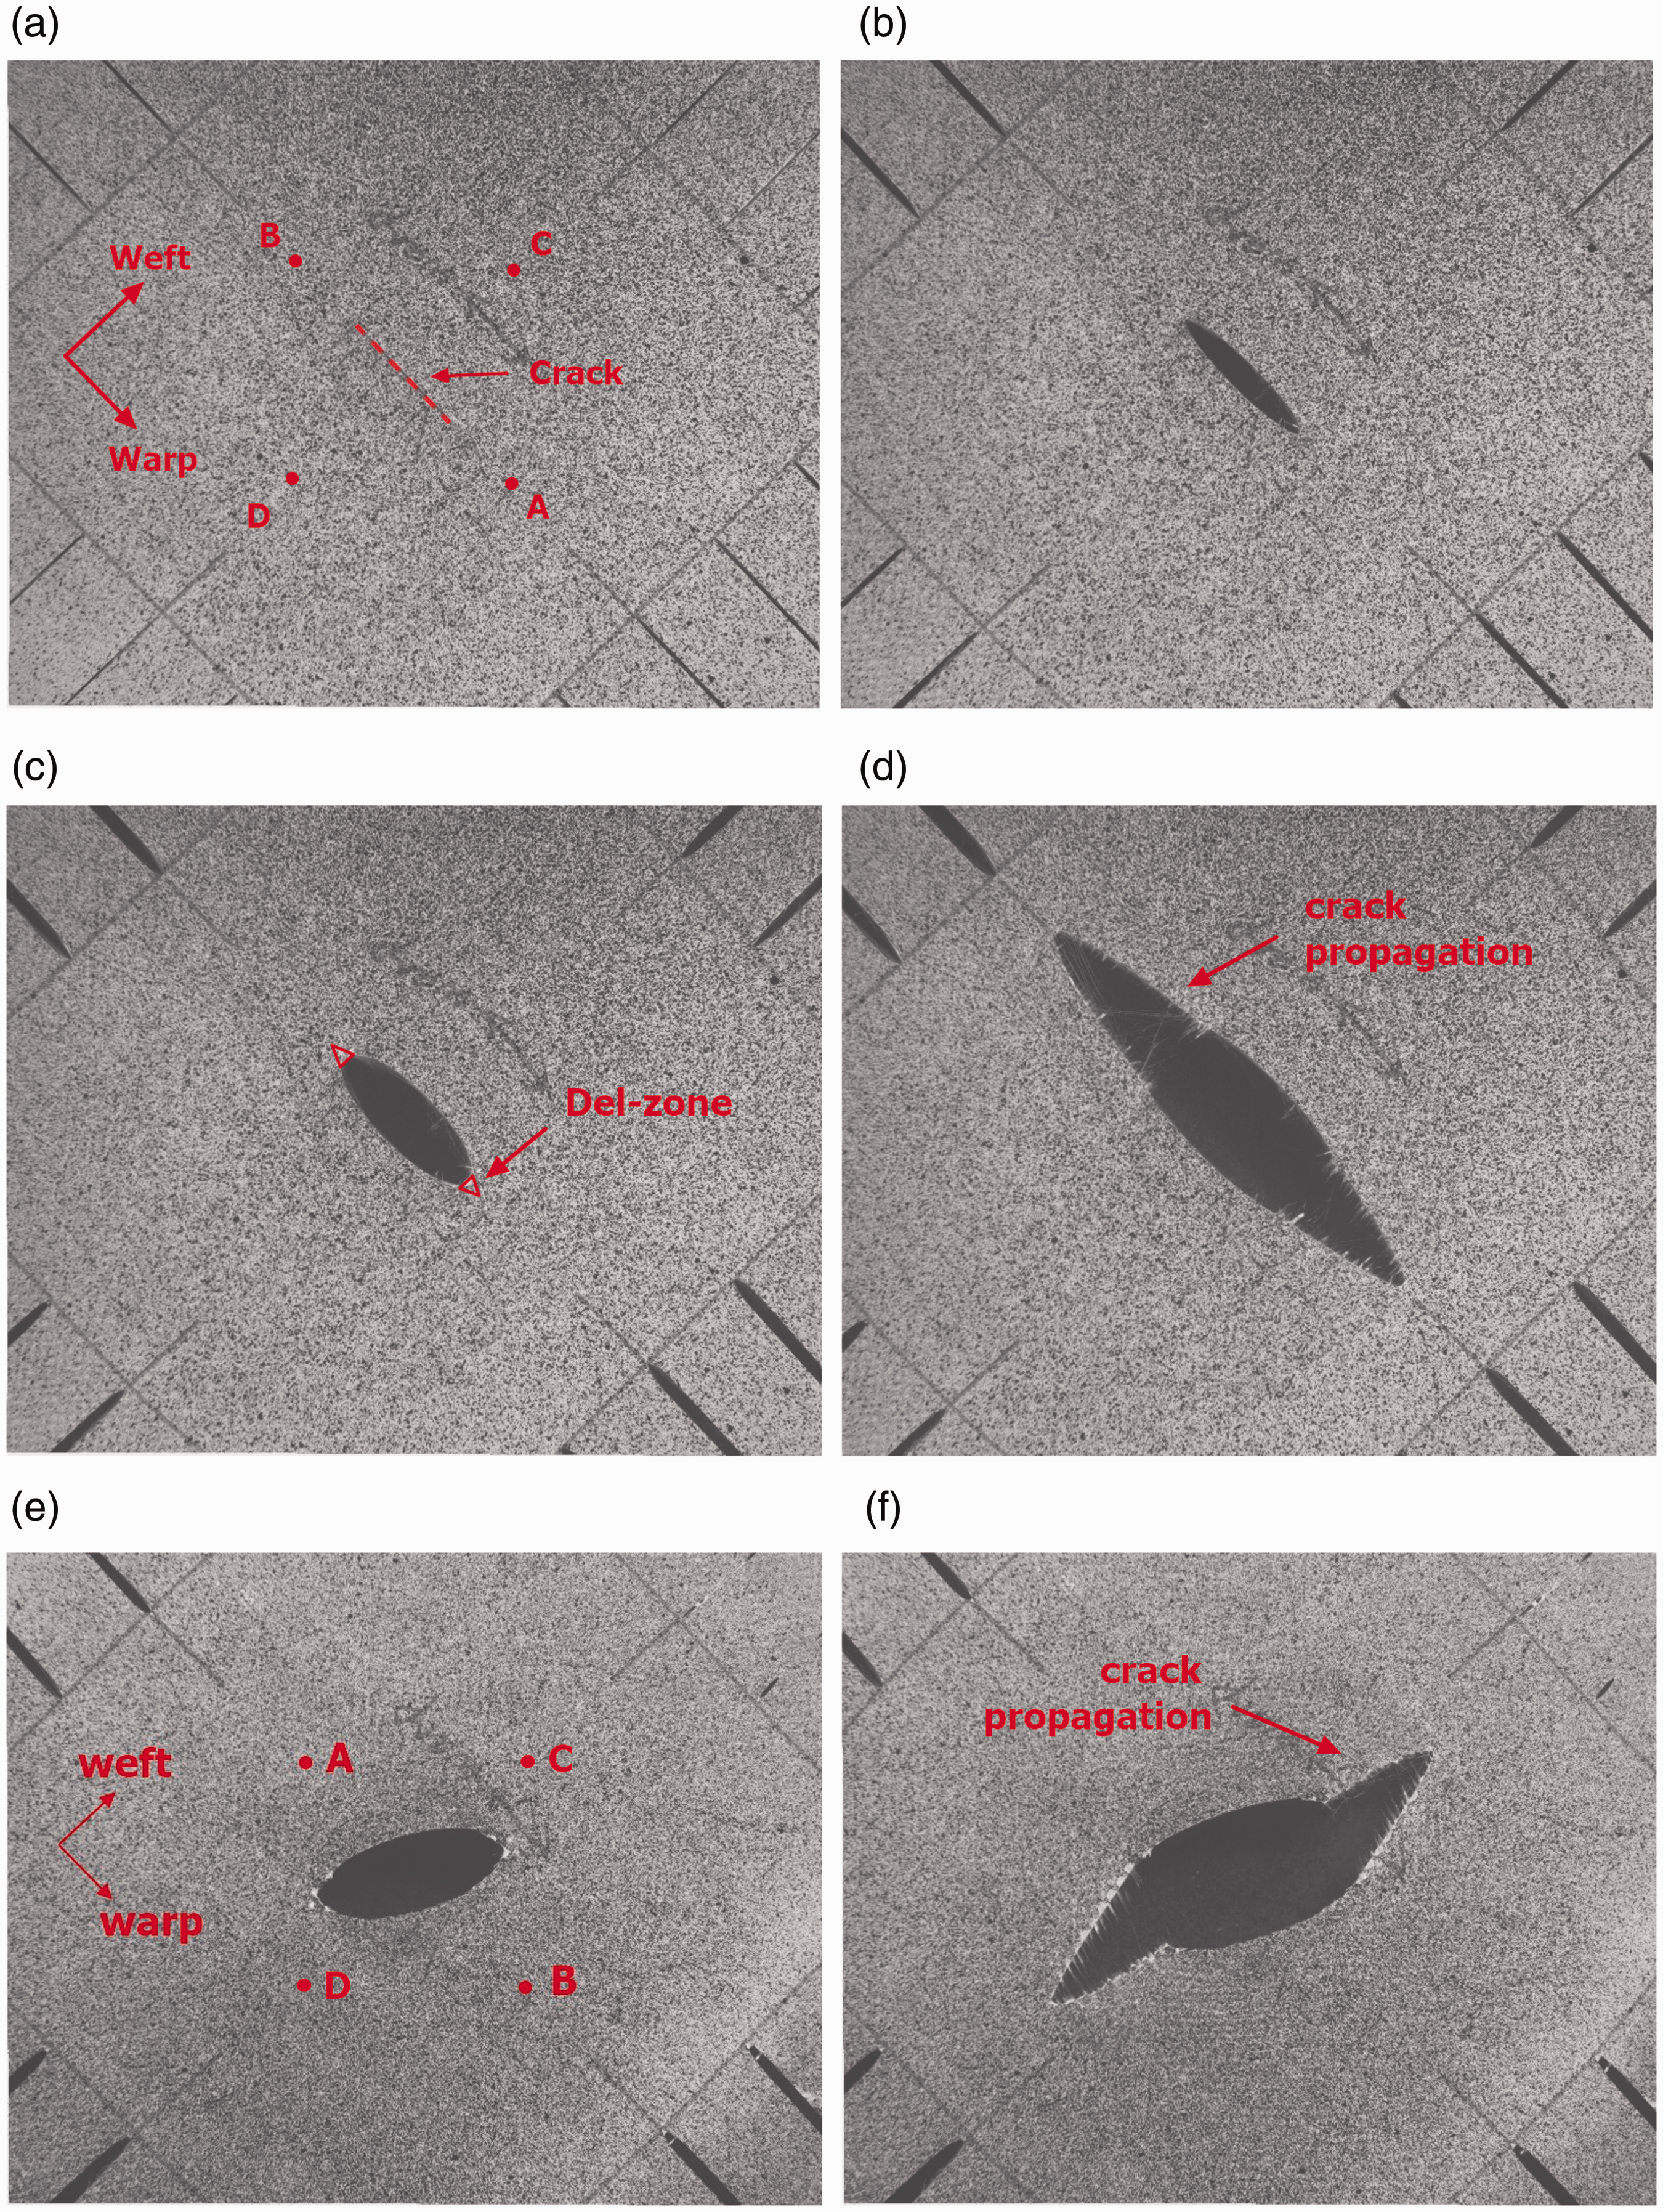
Tearing process of 1:1-0-26 in (a) original stage, (b) initial loading stage, (c) del-zone formation stage, (d) crack propagation and failure stage, and of 1:1-60-21 in (e) original stage and (f) crack propagation and failure stage.
Results of biaxial central tearing tests.

Load ratio influence
From Table 4, we can observe that regardless of the load ratio, the crack propagates along the warp direction as long as the initial crack orientation is less than 45°. The crack develops along the weft direction when the crack orientation is greater than 45°. However, there are two special cases, 2:1-0 and 1:2-90, in which the load perpendicular to crack propagation is always half the value of that of another direction during the entire tearing process. Therefore, with the increase in external load, the yarns parallel to the crack propagation would reach their tensile strength first, leading to the occurrence of fracture at the root of the extended arm (see Figure 2(b)), while the load in the other direction is still under the critical tearing load for stimulating crack propagation. The failure of these specimens, which can be considered invalid, is attributed to the tensile fracture of the yarns rather than the tearing of the prefabricated cracks. When the initial crack orientation equals 45°, the direction of tearing extension is determined by the load ratio. Specifically, as we observed in Table 4, when the load ratio is 1:1 and 1:2, the 45° crack propagates along the warp direction; however, when the load ratio is 2:1, the crack tends to extend along the weft direction. The failure modes, progressive or brutal, are not affected by the load ratio.
From the stress-displacement curves shown in Figure 12, it can be observed that for specimens m:n-0-nc, the load ratio has limited influence on the slope of the curves, which represents the stiffness of the material, in the direction perpendicular to crack propagation. For specimens m:n-90-nc, when the load ratio changes from 1:1 to 2:1, the slope of the curves in the direction perpendicular to the crack propagation decreases slightly. And Figure 12 shows that an increase in the load parallel to the direction of crack propagation can improve the tear resistance of this fabric, especially when the amount of cutting-off yarns is small. For example, the tearing strength of specimens 1:1-0-13 is 12.44% higher than that of the specimen 1:2-0-13, while compared with specimen 1:2-0-25, the tearing strength of specimen 1:1-0-25 is improved by 3.43%. Similar conclusions can be drawn for specimens with a 90° crack orientation. The warp-0-12 and weft-0-13 of the front uniaxial central tearing specimens can be considered as special biaxial central tearing specimens with load ratios of 1:0 and 0:1, respectively. From Tables 2 and 4, we can observe that the tearing strength of 1:1-0-13 of the biaxial specimen is significantly increased by 48.32%, as compared with weft-0-13 of the uniaxial specimen, and the increase is 46.05% from the uniaxial specimen warp-0-12 to biaxial one 1:1-90-12.

Load ratio influence on stress–displacement curves of specimens (a) m:n-0-13 (b) m:n-0-25 (c) m:n-90-12 (d) m:n-90-24.
Influence of the number of cutting-off yarns
Based on the test results of specimens 1:1-0-13 and 1:1-45-13 in Table 4, we can draw the conclusion that the tearing strength of biaxial specimens is mainly determined by the number of cutting-off yarns perpendicular to crack propagation nc, while the yarns in another load direction have little effect on tearing resistance. Therefore, this proves to some extent that the concepts of crack orientation and crack length can also be replaced by nc in biaxial central tearing specimens.
The stress–displacement curves in the warp direction of weft direction specimens and the curves in the weft direction of warp direction specimens are displayed in Figure 13. It is obvious that with the increase in nc, the slope of the curves, which represent the stiffness of the material, and the tearing strength decrease gradually. For weft direction specimens, when nc increased from 12 to 22, the tearing failure modes changed from brutal to progressive, while for warp direction specimens, the transition threshold is between 13 and 19.

Stress–displacement curves in the direction perpendicular to the crack propagation path in (a) weft direction specimens and (b) warp direction specimens.
In the central region of biaxial specimens, there are 102 and 103 yarns in total in the warp and weft directions, respectively; therefore, warp direction specimens 1:1-0-13 and weft direction specimen 1:1-90-12 have the same number of intact yarns, and their tearing behaviors can be compared under such conditions. In this manner, the relationship curves between tearing strength and the number of intact yarns in the warp and weft direction specimens under a load ratio of 1:1 are plotted in Figure 14, which shows that the tearing strength decreases nonlinearly, as the number of intact yarns decreases. When the number of intact yarns is the same, the tearing resistance of weft direction specimens is better than that of the warp direction specimens. However, similar to the uniaxial central tearing tests, with the increase in nc, the gap tends to get narrower.

Relationship curves between tearing strength and number of intact yarns at a load ratio of 1:1.
Strain field distribution across the crack section
Similarly, the strain distribution of yarns across the crack section at the moment of propagation is obtained using the DIC equipment. Figure 15 displays the strain of yarns when different external loads are applied to 1:1-0-13 and 1:1-90-12 specimens during the tearing process. The strain in the del-zone is obviously higher than the distance from the beginning of loading to the end of tearing failure. The strain fields of specimens with different numbers of cutting-off yarns are shown in Figure 16. It can be observed that no matter how many yarns are cut off, when the crack is about to extend, the strain of the first yarn at the crack tip of the warp and weft direction specimens is close to the break strain of weft and warp yarn under uniaxial tension, i.e., 0.285 and 0.235, respectively. This phenomenon denotes that the part of the first yarn at the crack tip may be subjected to uniaxial tension owing to the existence of cracks, although the external load is bidirectional. The load-carrying capacity of yarns far from the crack is difficult to exert due to its low strain state, and the most marginal yarn in the central region is affected by the extension arm to have a small range of strain fluctuations. The strain fields in warp direction specimens are higher than those in the weft ones, when they have the same number of intact yarns. Finally, the influence of the load ratio on the strain distribution is discussed in Figure 17. Obviously, the yarns under a 1:1 load ratio generally have higher strain than the other cases. This phenomenon further indicates that the load parallel to the direction of crack propagation tends to make the strain distribution across the crack section more uniform, resulting in further improvement of tear resistance for this fabric.

Strain distributions under different external loads in specimens (a) 1:1-0-13 and (b) 1:1-90-12.

Influence of cutting off yarns on strain distribution in (a) warp direction specimens and (b) weft direction specimens.

Influence of load ratio on strain distributions in specimens (a) m:n-0-13 and (b) m:n-90-12.
Conclusions
In this study, the tearing behavior of a PVC coated polyester fiber membrane material was studied systematically based on the uniaxial and biaxial central tearing tests. By marking the yarn position on the membrane surface and using the DIC equipment, the strain and displacement fields during the entire tearing process were obtained. The conclusions based on the analysis of these test results were as follows: We can replace the two variables of initial crack length 2a and initial crack orientation θ with only one variable, which was the number of cutting-off yarns perpendicular to the direction of crack propagation nc, while the cutting-off yarns parallel to the crack extension had little effect on the tearing strength and failure modes of both uniaxial and biaxial central tearing specimens. Regardless of the initial crack orientation, the direction of evolution of del-zone and tearing propagation were always parallel to warp or weft yarns. Upon comparison with uniaxial central tearing specimens, in which the propagation direction was perpendicular to the external load, the tearing extension was found to be more complicated in biaxial specimens owing to the influence of the load ratio. When nc exceeded the critical value, the failure mode of uniaxial and biaxial tests changed from brutal to progressive. For both the uniaxial and biaxial central tearing tests, the tearing strength of specimens declined nonlinearly as the value of nc increased. When the number of intact yarns is the same, the tearing strength of warp specimens was higher than that of the weft specimens in uniaxial tests, and the weft direction specimens were better in tearing resistance than warp direction specimens in biaxial tests. However, when nc value increased, the difference was less significant in both tests. From the strain distribution across the crack section, we concluded that the strain of yarns in the del-zone was higher than the distance from the beginning of loading to the end of tearing failure. With an increase in the external load, the non-uniformity of the strain field was increasingly obvious. At the moment of crack propagation, the strain of the first yarn at the crack tip was close to the breaking strain of the warp or weft yarn. The strain field was greatly affected by nc; specifically, as nc increased. It was more difficult for the distant yarns to exert their load-carrying capacity, and the lower the tearing strength of the specimens. When the number of intact yarns was the same, the yarn strain in the weft direction was generally higher than that of the warp direction. Thiele’s empirical formula is the most suitable theory to predict the tearing strength in uniaxial central tearing specimens for this PVC coated fabric.
This study involved a type of PVC coated fabric. Further research is required to determine whether the related analytical methods and conclusions could be applied to other membrane materials, such as PTFE. At the same time, considering that there were some differences between the tear properties of uniaxial and biaxial central tearing. The kind of theoretical model, which is suitable for application to the biaxial case would be discussed in the future.
Footnotes
Declaration of conflicting interests
The author(s) declared no potential conflicts of interest with respect to the research, authorship, and/or publication of this article.
Funding
The author(s) disclosed receipt of the following financial support for the research, authorship, and/or publication of this article: This work was funded by the National Science Foundation of China through research project No. 51778458.