
Abstract
Product development teams frequently develop many prototypes for screening before launching into the marketplace. Gaining customer feedback on each prototype is impossible because of constraints, such as tight timelines, budget, etc. For innovation in facial cleansing/makeup remover wipes, a design of experiments study was conducted to help the team optimize the product based on consumer feedback of prototypes. A predictive model based on consumer results and in vitro lab measurements for the makeup remover wipes was developed that could aid in future reformulation efforts of the textile base as well as the “juice” or lotion add-on. A consumer design of experiments study was conducted on 18 prototypes to help optimize the variables. Makeup remover wipe users and wipe considerers (n = 963) from the United States and the United Kingdom participated in the study. In vitro lab measurements were also conducted on the same 18 prototypes covering relevant attributes. Partial least square regression was applied with a cross-validation procedure to build a predictive model between the in vitro and consumer research results. Scatter plots between consumer and in vitro lab results showed good directional trends between consumer perception and lab method on cleansing properties, softness, and gentleness. Model equations were developed for those measures. Future validation is needed prior to implementation. The validated model will enable use of in vitro results to predict consumer ratings for prototype screening. The predictive model can provide a quick and efficient way for facial cleansing/makeup remover wipe prototype screening, which will conserve resources and improve efficiency for the business.
Introduction
Product development teams develop many prototypes that must be screened before selecting one or more products to launch in the marketplace. Although it may be useful to gain customer feedback on each prototype, it is unrealistic to conduct consumer research on each prototype. Consumer studies can be difficult when the amount of each prototype is limited, and because the research can be both costly and time consuming to conduct. Laboratory measurements usually are easier and quicker and may take far less product prototype for testing. Thus, building a model of consumer behavior (i.e. purchase intent) versus laboratory measures can allow the research team to conduct other measurements, such as instrumental or descriptive sensory measures to predict consumer perception.
Various authors have developed models to describe the relationship of physical or chemical parameters to sensory phenomena of specialty textiles. For example, the sensory sound properties of aspects such as pleasantness for wool suiting fabrics can be predicted using physical (mechanical) properties such as tensile strength, surface properties, and shear [1]. Sensory properties, such as softness, stiffness, and stretch of wool fabrics were predicted by physical measures from fabric assurance by simple testing (FAST) [2]. The comfort of fabrics for military uniforms has been related to sensory and Kawabata measures [3].
Different statistical modeling techniques have been used to link consumer perception data to descriptive analysis results, instrumental measurements, or both, in the sensory and consumer research field for both food and nonfood categories [4–6]. For example, the comfort of functional fabrics has been assessed and related to sensory properties [7]. The techniques used most often include multiple linear regression (MLR), principal component regression (PCR), and partial least square (PLS). These regression methods work well for variables that have a linear nature [8]. PCR and PLS have been found to show advantage over MLR in handling highly correlated explanatory variables (X-data) [9] and also when there are more explanatory variables than object variables.
Preference mapping, which includes internal preference mapping (IPM), multidimensional preference mapping (DMPref), or external preference mapping (EMP or PrefMap), is one of the most popular mapping approaches applied in the sensory and consumer research field [10–12]. Internal (MDPREF) and external (PrefMAP) preference mapping are based on the PCR method that uses consumer preference and descriptive analysis data. The internal preference mapping (MDPref) method was first proposed by Carroll [13]; it projects the product space based on the liking scores from the consumer study with sensory attributes regressed into this space to explain the differences in liking. External preference mapping (PREFMAP), first described by Schiffman et al. [14], uses a mapping space based on the descriptive sensory differences between the products and then regresses liking scores of each consumer on the PCA results through a vector, circular, elliptical, or quadratic model [15–17]. Care must be taken because the original data can be manipulated depending on the analysis method to provide various answers [18]. Additionally, the impact of the preference mapping on the product clusters must be taken into consideration [19].
Worth [20] proposed a new methodology called PrefMFA, which is based on multiple factor analysis (MFA). It is a method in between internal and external preference mapping and takes the dimensions from the “common” product space between external (usually descriptive analysis data) and the consumer hedonic scores in the individual regression. The PrefMFA methodology takes two data sets into consideration. Hierarchical multiple factor analysis (HMFA), which is an extension to PrefMFA, applies when more than one external matrix is available to be regressed [21]. For example, one external data set is descriptive analysis data and one external data set is instrumental measurement.
PLS or partial least square regression (PLSR) is another statistical regression method that has been used increasingly to link consumer data with laboratory data such as descriptive analysis data [22–25]. The PLS method extracts a few linear combinations (PLS components or latent variables) of the laboratory data that are used to predict the systematic variation in the consumer preference data. Helgesen et al. [22] described the difference between PrefMAP and PLS. For each component, PLS maximizes the covariance between a linear combination of the laboratory variables and a linear combination of the consumer preference variables. Therefore, it may potentially provide more consumer relevant components than the PrefMAP as PrefMAP is based on a PCR that does not account for latent variables. There are two common types of PLS techniques named PLS1 and PLS2. PLS1 works on one of two sets of data, usually a single column of scores. PLS2 works on both sets of data that are multidimensional in nature [26,27]. The advantage of PLS over PCR has been demonstrated through some simulated studies [28,29]. The PLS model was created to explain data based on both the explanatory variables (X-data) and dependent variables (Y-data). In contrast, the PCR model only uses the explanatory variables (X-data) as an independent data set. This requires more components, which complicates interpretation of the model and increases the risk of over-fitting [2].
In summary, PCR and PLS methods are better choices than MLR. However, due to their dependence on linear data, they do not sufficiently address non-linear data, common in laboratory and consumer liking data [30,31], so other options were explored by researchers.
Other techniques such as logistic regression work when the variables are not viewed as continuous. For example, the sensory properties of artificial leather were related to physical methods using logistic regression [32]. Artificial neural networks (ANNs) is an alternative statistical technique that works well with nonlinear data sets [23–34]. ANNs is regarded to be more intelligent than the traditional statistical regression methods due to its robustness to noise and inconsistencies in the data, and handling of complex data sets [35,36]. Krishnamurthy et al. [8] compared ANNs to conventional regression methods (MLR, PRC, PLS) by linking consumer liking data to laboratory measures for beef bouillon product evaluation. They concluded that those various statistical methods had similar results with ANNs with the primary advantage of ANN being a single model to predict consumer liking for different segments of consumers while conventional methods needed separate models for each cluster of consumers.
Building a predictive model between consumer and lab measurements has not been explored much in the textile and wipe product category. Kaplan et al. [37] conducted research to compare instrumental and subjective evaluation of wet wipes. For the objective evaluation, physical characteristics, such as thickness, weight, porosity, fiber orientation, etc. were measured. Subjective hand and wipe performance (feeling of softness, dampness, roughness, bending, etc.) was conducted using a five-point subjective rating scale (1 – do not feel at all to 5 – feeling completely) with 10 females who were wipe frequent users (ages falling between 25 and 40 years) in a clinical style study. Correlation analysis was conducted to understand the relationship between the instrumental and subjective measurements; however, no statistical regression model was developed in their research due to the different objectives of the research as well as limited data collected.
Koenig et al. [38] developed a rapid bench in vitro method to predict in vivo skin abrasion (friction) caused by wiping of dry tissue against skin. Those authors used the bench assay to measure coefficient of friction (CoF) and compared these results with clinical results measured on transepidermal water loss (TEWL) and laser scanning confocal microscopy (LSCM) images before and after wiping of the same dry tissue material. A moderate correlation was observed between the bench assay and the clinical results, therefore a rapid and inexpensive skin gentleness method for cleansing material was concluded. Their research also used in vitro measurements of cleansing wipes to correlate with in vitro gentleness and soft feel based on consumer measures. That research used correlation rather than regression to actually predict effects.
Based on the overview of the potential to use laboratory measures to predict consumer responses, the objective of this research was to aid in rapid prototype screening by building a predictive model between consumer perception and in vitro laboratory measurements for facial cleansing/makeup remover wipes using the PLS regression method.
Materials and method
Overview
A consumer design of experiments (DOE) study was conducted to gain consumers’ perception on 18 makeup remover wipe prototypes, which had combinations of four factors with different levels: formula, fabric thickness, fabric weight, and lotion add-on. The consumer DOE study was conducted in a home-use test (HUT) format. Six of 18 wipes were tested by each consumer in a balanced incomplete block design. One sample per week was tested. . A total of 962 consumers (502 from the United States and 462 from the United Kingdom) who met the user criteria of age range 18–35 (the primary makeup remover wipe user age range) and current wipe user or considerer completed the study. Approximately 320 consumers tested each wipe. The consumer home use study is explained in more detail in Xing et al. [34].
Lab in vitro measurements also were collected on the same 18 prototypes to understand specific properties of the makeup remover wipes. Based on the data collected from the consumer DOE study and in vitro lab measurements, a predictive model between some consumer perception attributes and lab instrumental measurements was explored using a PLS statistical regression model.
Consumer perception attributes
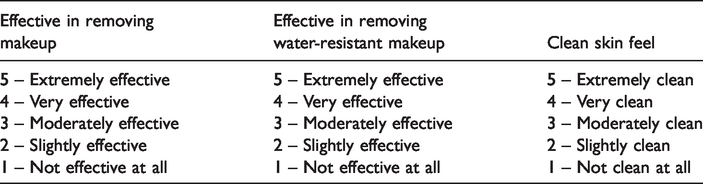
Although many attributes were tested [39], two sets of attributes had potential to build predictive models. One set of consumer attributes was related to cleansing/removing makeup, and the other set of attributes was related to the perception of gentleness/softens skin. The three attributes from the consumer study related to cleansing/removing were: “effective in removing makeup”, “effective in removing water-resistant makeup”, and “clean skin feel”. The two attributes from the consumer study related to gentleness/softens skin perception were: “gentleness of wipe (gentleness)” and “soft skin feel”. For the consumer attributes, a five-point scale was used in an online survey questionnaire after each week of use in home for each product tested. Tables 1 and 2 list the scale used for those attributes.
Five-point scale used for cleansing-related consumer attributes.
Five-point scale used for “gentleness/softness”-related consumer attributes.

In vitro lab measurements
For the in vitro lab measurements, the same 18 wipe prototypes were tested. The following attributes were measured during the test:
For some properties such as make-up removal, the products were used in vitro to remove three makeup products: (a) CoverGirl Lashblast Fusion Water-Resistant Mascara 885 Very Black, (b) L’Oréal Paris Infallible Never Fail Eyeliner 511 Black, and (c) Revlon Colorstay Foundation 450 Mocha. Those products represented long wearing/long lasting and water-resistant makeup products in each of the make-up product categories.
A controlled amount of each makeup product was manually applied onto a 1” diameter circle on a customized plastic skin-like substrate by a lab technician and allowed to set for 1 h at ambient temperature and humidity. The in vitro makeup removing procedure was conducted via a proprietary lab set-up developed by one of the industrial authors. The set-up functioned as follows: the tested wipe was wrapped onto a movable “sled” set to move back and forth. The sled with the wipe was moved against the plastic substrate to remove each makeup product at a controlled speed and pressure. An image was taken before makeup application, before makeup removal, and after each stroke. The images were analyzed using imaging technology to determine the amount of color change in the substrate. Based on that change, a percentage of each makeup product removed after a controlled number of strokes was calculated. “Mascara: Total Removal”, %; “Eyeliner: Total Removal”, %; and “Foundation: Total Removal”, % were the values obtained using the set-up.
Bending length (cm) measurement, which indicated the measurement of stiffness, followed ASTM D 1388-08 Standard Test Method for Stiffness of Fabrics. Friction was measured via a proprietary lab method which leveraged an Instron Universal Testing Machine (Instron Co., Norwood MA, USA) adapted with a force sensor developed by the author’s company.
Three replicates of each of the 18 prototypes were used for each evaluation. For destructive testing (e.g. amount of make-up removal, friction) separate wipes were used for each test. For non-destructive testing (e.g. weight), wipes also were used in other tests such as make-up removal.
Partial least square regression method
The PLS regression method being one of the most popular statistical modeling methods was applied to build the predictive model. PLS is a multivariate method for relating two sets of data together and testing how well the X set of data can predict the Y set of data. In this case, the X-data were the in vitro laboratory measurement data and the Y-data were the consumer attributes. Each of the consumer attributes was predicted separately. For the PLS procedure, a pair of components were extracted from the X and the Y set at each stage so that they accounted for as much variation as possible and were as correlated as possible. The goodness of fit is measured by R2 = 1−SSYresid/SSYtotal. A cross-validation procedure was used to estimate the predictive value of the model. Extracting pairs of components was carried out until the predictive value of the model is not improved. Q2 = 1−PRESS/SSYtotal. PRESS is the sum of squared differences between predicted (
Results and discussion
Initial correlation analysis
Consumer ratings and in vitro lab measurements of the 18 prototypes were used for the model development. Tables 3 and 4 respectively list the mean scores of each prototype for consumer perception attributes and in vitro lab measurements for initial correlation analysis.
Mean scores for consumer perception attributes in predictive model building.

Mean scores for in vitro lab measurements in predictive model building.

Correlation analysis was conducted on the consumer ratings and in vitro lab measurements respectively in Tables 5 and 6. Table 5 shows that “effective removing makeup” and “effective removing water-resistant makeup” were highly correlated with each other (correlation coefficient =1.0) and were highly correlated with “clean skin feel” with a correlation coefficient of 0.9. “Gentleness” and “soft skin feel” were not correlated to removing/cleansing-related attributes, but highly correlated to each other with a correlation coefficient of 0.8.
Correlation matrix for consumer data.

Correlation matrix for in vitro lab measurements.

As shown in Table 6, the correlations among the weights from the lab measurements were 1.0, therefore only the weight (average), which was the average weight of three wipes measured after removing a different makeup product (mascara, eyeliner, foundation), was used in later predictive models.
Step-by-step PLS procedure for model development
Prediction of “effective removing makeup” was first regressed using the PLS method. Since a curvilinear relation was shown in the scatter plot between “effective removing makeup” and “weight (average)” (Figure 1), the “weight square (weight2)” or the square of “weight (average),” was added into the data set to re-run the regression.

Scatter plot of “effective removing makeup” vs. “weight (average)”.
After adding the weight2 to the data set, the fitting results in Table 7 indicate that the one-component (comp1) solution of joint-squared correlation (R2Y cum) of 0.799 was a close fit. The estimate of the predictive value of the model using the Q2cum was good at 0.746 as well.
Fitting results for “effective removing makeup”: after adding weight2 to the variables.

Variable importance in projection (VIP) scores estimate the importance of each variable in the projection used in a PLS model and often is used for variable selection. A variable with a VIP Score greater than 0.8 can be considered important in a given model. VIP scores were used to remove variables to improve the predictive performance.
The VIP results in Figure 2 show that “thickness” was not an important attribute and can be removed from this model. The analysis was repeated by removing the “thickness” attribute. The fitting results are shown in Table 8. After removing “thickness”, a two-component (comp2) solution gave a joint-squared correlation (R2Y cum) of 0.904, which was a very good fit. The estimate of the predictive value of the model using the Q2cum was very good at 0.829 as well. Both improved from the initial model. This estimate is similar to the estimate obtained (≤0.90) for most of the sound properties predicted by physical measures for suiting weight fabrics [1].
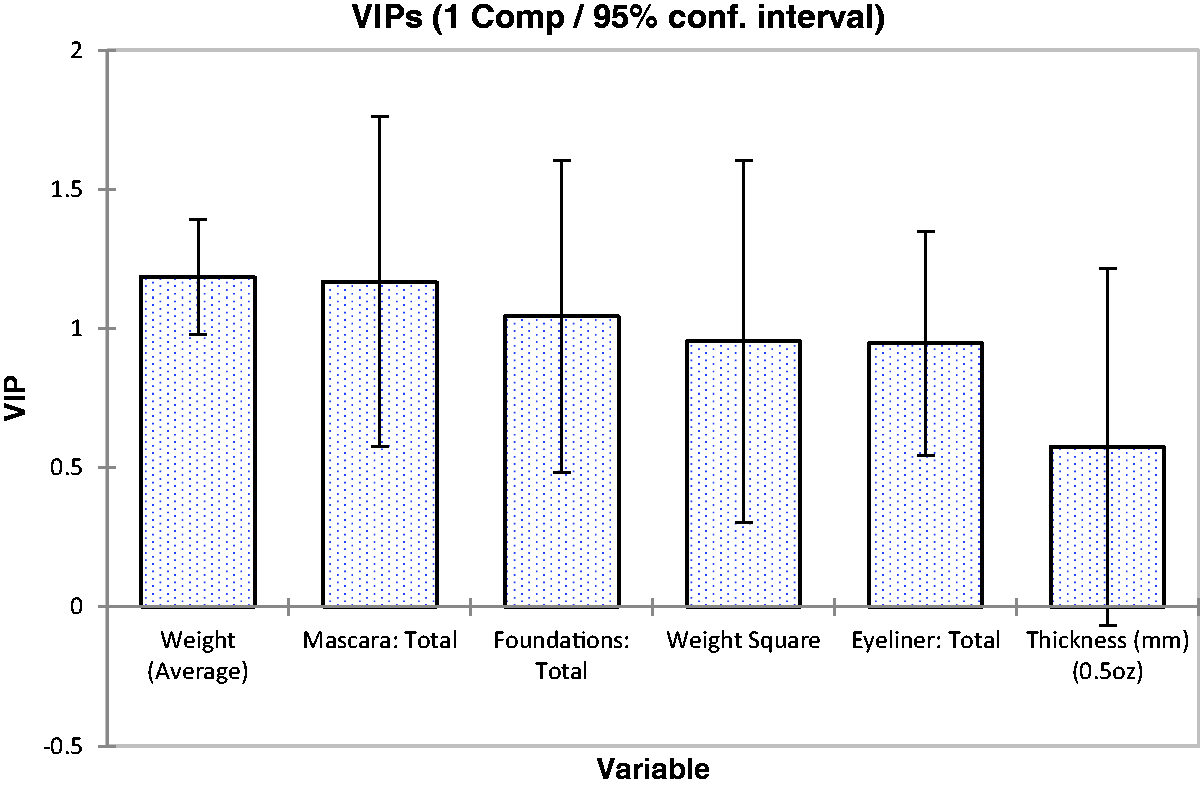
VIP results of first round PLS modeling for “effective removing makeup”.
Fitting results for “effective removing makeup: after removing not important attributes.

Outlier analysis is the next step following VIP analysis and it typically is conducted to remove measurements (in this case laboratory measurements) that indicate any product or prototype as extremely different from other products or prototypes. DModX indicates how much of the X information in a product is not being used in the predictive model. DModY is the modulus of the residuals of Y from the fitted model. DModY indicates products that can be excluded from the model. Products with DModY scores near or above one are considered to be the outliers.
The outlier analysis results in Figure 3 show that two products (#627 and #165) were above or near the critical value (one) for DModY, suggesting they were either extreme product outliers or that the measurements were unsatisfactory for these products, therefore these two products were removed to repeat the analysis.

Outlier analysis for “effective removing makeup”.
After removing the outlier products, fitting results (Table 9) showed that a two-component solution gave a joint-squared correlation (R2Y cum) of 0.969, which was an extremely good fit. The estimate of the predictive value of the model using the Q2cum was excellent at 0.922. Therefore, the model was established at this step.
Fitting results for “effective removing makeup” after removing outliers.

Fitting results for “gentleness” after removing additional outliers.

Following the above procedure, the final model for effective removing makeup was generated:
A similar process was applied for the other consumer attributes respectively using a PLS1 model. Models were generated based on the regression for “effective removing water-resistant makeup”, “clean skin feel”, “gentleness”, and “clean skin feel”. Even though a similar process was conducted for all the attributes, certain steps of each model may make the model not necessarily be a good fit for all situations. For example, for the “gentleness” model, based on outlier analysis, samples #918, #370, and #860 are outlier products that were excluded to get regressed again (Figure 4).

Outlier analysis for “gentleness”.
After excluding these three products, fitting results showed that a two-component solution with a joint-squared correlation (R2Y cum) of 0.748, which was an acceptable value. However, the estimate of the predictive value of the model using the Q2cum was still poor at 0.534. By repeating the outlier analysis, Figure 5 indicated that another three products (#534, #726, and #741) became new outliers and needed to be excluded from the model.

Outlier analysis for “gentleness” after removing outliers.
After further removal of these three products, the final fitting results displayed a two-component solution achieving a joint squared correlation (R2Y cum) of 0.934 with the estimate of the predictive value of the model using the Q2cum at 0.847 (Table 10). However, it becomes questionable whether a model where one-third of the products has been removed is still representative of the category.
By comparing the samples excluded from the model, a majority of them were samples at high thickness (Table 11), which meant that the final model only can be applied to low-to-medium thickness samples. If a new prototype has a high thickness level, the developer should not use this model to predict consumer perception of “gentleness”.
“Gentleness” model only applies to low-to-medium thickness wipes.

Highlighted (grey) samples were outliers and were excluded from the model for “gentleness”.
These predictive models were established between consumer data and in vitro lab measurements. However, further validation research is needed to ensure the accuracy of the models before they can be used for the actual prediction. The models were established based on the statistical regression in a single study, which is insufficient to establish useable models. In addition, some models were rather low in their predictive value. Instead of a final model useful immediately to industry, these models provide a first look at the types of physical measurements that may be needed to describe sensory consumer perception.
To further explore the model development, different statistical methods, such as PCR and ANNs, can be applied to these data and additional samples and physico-chemical methods need to be tested in further research to understand how the models compare, to determine the best statistical procedures, and to validate any models that are built. In addition, future studies will need to be conducted to compare predictive results to the actual consumer test results.
Conclusions
The PLS method was used to build predictive models between consumer perception attributes focusing on cleansing/makeup removing and gentleness/soft feel related attributes and in vitro lab measurements. This study demonstrated a step-by-step procedure of using PLS regression to generate five models. These predictive models may allow product developers to conduct lab measurements to predict consumer ratings and can offer a rapid prototype screening method to save budget, time, and resources once validated. However, they do not take the place of sensory and consumer research on the final samples that may be selected for further evaluation.
Footnotes
Declaration of conflicting interests
The author(s) declared no potential conflicts of interest with respect to the research, authorship, and/or publication of this article.
Funding
The author(s) received no financial support for the research, authorship, and/or publication of this article: This material is based upon the work that is supported by the National Institute of Food and Agriculture, U.S. Department of Agriculture, Hatch under accession number 1016242.