
Abstract
In this study, two different natural fiber reinforced composites were characterized from the point of view of decomposition kinetics comparing two kinetic models, Kissinger and model-free kinetics, in order to estimate the lifetime of composites. Composite materials were prepared with low-density polyethylene as matrix and plasma-treated and untreated natural fibers were used as reinforcements, in two different amounts (20 and 30 wt%). Composites were manufactured using a rotor mixer and a hot plate press. Afterwards, a thermogravimetric analysis was carried out for each material at six different heating rates (5, 7, 10, 13, 15, and 20°C/min) with a coupled mass spectrometry device to identify released elements in a specific temperature range. The influence of the low-pressure plasma treatment, as well as the fiber type, was taken into account to evaluate the activation energy of the decomposition processes of each material. Besides, lifetime was estimated from the obtained decomposition energies and the Toop equation. It was found that plasma treatment does not have a meaningful influence on decomposition kinetics, but the main composition of the natural fibers is decisive in this aspect, giving rise to much longer lifetimes when the cellulose content of the fiber is higher.
Introduction
In recent years, natural fiber reinforced polymeric composites are widely studied because they combine the environmental benefits of a green material with excellent mechanical properties. They avoid skin and respiratory irritations, are biodegradable [1], and they also present high availability [2,3]. Natural fibers can successfully compete with glass-fiber materials because of their attractive properties, which include low density, low cost, excellent specific strength properties, renewable character, carbon dioxide neutrality emissions, and sustainability [3]. The reduced production energy of natural fibers is especially significant when compared to glass fiber, with claims of 82% reduction in the energy required to produce a flax fiber material compared to a glass-fiber material.
Thermoplastic polymers, instead of thermosets typically used as matrix for these kind of materials, have been gaining importance due to their ability to be reshaped by melting [4], so the manufacturing possibilities increase and the processing costs decrease. In addition, the recyclable character of many thermoplastics, such as polyolefins, allows an environmentally friendly end of life [5]. All these features presents polyethylene (PE) as a good option since, in addition to the above mentioned properties, it is cheap and presents high availability.
Mechanical properties of natural fibers are mainly determined not only by their composition and structure, but also by the age of the plant, the extraction zone, and the growing conditions [6]. Natural fibers are lignocellulosic structures mainly formed by cellulose, hemicellulose and lignin, and to a lesser extent pectins, proteins, wax, or inorganic salts. Flax and coconut fibers were used in this work, considering that their compositions are very different as it can be observed in Table 1 [7]. This may allow studying how the composition affects different properties of the composites.
Main composition of flax and coconut fibers [7].

Cellulose is responsible for the mechanical strength of natural fibers and, therefore, a higher cellulose content improves the fiber resistance [8]. The supramolecular structure of cellulose is what determines its physical and chemical properties. The decisive factor in this aspect is the degree of polymerization of cellulose, which varies depending on the type of natural fiber, having a value in flax fiber of 8000 repetitive units and a lower value for coconut [6]. On the other hand, the more noncellulosic components content in the fiber, such as lignin, reduce the mechanical properties. Coconut fiber has the same amount of cellulose and lignin, around 40%, which is half of the flax cellulose content and much higher than the flax lignin content. This means that coconut fiber is considered as a poor reinforcing fiber regarding mechanical properties compared to other natural fibers with high cellulose content such as flax, sisal, or hemp [9,10].
The main problems when using natural fibers as a reinforcement are their hydrophilic character and their high water absorption. So, they lead to a weak interaction between fibers and polymer matrix and a poor moisture resistance [11].
These problems are commonly solved by surface treatments that improve adhesion between fiber and matrix. They work by reducing its hydrophilicity, obtaining a good chemical bond, or by increasing its roughness, in which case the mechanical anchorage is favored [7]. Chemical treatments are the most frequently used, such as alkali or silane treatments [12–14].
In previous works, the influence of low-pressure plasma (LPP) as a suitable treatment for natural fibers was evaluated. It was found that the adhesion between natural fibers and low-density polyethylene (LDPE) matrix was improved, as well as mechanical properties and thermal and moisture durability [15,16]. By performing the X-ray photoelectron spectroscopy analysis, it was concluded that the adhesion improvement was due to a superficial cleaning and drying of the fibers. Wax and superficial water were removed from fiber surfaces after LPP treatment.
Plasma technology consists of an ionized gas created by applying enough energy to reorganize the electronic structure of the species present in the gas [17]. Plasma sources represent a fast, environmentally friendly, nontoxic, and dry process, which act on the material surface without affecting the bulk properties [18]. It is presented as an important alternative for natural fibers in order to avoid other pollutant chemical treatments.
Natural fibers are constituted by a complex mix of organic materials whose thermal stability can be studied by thermogravimetric analysis (TGA) [19]. Normally, TGA of natural fibers provides three decomposition steps. One peak appears at 300°C corresponding to the thermal decomposition of the glycosidic links of cellulose and hemicellulose. The second peak takes place at 360°C and it is due to the thermal decomposition of α-cellulose [20]. Lignin thermal stability is lower than cellulose or hemicellulose. In TGA, it appears as a wide peak, which starts before the thermal decomposition of the glycosidic links, from 200°C to 500°C. The maximum is obtained at 350°C so it is overlapped with the two other peaks [21,22].
Thermal decomposition of polymers as well as composites is complicated. It can include many reactions and, hence, it is difficult to obtain all kinetic parameters [23]. TGA is presented as a quick tool that is able to determine the thermal stability of many substances, displaying a wide range of decompositions, including the pyrolysis of numerous polymers [24].
The aim of this work is to study the influence of plasma treatment and fiber amount of both flax and coconut LDPE composites over decomposition kinetics.
Prediction of materials life in service is a very helpful tool for designing new components but it is not always an easy task. This paper proposes a fast and efficient method to estimate the lifetime of polymeric materials reinforced with natural fibers using the Toop equation [25] by TGA.
Experimental procedure
Materials and sample preparation
Short flax fibers (10 mm long) and short coconut fibers (5 mm long) provided by Procotex (Dottignies, Belgium) were used as reinforcement of composite materials in 20 wt% and 30 wt% content. DOW 780E-type LDPE was used as thermoplastic matrix, supplied by Dow Chemical Company (Madrid, España).
The mixtures were prepared in a rotor mixer, Haake Rheomix 252 P (Massachusetts, USA), at 150°C for 40 min. Afterwards, they were pressed in a hot plate press, Fontune Presses TPB374 (Barendrecht, Netherlands).
Low-pressure plasma treatment
Before mixing fibers with LDPE, flax and coconut fibers were treated with LPP in a Harrick Plasma Cleaner chamber (Ithaca, NY, USA) using air as the gas to produce plasma at a pressure of 300 mtorr. Once vacuum is reached in the chamber, fibers remain there for 1 min at 30 W [15].
Eight composite materials, manufactured in different conditions as stated in previous sections, were studied, using LDPE as the base material, which were labeled as shown in Table 2.
Nomenclature of materials.

LDPE: low-density polyethylene; LPP: low-pressure plasma.
Thermogravimetric analysis
Decomposition kinetics were obtained through TGA analysis by using a TA Instruments TGA Q500 device (New Castle, USA). The TGA evaporated elements were directly passed to a mass spectrometry equipment, MS Discovery (TA Instruments). Molecular weight of released elements together with the temperature when it occurs, can be obtained.
Six tests were carried out for each material at different heating rates of 5, 7, 10, 13, 15, and 20°C/min. Samples were introduced in a ceramic crucible with a sample weight between 10 and 20 mg. From the obtained thermograms for each rate, and using specific software (STAR, Mettler Toledo) it is possible to calculate the activation energy (Ea) as a function of the decomposition degree of each material (α). This parameter is obtained using two different models: model-free kinetics (MFK), incorporated in the software [26], and Kissinger model [27].
Kissinger calculates activation energy from the peak temperature of the derivative curve of TGA thermogram as a function of the heating rate, according to the following equation
where β is the heating rate, Tp is the peak temperature (K), R is the gas constant (8.314 J/mol K), and Ea is the activation energy (J/mol). The activation energy can be determined from the slope of the curve ln(β/Tp2) versus the inverse of Tp. For a first-order reaction, assumed in this model, the activation energy is considered the same during the entire process [28].
With known Ea and by applying Toop equation (25), by equation (2) it is possible to estimate lifetime of each material as a function of temperature [29]
MFK method also allows to simulate lifetime of materials by isothermal curves at different temperatures, so these results could be compared to the ones obtained by the Toop equation. Both used models (Kissinger and MFK) are empirical methods, where decomposition reactions were completed during the test.
Decomposition degree for considering material failure has to be previously fixed. In this case it was determined by mass spectrometry, taking into account which elements are released in the first place.
Results and discussion
Activation energy
Thermogravimetric analyses of flax- and coconut-reinforced composites at 20% and 30% of fiber content, as well as LDPE, were carried out at six different heating rates. Using the obtained values of the peak temperature of the derivative of the TGA curve and the heating rates, it is possible to calculate the process energy according to equation (1) (Kissinger kinetic model) as the slope of the linear fitting shown in Figure 1.

Ea calculation according to the Kissinger kinetic model for PTF20.
Kissinger model is based on an Arrhenius-type equation where it is assumed that the reaction order is one. This means that the activation energy is the same during all the process regardless of the decomposition degree. The energy values obtained for each material are shown in Table 3.
Decomposition energy values according to the Kissinger kinetic model.

LDPE: low-density polyethylene.
Analyzing the obtained results in Table 3, it is not possible to extract a clear trend either in terms of influence of fiber type or regarding the LPP treatment. In general, it seems that flax-reinforced materials need greater decomposition energy than coconut-reinforced composites. Plasma treatment increases this energy in all materials except in 20% coconut-reinforced composites. It also seems that the higher the content of natural fibers, the higher the reaction energy. In order to validate all these hypotheses obtained from the Kissinger model, MFK kinetic model was used, calculating the activation energy as a function of the decomposition degree.
From the thermogravimetric analyses, decomposition curves were obtained for each material, and from these curves, the activation energy of the decomposition reaction was obtained as a function of the decomposition degree. The activation energy calculation process by the MFK method is outlined as a scheme in Figure 2. As it can be observed in Figure 2, from the TGA curves, (a) the software obtains the derivative curves, and by the integration of the peaks, it is able to provide the peak temperature and the enthalpy value (b). The next step (c) is to obtain the decomposition curves. At this stage, the given information is the temperature when the different decomposition degrees take place. By applying the MFK model (d), the activation energy can be obtained as a function of the decomposition degree.

Activation energy calculation process according to the MFK kinetic model: (a) TGA curves; (b) TGA integration, (c) decomposition curves; (d) activation energy.
At the end of this process, the program estimates the lifetime of the materials, as a function of the temperature and the decomposition degree, by simulating an isothermal cycle at the fixed temperatures, as it can be observed in Table 4. This lifetime can be compared to the one obtained by the Toop equation. However, it must be taken into account that both at the beginning and at the end of the reaction the estimation error is very high.
Estimation lifetime by the MFK method.

Decomposition energy curves of flax-reinforced composites compared to LDPE are shown in Figure 3.

Decomposition energy vs decomposition degree of flax composites and LDPE.
Regarding Figure 3, the average value of the decomposition energy of the LDPE (from 150 to 230 kJ/mol) is practically the same than the one obtained by Kissinger model (192.46 kJ/mol). In this case, it is easier and faster to apply Kissinger than the MFK model. Nevertheless, in the rest of the materials in the decomposition processes, it is more complex and the energy cannot be estimated by Kissinger model. The first part of the reaction is the most complicated one and it cannot be associated to a first-order reaction, hence a deeper study is necessary. However, at 50% of decomposition, when the process is stabilized, similar energies are obtained by both methods, comparing values from Figure 3 (MFK) and Kissinger results (Table 3).
At the beginning of the decomposition process, a somehow random behavior is observed, being stabilized around 25%. In all cases, it is necessary for a high energy at the beginning of the process to start the reaction. Afterwards, a very important drop occurs, which is more significant when the fiber amount is higher. If flax composites with LDPE are compared, it can be observed that all composites show a higher or similar energy value than the one obtained for LDPE in the stabilized zone, except UTF20. Therefore, it can be concluded that it is more difficult, from an energetic point of view, to decompose flax-reinforced composites than LDPE, and LPP treatment also slightly increases the required energy for decomposition.
Coconut-reinforced composites exhibit the opposite behavior to flax-reinforced materials, compared to LDPE. All of them require a decomposition energy lower than LDPE during the whole process, even at the beginning, with the exception of plasma-treated 30% coconut-reinforced composites (PTC30). In this case, at 60% of decomposition degree, the energy is very similar to LDPE, as shown in Figure 4.
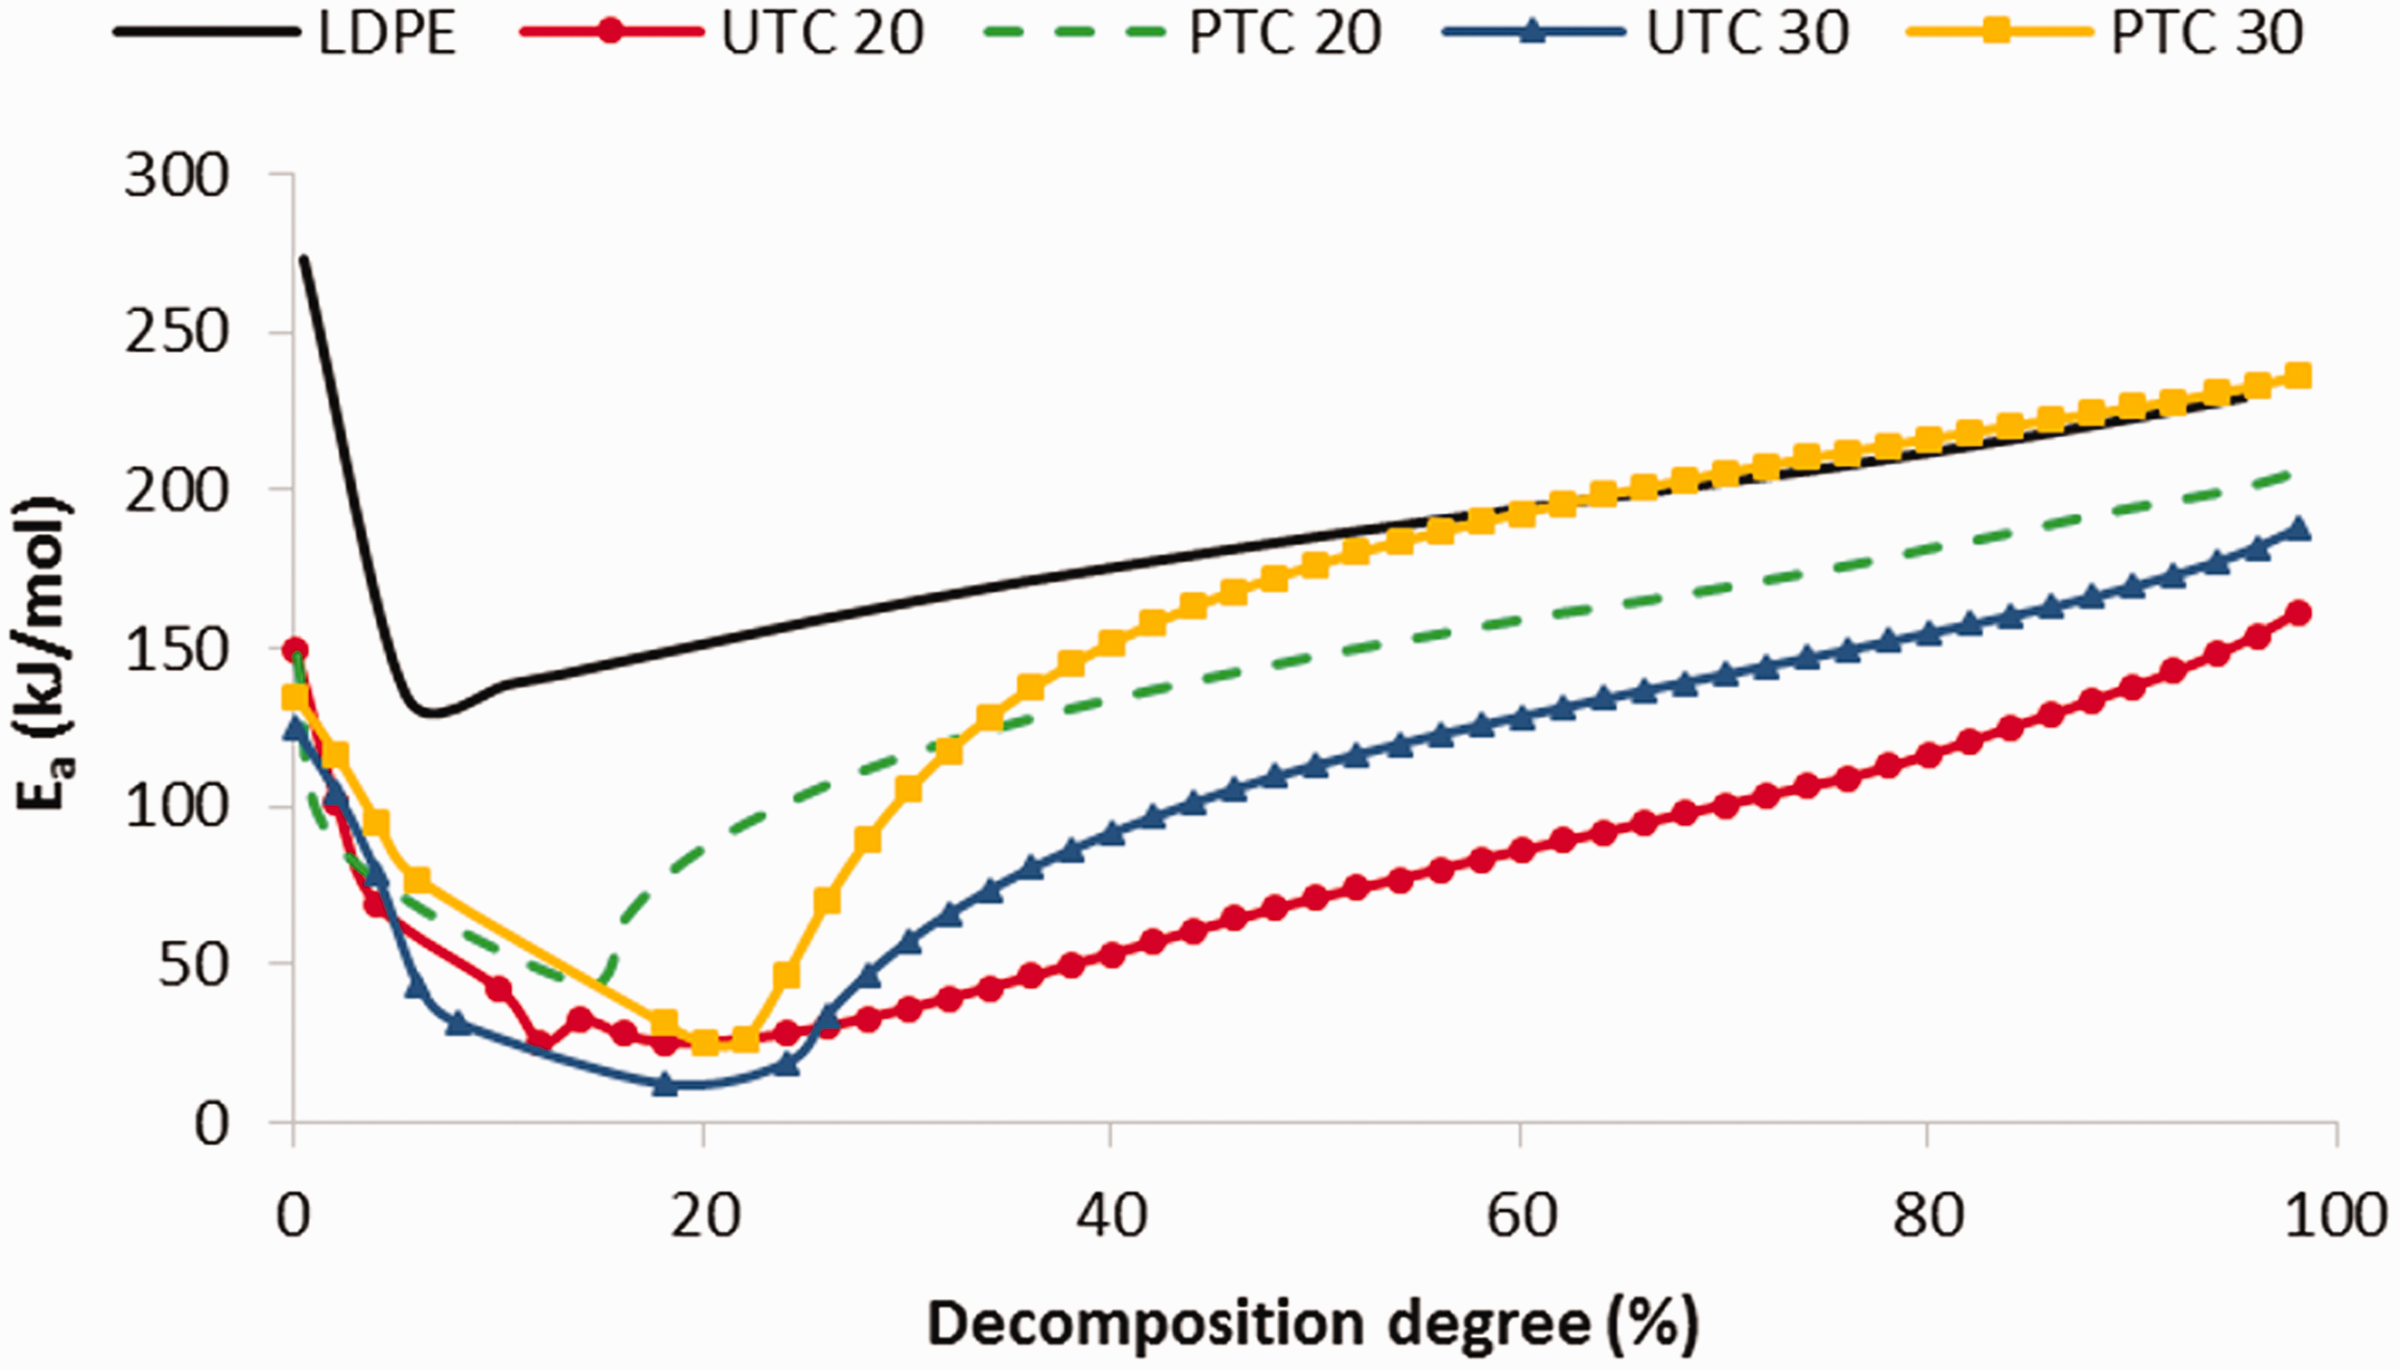
Decomposition energy vs decomposition degree of coconut composites and LDPE.
To sum up, the decomposition processes of coconut-reinforced composites are less energetic than flax-reinforced composites and even than LDPE. This is important to emphasize, because the discussion is about composites with the same matrix, the same fiber content, but different composition of the cellulosic fibers. This composition is found to be very significant in the decomposition process. Other authors determined the individual kinetic behavior of the main components of natural fibers and it was found that a general activation energy range for pure cellulose can be 140–250 kJ/mol [30,31]. So, the maximum activation energy that can be reached is 250 kJ/mol. Lignin decomposition energy can reach 80 kJ/mol and hemicellulose no more than 150 kJ/mol [32]. The component that needs more energy to decompose is cellulose, so flax composites need to reach that energy to break down most of the material. However, coconut material also needs to reach the cellulose decomposition value but in this case, lignin content is very significant and its decomposition process occurs before cellulose decomposition and so at the beginning only is needed to reach lignin decomposition values. Lignin requires very little energy to decompose and there is as much lignin as cellulose [21]. Therefore, it is reasonable that composites reinforced with a high cellulose content fibers need more energy for the decomposition process.
Mass spectrometry
The mass spectrometry was carried out while the temperature was increased during TGA experiments, so it can provide information of the generated gases during the decomposition process. Figure 5 shows the LDPE spectrometry as an example. The gases that are released correspond to the different substances in which the material is decomposed. The spectrometry shows a peak at the temperature when the releasing of the different substances takes place, which are identified from their molecular weight.
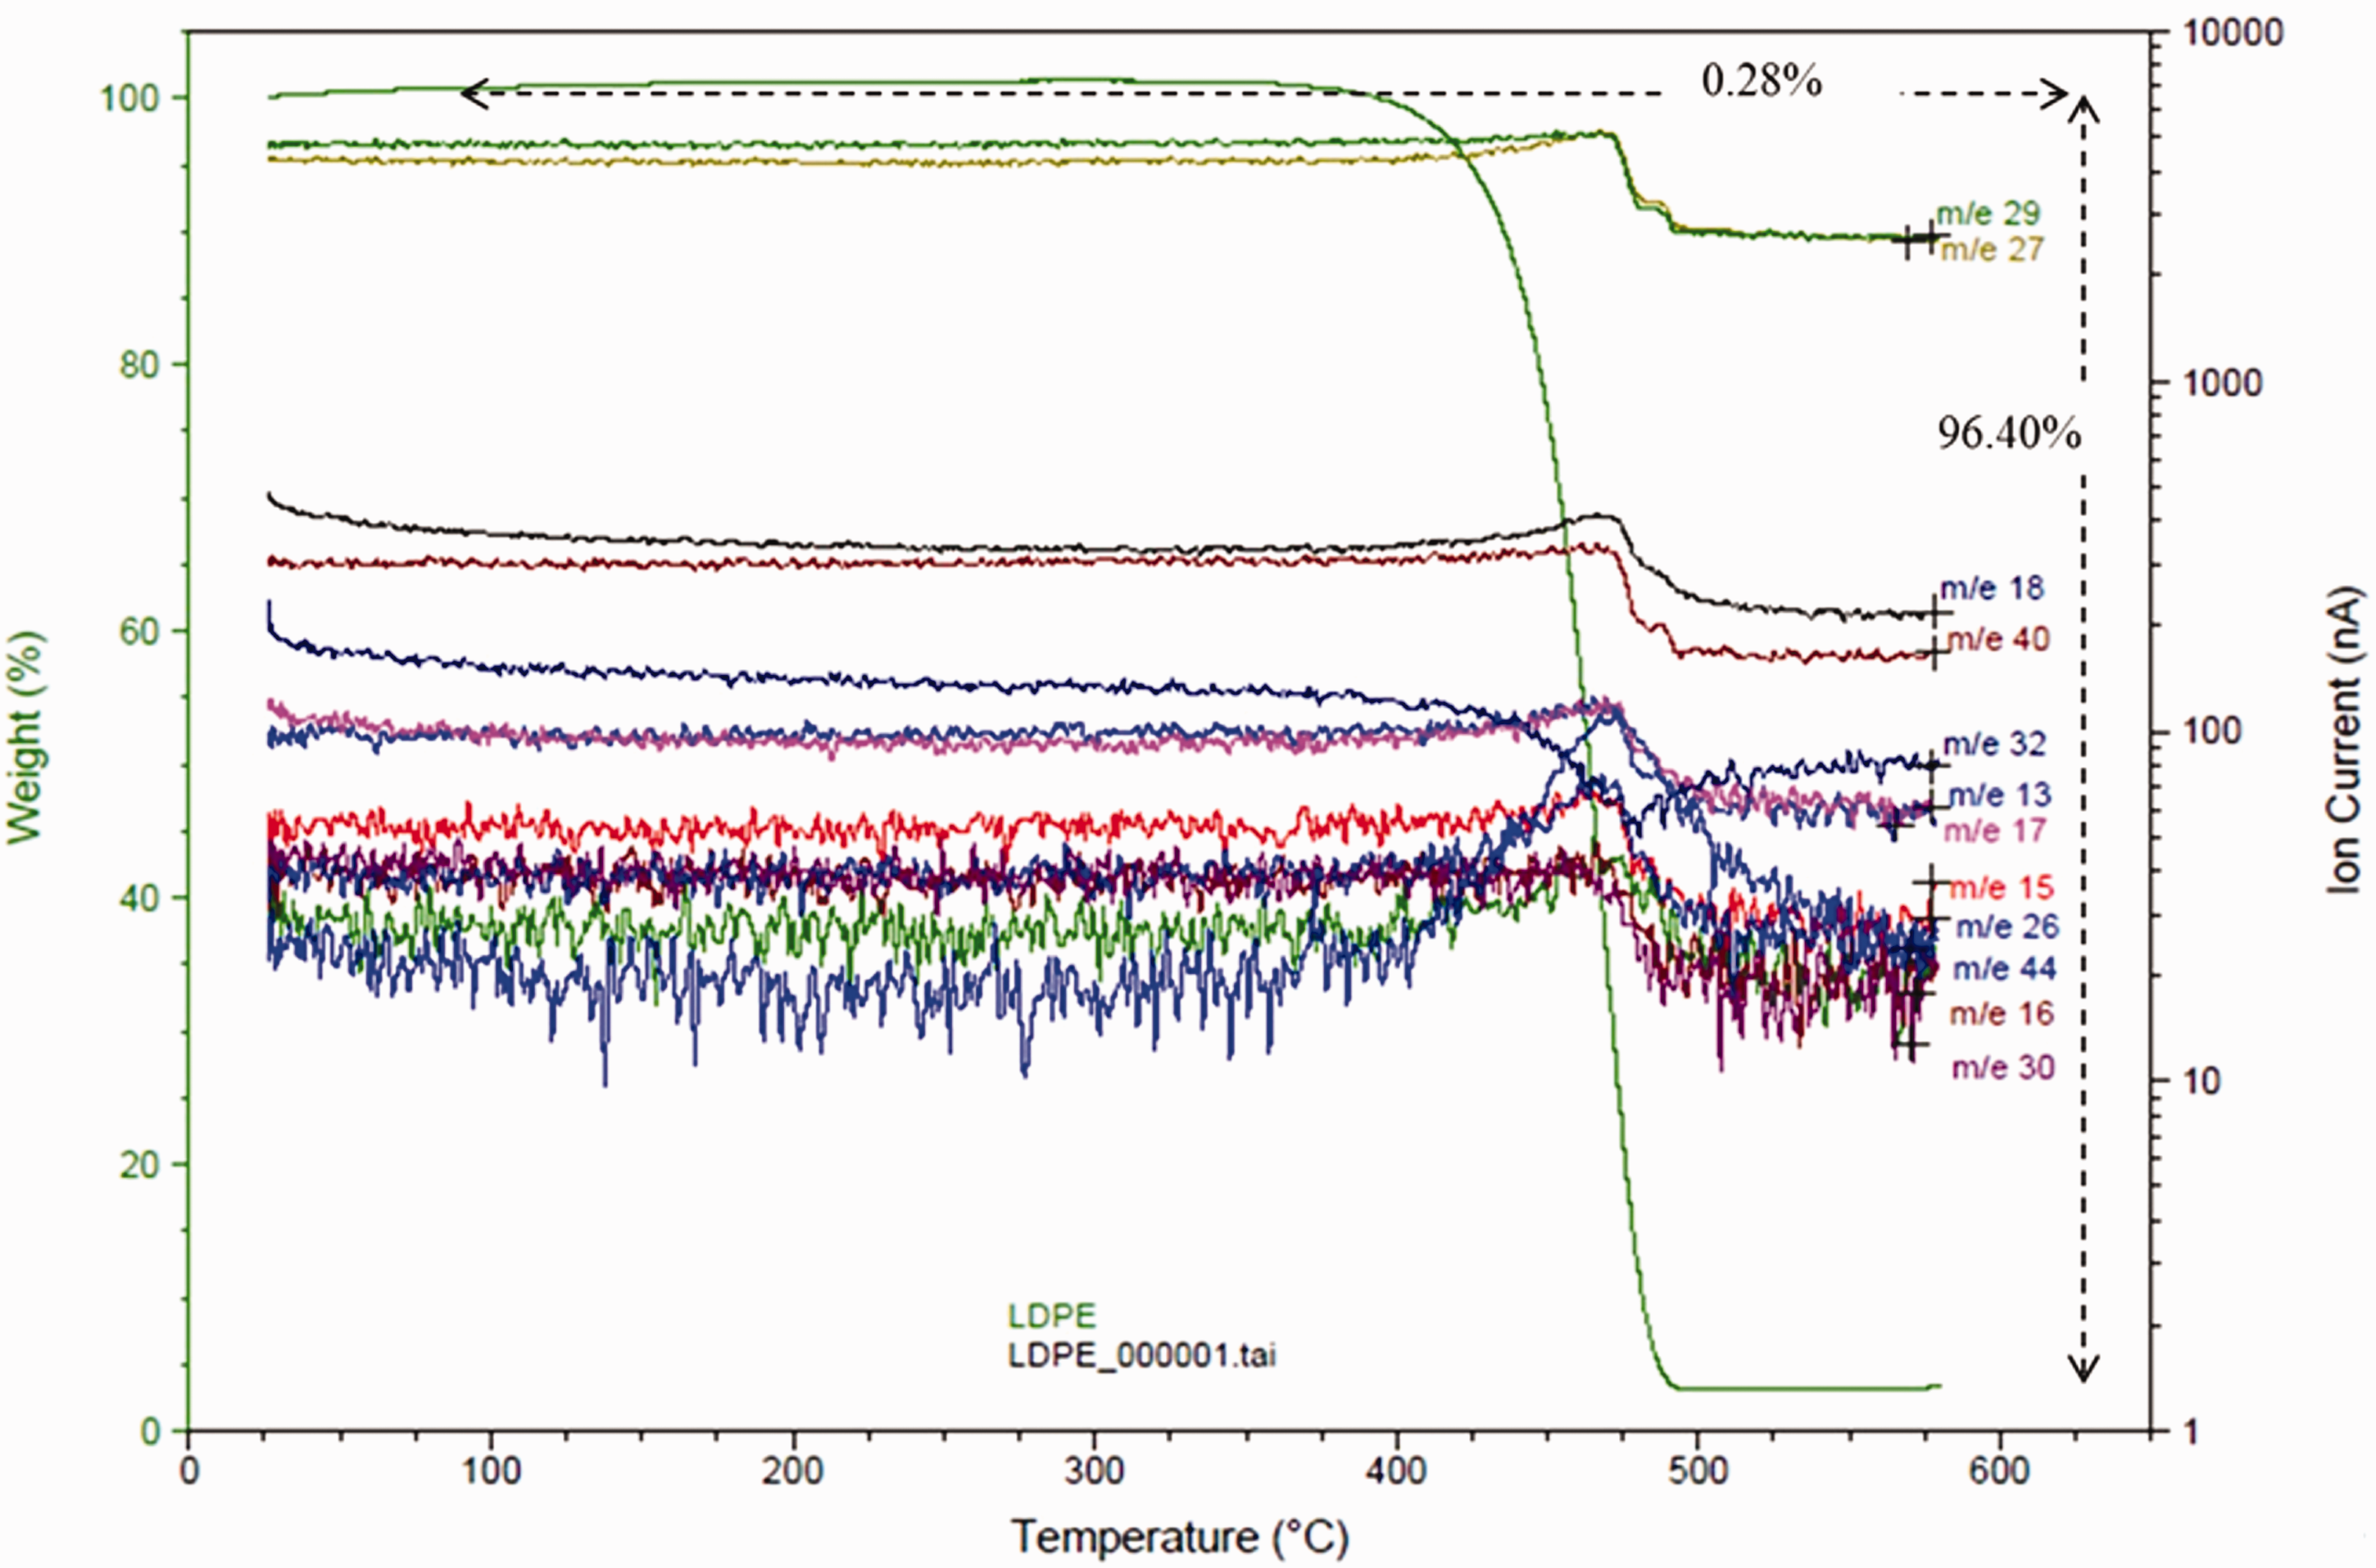
Mass spectrometry of LDPE during the decomposition process.
Table 5 shows the substances that correspond to the gases released for all materials and at which temperature gas releasing occurs. Initially, an evaporation of surface water takes place, insignificant compared to the total weight of the sample. One of the gases that start to come off at a lower temperature is CO2. In coconut-reinforced materials, CO2 detachment occurs at 280°C, while in flax-reinforced materials it occurs above 365°C. Water and OH¯ groups also begin to be released at lower temperature in coconut than in flax-reinforced materials, which is in line with the lower decomposition energy that coconut-reinforced composites need. Regarding the LPP treatment, there is no a direct relationship with the evolution of gases. However, a higher fiber content seems to accelerate the evolution of gases associated with H2O and OH¯ groups.
Temperature and detached gas assignation of all composites and LDPE.

LDPE: low-density polyethylene.
In order to estimate the useful life of all studied materials, it is necessary to define which decomposition degree is considered for material failure. The most common is to consider the failure as soon as the decomposition begins, so it is generally considered at 5% of decomposition degree [29]. Mass spectrometry is also useful to corroborate the above affirmation. It has been already commented that coconut-reinforced composites start their degradation earlier than flax-reinforced composites and LDPE and gases begin to release over 280°C. Thus, from this temperature, material deterioration should be considered and thus the material failure.
The activation energy and temperature (Tc) at 5% of the decomposition degree (Ea5%) are shown in Table 6. According to the previous discussion, this percentage of decomposition also shows that flax-reinforced composites required the higher energy, even over LDPE, and coconut-reinforced materials are very far from them, with very low energy values.
Temperature and activation energy at 5% of decomposition.

LDPE: low-density polyethylene.
Estimation lifetime
With Ea5% and Tc5% values and using Toop equation (equation (2)), it is possible to estimate the useful life for all materials as a function of the established service temperature. Figure 6 shows lifetime versus temperature for LDPE, comparing the obtained results to the Toop method and to the MFK isothermal simulation. At 25°C, according to the Toop equation (equation (2)), the estimated lifetime is greater than 1010 years. Evidently, the higher the temperature, the lower the lifetime.

LDPE estimated lifetime according to the MFK and Toop methods.
If curves from Figure 6 are compared, it can be clearly appreciated that results are very different, with the MFK method reporting a higher lifetime. Therefore, it is considered that the program makes a substantial error in the measurement and does not make a correct estimation. It probably occurs because the program is working with a very low decomposition degree. Hence, it is necessary to use the Toop method to estimate lifetime of the rest of the materials. Although considering that the aim is to compare the materials, the MFK method would be valid in order to obtain a fast approximation.
Flax-reinforced composites present lifetime values much higher than those of the LDPE. Some order of magnitude variations were also observed related to the reinforcement content (30% or 20% of flax fibers). As shown in Figure 7, increasing the amount of reinforcement implies a greater activation energy necessary to start the decomposition process, and therefore the useful life of the materials is much longer. Thus, for an untreated 20% of flax fiber, lifetime at 25°C can be estimated in 1018 years, while for its counterpart with 30% it is 1019 years. Regarding the plasma treatment, it seems to have a positive effect on the duration of flax composites, finding an estimated lifetime of 1018 years for both 20% reinforced composites untreated and LPP treated at 25°C. Although the differences in the decomposition energy values between homologous materials, LPP treated and untreated, were not very significant (see Table 6), this variation involves an increase in the lifetime of the materials as it can be observed in Figure 7.

Estimated lifetime for flax-reinforced composites and LDPE.
Coconut-reinforced composites, as shown in Figure 4, according to the decomposition energy data shown in Table 6, showed a much lower activation energy than flax-reinforced composites and LDPE, being directly related to lifetime. The estimated lifetime for these composites at 25°C are 290 and 300 years for fiber contents of 20% and 30%, respectively. Figure 8 shows the curves of lifetime versus temperature. In this case, LDPE curve is not shown because of the big difference between orders of magnitude. The maximum temperature analyzed was 100°C, due to the low lifetime values obtained. It is observed that higher values were obtained for plasma-treated samples, independently of the fiber content. In general, it can be asserted that there is no significant difference between the four coconut materials, but it is worth highlighting the low lifetime obtained for coconut composites in comparison with flax composites and LDPE.

Estimated lifetime for coconut-reinforced composites.
Table 7 resumes all the lifetime values obtained for all natural fiber composites and LDPE at 25°C.
Estimated lifetime at 25°C.
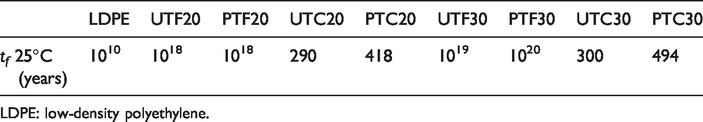
LDPE: low-density polyethylene.
Conclusions
In the present work, two types of natural fibers, flax- and coconut-reinforced composites, were compared from the point of view of their decomposition kinetics and they were compared to LDPE. The influence of the LPP treatment in the decomposition process was also studied.
Summarizing all the obtained data, it can be concluded that the main factor is the natural fiber composition since it has a very significant influence in the lifetime of the composites, as well as the plasma treatment, although to a lesser extent. Because the LDPE content is lower and the natural fiber content increases, an easier and faster decomposition process was expected for the natural composite materials. But this simple decomposition behavior was only found when reinforcing with coconut fiber, with a very low amount of cellulose (around 40%). Flax composites present a decomposition process, which needs more energy than LDPE, so the composition of the fiber is crucial in the decomposition kinetics, considering that the cellulose content in flax fiber is 80%. Therefore, it can be affirmed that the higher the cellulose content of natural fibers, the longer the lifetime of the composites.
On the other hand, the MFK kinetic model is considered a better option than the Kissinger model for the study of the decomposition processes of the natural fiber composite materials, which present a nonlinear decomposition process. However, the latter provides a good approximation for LDPE.
Finally, the estimation lifetime provided by the MFK model, using an isothermal simulation, leads to an important error, preferring the use of Toop equation. Nevertheless, if it is used to compare different materials, it will be very helpful.
Footnotes
Declaration of conflicting interests
The author(s) declared no potential conflicts of interest with respect to the research, authorship, and/or publication of this article.
Funding
The author(s) disclosed receipt of the following financial support for the research, authorship, and/or publication of this article: The authors are grateful for the financial and academic support received from the Carlos III University of Madrid-Spain, as well as the support received from the thermal analysis research laboratory of the Autónoma de Occidente University of Cali-Colombia.