
Abstract
This study introduces the tubular braided structure as a new geosynthetic material for sand reinforcement. The performance of a tubular braid under the influence of similar soil–reinforcement interaction mechanisms has been investigated to emphasize the effect of the reinforcement form on the performance of the reinforced soil composite. For this purpose, three series of interaction element tests including direct shear tests, pull-out tests, and soil stress control tests were conducted on the unreinforced and reinforced sand. Finally, the overall performance of the reinforced foundation bed with the planar and tubular reinforcing textile (with similar materials, properties, texture, and areal density) was evaluated through a series of standard plate load tests. The results indicated that the performance of the sand-braid composite was better compared to the similar typical planar reinforcement, except for the case of pull-out test. Tubular braid resulted in the enhanced shear strength of the reinforced soil composites, mobilization of the excess compressive stress in the enclosed soil inside the tubular braids, reduction in the vertical stress level of the footing model transferred down through the soil bed, the increase of the average bearing capacity of the footing model, and a significant reduction in the footing settlement.
Keywords
Introduction
Various soil improvement methods such as soil reinforcement technique have been used as a solution for improving the soil mechanical features in geotechnical engineering applications like the construction of building foundation and roadbed [1]. In recent years, numerous scientific studies have been evaluating the performance of foundations resting on the soil reinforced by various types of reinforcing materials [2–4]. Soil reinforcement can consist of a wide range of materials such as polymeric geosynthetics [1]. Geosynthetics have been used in various forms especially in two-dimensional (2D) planar form [4–6] (geogrid, geotextile, and geonet) or the three-dimensional (3D) form [3,7–9] (geocell). They are also used as long fabric or the continuous insert form (sheets, layers, strips), and as randomly oriented discrete inclusions (short cut fibers) [10]. Many studies have discussed the modification and improvement of soil synthetic reinforcement properties and its shape. Some of these studies have laid foundation for the development of new polymeric soil reinforcements [11–14].
A braid is a textile structure produced by intertwining of two or more strands or fabric strips in a bias and diagonal formation [15]. Yarn systems move in separate controlled sinusoidal or circular paths in the braiding technique [15]. Braiding technology offers a reduced fabrication time at a relatively low cost for producing low-cost, high-volume continuous fiber composites [16,17]. There is a possibility to produce a wide range of these technical textiles with different cross-section shapes, sizes, materials, and patterns [18]. Figure 1 shows the schematic of the braiding technique over shaped mandrel.
Braiding over shaped mandrel.
Today, braided structures are widely used in various industries [19], though not as a soil reinforcing fabric. The 3D shape of the braided structures has a potential for the confinement of the materials inside [20]. Depending on the fiber types, this kind of textile can expand both in the cross-section and length (before resin injection) [21]. Therefore, it can be filled easily by soil and/or other materials. The confinement of the soil particles inside the braid elements and its resistance against the applied forces can be considered as an additional factor improving the shear strength properties of the soil-braid composites, as compared to the ordinary planar reinforcements. The aperture opening size of this structure can increase during the expansion of the cross-section; therefore, it can maintain the interaction between the inside and the surrounding soils. This behavior can intensify the soil–reinforcement interaction and cause the pull-out resistance of the buried elements in the soil [22]. All of these factors, which can improve the strength of the braid-reinforced soil composite, along with the appropriate manufacturing speed of the braiding technology, economy and the affordable price of braids, and the easy filling process with soil, have led to the idea of introducing such fabrics as a new 3D geosynthetic for use in the soil reinforcement and sand environment.
Limited laboratory studies have been carried out to study the performance of the soil reinforced by braids. Hafizi [23], however, studied the effect of tubular geotextiles having the braid structure on the shear strength parameters of sand by using large-scale direct shear tests. The obtained results showed that the cohesion, internal friction angle, and the plasticity of soil-braid composites could be increased significantly, as compared to the unreinforced soil. Satvati et al. [24] also carried out a series of laboratory-scale loading tests on strip foundation models resting on tubular braid-reinforced sand slopes. It was reported that the tubular braids filled with soil certainly increase the bearing capacity of the footing model more than two times, as well as reducing its settlement up to 50% more than the slopes models with the similar planar geotextile layers [24]. Karimi [25] also investigated the bearing capacity of strip foundation models resting on small-scale reinforced sand walls. Their results indicated that the tubular braid-reinforced sand walls had a smaller horizontal deformation of wall face. Also, the bearing capacity of the footing resting on this kind of wall models could increase significantly, as compared to the cases reinforced by the planar geotextile layers. Further, Shahbazi [26] investigated the bearing capacity and settlement of strip foundation models resting on the braid-reinforced sand bed. It was shown that, compared to the planar geotextile layers, this kind of tubular textile could increase the bearing capacity more than 25% and reduce the settlement of the footing up to 23%.
Generally, all of the previous limited studies have shown the proper function of braid structures as a reinforcing fabric in the sand environment. However, there is no direct study addressing the sand–braid interaction. Determination of soil–geosynthetic interaction parameters plays an important role in the design of reinforced soil structures. The main objectives of this research were to investigate the interaction between buried tubular braid elements and sand and to evaluate the effects of these structures in the sand foundation bed, as well as comparison of the braid performance with that of the common planar reinforcements; these were all done for the first time. For this purpose, three series of interaction element tests including direct shear tests, pull-out tests, and soil stress control tests were conducted on the unreinforced and reinforced sand composites. Direct shear tests and pull-out tests are the most common soil–geosynthetic interaction tests that have not yet been performed by using the braid structure. The stress control tests are also innovative experiments designed due to the specific shape of the braid elements. Finally, in this study, the overall performance of the reinforced foundation bed with the planar and tubular reinforcing textile was evaluated through a series of standard plate load tests. Hence, this paper was intended to introduce the braid structure as a flexible high modulus soil reinforcing fabric for geotechnical applications like footing and road bed construction. This fibrous structure can satisfy the interaction between the inside and the surrounding soils and has a better performance than common planar soil geosynthetics.
Soil–braid interaction mechanisms
For the purposes of this research, it was assumed that the similar arrangement of planar geogrid layers in the sand bed was also used for tubular braids by placing elements horizontally and next to each other inside the sandy foundation bed. A number of possible failure mechanisms of the foundation bed reinforced by the soil-filled tubular braids are provided in Figure 2. These failure mechanisms are based on the evidence from the failure of the geogrid-reinforced foundation bed [27]. Since, in this research, the diameter and the horizontal distance of the tubular braids were small, as compared to the length of elements, it seemed reasonable to use the same failure mechanisms of the geogrid-reinforced bed. The advantage of such a hypothesis is the direct comparison of the tubular and planar reinforcement performance in accordance with the introduced mechanisms. According to Figure 2, in the region A, the failure surface intercepts the reinforcement plane vertically, or it is inclined at an angle, and the soil and reinforcement are sheared. Direct shear tests with the reinforcement placed vertically or in an inclined manner to the shear plane can be employed to evaluate this mechanism [28–30]. In the region B, sliding of the reinforcing element inside the soil can happen. In this case, the pull-out tests can be employed to evaluate the pull-out mechanism and to determine the interaction parameters between the soil and the reinforcement [31–33]. In the region C, there is a situation in which the soil mass slides on the reinforcement surface. Direct shear test between the soil and the surface of reinforcement can be used for this mechanism [34]. In this research, mechanism C was discarded due to its low probability of occurrence.
Interaction mechanisms considered in a tubular braid-reinforced soil bed.
The most differences between the tubular braided structures and the typical planar reinforcements involve different shapes, different 3D reinforcing functions, and the full physical confinement of the most soil particles inside the braids [24]. Accordingly, two stress mechanisms can be involved in the performance of tubular braids, as shown in Figure 3. In the mechanism D, it is assumed that the inclusion of the tubular braid elements containing the encapsulated soil beneath the footing leads to an increase of the pressure distribution angle and a significant reduction can result in the foundation stress transferred down through the soil bed by distributing the load over a wider area. Also, in the mechanism E, it can be expected that there is some excess compressive stress mobilization inside the tubular braids at high normal pressures, especially beneath the foundation center, due to the soil confinement inside the braids. Stress control tests can be used to evaluate these two stress mechanisms [2]. In addition, the tension membrane effect is involved in the reinforcement mechanisms due to the bending deformation of the tubular elements beneath the footing, as well as other typical planar reinforcements [35]. However, this mechanism has not been studied in this paper.
Stress mechanisms considered in a tubular braid-reinforced soil bed.
Finally, to put it briefly, the overall objective of this research was to compare the performance of the tubular reinforcements (braid and geogrid) with the planar reinforcement layers in the experiments mentioned below:
Direct shear tests (mechanism A) Pull-out tests (mechanism B) Stress control tests (mechanisms D and E) Plate loading tests (as a result of all introduced mechanisms)
Test materials
In this research, the cohesionless sand passing through the 25 mm sieve was used. Soil identification tests on oven-dry samples were carried out. The particle size distribution curve of this soil is shown in Figure 4 [35]. According to the Unified Soil Classification System [36], this soil is known as the poorly graded sand. Other properties of this soil are given in Table 1. This soil has been used at the relative density of 60% in all tests, as the backfill and filler soil inside the tubular reinforcements.
Particle size distribution curve of the sand. Physical properties of the sandy soil.

Three reinforcement samples with different specifications were used in the experiments, including two types of tubular geotextiles having a 2D biaxial braided structure in the nominal diameters of 3 and 5 cm (B1 and B2) and a low strength uniaxial geogrid (GS), as shown in Figure 5. Based on the purpose of the tests, all reinforcements were used in both tubular and planar shapes. The planar form of the braid was created by cutting the tubular textile along the longitudinal axis; then the edges were sewn with the adequate yarns. The tubular shape of the geogrid (with the diameter of 3 and 5 cm) was made up of putting together the two edges of the cutting from geogrid and sewing them on each other by using the adequate yarns. The yarns tensile strength was chosen in a way to minimize the differences in the mechanical features (the tensile strength and initial modulus) between the two forms of reinforcements. The specifications of the used reinforcing materials and yarns are given in Table 2. There is no independent standard method for measuring the tensile strength of the tube-shaped fabrics. Therefore, the standard test method of the conventional geotextiles was used [42]. Generally, in all tests conducted with the purpose of comparing one type of reinforcement in two tubular and planar shapes, all parameters of the material, properties, texture, and the areal density of planar and tubular reinforcements have been considered to be equal with each other.
Reinforcements used in the study: (a) braid B1, (b) braid B2, and (c) geogrid GS. Properties of the reinforcements and yarns used in the study. PET: Polyethylene-terephthalate; PP: Polypropylene. Based on the product information from manufacturer (ASTM D1059, ASTM D1907, and ASTM D2256).

Testing preparation and methodology
Direct shear tests
These tests were conducted to investigate the performance and shear strength parameters of the sand reinforced by tubular reinforcements and to compare it with the soil reinforced by the similar planar reinforcement based on the mechanism A (Figure 2). The procedure of these tests was based on ASTM D3080 [41]. Large-scale direct shear equipment and the circular shear box with a 15 cm diameter were used in this series of tests. The sand samples were prepared by the air pluviation method. In this series of tests, two types of reinforcements (B1 and GS) were used in the tubular form with a 5 cm diameter and a planar form with the width of 15 cm. The length of the reinforcements was slightly lower than the height of the shear box (15 cm). All reinforcements were positioned vertically and they were perpendicular to the failure plane in the soil samples to determine the behavior of the soil–geosynthetic composite when the shear force acted normally to the reinforcing layer (Figure 6). The area of the soil enclosed in the tubular reinforcement was almost 11% of the total area used for testing the sample section; hence, it was possible to cause a significant difference in the results by using the tubular reinforcements. The direct shear tests were conducted with three different normal stresses of 25, 50, and 100 kPa and a horizontal displacement speed of 1 mm/min. Hafizi [23] reported that by decreasing the orientation of the tubular element inside the soil sample from 90° to 60°, the maximum improvement and the higher soil shear strength could be expected.
Direct shear test samples: (a) tubular braid-reinforced sand and (b) the planar reinforcement sample.
Pull-out tests
A series of pull-out tests were conducted as per ASTM D6706 [45] to investigate and compare the pull-out resistance of similar tubular and planar reinforcements embedded in sand based on the mechanism B (Figure 2). A modified direct shear test setup was used in these tests [46]. This device could conduct the pull-out tests of the tubular elements with a diameter up to 5 cm and the planar samples of reinforcements with a maximum width of 30 cm. The inner test box of the apparatus was 41 cm long, 41 cm wide and 16 cm height. The box had three different removable slots including a 12 mm thick horizontal slot and two circular openings with the diameters of 3.5 and 5.5 cm for placing the geosynthetic specimen in the soil. The friction between the soil and the inner walls of the box was minimized by using smooth, thin plastic sheets. The static load was applied on the surface of the samples by a rigid plate with the dimensions of 40 cm × 40 cm × 0.5 cm. Figure 7 shows the image of the pull-out apparatus. All test specimens were prepared by the air pluviation method in layers. All three types of reinforcements (B1, B2, and GS) in the tubular form with a diameter of 3 cm and the planar form with a width of 9.5 cm were used to utilize the same material area in both tubular and planar shapes. Also, the length of all reinforcement samples was at least 41 cm equal to the length of the sand box. The tests were conducted at different normal stresses of 5, 10, 15, 20, and 40 kPa, with the horizontal displacement speed of the clamped geosynthetic being equal to 1 mm/min. The values of the pull-out load and displacement at the beginning and the end points of the buried reinforcements were read during the tests.
The modified pull-out test setup used in the pull-out tests.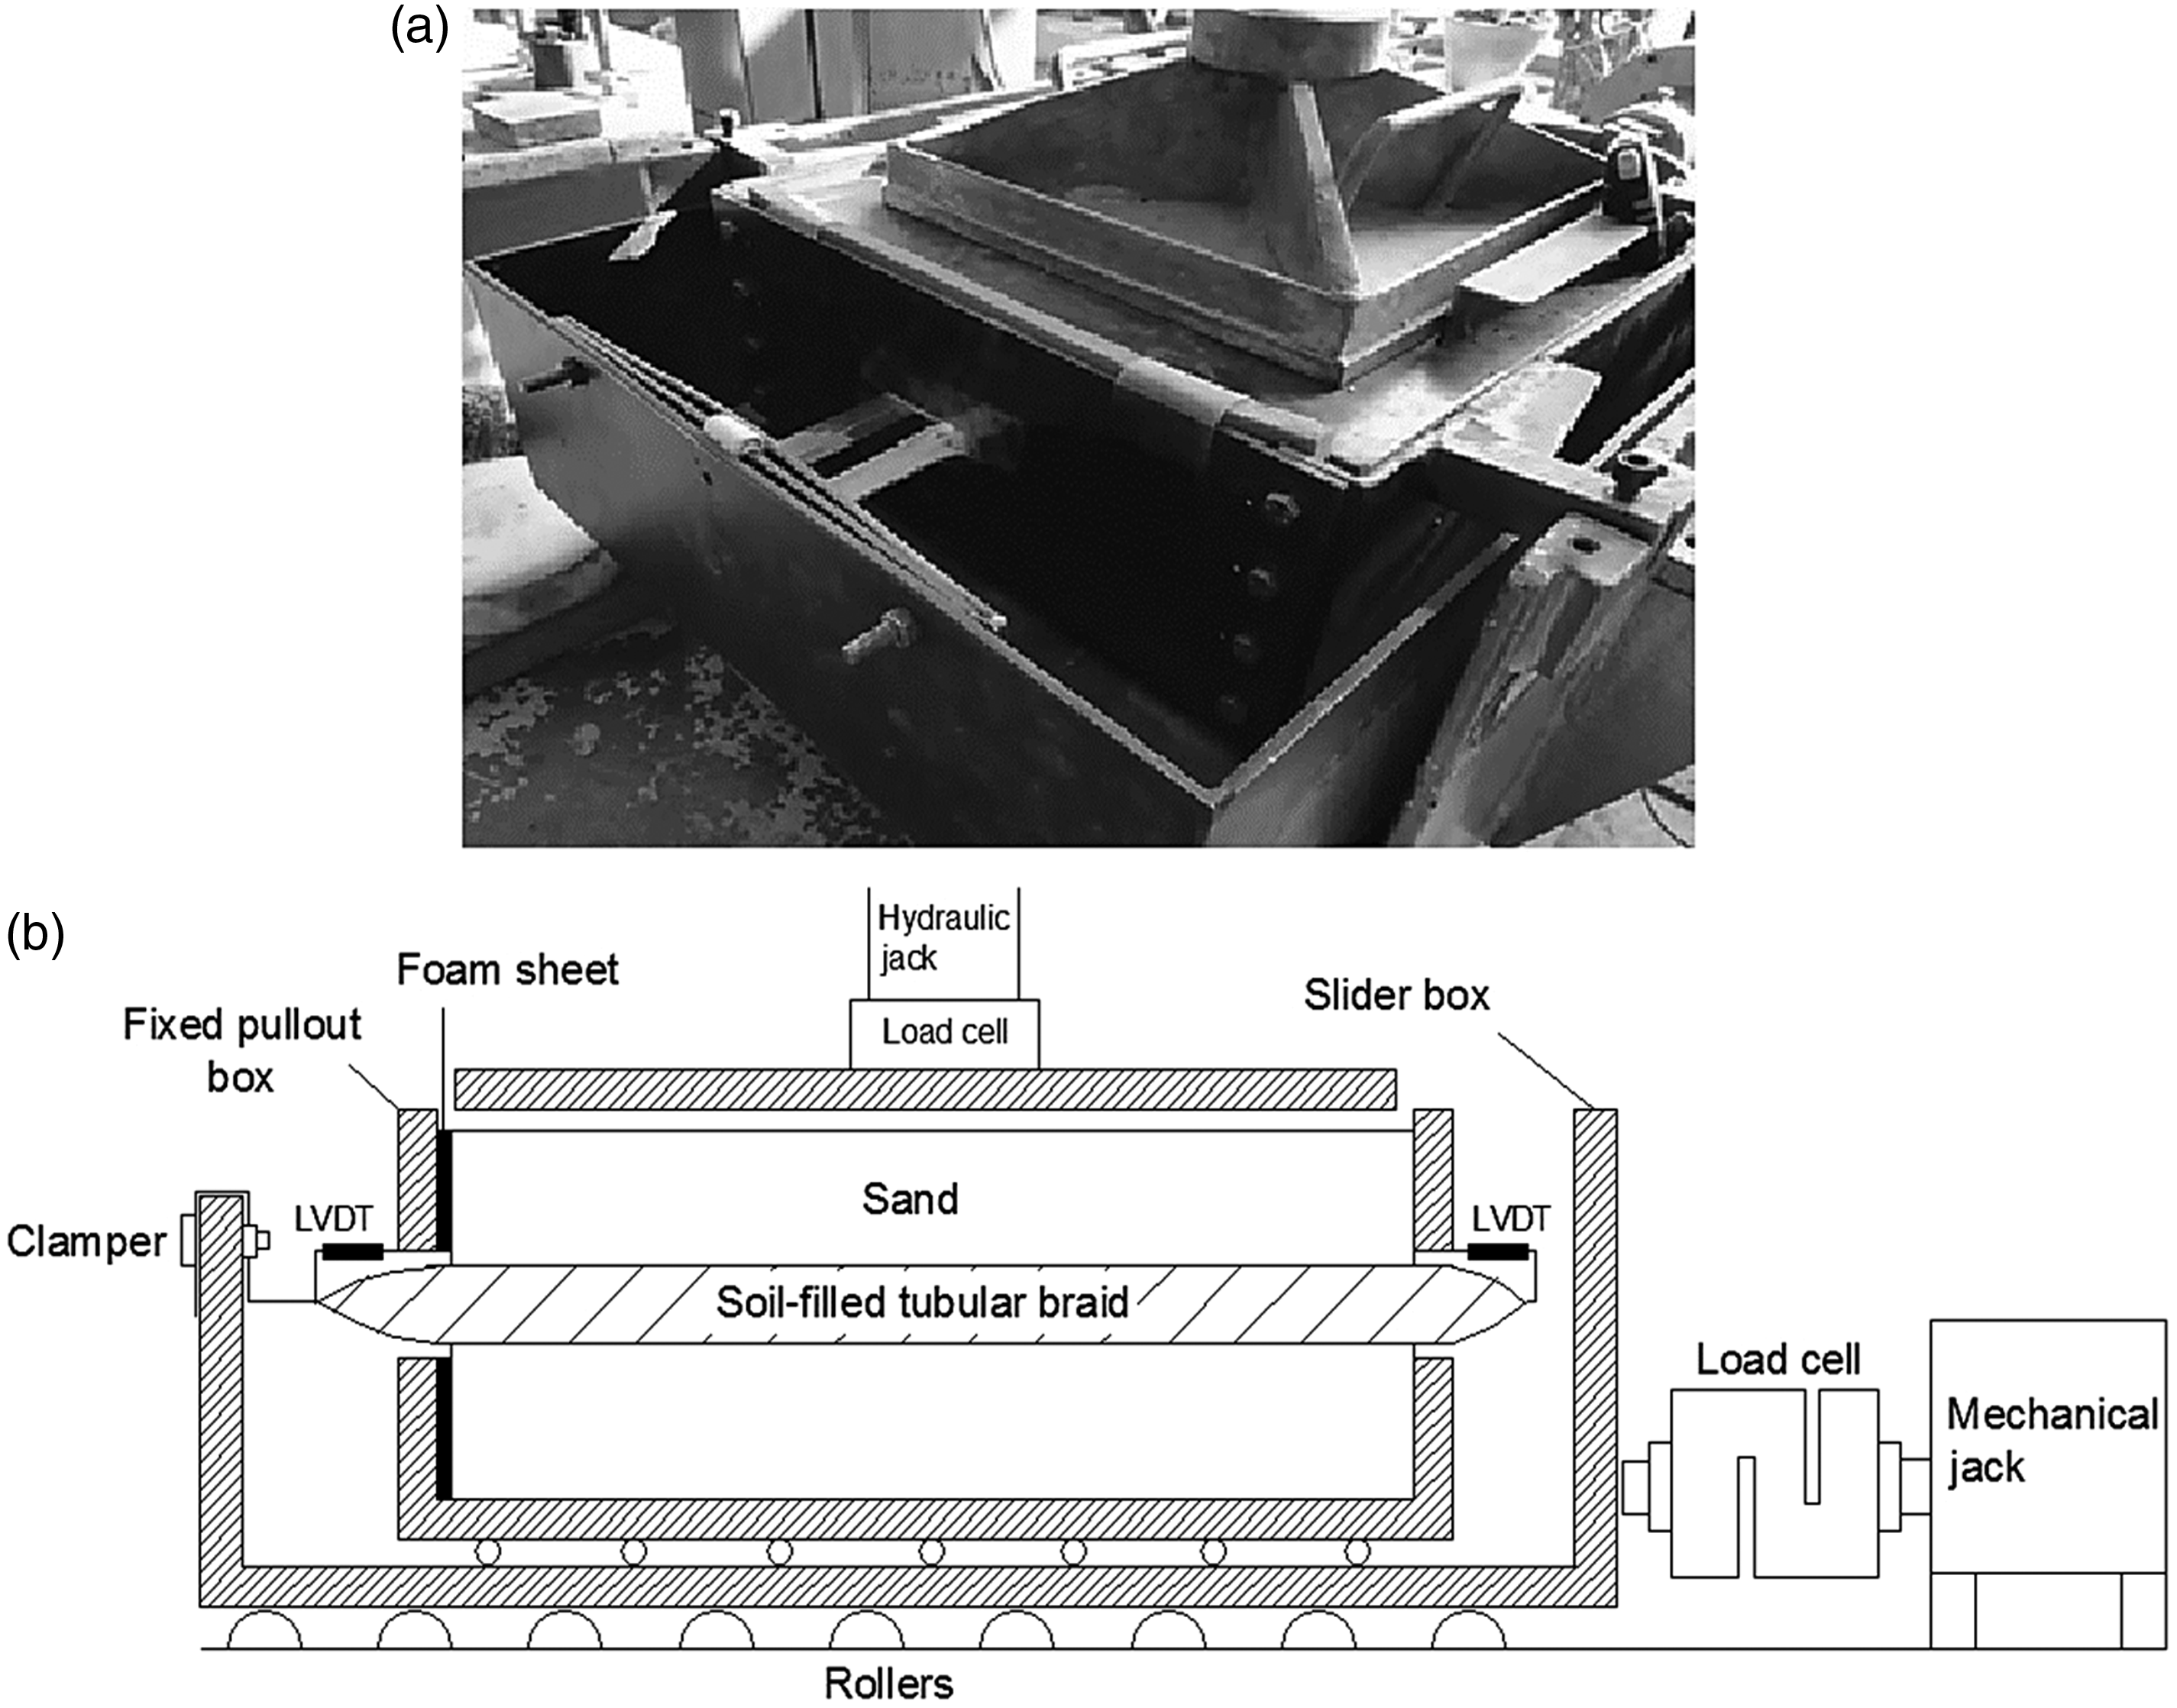
Stress control tests
Stress control tests were conducted to investigate the pressure distribution at depth in the reinforced bed and stress condition inside the tubular braid according to the two stress mechanisms D and E (Figure 3). For this purpose, two different series of stress control tests were carried out, and three soil pressure cells (SPCs: 30 mm in diameter, with an accuracy of 0.01% of the full range of 1500 kPa) were used in these experiments. In the first series of tests, to investigate the mechanism E, the stress condition inside the buried tubular reinforcement in the soil was investigated. These tests were conducted by three types of reinforcements (B1, B2, and GS) in the tubular form with a diameter of 5 cm and the length of 30 cm. A rigid steel box of the size 41 cm × 41 cm × 16 cm was used, and the soil samples were prepared by the air pluviation method in the layers inside the test box. The arrangement of the soil pressure sensors and an image of this series of tests is shown in Figure 8. To ensure that the effect of the boundary condition and the size of the test box on stress distribution was minimized, a series of numerical sensitivity analyses were performed before testing. A 40 cm × 40 cm rigid steel plate (approximately equal to the surface area of the test box) was used as the loading plate to ensure the uniformity of pressure in the sand box. After preparing each sample, stepwise loading with 50 kPa load incrementation was applied on the surface of the loading plate, and the sensors outputs were recorded.
The layout of the stress control tests used to investigate the mechanism E: (a) the unreinforced soil and (b) the braid-reinforced soil. SPC: soil pressure cells.
In the second series of stress control tests, to evaluate the mechanism D, the pressure distribution at a depth of sand reinforced by a tubular braid element and the sand reinforced by a similar planar reinforcement layer was investigated. For this series of tests, the braid B1 in the tubular form with 5 cm diameter and the planar form with 15.5 cm width were used. The length of all reinforcement samples was 30 cm. For these experiments, the same test box, the same soil relative density, and the same test sample preparation method, as described earlier, were used. Dimension analysis was done to determine the effect of the boundary condition before testing. It was observed that although the depth of the sand box could have a significant impact on the results, due to the identical conditions, we could compare the results in all tests. A circular steel plate with the diameter of 7 cm and the thickness of 2 cm was used as a footing model in these tests. Stepwise loading with 200 kPa load incrementation was applied on the surface of the footing model. The arrangement of soil pressure sensors in this series of stress control tests is shown in Figure 9. It is noteworthy that in all conducted stress control tests, the main reading of the results was done by the sensor SPC1 beneath the center of the loading plates and the two sensors SPC2 and SPC3 were used only to control the stress uniformity and the distribution of stress at a constant depth.
The layout of the stress control tests used to investigate the mechanism D: (a) the tubular geotextile-reinforced soil, (b) the planar geotextile-reinforced soil, and (c) the unreinforced soil. SPC: soil pressure cells.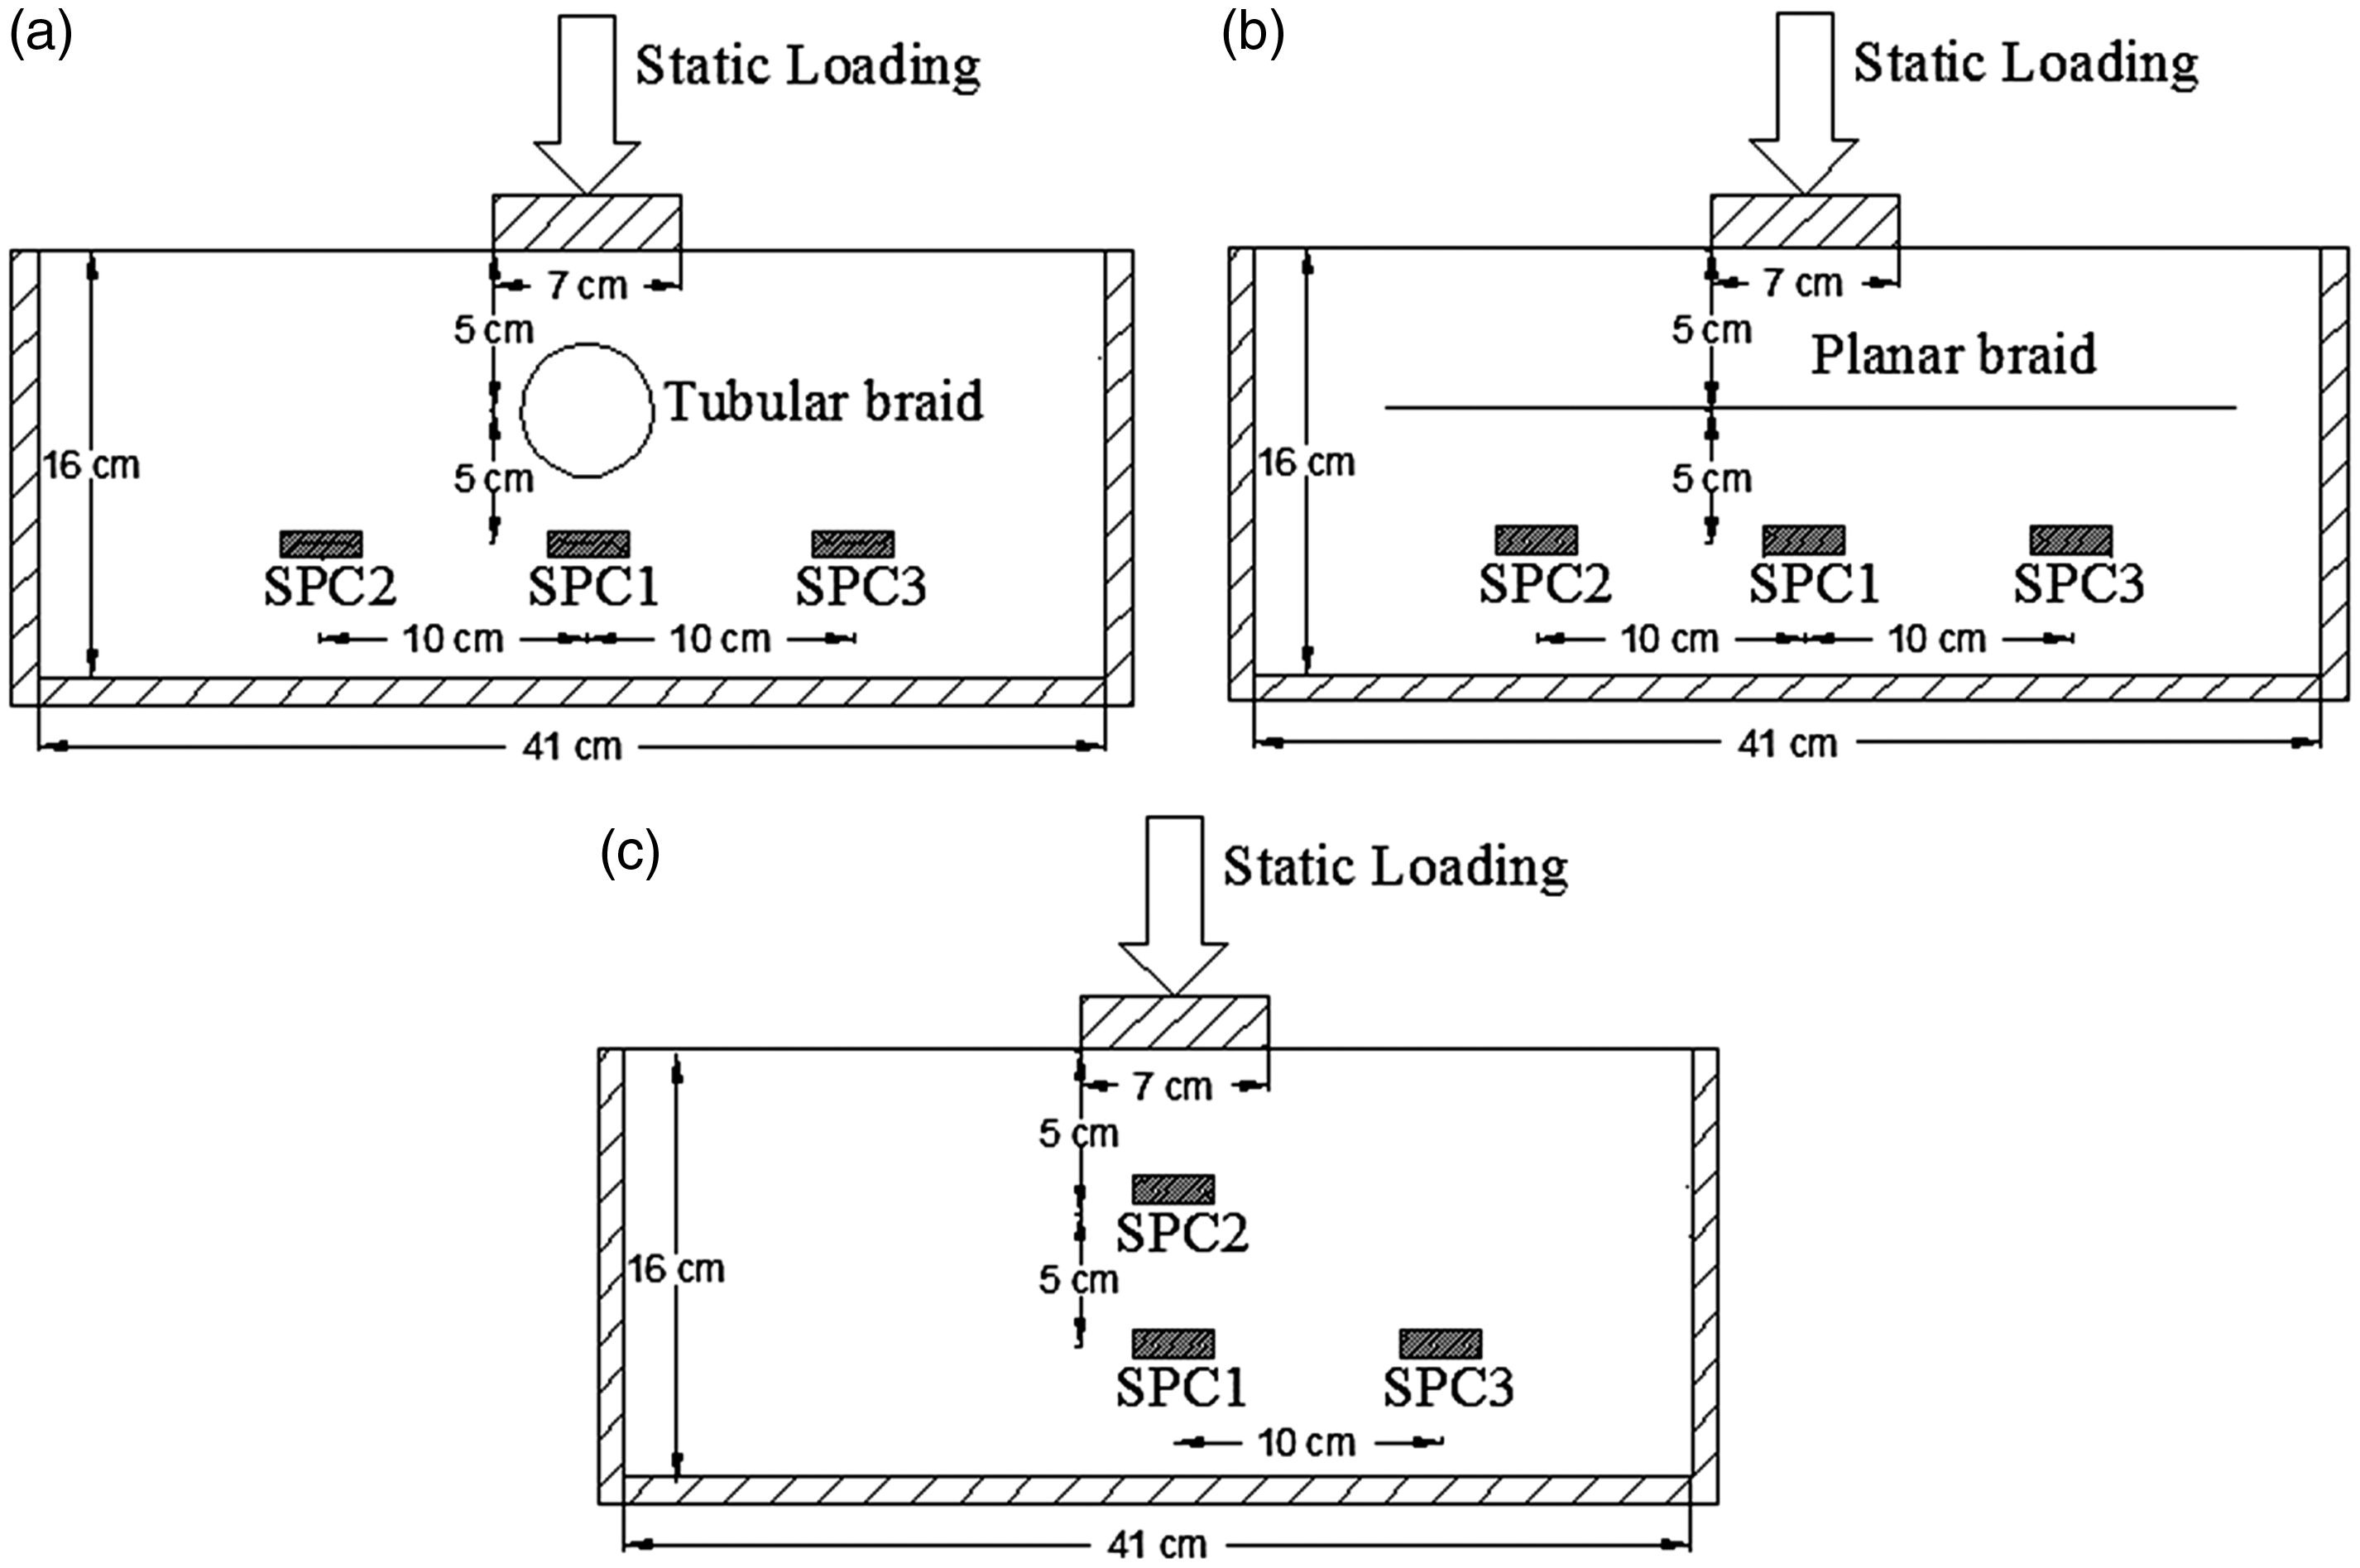
Standard plate load tests
These tests were conducted to investigate the general behavior of a model footing resting on the sand bed reinforced by the tubular braid elements and to compare its performance with that of the sand bed reinforced by a similar planar reinforcement. To conduct the experiments, a test pit with the dimensions of 150 cm × 150 cm in the plan, as well as the depth of 110 cm, was excavated in the natural ground. The four sides of the test pit were covered by smooth plates, and the base soil beneath the pit was fully compacted. The steel rigid circular loading plate had a diameter of 30 cm and a thickness of 2.5 cm. The suitability of the test pit dimensions and the loading plate diameter were controlled by dimension analysis. The loading system consisted of a hand-operated hydraulic jack with a maximum capacity of 600 kN and the capability of controlled stepwise loading. Heavy concrete beams spanning the width of the test pit were also used to provide the required reaction load of tests. Moreover, a digital load cell with a precision of 0.01 kN for force readings and three sets of linear dial gauges with a precision of 0.01 mm were attached to a reference beam used during the experiments. Soil beds were prepared by the air pluviation method in the layers inside the test pit. A large-scale sand pluviator apparatus was used for this purpose [47]. In this series of tests, the two types of reinforcements B1 and GS in three forms including tube-shaped elements with 3 and 5 cm diameter and the planar shape were used. The tubular reinforcements were filled by the same backfill soil using an appropriate funnel, before being embedded in the soil. The geometry of the test configuration and the values of the depth to the first reinforcing layer, the vertical distance between the layers, and the width of the layers are shown in Figure 10. The optimum geometric parameters were extracted from the results of laboratory model tests [26]. Figure 11 shows an illustration of the arrangement of tubular and planar reinforcement layers in the tests. In each test, two reinforcement layers were used. The tubular elements in each layer were oriented in one direction and parallel to each other and the alignment of elements in the second layer was perpendicular to the direction of the elements in the first layer. Thus, this layout could create a grid arrangement. The horizontal distance between the tubular elements was chosen such that, totally, the area of the used reinforcement was equal to each other in all tests. The test procedures were performed according to ASTM D1194 [48]. All experiments were continued until ensuring the backfill soil failure or reaching a footing settlement value of 12% to 14% of the loading plate diameter.
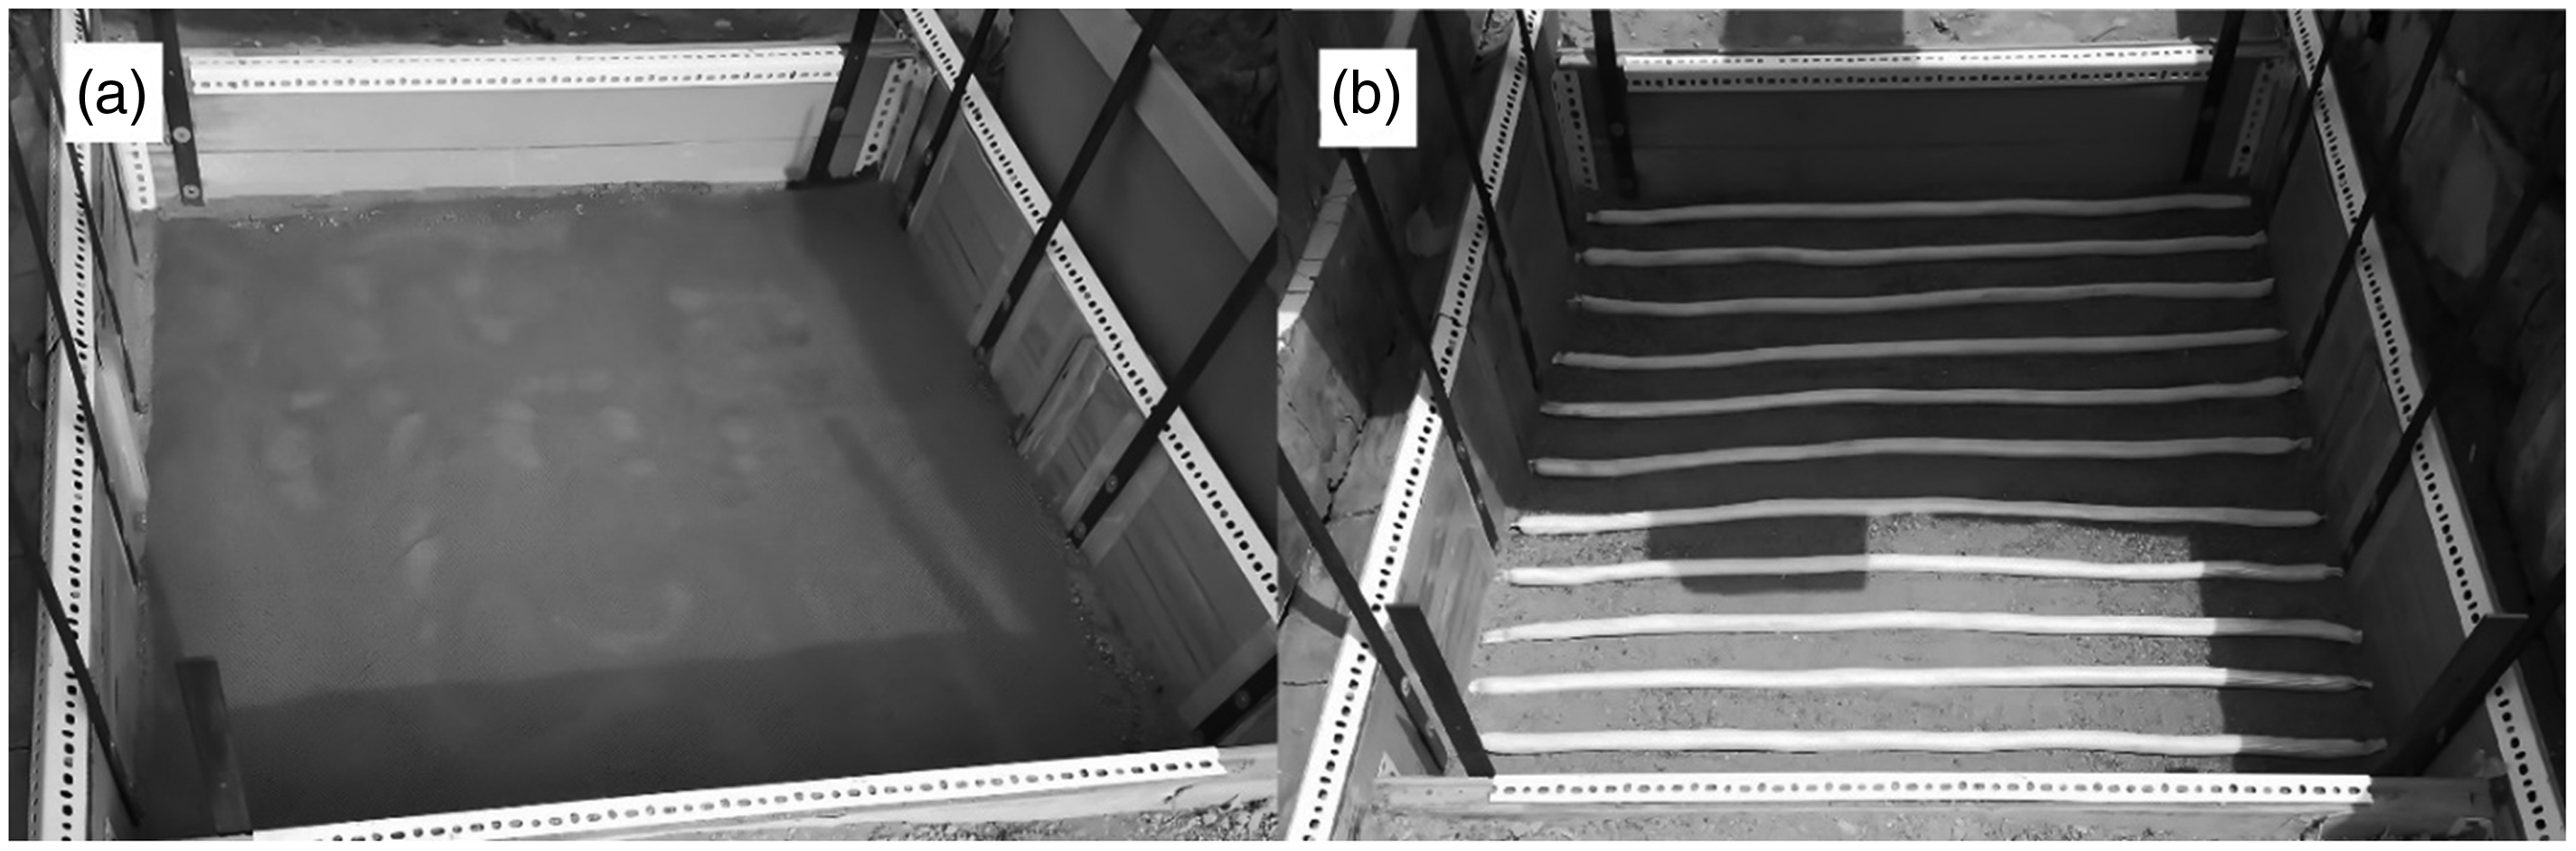
The layout of reinforcement layers in the plate load tests: (a) 3 cm diameter tubular braid and geogrid, (b) planar reinforcements, and (c) the 5 cm diameter tubular braid and geogrid. The arrangement of (a) the planar reinforcement and (b) the tubular braid (or geogrid) in the plate load tests.
Results and discussion
Direct shear tests
Figure 12 illustrates the typical results of the direct shear tests for 25, 50, and 100 kPa of the vertical confining pressure in the form of shear stress versus horizontal displacement curves. According to this figure, all of the reinforced soils exhibited a greater peak shear stress, as compared to the unreinforced soil, showing the shear strength improvement of the reinforced soil. The obvious cause of this behavior was the horizontal component of the reinforcement tensile force (due to the shear deformation of the reinforcement element, as shown in Figure 6), which acted against the applied shear force to the soil sample. The schematic model shown in Figure 6 is similar to that of Athanasopoulos [29] and Infante et al. [30]. It was observed that using the tubular reinforcements led to the more increase in the peak shear stresses, in comparison to the similar planar reinforcements. For example, the use of the braid B1 in the tubular shape, in comparison to the planar form, increased the peak shear stress by 44%, 29%, and 18% for 25, 50, and 100 kPa of the vertical pressure, respectively. Moreover, in the samples with the planar reinforcements, a dilatant behavior was exhibited; there was an increase in the shear stress up to a maximum point; then, it was gradually decreased to the residual shear stress. On the other hand, in the samples containing the tubular reinforcements, there was no definite peak point and shear stress showed a gradual increase to the maximum value.
Shear behavior for the unreinforced and reinforced soil samples with the reinforcements B1 and GS for the normal stress of 25, 50, and 100 kPa.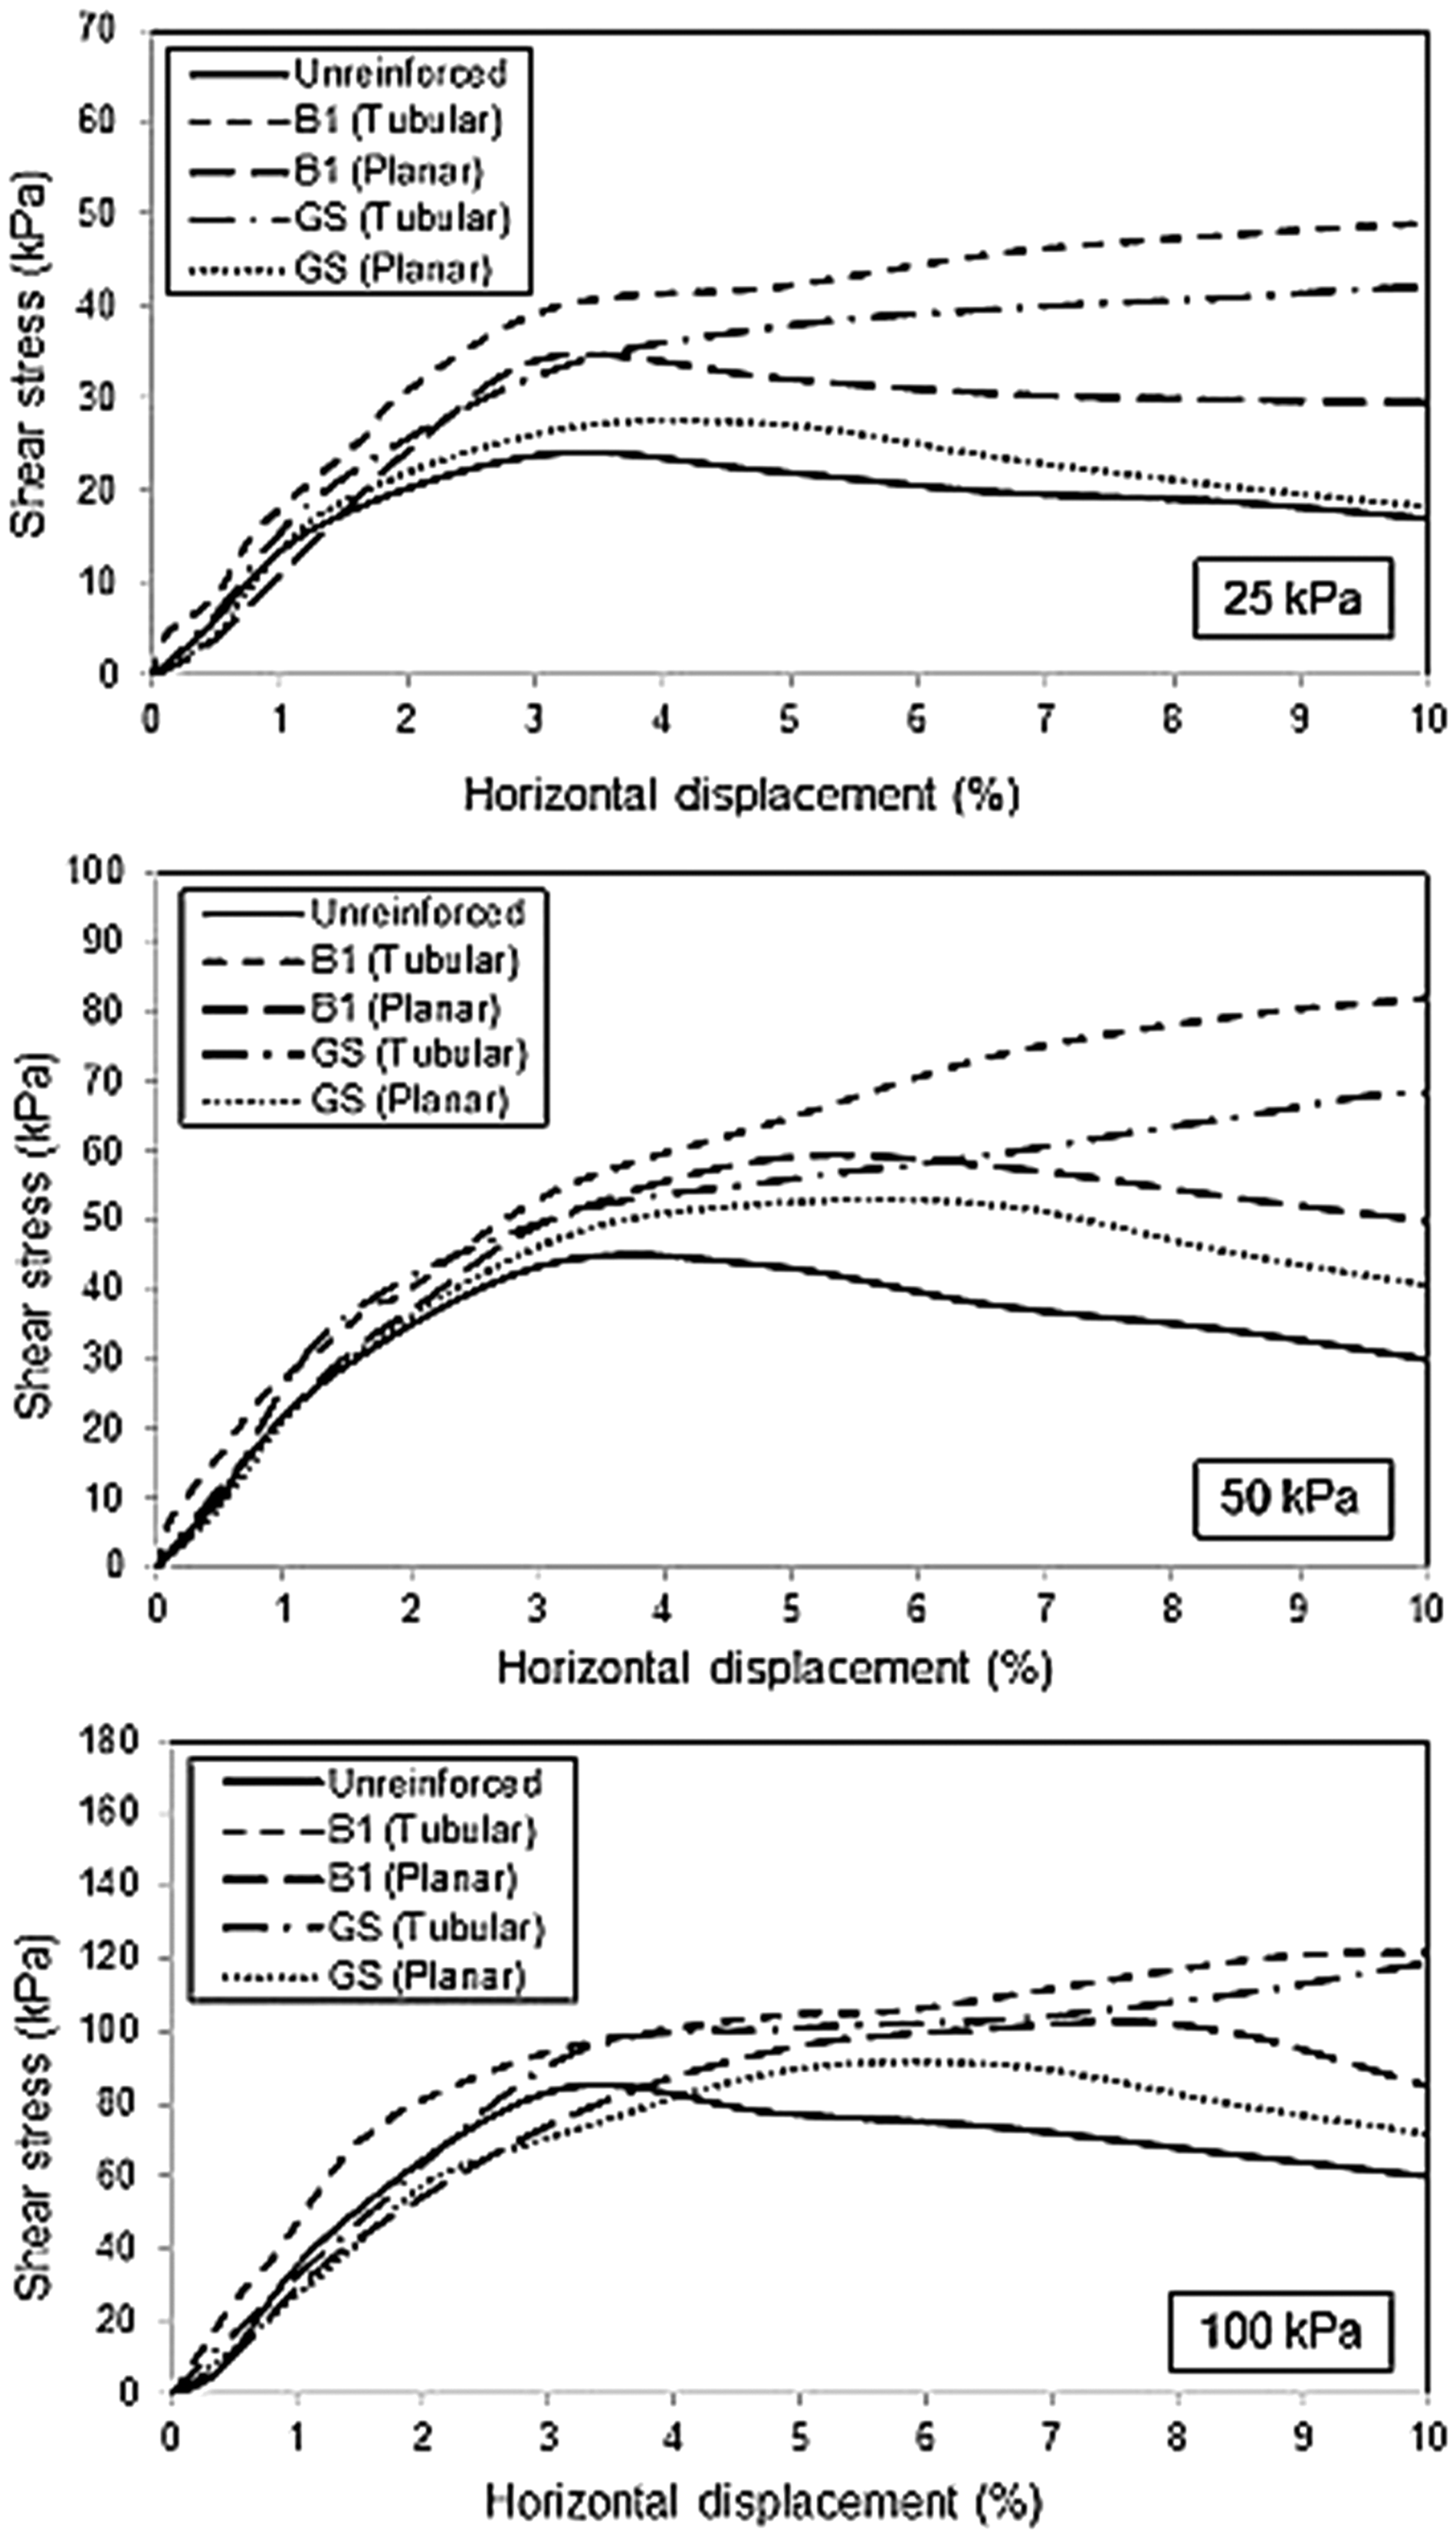
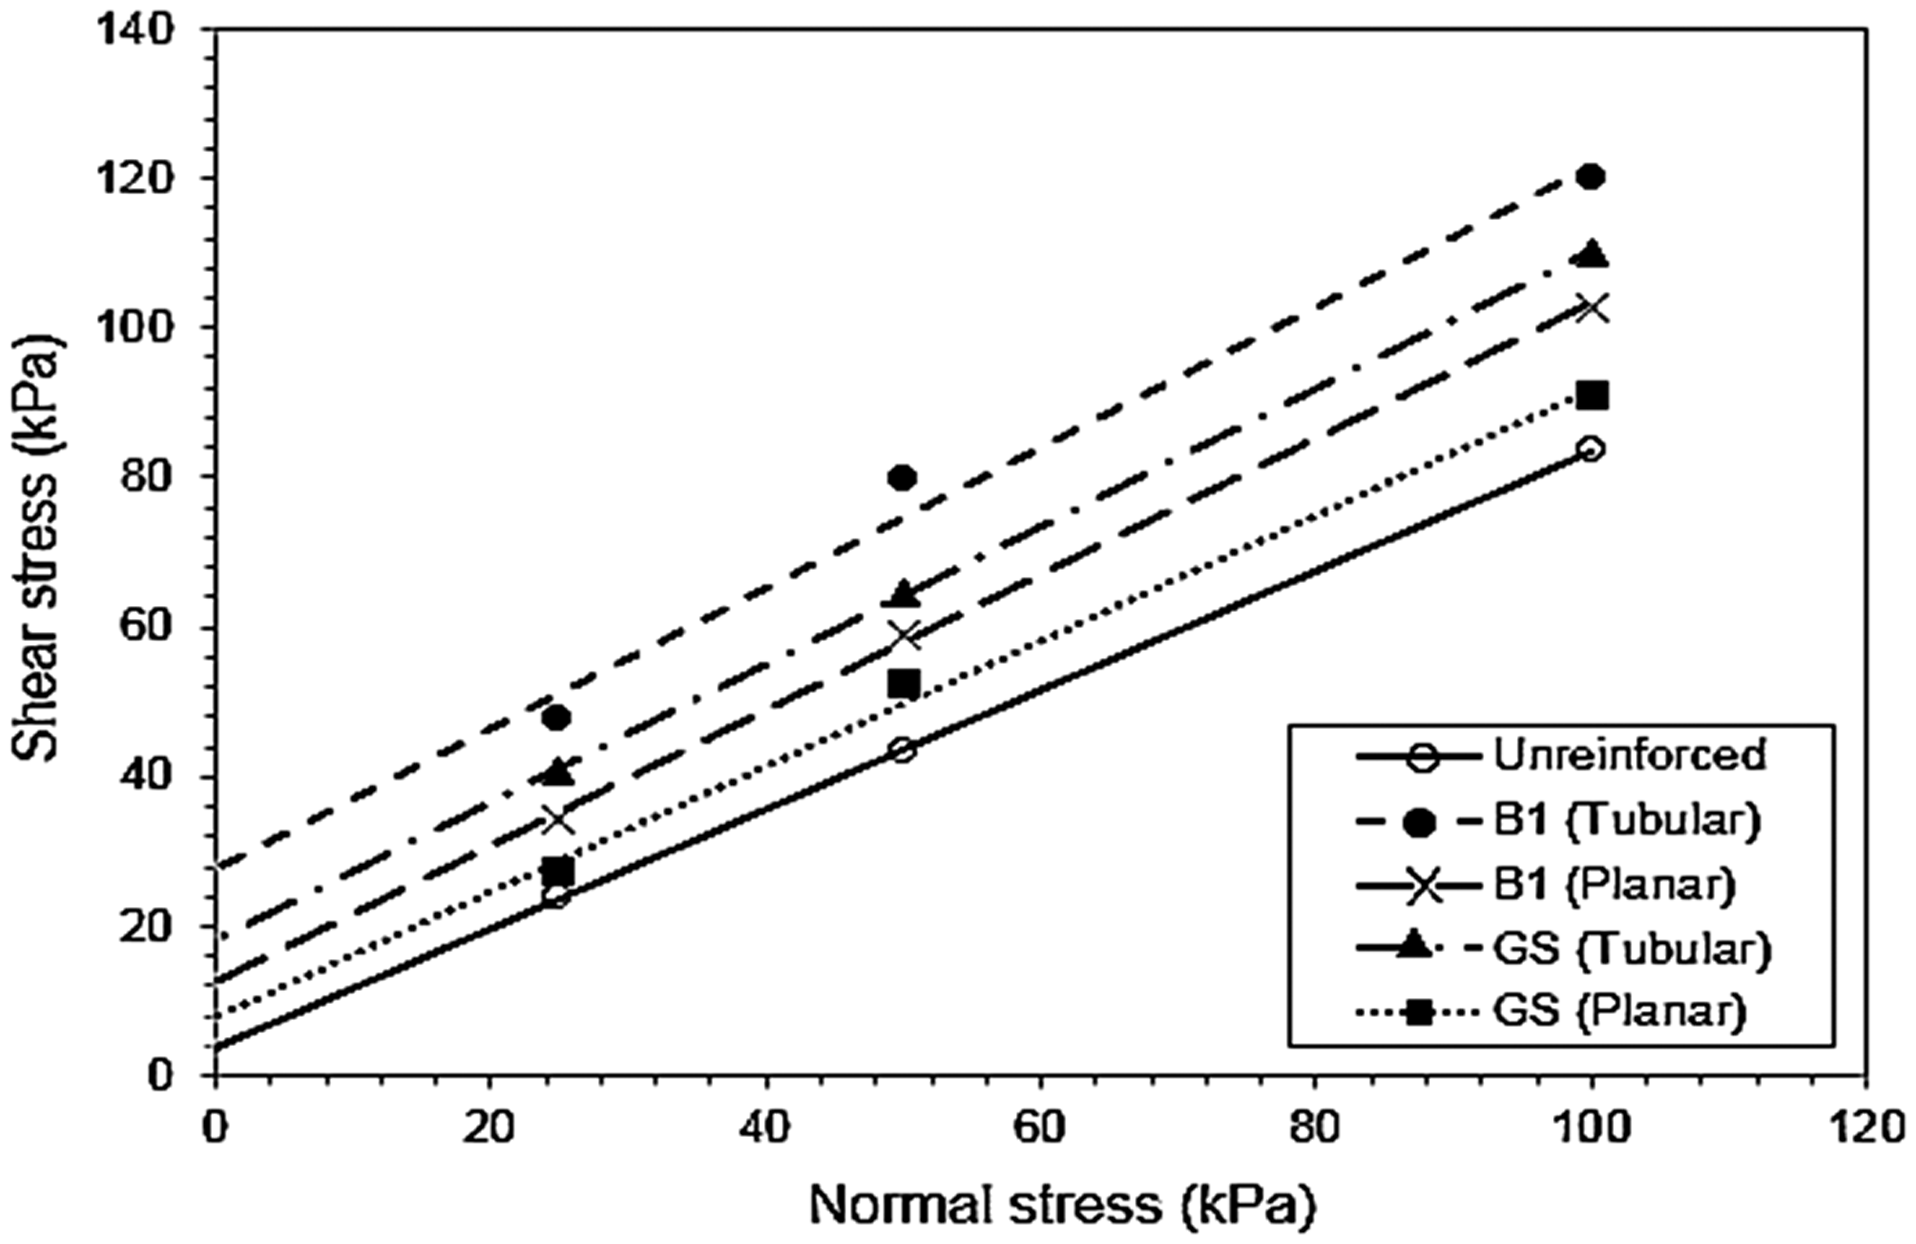
Figure 13 shows the linear shear failure envelopes in the direct shear tests based on the assumption that the shear strength of the geosynthetic-reinforced soil follows the Coulomb failure criterion [49]. In this study, shear failure envelopes were made by the linear regression calculation, using the values of the peak shear stress for all tests. The comparison of different envelopes showed the effect of reinforcement, and an apparent cohesion (y-intercept of failure line) occurred in the reinforced soil. More apparent cohesion was obtained for the samples reinforced by the tubular elements, which meant better performance of these samples. However, the peak apparent friction angle (failure line slope) was almost constant in all cases. The summary of direct shear test results is tabulated in Table 3. The peak shear stress, shear strength improvement ratio (Ci), apparent cohesion (Ca), and peak apparent friction angle (δa) of the reinforced soil and the difference percentage of these parameters for the tubular and planar geosynthetics are detailed in this table. According shown in this table, no significant difference in the soil apparent friction angle between tubular and planar reinforcements was found, and the variation in δa was less than 6.5%. In contrast to the peak friction angles, the values of Ca were much greater for the samples reinforced by the tubular elements. The maximum difference between the values of Ca for the two shapes of reinforcement was 127.5%. Shear strength improvement ratio at a specific normal stress (σn), as given in Table 3, is defined as [30]
Shear failure envelopes for the unreinforced and reinforced sand. Summary of the direct shear test results for the peak shear stress.

Pull-out tests
The axial pullout-displacement behavior of all reinforcements at different normal stresses is shown in Figure 14. This figure shows that there was a significant variation of peak axial pull-out resistance with the change in the reinforcement shape and the normal stress. For example, the rise of the normal stress from 5 to 10 kPa resulted in the increase of 1.9 and 1.8 times in the peak pull-out resistance and the corresponding displacement of the tubular braid B1, respectively. The planar reinforcements had a higher peak pull-out resistance in comparison to the tubular form of the same reinforcement, at the same normal stress. For example, the peak pull-out resistance of planar reinforcements was in the range of 1.6 to 2.3 times of the peak pull-out resistance of the same materials in the tubular form, at the 5 kPa normal stress. Therefore, the results illustrated the better performance of the planar reinforcement layers in pull-out mechanism, as compared to the tubular form of the same reinforcement.
Axial pullout-displacement response of the reinforcements B1, B2, and GS in the pull-out tests.
For the planar-shaped reinforcements, the following relation can be used to compute the peak shear stress in the pull-out test (τpm) based on the Mohr-Coulomb failure criterion [49]
Pull-out envelopes of the reinforcements B1, B2, and GS.


The soil–geosynthetic interaction coefficient (f *) at a specific normal stress can be simply stated by the following relation [49]
The results of the pull-out tests.

It should be noted that, since the two ends of the tubular braids containing the encapsulated soil were sewed, the inside enclosed soil had to move together with the pulled tubular element during the test. Therefore, it could be assumed that just the external surface of the tubular reinforcement had frictional interaction with the surrounding soil and the pull-out resistance was mobilized only on the external surface of these elements. This behavior was unlike the function of the planar reinforcement, which assumes that both sides of a buried sheet or plate have frictional interaction with the surrounding soil due to its relative movement inside the soil. Such a behavior was according to the observations made during the plate load tests (“Plate load tests” section). After completing the plate load tests, it was observed that the confined soil inside the tubular elements moved together with the reinforcement due to the high length to diameter ratio of the tubular reinforcement elements. The other reason for the higher pull-out resistance of planar reinforcements was the stress distribution conditions on the reinforcement surfaces. In the planar form, both sides of the layer surface were approximately under uniform and identical soil pressure [49], while the vertical soil stress distribution along a buried flexible tube-shaped element can be relatively nonuniform [50].
Stress control tests
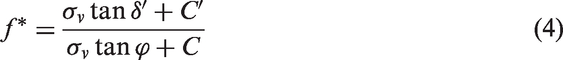
The results of the first series of stress control experiments (Figure 8) are given in Figure 16(a). In this figure, the variations of the applied pressure on the surface of the soil specimens versus the stress measured by the sensor SPC1 in the reinforced and unreinforced samples are shown. From the results, it has been observed that the compressive stress levels created in the encapsulated soil inside the tubular reinforcements were more than the stress value in the unreinforced soil mass and the difference between the two conditions increased steadily with enhancing the applied pressure. Figure 16(b) shows the variation of the pressure improvement factor (Ip) against the applied pressure. This dimensionless parameter is the ratio of the measured stress inside the tubular elements to the measured stress in the unreinforced soil sample (at the same depth and position). It could be again observed that by increasing the level of the applied stress in the soil, the pressure improvement factor was also enhanced; therefore, for the applied pressure level of 300 kPa, the stress levels inside the braids B1 and B2 were up to 60% more than those inside the unreinforced soil mass (Ip = 1.6). This value for the tube-shaped GS geogrid was 25% (Ip = 1.25).
(a) The results of the first series of stress control tests, and (b) variations of the pressure improvement factor.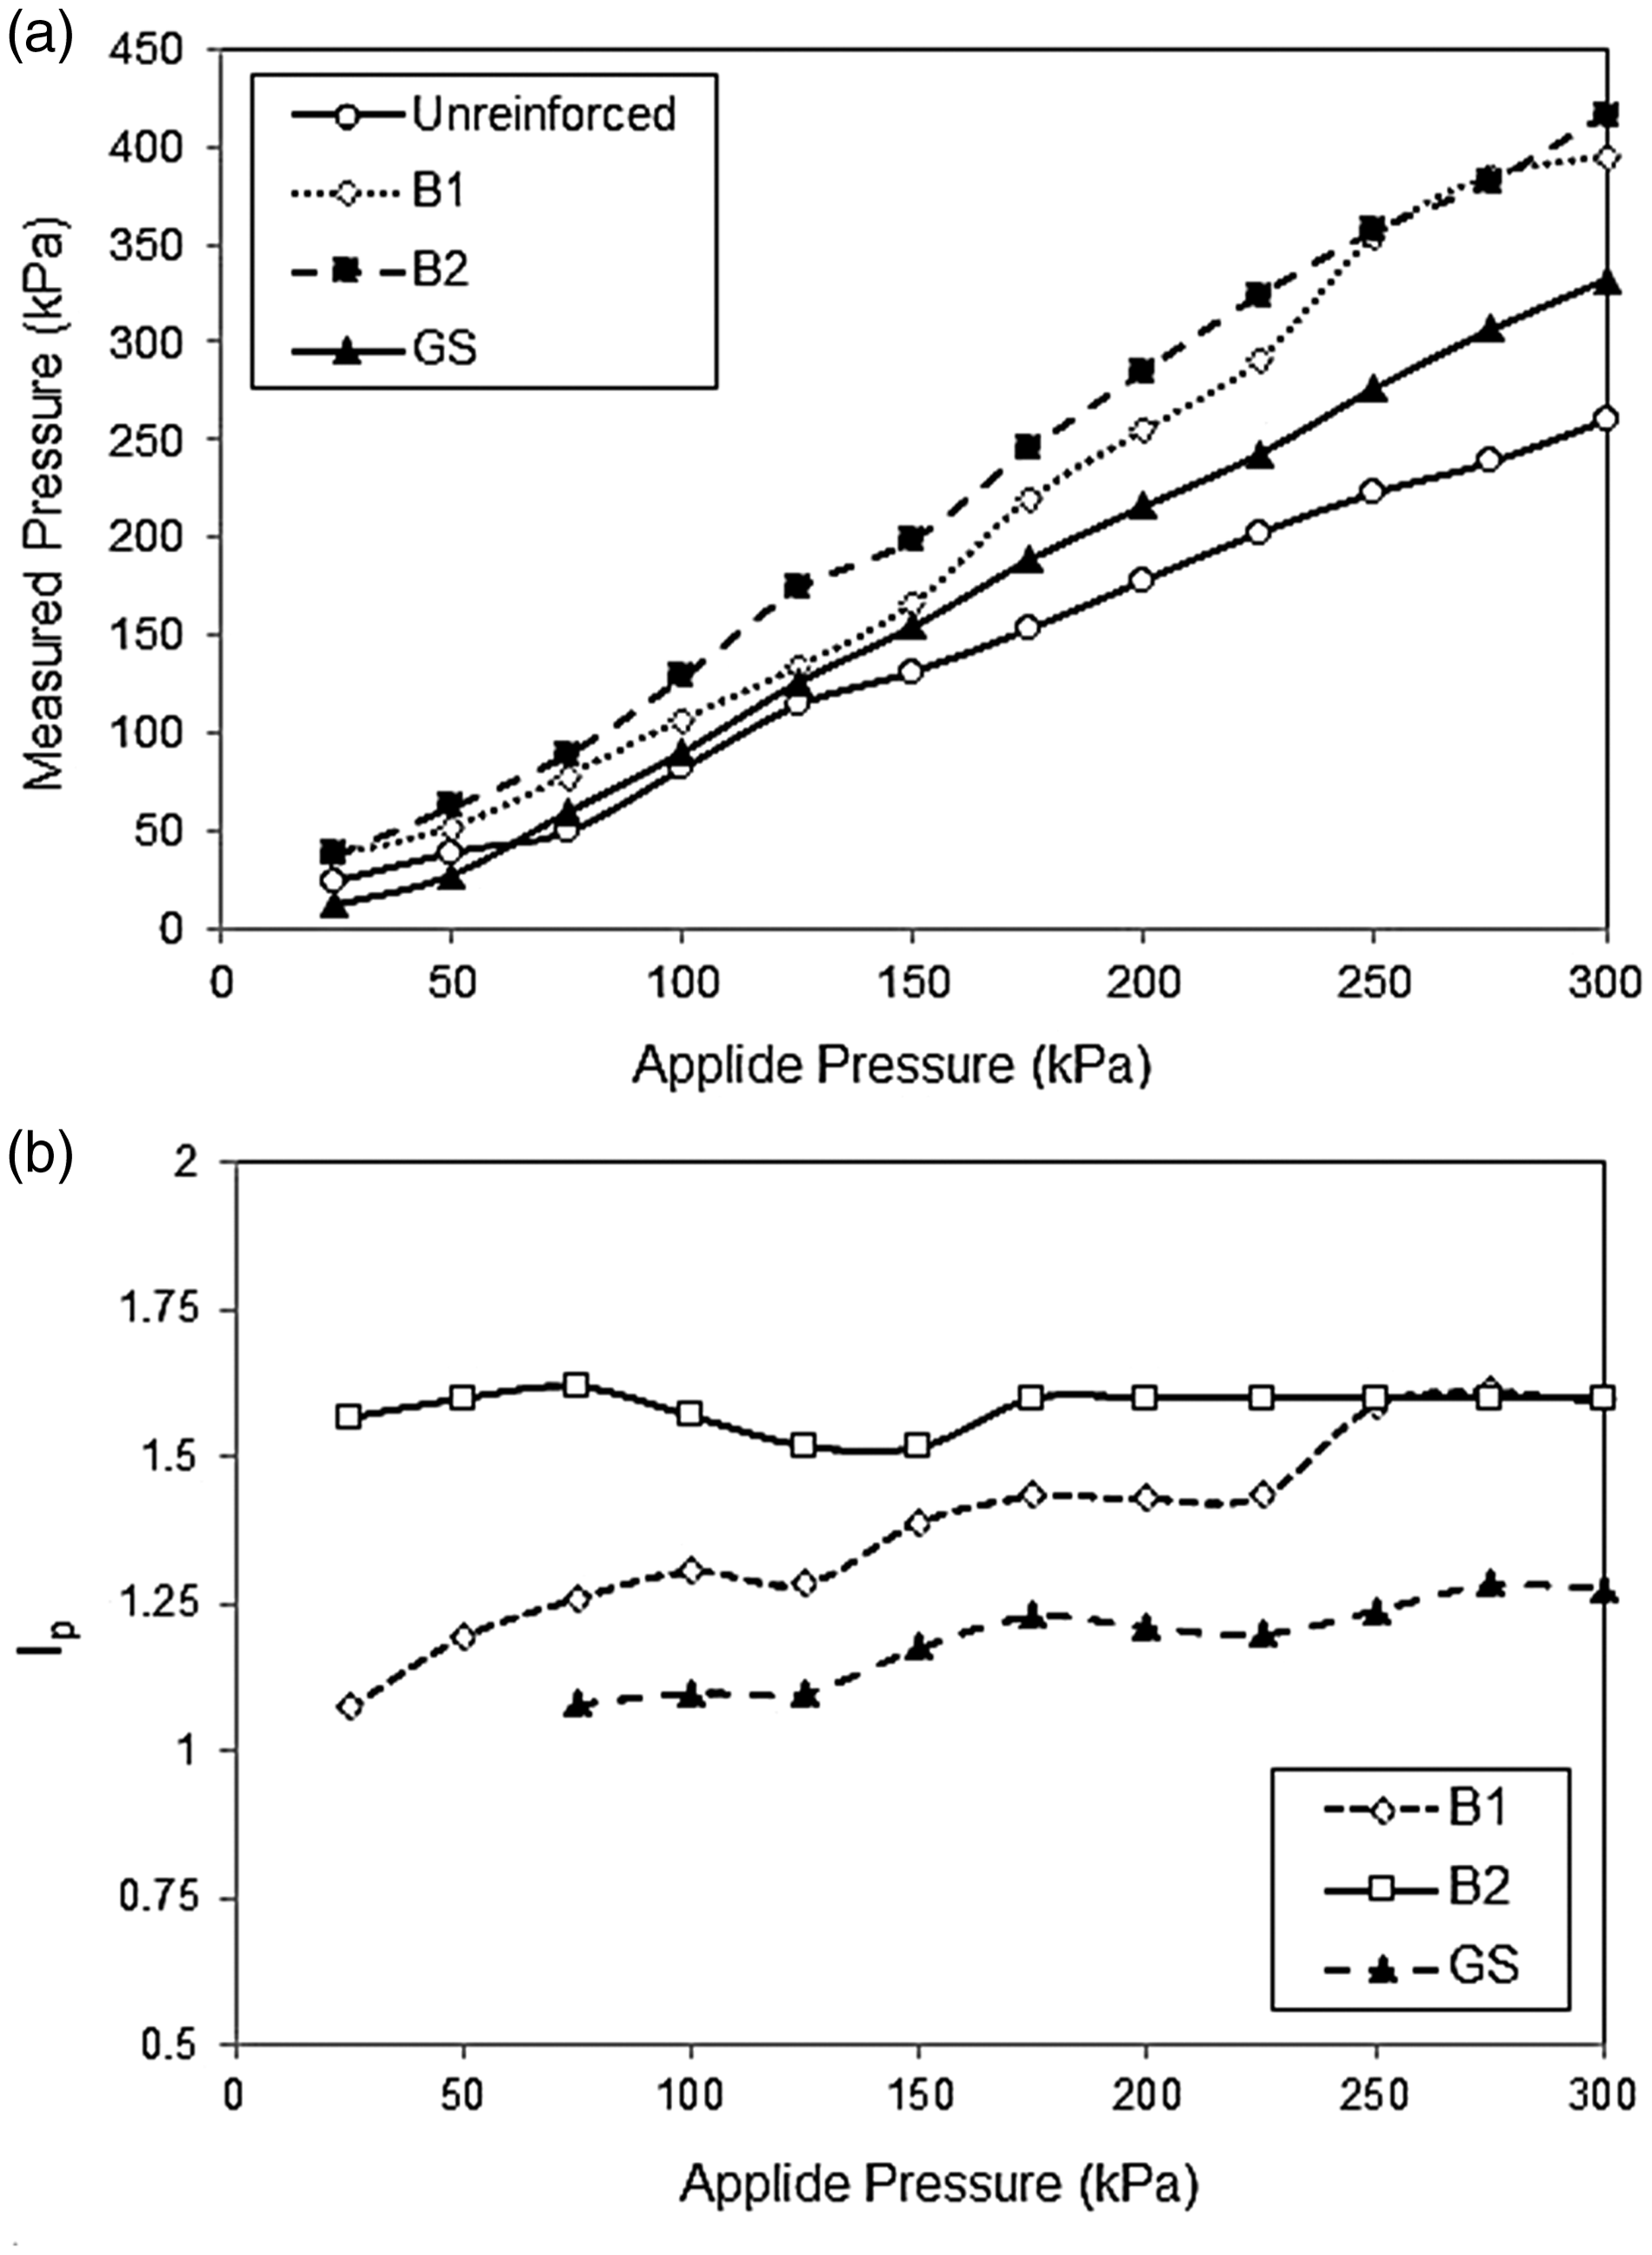
These results were due to the full soil confinement feature within the tubular reinforcements that induced the membrane tensile force in the tubular elements and the excessive compressive pressure in the enclosed soil by preventing the lateral movement of the encapsulated soil particles. According to the mechanism E in Figure 3, this internal stress could act as an upward resistance force against the imposed footing forces and displacements in the bed and improve the performance of footing. It is evident that similar to this function, this is not the case for the common planar reinforcement due to the lack of full physical confinement inside the soil volume [51]. Similar results have been reported by Matsuoka and Liu [51] for the stress state of encapsulated soil inside polymeric membranes. These researchers have also proposed analytical model for soil compressive stress calculation inside a 2D membrane [51].
It could also be noted that the braid B2 exhibited higher Ip values and the tube-shaped GS geogrid exhibited the lower Ip values. The braid B2 without apertures had more tensile strength than the other used reinforcements, while the GS geogrid had the least tensile strength and the largest aperture size. With this observation, it could be stated that the tensile strength and the aperture size of the reinforcements played a significant role in the mobilized internal pressure values inside the tube-shaped reinforcements.
The results of the second series of stress control experiments are shown in Figure 17. Figure 17(a) is the outputs of the sensor SPC2 at the depth of 5 cm in the unreinforced sample (Figure 9(c)). In Figure 17(b), the outputs of the sensor SPC1 at the depth of 10 cm beneath the loading plate in all samples are shown (Figure 9). These figures demonstrate the variation of the measured stress against the applied footing pressure inside the sand box. For comparison, the vertical stress predicted from the Boussinesq’s theorem is also shown in these two diagrams [52]. Although the hypotheses of the Boussinesq’s theorem for stress field in a semi-infinite, isotropic, and linear elastic soil are different from the actual soil behavior, boundary condition, and stress regime in the tests, if the Boussinesq values are considered as a reference case to compare the results obtained from the tests, the following conclusions can be obtained.
Variation of the transferred pressure with applied pressure on the bearing plate surface at different depths of soil: (a) 5 cm and (b) 10 cm.
According to Figure 17(a), at low applied stresses (less than 300 kPa), the response of the unreinforced soil seemed to be close to the predictions of the reference case. Nonetheless, by raising the applied stresses on the footing model, the difference between the measured stresses in the unreinforced soil and the reference case was increased. According to Figure 17(b), it could be seen that at high applied stress levels, the measured stress values at the depth of 10 cm in the unreinforced soil were more than the predicted levels. This behavior indicates the localized failure inside the unreinforced sample that caused the pass of the applied stress deeper into the soil sample, in comparison with the reference case. Due to the punching shear failure of the unreinforced sample at an applied pressure of about 700 kPa, the unreinforced soil graphs in Figure 17(a) and (b) did not continue to the high-stress levels. As can be seen in Figure 17(b), by adding a reinforcement layer in the soil mass, the values of the measured pressure in the depth of soil were greatly reduced in comparison to the unreinforced soil and the reference case. For example, we note a 62% decrease of the transferred pressure for the tubular braid and 39% decrease of that for the planar reinforcement, as compared with the stress in the unreinforced sample for the applied pressure of 700 kPa. This response indicated the better load spreading over a wider area and the stress redistribution inside the reinforced soil samples which could reduce the shear stress, prevent localized failure, and ensure the better performance at all applied bearing stress levels. For the samples reinforced by the tubular braid, the much more efficient load spreading deeper in the soil could be seen, as compared to the soil reinforced by the planar reinforcement, showing that the soil experienced much smaller vertical pressure gradients (with a lower level and more uniformity across the soil).
The pressure distribution angle of the circular bearing plate at the level of i inside the soil could be computed by assuming the conical spreading of pressure across the depth of soil bed as follows [3]
Variation of stress distribution angle at the depth of 10 cm.
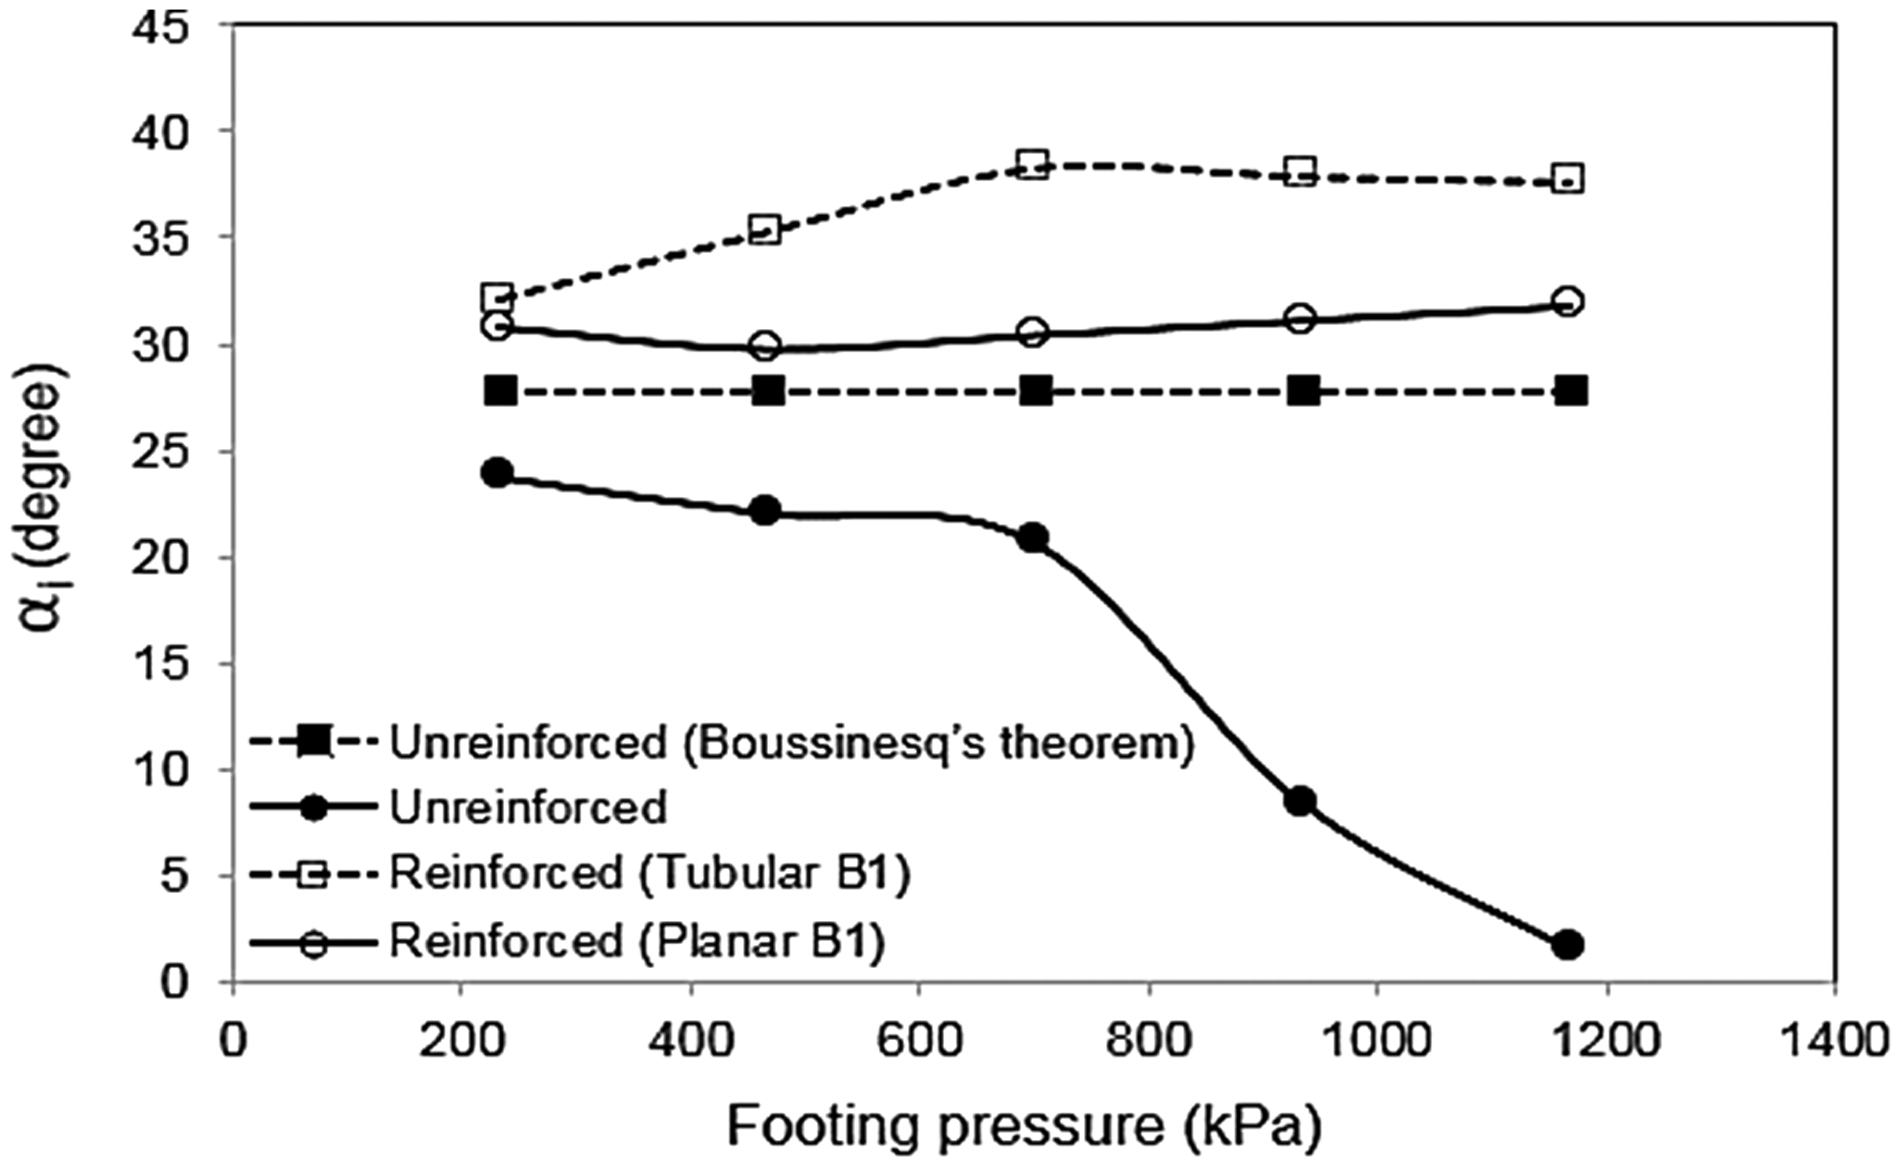
Plate load tests
The general results of the plate load tests are presented in the form of pressure-settlement curves of the bearing plate in Figure 19. It could be seen that there was a local shear failure behavior in all tests, which caused the pressure-settlement curves not to be maximized in any points; there was always an increase in the slope of the curves. It could also be observed that in the reinforced beds, both the bearing pressure at a specified settlement and the stiffness of footing bed (inverse of the curve slope) increased substantially, as compared to the unreinforced bed. Similarly, the settlement of footing resting on the reinforced bed at a given bearing pressure decreased considerably.
Variation of the applied bearing pressure with the footing settlement in the plate load tests.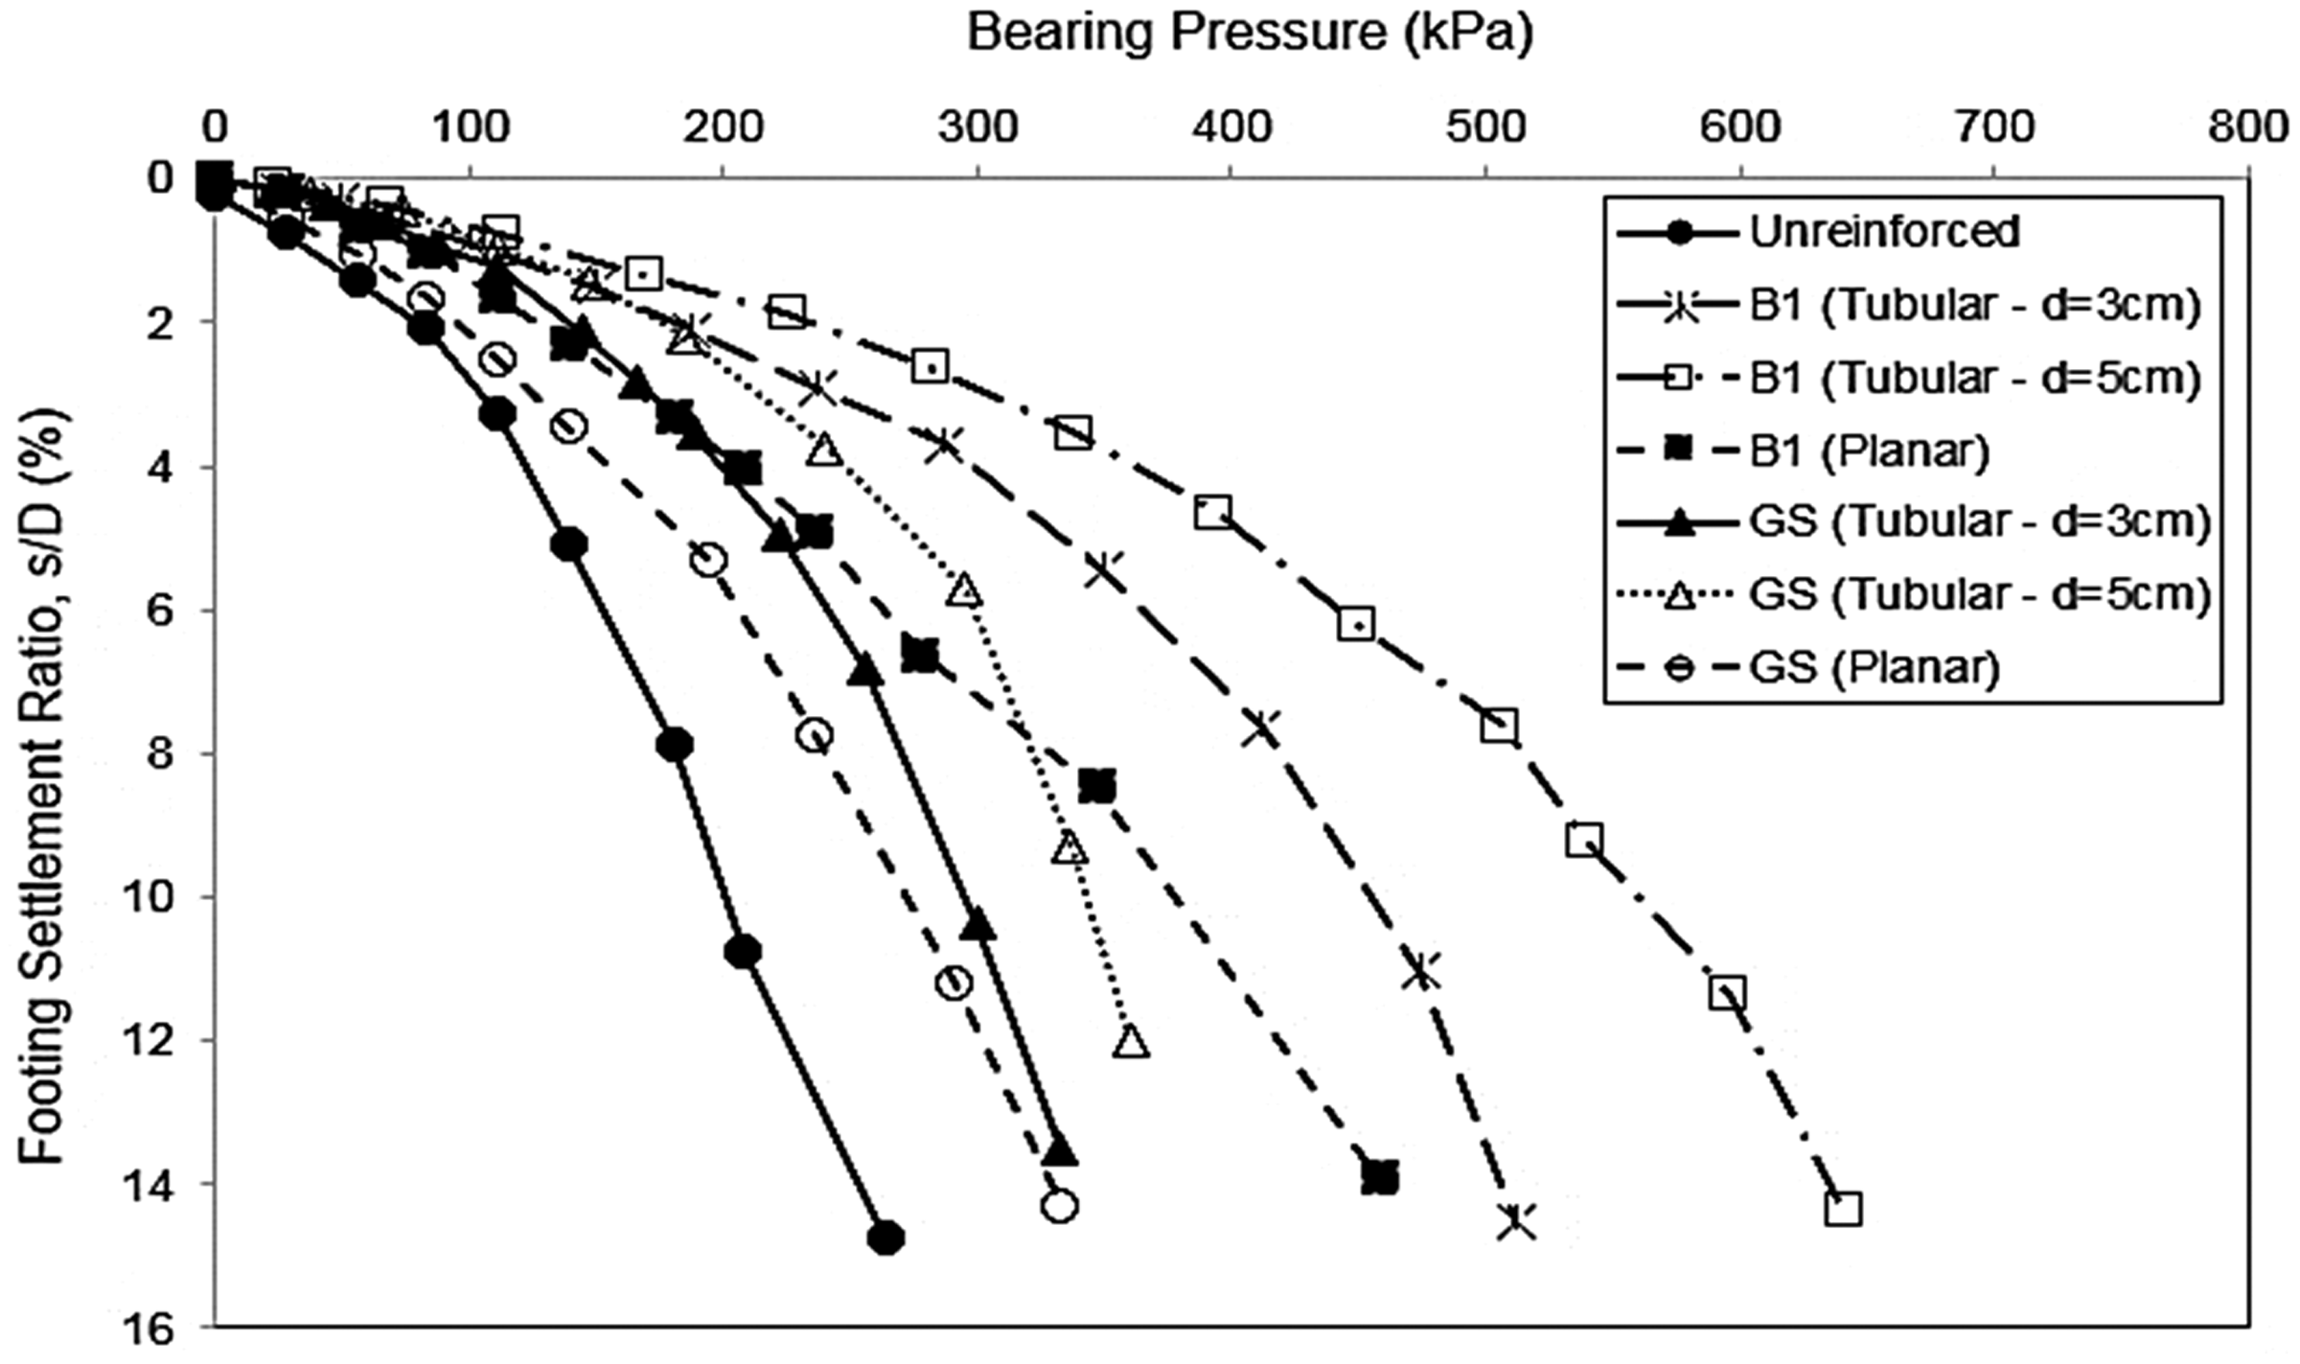
The results of the plate load tests.
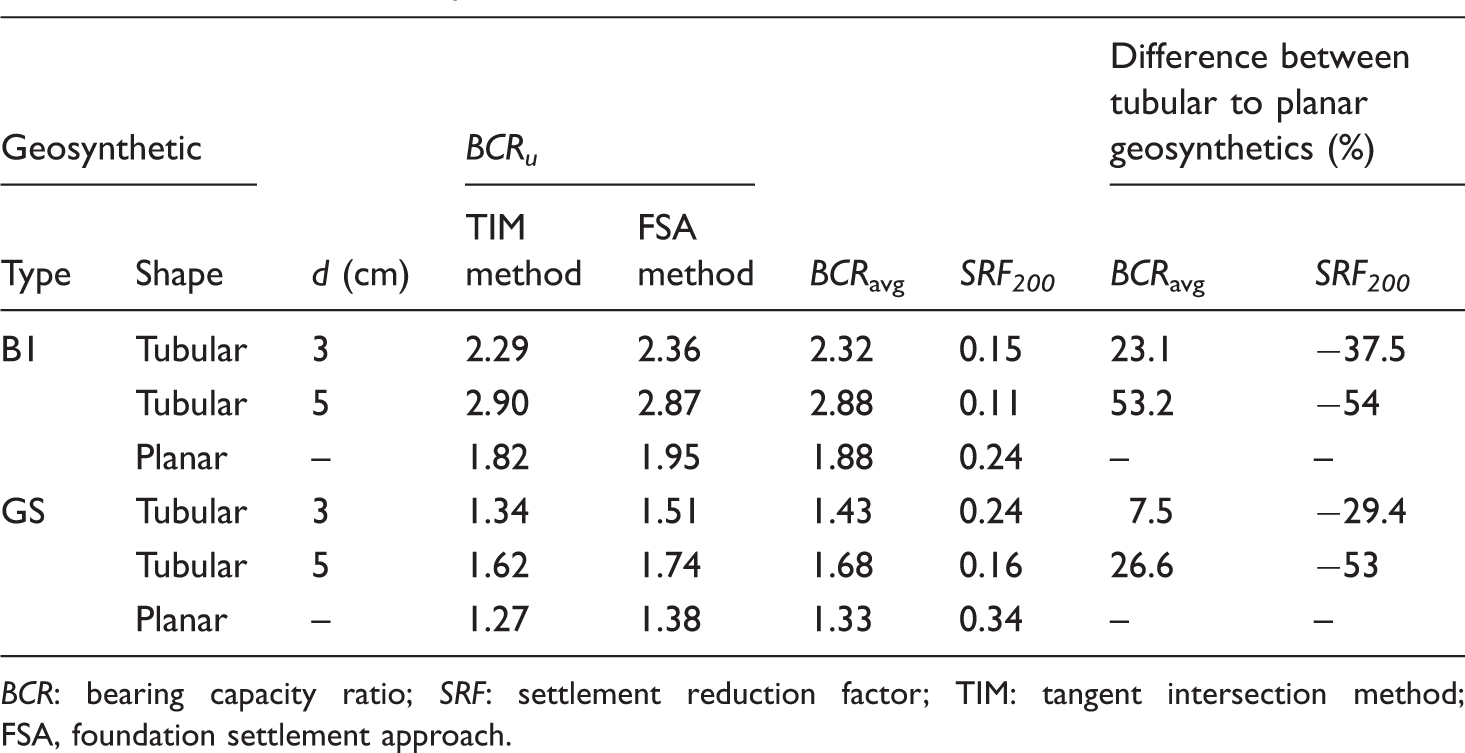
BCR: bearing capacity ratio; SRF: settlement reduction factor; TIM: tangent intersection method; FSA, foundation settlement approach.
The improvement of the reinforced sand beds, in terms of the reduction in footing settlement could be quantified through the dimensionless parameter settlement reduction factor (SRF) [12], which is defined as the ratio of the settlement of the reinforced sand bed at a given pressure to the settlement of the unreinforced bed at the same pressure level. The further reduction of this parameter means less settlement and better performance of the soil bed. According to Figure 19, since the maximum bearing pressure range in the unreinforced soil was about 200–240 kPa, the SRF ratio was estimated, which corresponded to the bearing pressure of 200 kPa, as shown by the symbol SRF200 in Table 5. It could be seen that for the tubular braid B1, the SRF200 ratio was decreased in the range of 38% to 54% and for the tube-shaped GS geogrid, while this ratio was decreased in the range of 29% to 53%, as compared to the similar cases reinforced by the planar layers. These results showed the better performance of the tubular reinforcements in the sand beds with regard to the reduction in the footing settlement. Again, it could be seen that the SRF200 ratio generally showed a decrease with an increase in the diameter of the tube-shaped reinforcements, showing the better performance of the tubular braids with a bigger diameter and the larger volume of the enclosed soil inside the elements.
A comparison between previous studies and the current study.

Unified soil classification system. SP: poorly graded sand; SW: well-graded sand.
Soil relative density.
Longitudinal stiffness of reinforcement.
Reinforcement shape.
Shear strength improvement ratio.
Apparent cohesion of reinforced soil.
Cohesion of unreinforced soil.
Peak apparent friction angle of reinforced soil.
Friction angle of unreinforced soil.
Average mesh aperture size of reinforcement.
Medium grain size of soil particles.
Interfacial friction angle.
Soil–geosynthetic interaction coefficient.
Footing shape.
Average of pressure distribution angle under the first reinforcement layer.
Average of pressure distribution angle in unreinforced soil.
Generally, this research could provide some insights into the feasibility of using tubular braid structures as a new type of soil reinforcing fabric and the application of the tubular form of common reinforcements like geogrid instead of the planar form for the soil reinforcement in the field use. It should be noted that these results were obtained for a limited number of braids and one type of soil. Thus, the limitations should be considered before using the results. Also, the results can be considered to be only qualitative due to the scale effects of the experimental model tests. A comprehensive case study of braid performance in full-scale field trials can be suitable for realistic evaluation of braid usage in practical applications.
Conclusions
This paper presents the performance of tubular braid fabrics as a new kind of soil reinforcing materials in sand environment. A number of soil–braid interaction mechanisms were introduced in this study and the response of the tubular geotextile (with braid structure) was investigated in these mechanisms. Also, the performance of this type of material was compared with that of the conventional planar reinforcements (with similar materials, properties, textures, and areal densities). Based on the introduced interaction mechanisms, some interaction element tests such as the direct shear tests, the pull-out tests, and the soil stress control tests were conducted in the unreinforced and reinforced sand with the tubular and planar forms of geotextile. Also, the overall performance of the reinforced foundation bed with the planar and tubular reinforcements was evaluated through a series of standard plate load tests to assess the resulting bearing pressure and the settlement of footing models. According to the results, the performance and the enhancement effect of the tubular braid structures or tubular reinforcement in all tests, except the case of pull-out mechanism, were found to be better than that of the similar typical planar reinforcement. The results suggested that tubular braid resulted in the enhanced sand shear strength (especially the apparent cohesion of the reinforced soil composites), mobilization of the excess compressive stress in the enclosed soil inside the tubular braids (due to the soil confinement ability of the tubular braids), and reduction in the vertical stress level of the footing model transferred down through the soil bed (or increase of the pressure distribution angle). It was also found that the tubular braid elements inside a reinforced foundation bed resulted in more increase of the average bearing capacity, more increase of the stiffness of the footing bed, and more reduction in the footing settlement, in comparison to the similar planar reinforcement layers. Therefore, for the same amount of the reinforcement used, the tubular shape offered a much better overall performance, as compared to the 2D planar form.
Footnotes
Declaration of conflicting interests
The author(s) declared no potential conflicts of interest with respect to the research, authorship, and/or publication of this article.
Funding
The author(s) received no financial support for the research, authorship, and/or publication of this article.