
Abstract
In this paper, the principal component analysis was performed on infrared spectral data, which included 60 groups of cattle and horse hair surfaces and 60 groups of cattle and horse flesh surfaces, respectively, by using SPSS 22. Using 100 sets of data as modelling samples (50 sets of cattle fur and horse fur), the multi-class discriminant analysis was carried out by using SPSS, the typical discriminant function and class function of cattle fur and horse fur were established and the back substitution verification was carried out. The typical discriminant function and the class function of cattle fur and horse fur were verified by 20 sets of data validation samples (10 groups of cattle fur and horse fur). The results show that the principal component analysis can reduce the dimension effectively, reduce the hair surfaces spectra from 2696 wavelength variables to nine wavelength variables and decrease the flesh surfaces spectra from 2696 wavelength variables to 13 wavelength variables. The cumulative contribution rate of the new wavelength variables is up to 99.89 and 99.88%, respectively. The back substitution accuracy rate of the typical discriminant function is 100%, and the verification accuracy rate is 100%. From the clustering graph, the established class function of cattle fur and horse fur back substitution clustering is well, and the correct clustering rate of the verification clustering graph is 100%.
Keywords
Introduction
In China, there are 14 orders, 52 families and 510 species of mammals, of which more than 90 are fur animals. It is the world's leading wild fur producer and exporter [1]. In recent years, fur material disputes and product material identification issues have become prominent increasingly. How to identify the fur types easily and accurately has always been the focus of quality inspection departments and consumers.
However, there is no standard for the identification of fur materials. From the literatures of various countries in the world, the traditional sensory testing methods are used to identify the types of animal fur. Testers check the characteristics of products through visual and tactile sensations and identify them through the sensory analyses. This method requires inspectors to have an in-depth understanding of the characteristics of various furs and has plenty of practical experience. But even so, it is error-prone (such as horse fur and cattle fur) extremely when it comes to the material identification of the easy-confused furs. Therefore, it has become a top priority to explore a scientific, accurate and efficient method for identifying fur materials.
Principal component analysis (PCA) uses the principle of maximum variance to normalize the independent variables contained in the extracted data information and eliminates the overlapping information to achieve dimensionality reduction. It is often used for the data processing of modern analytical methods [2] such as spectroscopy and mass spectrometry. At present, PCA technology can be used to identify explosives [3], mixed fuels [4], tea [5], milk [6], edible oils [7], Chinese herbal medicines [8], Mandarin varieties [9], cork origins [10], azalea [11], etc. There are many reports on them. In addition, the research on different parts of Korean ginseng [12] and tea aroma [13] has been reported frequently. It can be seen that the use of PCA technology for identification research has become a focused topic. The multi-class discriminant analysis method is a statistical analysis method that combines the functions of ‘effective feature selection and state recognition’ [14], and it has also been studied and reported in various fields. However, whether it is PCA or multi-class discriminant analysis, its application and research in the fields of fur material identification has been reported rarely, but its research in other fields has provided a reference for the field of fur material identification. In fact, the combination of multi-class discrimination and PCA for identification studies is particularly effective. At present, researchers have used both to study the origin of Boletus edulis [15], peach varieties [16] and calamine grades [17] and have achieved good results. In this paper, PCA and multi-class discrimination methods were combined to study the infrared spectral data of hair surface fur and flesh surface fur obtained by Fourier transform infrared spectrometer separately, so as to achieve the purpose of accurate and non-destructive identification of easy-confused fur, and the good results have been achieved. The schematic diagram of its research method is shown in Figure 1.
The schematic diagram of PCA and multi-class discrimination against the combination to identify easy-confused fur.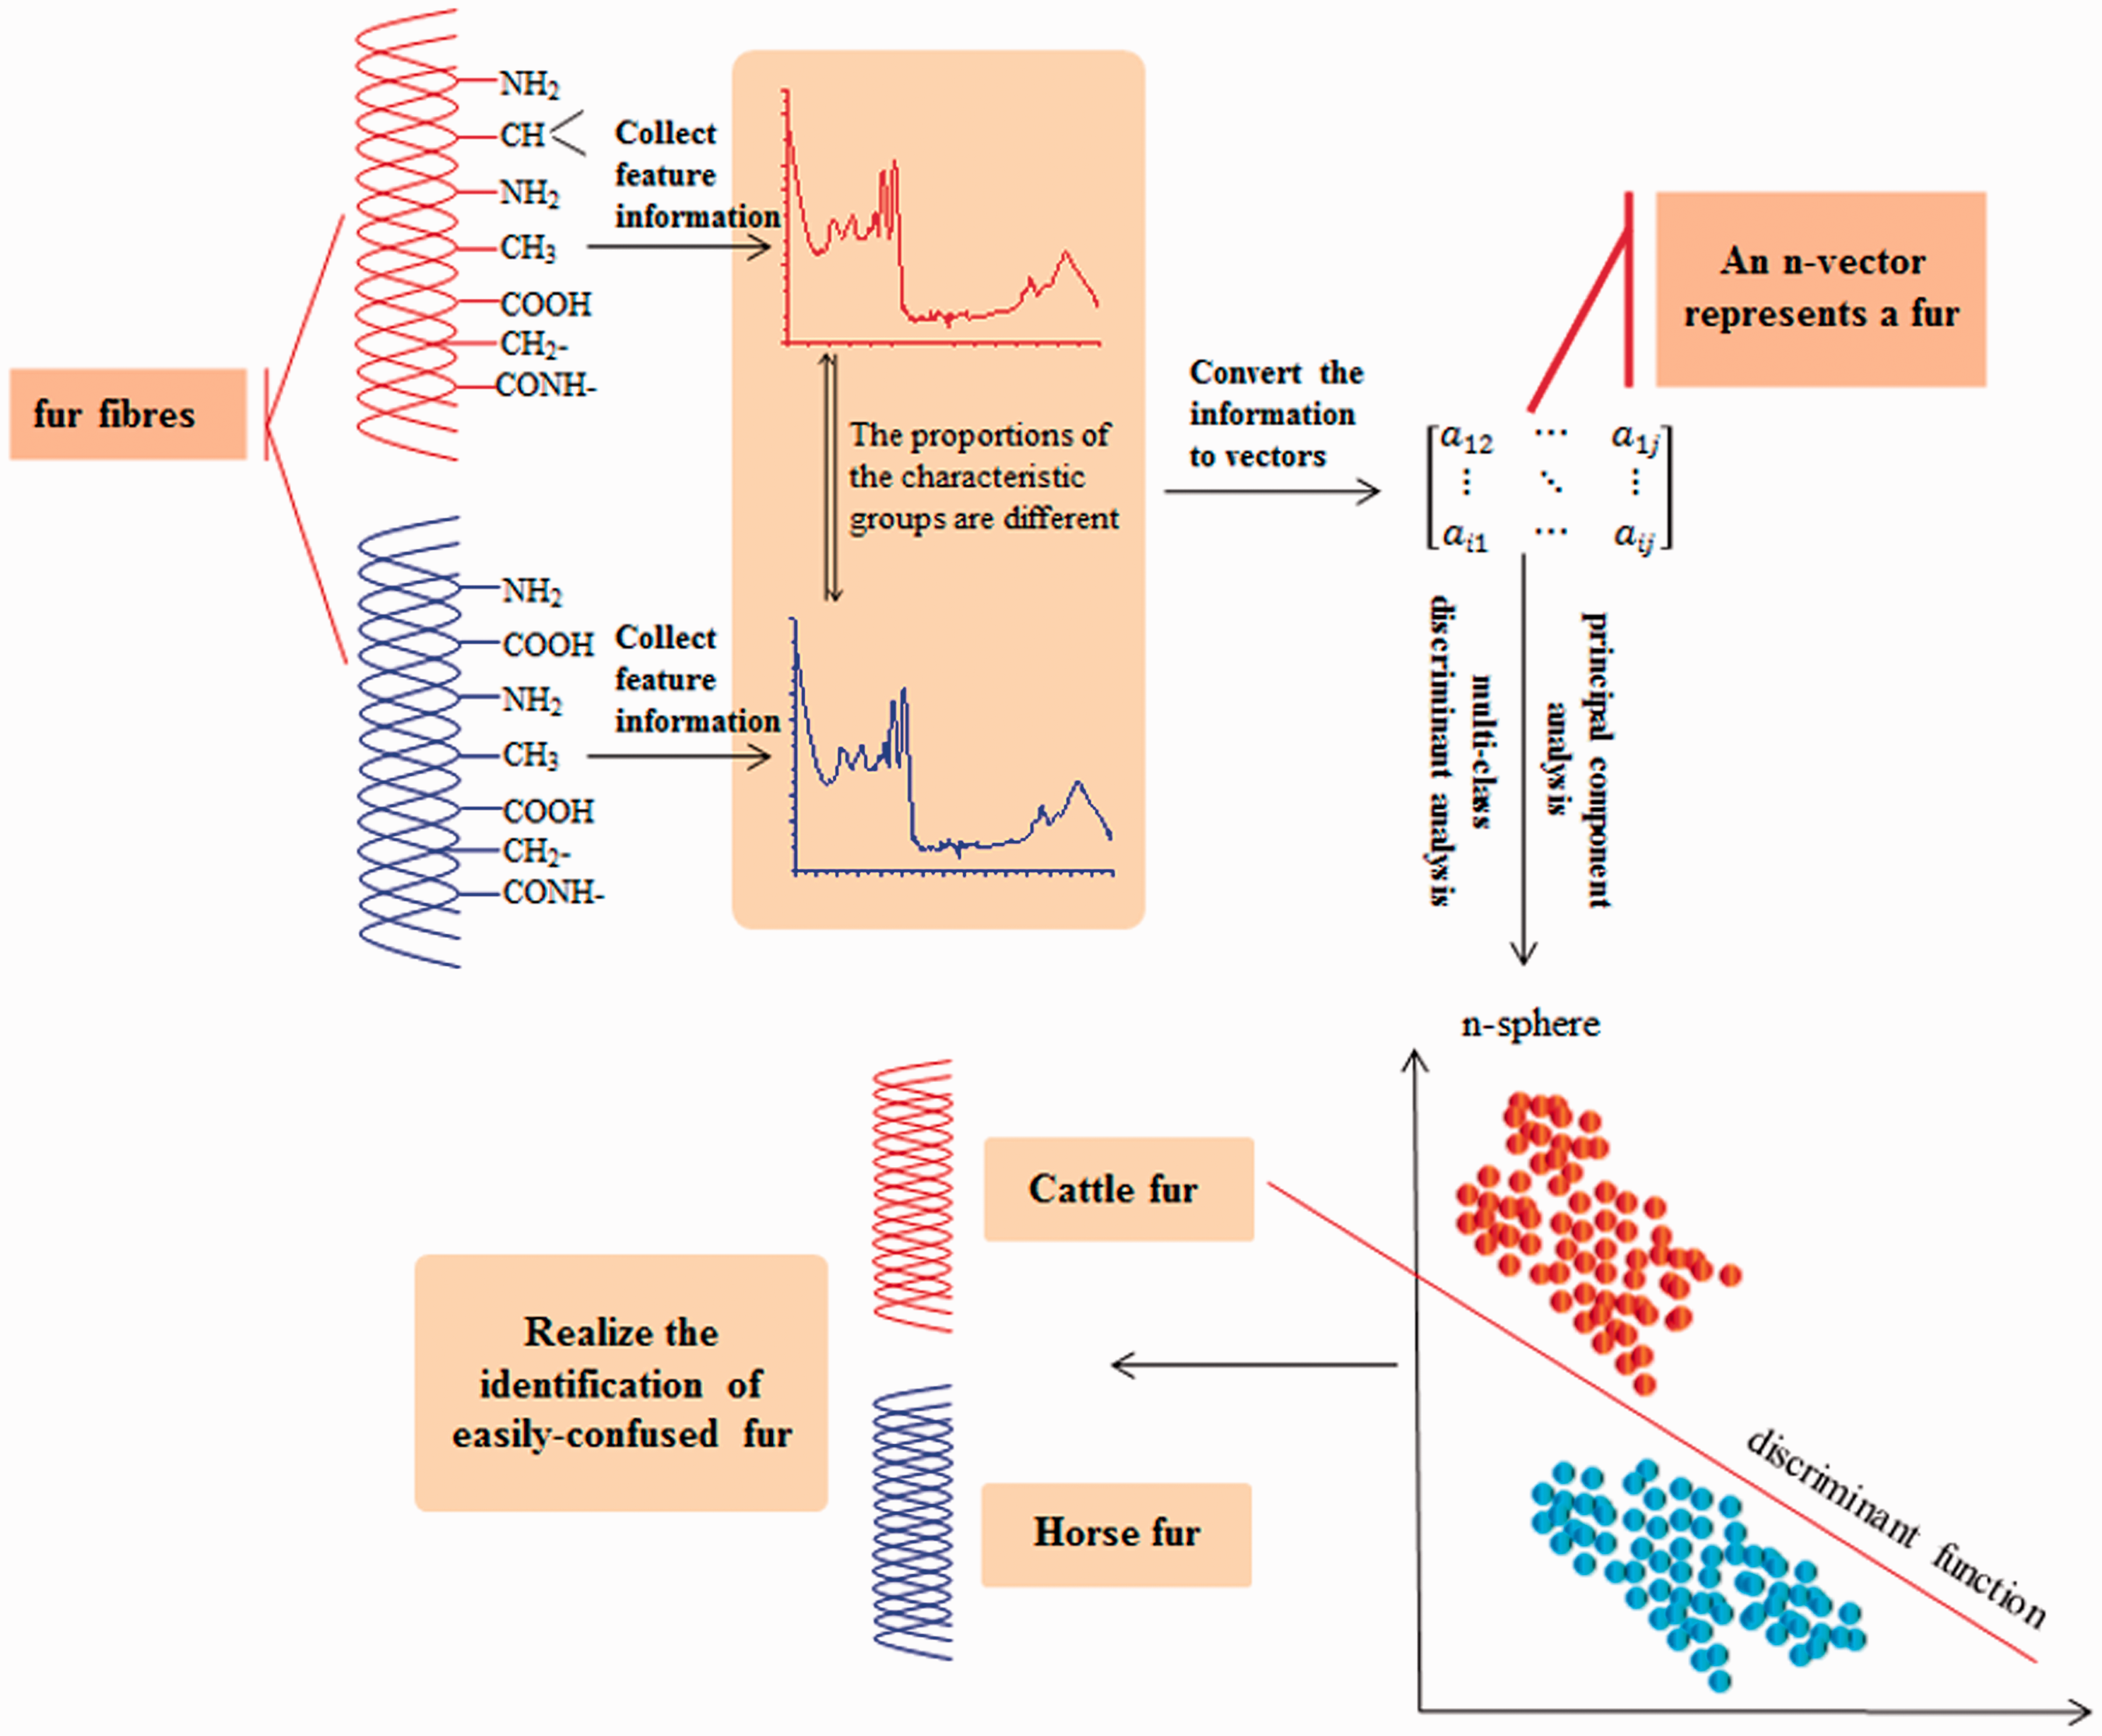
Materials and methods
Instruments and materials
The fur samples of chrome-tanned cattle fur and chrome-tanned horse fur were purchased from Datou Leather Products Co., Ltd. in Wuji County and were appraised by the experienced fur material identification experts from Guangdong Quality Inspection Institute who verified these furs and issued a report; N-hexane was purchased from Shanghai Runjie Chemical Reagent Co., Ltd. with the analytical grade.
Fourier transform infrared spectrometer was used as a model of Nicolet IS 10, Thermo Fisher, ATR accessory with Ge crystal and OMNI sampler. A scanning electron microscope was an SU-1500 made in Hitachi, Japan. An ultrasonic cleaner was an SK2210LHC, made in Shanghai Kedao Ultrasonic Instrument Co., Ltd., the software SPSS22, property of International business machines (IBM) Corp.
Sample cleaning and checking
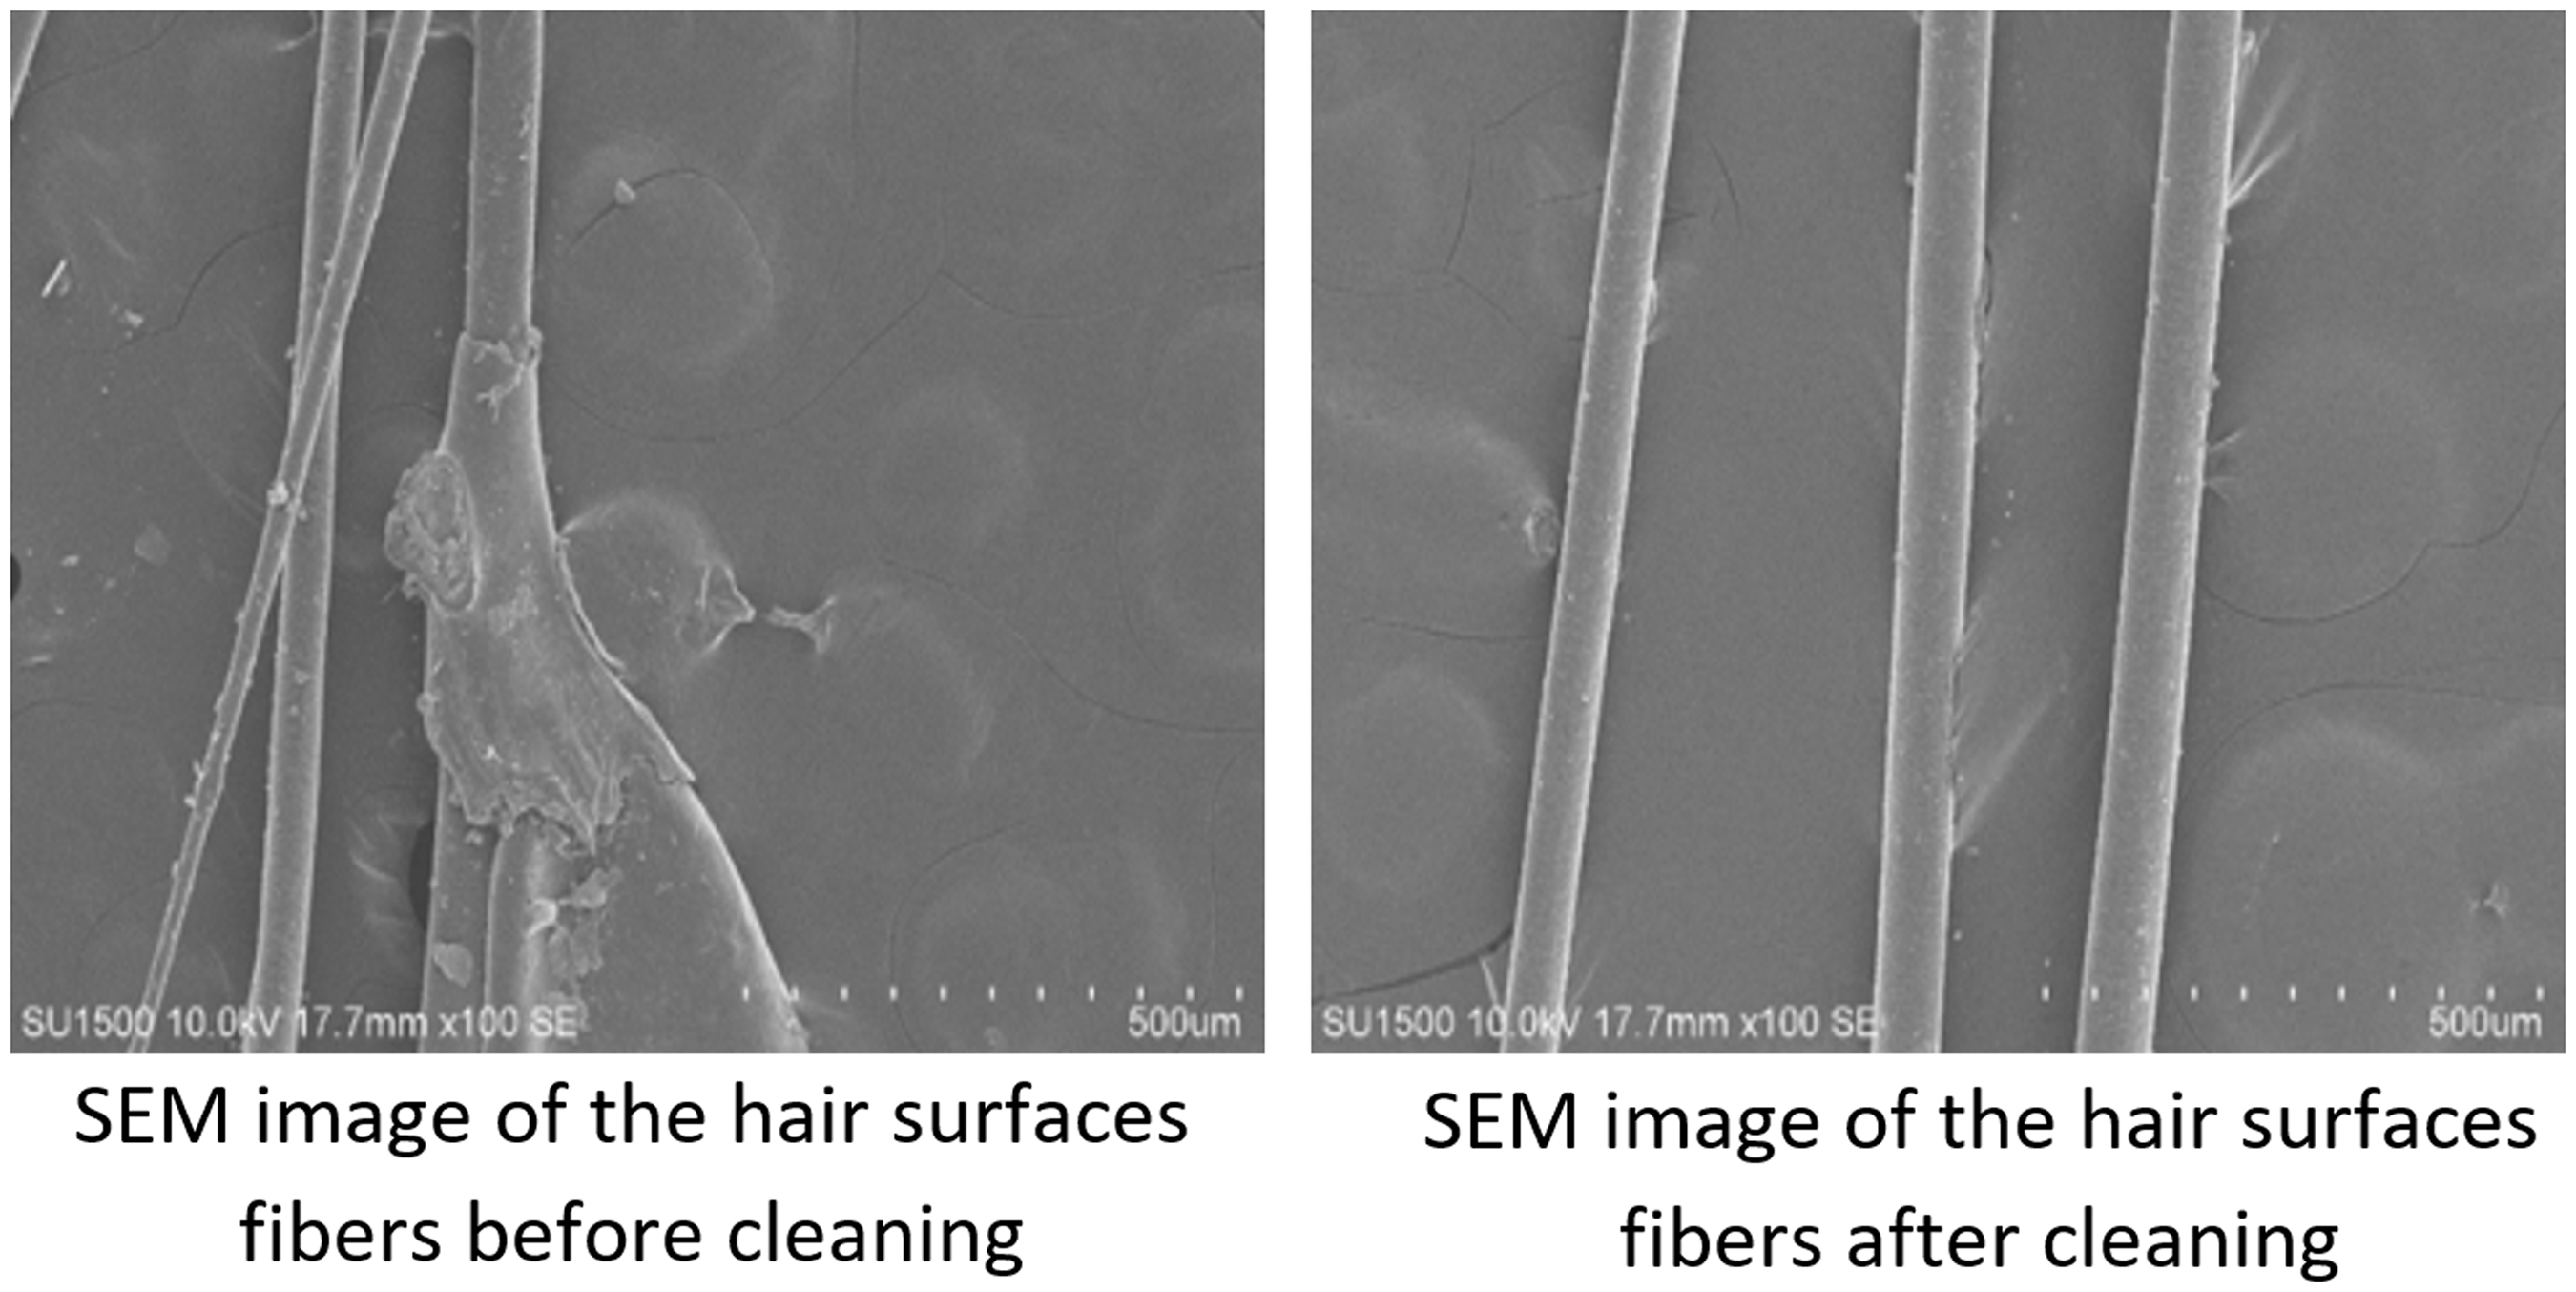
In addition to collagen, animal fur also contains fibrous interstitials, such as oil and fat, and the fur is more or less introduced into the impurities during processing. To avoid interference with interstitial fibres and impurities, the fur needs to be cleaned. A 50 mm × 100 mm fur sample was chosen, and N-hexane was used as an organic solvent. The ultrasonic cleaning was performed twice at a working frequency of 35 kHz. The operating temperature was 60℃, the working time was 60 min and the vacuum was taken out for use. By using a scanning electron microscopy, an appropriate amount of flesh surfaces fibres and hair surfaces fibres (the explanation of flesh surface and hair surface was shown in Figure 2) was put on the sample stage with conductive paste and placed in the ion sputtering device for 50 s so as to observe whether there are impurities on the fibres. The voltage was 10 kV. What needs illustration is that the magnification of the images was not specified, as long as it can see if the surface of the fibres was attached with impurities. The scanning electron microscopy should be used to observe the multiple parts of the fibres to confirm whether it is clean. The comparison of the flesh surface fibres before and after cleaning was shown in Figure 3. The comparison of the hair surface fibres before and after cleaning was shown in Figure 4.
The sketch of flesh surface and hair surface. The comparison of SEM image of the flesh surfaces fibres before and after cleaning. The comparison of SEM image of the hair surfaces fibres before and after cleaning.

Infrared spectrum acquisition
One hundred and twenty groups of fur samples were selected, which included 60 groups of cattle fur and 60 groups of horse fur. The hair surfaces and flesh surfaces of the samples were performed using an infrared spectrometer with an ATR accessory, respectively. The infrared instrument was preheated and stable. The test surface of the fur sample was placed on the ATR accessory. The sample was scanned 32 times in the range of 400–4000 cm−1 with a resolution of 4 cm−1 and interval of 0.482 cm−1, and the spectra were saved. The pre-processing method, the point smoothing (automatic point smoothing) and the baseline correction (automatic baseline correction) were used at the same time. The pre-processing spectra were saved as csv format data, and then 7469 pairs of data can be obtained from each spectra (the data interval of the range of 399.675–4000.122 cm−1 is 0.482 cm−1).
Principal component analysis
The 120 groups’ hair surfaces infrared spectra dates with the range of 800–2100 cm−1 (2696 data can be obtained from the spectra) and the 120 groups’ flesh surfaces infrared spectra dates with the range of 800–2100 cm−1 were selected, respectively, which included 60 groups of cattle fur and 60 groups of horse fur as the same above. PCA was performed using a SPSS 22 software, click menu bar ‘analyze’ – ‘data reduction’ – ‘factor’, and the PCA model was established to calculate the principal component score of principal component eigenvalue (λ) ≥ 1. The principal component score can be calculated according to equation (1)
PCn is the principal component score, FACn is the factor score that can be obtained directly through SPSS22 and λ is the principal component eigenvalue that can be obtained directly through SPSS22.

Multi-class discriminant analysis
From the 120 sets of hair surfaces infrared spectrograms and 120 sets of flesh surfaces infrared spectrograms analysed by ‘PCA’ above, 100 sets of infrared spectrum main component score data, including 50 sets of cattle fur and horse fur, were selected for the data analysis. Variables were analysed by SPSS 22 (click menu bar ‘analyze’ – ‘classify’ – ‘discriminate’) for multi-class discriminant analysis. The hair surface typical discriminant functions ym(x) and flesh surface typical discriminant functions yr(x) of cattle fur and horse fur were obtained. The cattle fur class function (ym1(x) and yr1(x)) and the horse fur class function (ym2(x), yr2(x)) were acquired from multi-class discriminant analyses, too. Each group of 100 known data is substituted into the typical discriminant function y(x) (including ym(x) and yr(x)) to verify the correct rate of typical discriminant functions; 100 sets of the known data are substituted into those of class function. The cattle fur class function y1(x) (including ym1(x) and yr1(x)) and the horse fur class function y2(x) (including ym2(x) and yr2(x)). With y1(x) as the abscissa and y2(x) as the ordinate, the clustering diagrams of the class function of cattle fur and horse fur were drawn.
Results and discussion
In this paper, the infrared spectra of the hair surface and flesh surface of cattle fur and horse fur are analysed, respectively. It is found that the similarity of the spectral features of the two spectra was high, but the intensity of the characteristic peaks is slightly different, as shown in Figures 5 and 6. Therefore, it is not practical to identify the material of the cattle fur and the horse fur only by visually comparing the differences between the two spectra.
Comparison of flesh surface infrared spectra of cattle and horse fur. Comparison of hair surface infrared spectra of cattle and horse fur.
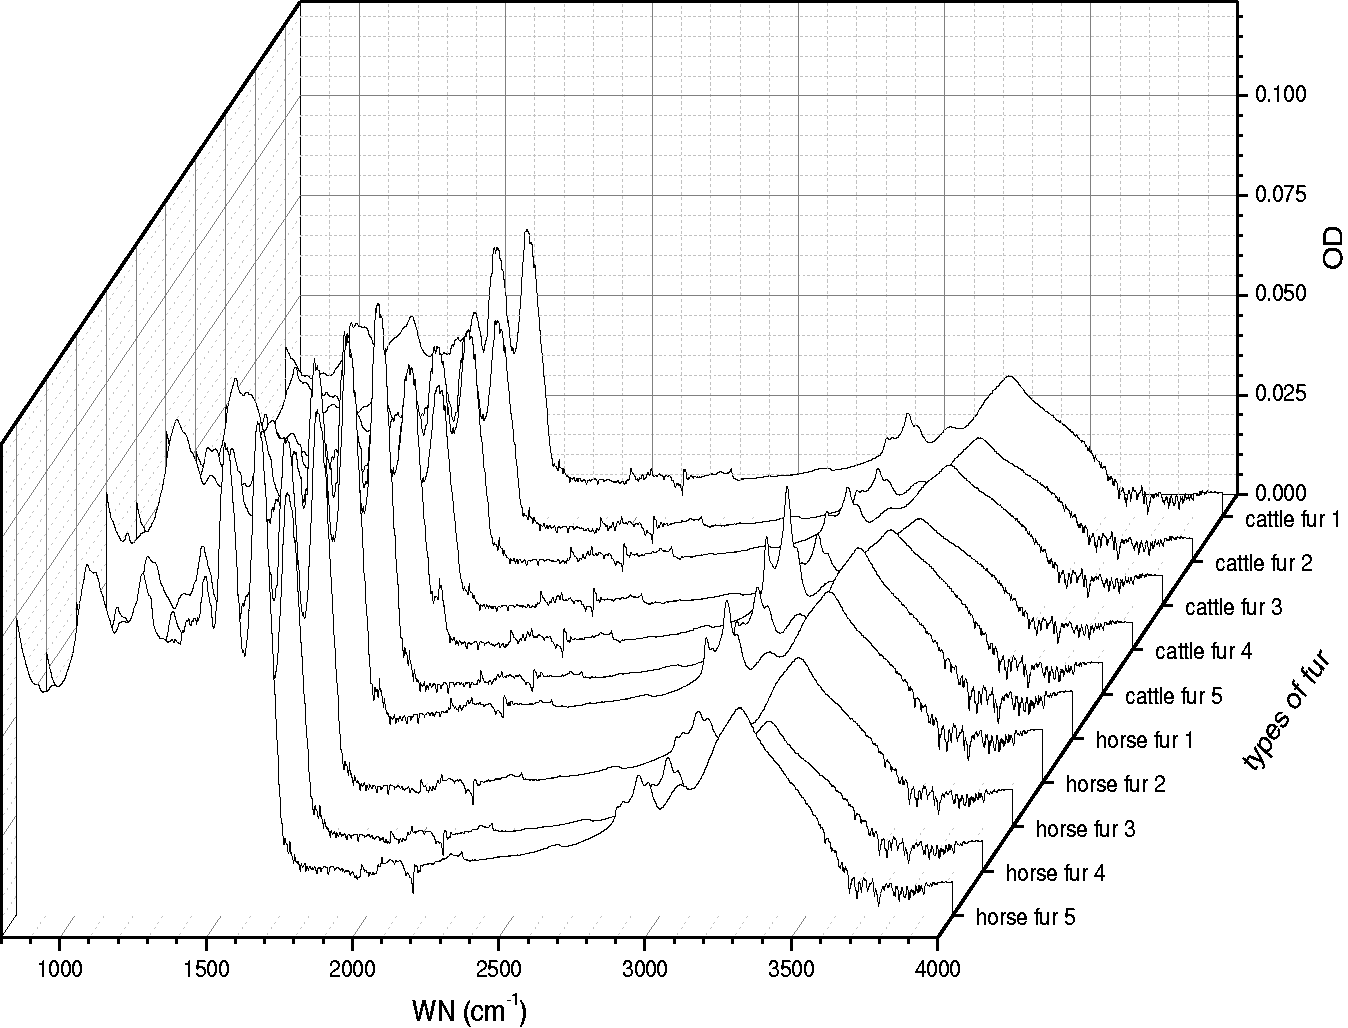
Actually, both cattle fur and horse fur are composed of more than 20 alpha-amino acids. The main group and the structure of the α-amino acid are a methylene group, a carboxyl group and an amine group. As shown in Figure 7, the absorption peaks of the stretching vibration characteristic of –NH2 in the flesh surface of cattle fur and horse fur are measured in the vicinity of the wave number 3308 cm−1 (the hair surface is 3276 cm−1). The absorption peaks of the asymmetric stretching vibration and the symmetric stretching vibration characteristics of –CH2– are at the wavenumber of 2922 cm−1 (the hair surface is 2922 cm−1) and 2852 cm−1 (the hair surface is 2851 cm−1). The absorption peak of the carbonyl stretching vibration in the carboxyl group is 1633 cm−1 (the hair surface is 1629 cm−1), forming the strongest absorption band, which is the amide I band. –CN– stretching vibration and –NH2 scissor vibration characteristic absorption peak appear at the wavenumber of 1548 cm−1 (the hair surface is 1512 cm−1), and a strong absorption band is formed, which is the amide II band. These characteristics can reflect the information of different kinds of amino acids, which lays a theoretical foundation for fur recognition analysis.
The infrared spectra of the cattle fur and horse fur.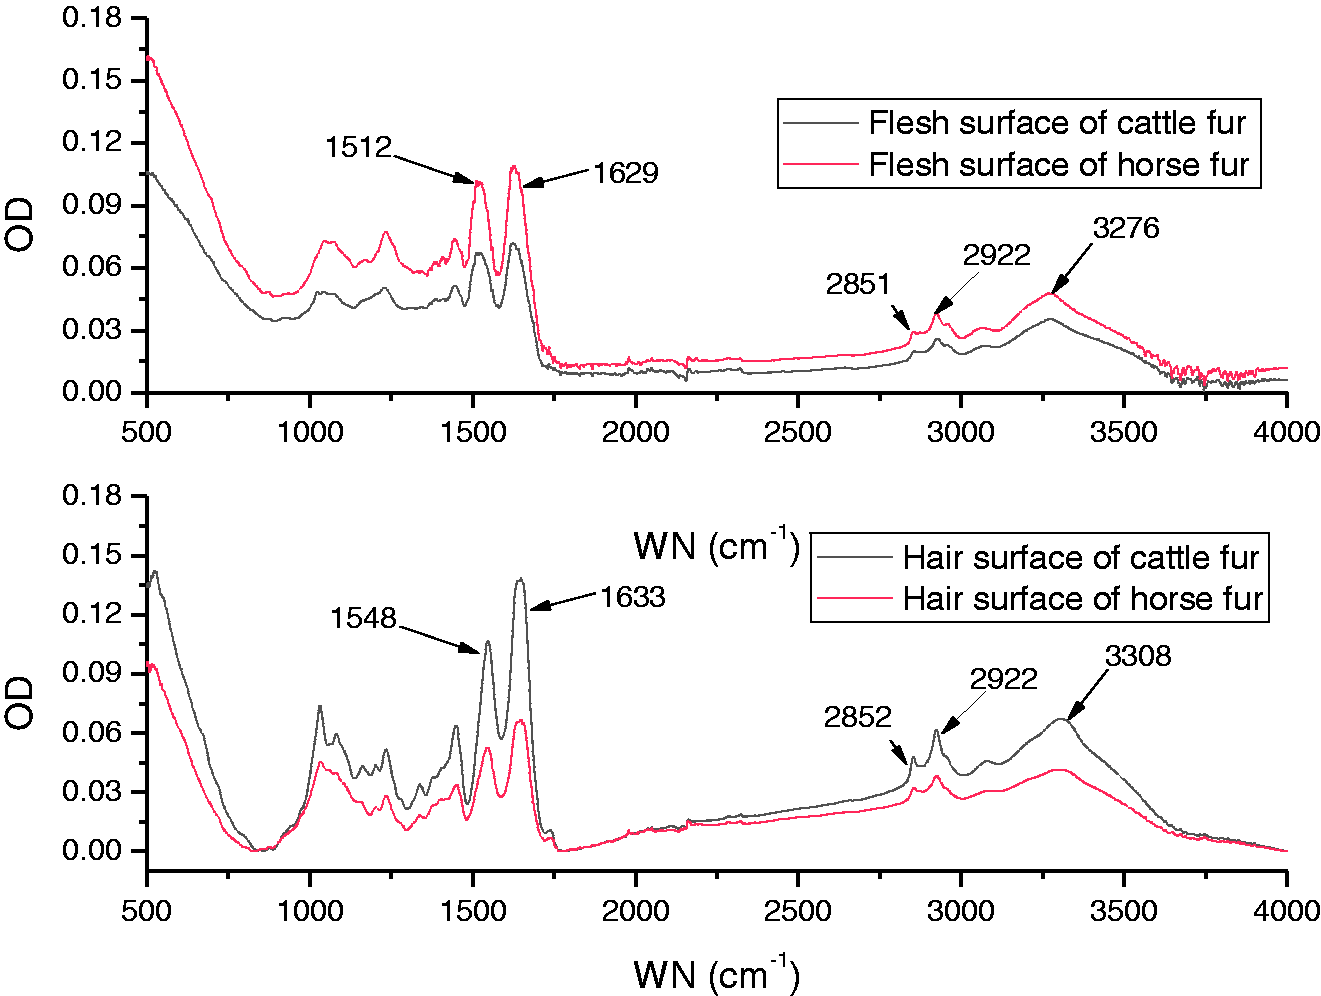
PCA of horse fur and cattle fur
PCA can not only reduce the data dimension [18] but also compress the spectral data at multiple wavelengths into a limited number of factor spaces, so that a small number of new variables can maximize the data structure characteristics of the original variables. The ability determines the category to which the sample belongs in each factor space.
It is worth noting that when PCA of spectral data is performed, the data of different spectral segments are selected, and the discrimination and clustering effects are also different. Generally, the best results can be obtained when using full spectrum data. However, the calculation amount is too large when using a full spectrum, and it is often difficult to calculate the results if a non-professional computer is used. Therefore, it is significant to select an appropriate feature spectrum segment. In this paper, the infrared spectra of cattle fur and horse fur are compared, and it is found that the spectra have the highest degree of discrimination in the 800–2100 cm−1 spectrum. In this band, it not only contains the two strongest absorption peaks of the whole spectrum, but also contains a fingerprint area containing a lot of information. Therefore, the spectral data of the range of 800–2100 cm−1 are selected for PCA after comprehensive consideration.
There are many kinds of fur products on the market, some of which are outside the hair surface, and some of which are outside the flesh surface. The keratin was the main component of hair surface fibres, and collagen was the main component of flesh surface fibres. Their structures were different. In order to achieve non-destructive testing, the same identification model must not be used for material identification of cattle fur and horse fur. Therefore, it is necessary to study hair surface fibres and flesh surface fibres separately.
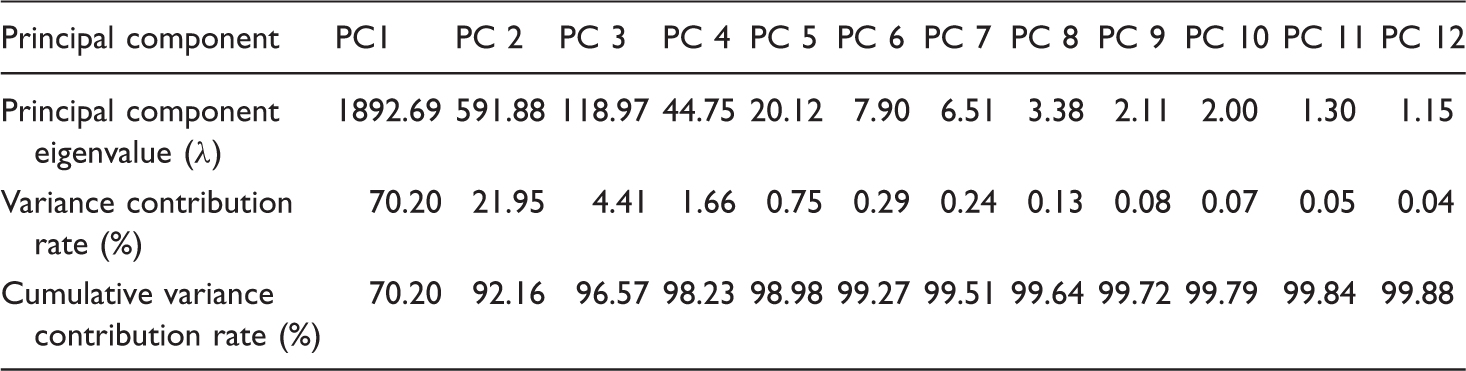
The results about PCA of hair surface.

The results about PCA of flesh surface.
Establishment of multi-class discriminant analysis model for horse fur and cattle fur
The first nine principal component scores of 100 groups of the hair surface samples are used as independent variables, and the cattle fur hair surface (1) and horse fur hair surface (2) are used as grouping variables. SPSS22 is used to establish multi-class discriminant identification model. In the same way, the scores of the first 12 principal components of each group of 100 flesh surface samples are taken as independent variables, and the multi-class discriminant identification model is established by SPSS 22 with the cattle fur flesh surface (1) and the horse fur flesh surface (2) as grouping variables. It is concluded that the typical discriminant function ym(x) of the hair surface cattle fur and the hair surface horse fur, the hair surface cattle fur class function ym1(x) and the hair surface horse fur class function ym2(x) are as shown in equations (2) to (4), respectively. The typical discriminant function yr(x) of the flesh surface cattle fur and the flesh surface horse fur, the flesh surface cattle fur class function yr1(x) and flesh surface horse fur class function yr2(x) is as shown in equations (5) to (7), respectively.


The known 100 hair surface samples are substituted into the established typical discriminant function ym, with the sample number as the horizontal axis and ym(x) as the vertical axis. The verification results of the cattle fur and the horse fur surface discriminant function are shown in Figure 8. It can be seen from Figure 8 that the typical discriminant function values of 50 groups of the cattle fur after returning are below 0 axis, and the typical discriminant function values of 50 groups of the horse fur after returning are above 0 axis. It is very intuitive to see that the back substitution accuracy rate of the typical discriminant function is 100%.
Verifying results of 100 hair surface samples with typical discriminant function.
The known 100 flesh surface samples are substituted into the established typical discriminant function yr, with the sample number as the horizontal axis and yr(x) as the vertical axis. The verification results of the cattle fur and the horse fur surface discriminant function are shown in Figure 9. It can be seen from Figure 9 that the typical discriminant function values of the 50 groups of the cattle fur are all above the 0 axis, and the typical discriminant function values of the 50 groups of the horse fur are below the 0 axis. It is very intuitive to see that the back substitution accuracy rate of the typical discriminant function is 100%.
Verifying results of 100 flesh surface samples with typical discriminant function.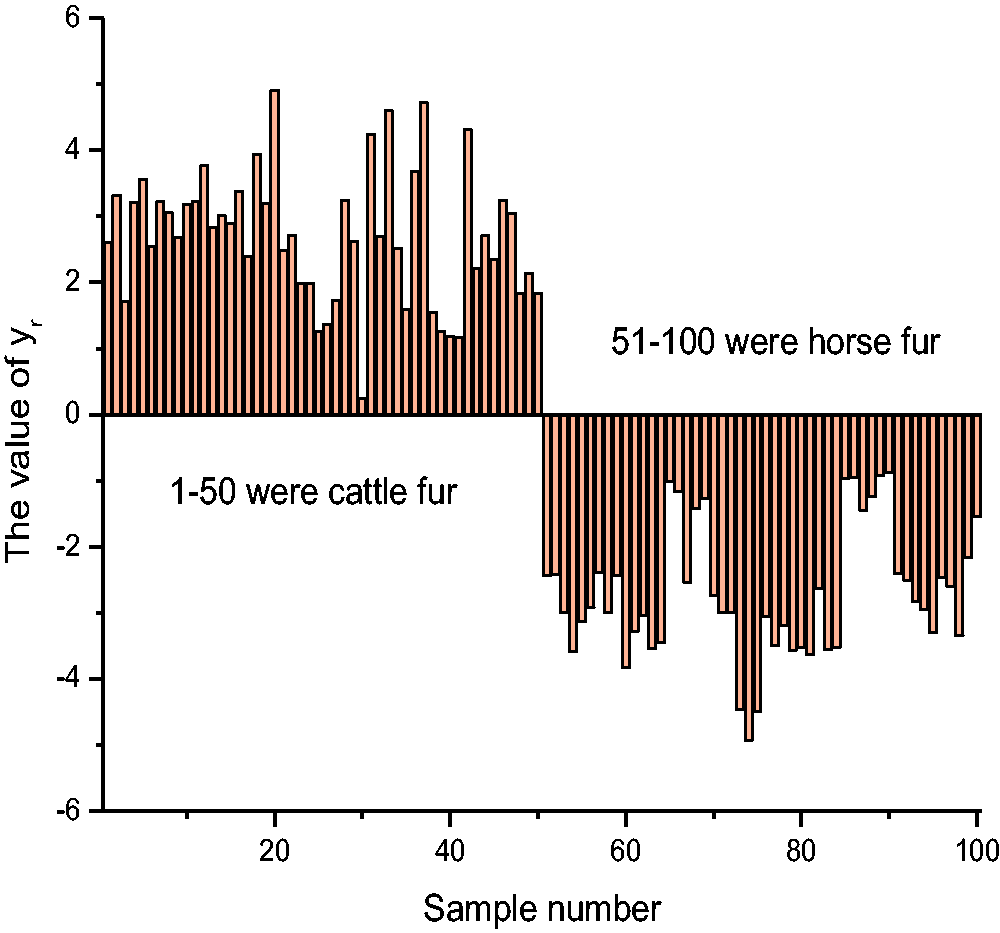
The known 100 hair surface samples are substituted with the established cattle fur class function ym1(x) and the horse fur class function ym2(x), with ym1(x) as the horizontal axis and ym2(x) as the vertical axis. The back substitution clustering diagrams of the cattle fur and the horse fur hair surface class function are shown in Figure 10. It can be seen from Figure 10 that 50 groups of the horse fur are located in the second quadrant, and 50 groups of the cattle fur are located in the fourth quadrant, then the clustering is well.
The back substitution clustering effect diagram of 100 hair surface samples with class function.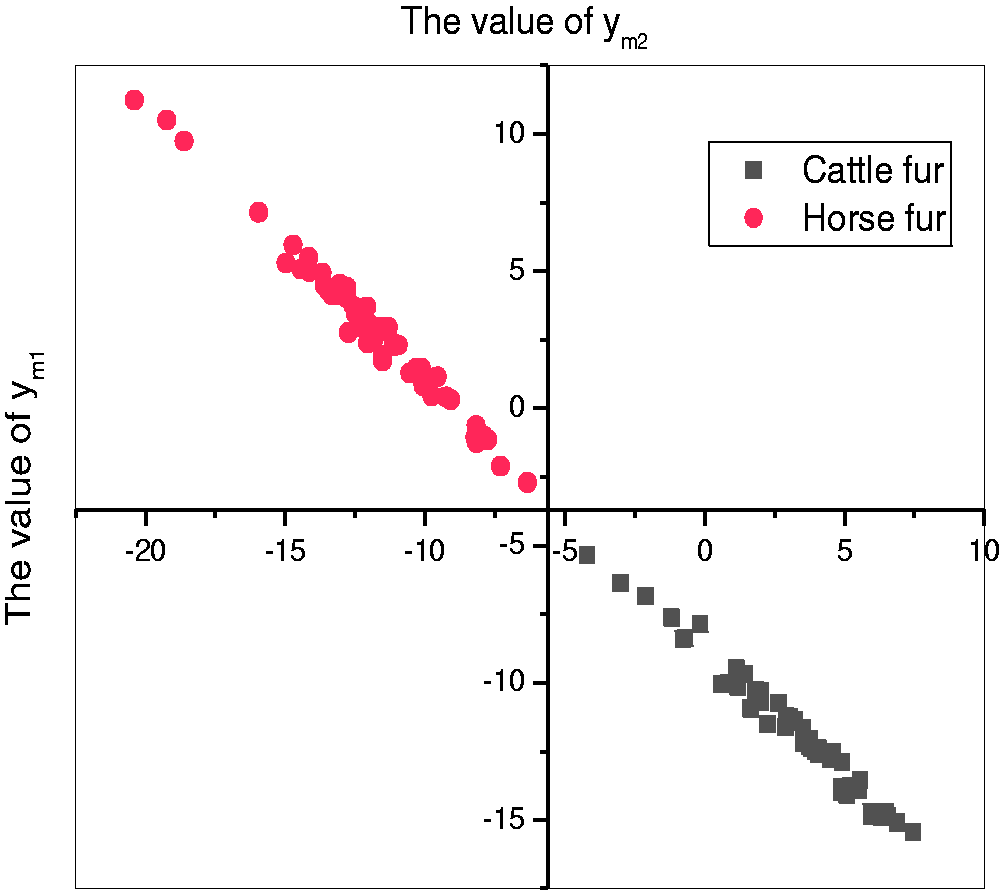
Similarly, the known 100 flesh surface samples are substituted with the established cattle fur class function yr1(x) and the horse fur class function yr2(x), with yr1(x) as the horizontal axis and yr2(x) as the vertical axis. The back substitution clustering diagrams of the cattle fur and the horse fur flesh surface class function are shown in Figure 11. It can be seen from Figure 11 that 50 groups of the horse fur are located in the second quadrant, and 50 groups of the cattle fur are located in the fourth quadrant, then the clustering is good.
The back substitution clustering effect diagram of 100 flesh surface samples with class function.
Analytical model verification
The verification result of 20 hair surface samples are not involved in the model establishment.

The verification result of 20 flesh surface samples are not involved in the model establishment.

Figure 12 is a clustering effect diagram of the verification sample class function which is obtained by substituting the 20 hair surface samples with the cattle fur class function ym1(x) and the horse fur class function ym2(x). It can be seen from Figure 10 that the verification samples of No. 1–10 are located in the second quadrant, the verification samples of No. 11–20 are located in the fourth quadrant, and the results are consistent with the established cattle fur and horse fur class function models. At the same time, compared with the 100 samples of the model, 20 sets of verification samples are clustered into 50 groups of cattle fur samples and 50 groups of horse fur samples, and the clustering effect is good. The results again prove the reliability of the model.
The clustering effect diagram of 20 hair surface samples with class function.
Figure 13 is a clustering effect diagram of the verification sample class function which is obtained by substituting the 20 flesh surface samples with the cattle fur class function yr1(x) and the horse fur class function yr2(x). It can be seen from Figure 12 that the verification samples of No. 1–10 are located in the second quadrant, the verification samples of No. 11–20 are located in the fourth quadrant, and the results are consistent with the established cattle fur and horse fur class function models. At the same time, compared with the 100 samples of the model, 20 sets of verification samples are clustered into 50 groups of cattle fur samples and 50 groups of horse fur samples, and the clustering effect is good.
The clustering effect diagram of 20 flesh surface samples with class function.
Conclusion
The infrared spectra of cattle fur and horse fur are similar. It is difficult to directly discriminate the materials of the spectra without analysing the spectra. Based on the infrared spectra, PCA and multi-class discrimination are used to identify the material of horse fur and cattle fur in the paper. The identification model of cattle fur and horse fur material is established successfully. The identification model of cattle fur and horse fur was established successfully. The model can effectively extract useful information from a large number of spectral information, reduce data dimension and simplify calculation. Meanwhile, the typical discriminant functions Ym(x) and yr(x), cattle fur classification functions Ym1(x), yr1(x) and horse fur classification functions Ym2(x) and yr2(x) were obtained, respectively. The back substitution accuracy rate of the typical discriminant function is 100%, and the verification accuracy rate is 100%. The clustering graph of the class function is excellent.
The research results provide a reference for the rapid, accurate and non-destructive identification of cattle fur and horse fur, which has strong practicability and provides a new idea and direction for the identification of other animal fur materials.
Footnotes
Acknowledgement
The authors wish to acknowledge the help of Professor Huijun Ren, who has made contributions to the English translation and language polishing of this article.
Declaration of conflicting interests
The author(s) declared no potential conflicts of interest with respect to the research, authorship, and/or publication of this article.
Funding
The author(s) disclosed receipt of the following financial support for the research, authorship, and/or publication of this article: This work was supported in part by the science and technology planning project of the Zhejiang Quality and Technical Supervision (20160253) and Industrialization Project of Education Department in Shaanxi Province (16JF003).