
Abstract
The aim of this work is a qualitative and quantitative analysis of the thermal performance of an external wall outfitted with new insulation materials based on textile waste using an experimental and numerical approach. The experimental study deals with the development and characterization of a new insulation material from wool and acrylic and then tests their thermal performance in a cavity which simulates a building room at reduced scale thermally controlled. The numerical study essentially centers on the development of a multilayer wall which simulates an external wall under laboratory conditions using finite difference method (implicit scheme method). First, a COMSOL tool is used to verify that the heat transfer in the external wall is unidirectional and then our numerical model is limited to a one-dimensional simulation. The numerical model is successfully validated owing to the experimental results. Using the numerical model, the thermal performance of the wall with the textile insulation is studied and their optimal thickness and location are determined. The variation of insulation thickness considerably influences the surface temperature up to a thickness of 6 cm and beyond the variation becomes less important. The results also show that the location and distribution of insulation has an effect on outdoor surface temperatures.
Keywords
Introduction
It is well-known that the building is one of the most dynamic sectors of the economy marked by a high-energy consumption [1]. When properly installed, the use of insulation provides thermal resistance around the building and reduces heating and cooling costs by keeping the inside environment at comfort temperature [2]. The practical considerations of energy conservation in buildings start with the assessment of thermal performance of the individual building elements and the building as a whole. Allowance should also be made for the effect of climatic conditions, season and wall orientation as well as the type and mode of operation expected from the air conditioning system [3]. The location of insulation is a determinant factor that affects the thermal response of building walls and the cooling and heating loads [4]. Many studies have concerned the location of insulation in the wall. Kossecka and Kosny [5] have shown that the insulation layer had a significant impact on the thermal behavior of the wall, and they recommended that the insulation should be placed at the indoor face of the walls. Asan [6] showed that placing half of the insulation in the middle of the wall and half of it in the outer surface of the wall gave very high time offsets and low decrement factors. Ozel and Pihtili [7] investigated optimum location and distribution of insulation layers using implicit finite difference method, they showed that the exterior climate conditions have no noticeable effect on the optimal location of insulation.
The main aim of this paper is to study numerically and experimentally the thermal performance of a new insulation based on textile waste previously manufactured by Wazna et al [8]. We start by an extensive report of the data about the textile sector in Morocco including amount of waste produced each year by each subsector of textile industry. The study deals with the elaboration of an implicit finite difference method which simulates a multilayers wall. We started by a validation of the numerical model against the experimental data of a cavity thermally controlled by means of outside surface temperature. The Comsol multiphysics is used to verify that the heat transfer is one-dimensional which explains the limitation of our model to one direction. The developed numerical model is used for a parametric study of the influence of the thickness and location of the insulation on its thermal performance.
Textile waste context in Morocco
For a country that is strongly present in the field of garment manufacturing, Morocco remains very far in the field of recovery of its textile waste, while a real industry of recycling and recovery of textile waste has developed in the world since the 1990s. Contrary to other countries, especially in Europe, where most of the waste is found in used clothing with structured collection networks. In Morocco, garment companies at the cutting plant level mainly generate textile waste. The collection of this waste is done globally through informal collection networks. At present, the total estimated volume of textile waste in Morocco is 200,000 tons per year [9]. Part of this waste, about 34,000 tones [10], is exported abroad where it is processed and transformed into various materials. The production of textile waste concerns the entire value chain of the textile sector: from spinning to clothing. This industrial activity generates the largest percentage of textile waste through the cutting operation.
Currently in Morocco, there are 76 spinning units mainly located in the Grand Casablanca and Tangier-Tetouan regions, which provide an estimated production of 92,900 tons per year.
The weft and warp branch is represented by 94 establishments of which 66 (70%) are located in the Grand Casablanca region. This branch monopolizes the exports, with an amount of 18.5 MMMAD.
The weaving operation generates about 5% of textile waste through the cutting edges (edges of the woven fabric). There is a high concentration of knitting companies in the Grand Casablanca area and lesser extent in the Tangier-Tetouan area (Figure 1). The knitting activity generates very little textile waste. It is in the cutting operation of the knitted panels that there is a significant drop rate of the order of 20–30%.
Number of textile and clothing manufacturing companies in Morocco.
The particularity of this activity is that the knitting companies also integrate the garment business to provide the market with a finished product. According to Figure 1, 44% of garment companies are in the Grand Casablanca region and 25% in the Tangier-Tetouan region. On average, we estimated a drop rate of 20% for the warp and weft fabric and 30% for knitting (knit). It should be noted that mesh waste presents a higher benefit because of the ease of recovery (the process of fraying is simpler and the fiber obtained preserves its quality).
Spinning, weaving, and knitting mills generate less waste than clothing workshops. Generally spinning mills spin with zero waste knowing that fiber spinning waste is reused with the addition of a minimum of virgin fiber, to make the yarn of average quality but economical. The weaving and knitting workshops each produce on average 5% of waste compared to the textile material consumed. Weaving mills produce a significant amount of selvedge waste and polypropylene (home fabric) waste is often used as a raw material by the plastics industry. According to subsequent study carried out in France in 2009 based on a representative sample of the clothing textile, it turns out that the fibers most commonly encountered in the manufacture are shown in order of importance in Figure 2 [11].
Different types of textile waste produced in the making process.
Today, nonwovens are one of the main sectors of recycling of textile waste in Morocco. Its market is currently limited to bedding and cars. However, other sectors are applicants for nonwoven products like the building. Nonwovens have a great ability to adapt to many applications, particularly for the thermal insulation in buildings [12,13]. Indeed, the insulation market in Morocco is a growing sector. This is explained by the implementation of the energy efficiency strategy implemented through various actions, which prioritizes the use of local building materials with greater energy efficiency. Today nonwoven are the most buoyant market segment of textile industry thanks to their use, which is becoming more and more widespread in various sectors such as: hygiene (32%), construction (18.2%), wipes (15.8%), and filtration (6.9%) [14]. In recent years, textiles in different form (shredded or nonwoven) have been used in the construction industry for a wide range of applications. In the literature, research has been developed to study the potential application of textiles as thermal insulation. For instance, Valverde et al. [15] used recycled textile fibers to produce insulation in the form of panels, and they found that the thermal conductivity of these panels is in a range of 0.053 and 0.041 W/(m·K). El Wazna et al. [16] studied the potential applicability of a recycled textile in a form of nonwoven material, in building industry. Others studies report on the use of textile as reinforcement in concrete [17,18,19].
Experimental set-up
Textile insulation
The textile insulation used in this study is in the form of a nonwoven, prepared according to the needling technique at ESITH (Higher School of Textile and Clothing Industries, Morocco); This method has already been described by several authors [20–22], which aims to consolidate the structure of the fibrous web without any binder by interlocking fibers. As a first step, textile waste has been collected from different textile industries, sorted according to their composition and frayed to obtain staple fiber. This study was limited to four types of waste, raw wool, carpet wool, spinning, and knitting acrylic termed here as Wr, Wc, As, and Ak, respectively. The flow chart for the nonwoven insulation manufacturing is shown in Figure 3. The needle-punching parameters were kept same for all samples. The thermo-physical properties of textile insulation are shown in Table 1.
The flow chart for the nonwoven insulation manufacturing. Thermo-physical properties of textile insulation.

Test cell and measurement devices
Experimental tests are performed using a reduced-scale thermo-regulated cavity termed here as test cell. It is a cubic box, which held 0.4 m × 0.4 m × 0.4 m removable and interchangeable wooden walls (Figure 4). The ceiling and floor are made of a highly insulating material. The heating of the test cell is provided by an incandescent bulb mounted in a black window protection placed at the center of the test cell. The internal, external, and parietal temperatures (internal and external faces) are measured using type K thermocouples (2/10 mm) with an error of 0.1℃ placed at the exterior and interior surface. The test cell is housed in a conditioned large scale local in order to control the exterior air temperature. The experimental test system included flux meters of 2.54 cm diameter with an accuracy of ±3% and 0.3 s as response time, a data acquisition/switch unit, and a computer (Figure 5) [23].
Illustration of reduced-scale thermo-regulated cavity. Experimental test system.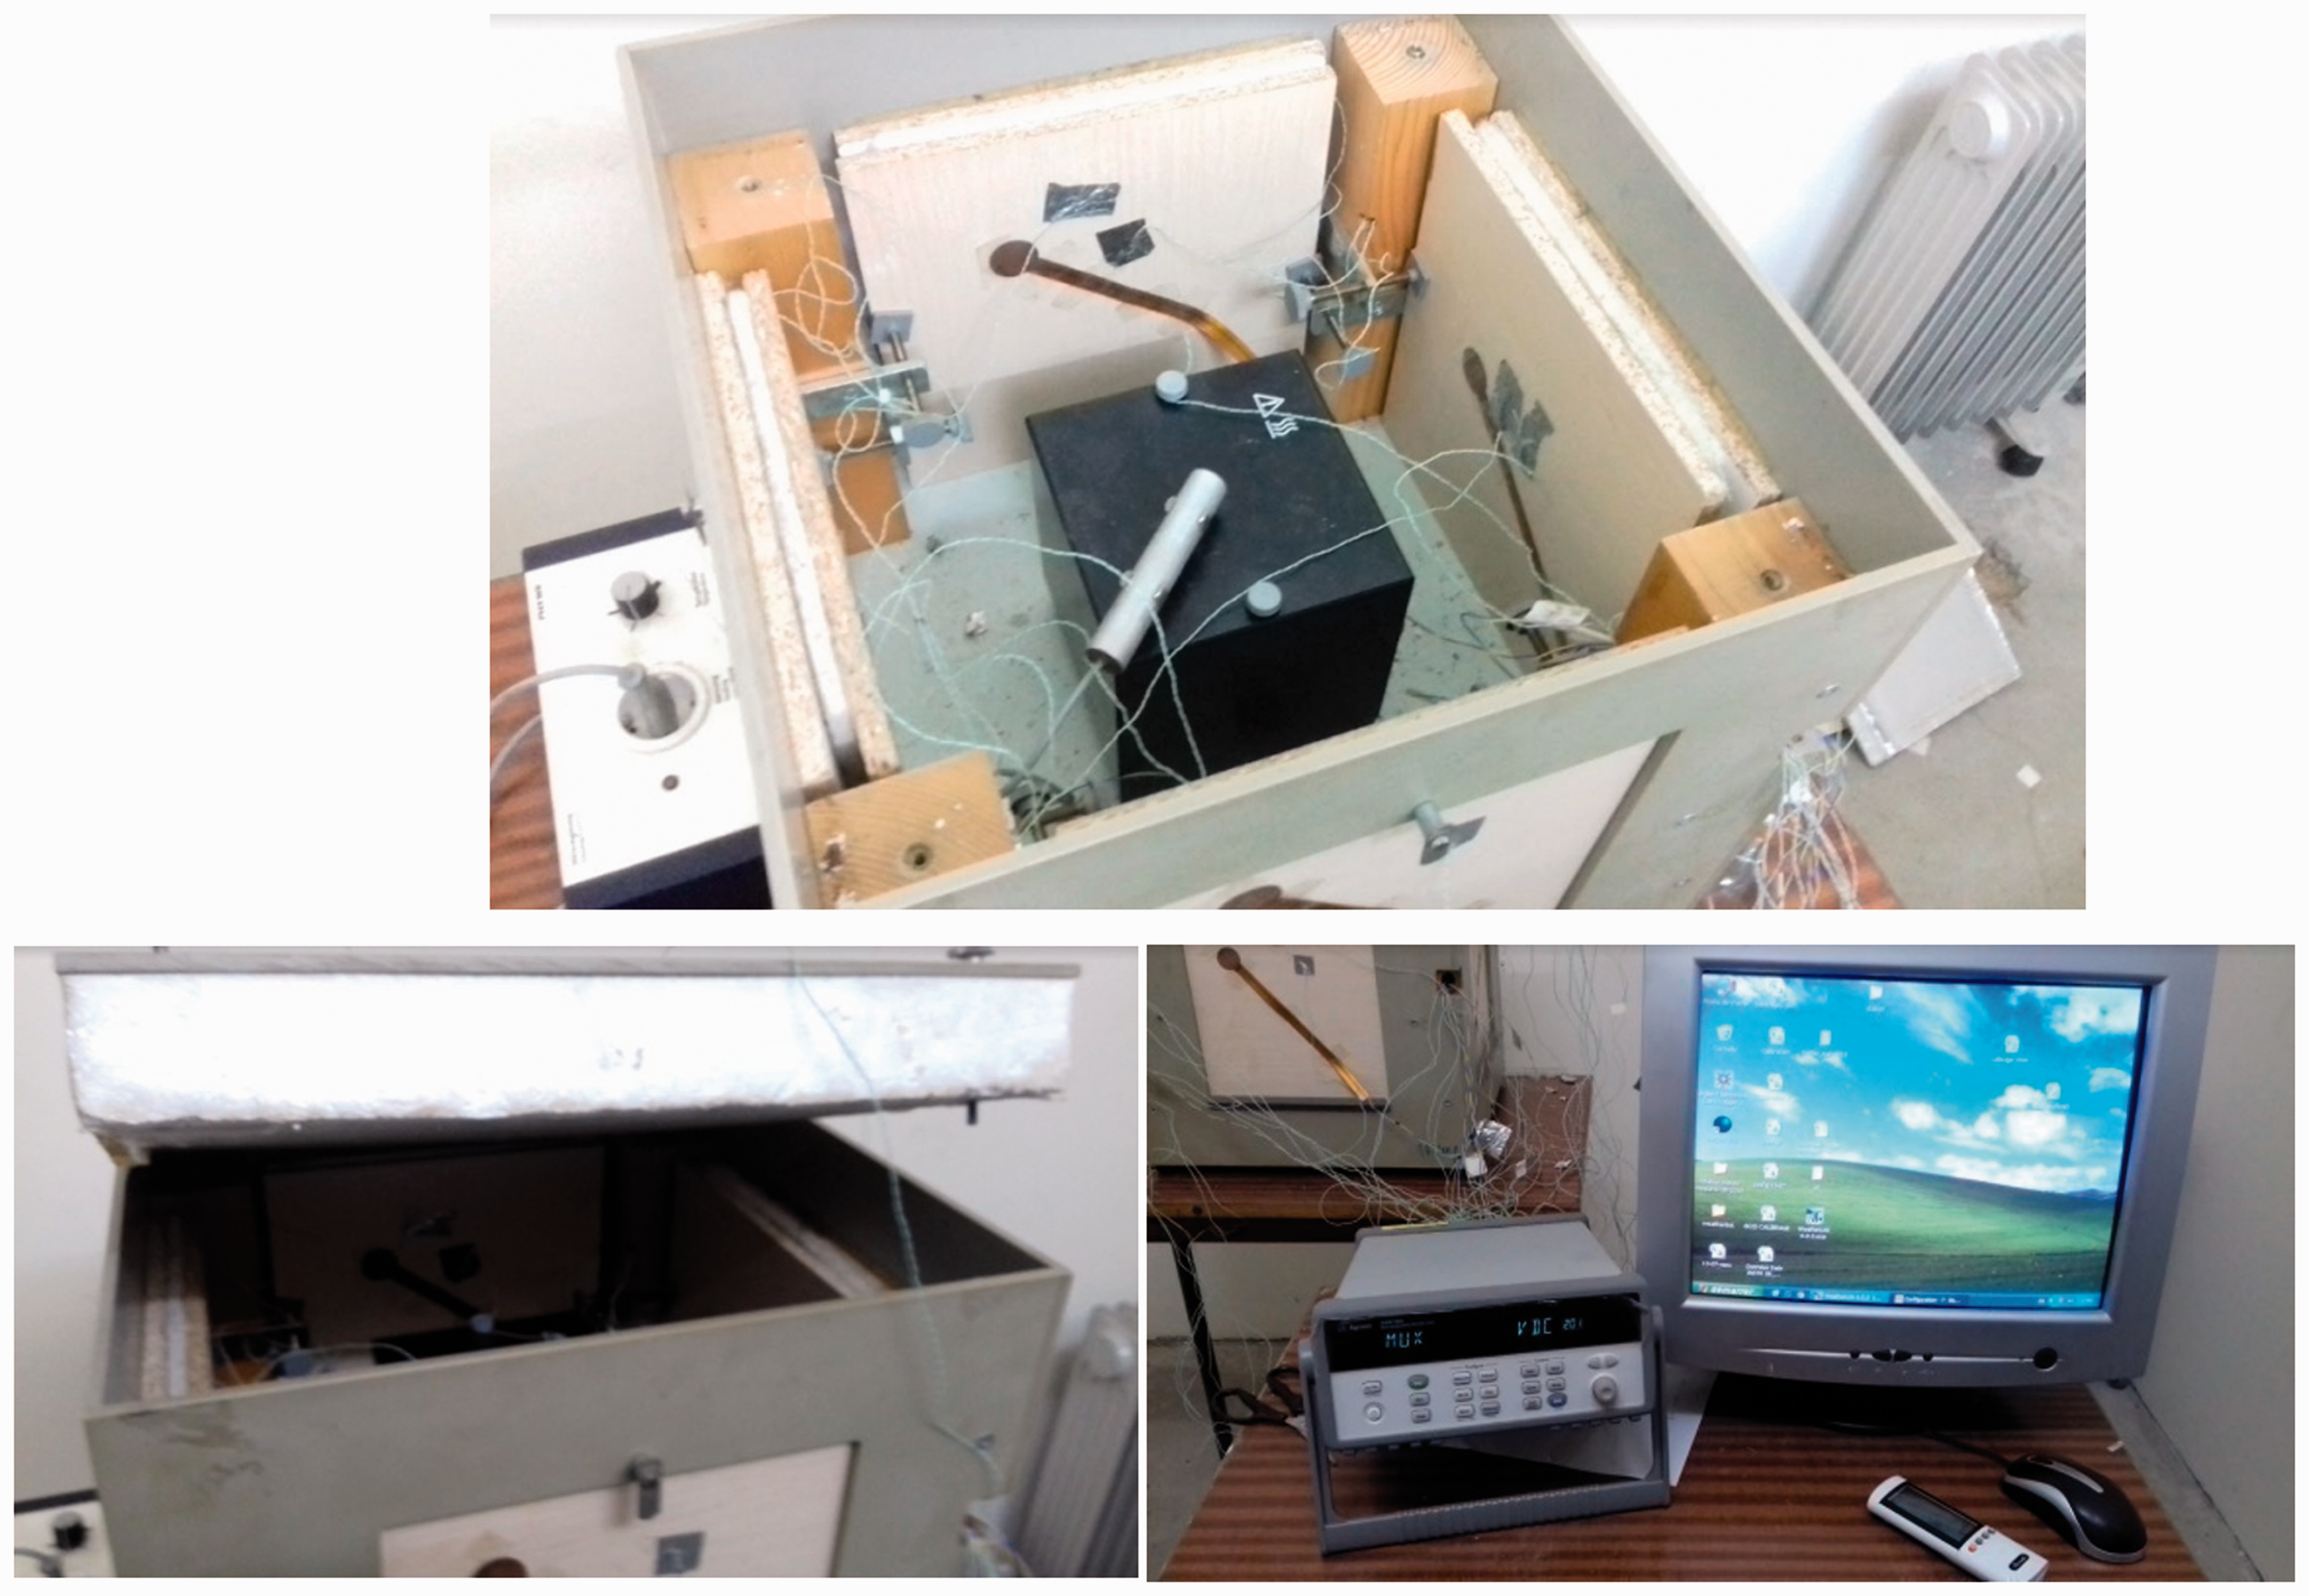

The textile insulation samples are installed between two layers of wood as shown in Figure 5. The wood used in this study has a thermal conductivity of 0.113 W/(m·K), a specific heat capacity of 2720 J/(kg·K) and a 1 cm thickness.
Operative conditions
The experimental test was performed in two identical cycles, each cycle lasts 5 h. During the first period, the heat source inside the test cell is switched “on” and the temperature was established at 36℃, and then switched off for 5 h. The outdoor air temperature is kept constant at a low temperature of 15℃ using an air conditioner (Figure 5).
Numerical method
COMSOL multiphysics
Using different FEM simulation tools [24,25], some authors have previously studied the thermal characteristics of the insulated walls. The purpose of thermal analysis is to determine the temperature distribution as well as other thermal quantities associated in the model, such as the amount of heat loss or gain, thermal gradients and heat fluxes, also to confirm that the heat flow is one-dimensional. There are two types of analysis, namely stationary and transient state. In this work, the transient thermal analysis was adopted, the studied system is subjected to variable thermal loads in respect to time. The inputs given to carry out simulation were heat capacity, density, thickness, and thermal conductivity (both textile nonwoven and wooden wall). A three-dimensional wall model equipped with different type of insulation textiles is constructed. The dimensions were 200 mm × 200 mm × thickness, the thickness of the insulated walls varied according to the thickness of the textile insulation (Table 1). Figure 6 shows an illustration of the wall model. The solid heat transfer module, which considers that conduction is more important than other types of heat transfer was adopted. The inner and the outer surface had a temperature of 36℃ and 15℃, respectively and initial temperature was 20℃, the calculation time was set at 120,000 s with a step time of 0.1 s. As thermal analysis is highly mesh dependent [26], the mesh resolution of the model (Figure 6(b)) is continuously refined until there is less than 1% difference in the computed temperatures and the meshing parameters are as given in Table 2.
illustration of (a) wall model and (b) generated mesh. Meshing parameters.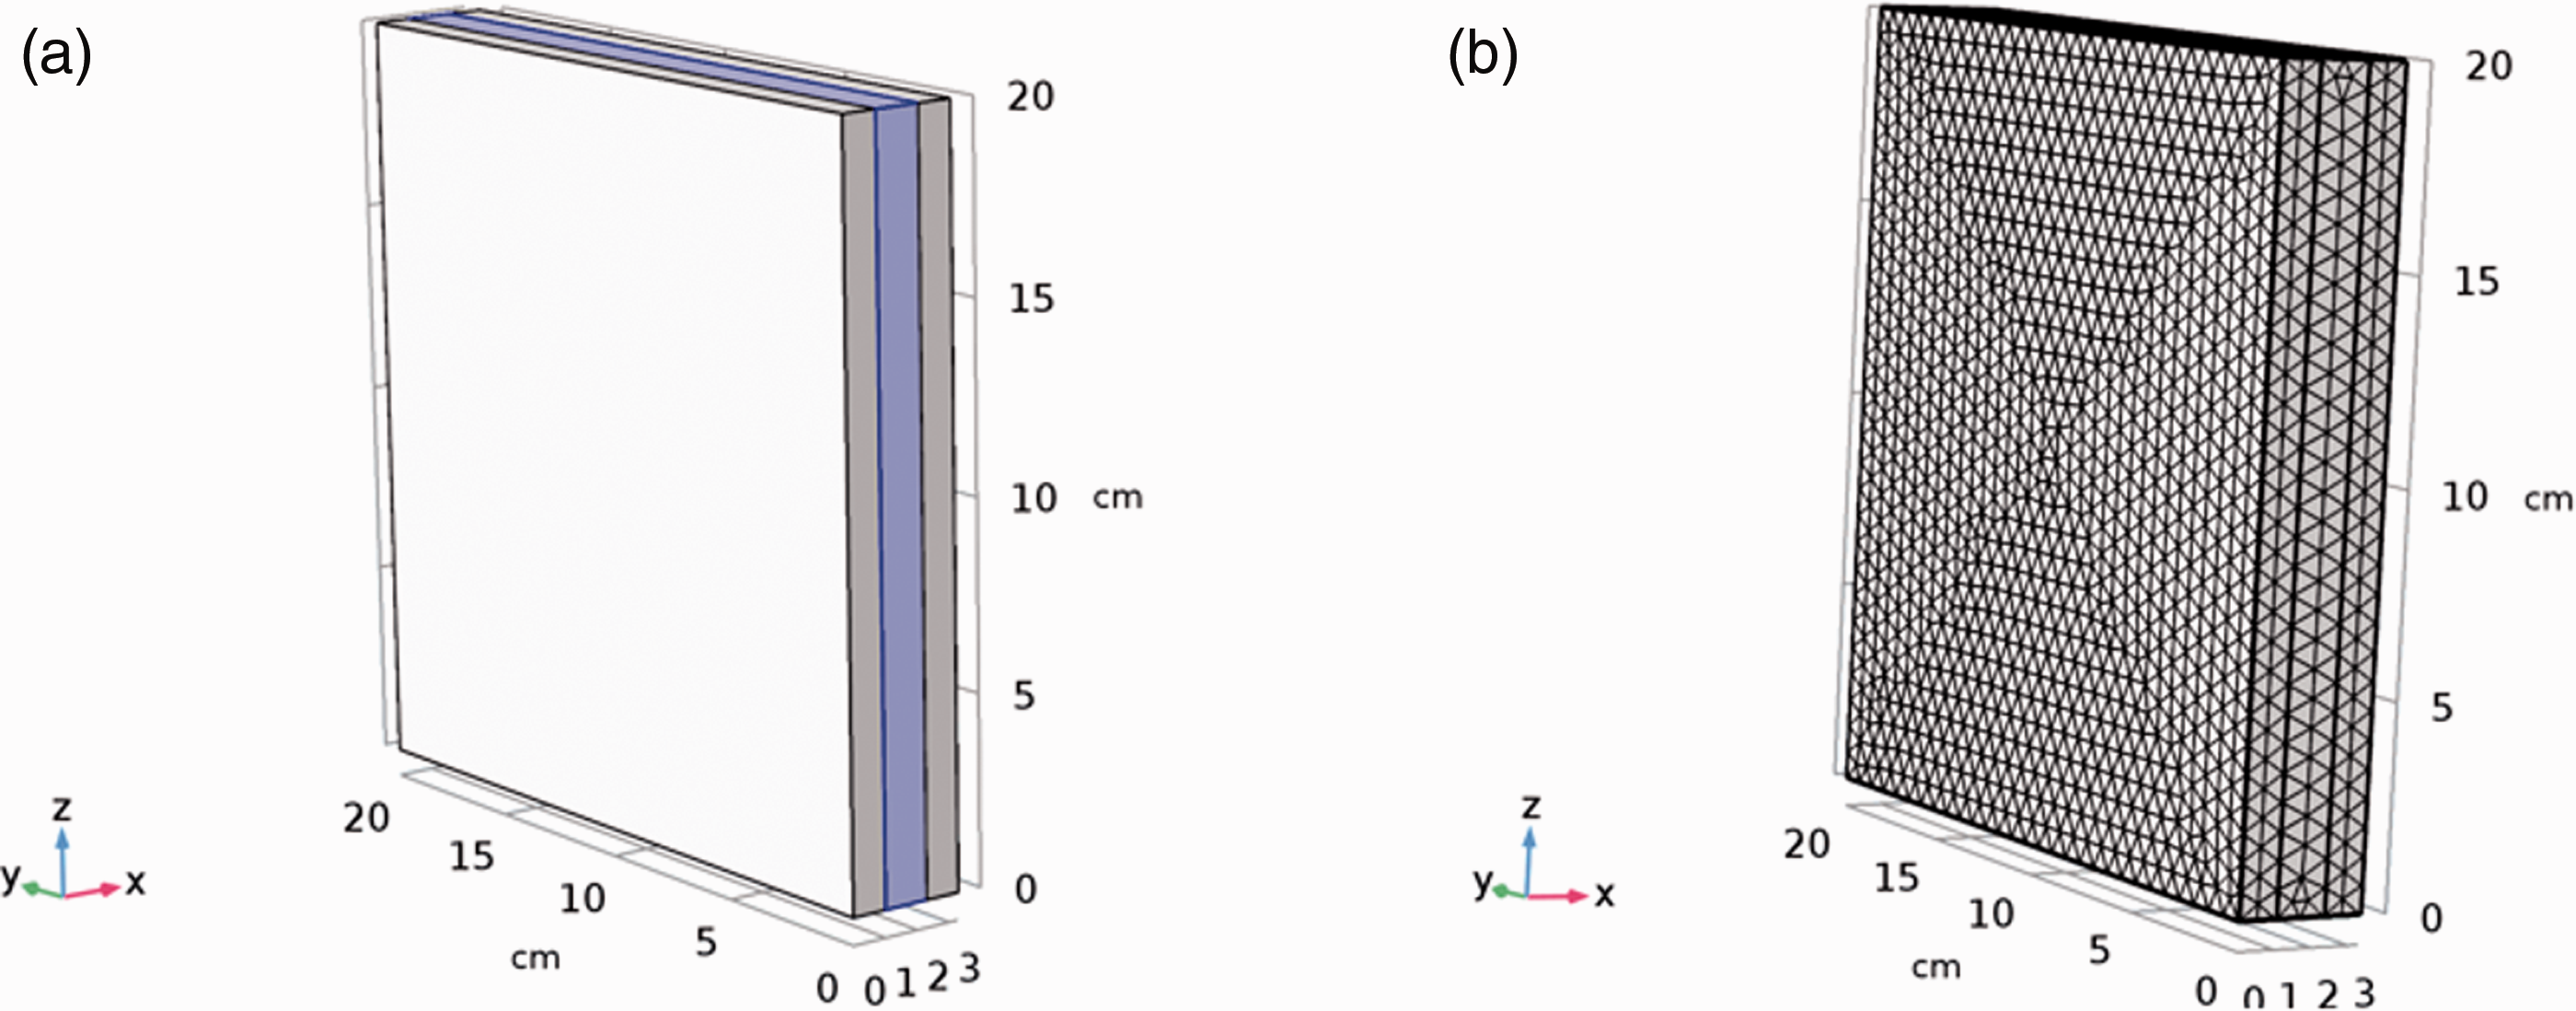

Using this model, it is possible to understand the thermal behavior of textile insulated walls. All layers (wood and textile insulation) are parallel and bonded to each other, therefore the interface resistance is supposed to be negligible. The calculations are presented according to the length of the wall, the temperature in the inner and outer faces where set at 36℃ and 15℃, respectively; these conditions are chosen in accordance with the experimental data presented in the Test cell and measurement devices section (Operative conditions). Figure 7 shows the calculated temperature distribution in textile isolated walls. Insulation impact is obvious. In this system (insulation + wooden wall), each component is endowed with a different coefficient of thermal conductivity. The different colors specify the temperature levels in relation to the thickness of the insulated wall. The part of red and blue color in the figure describes the maximum and minimum heat, respectively. The color does not change in (0–10 mm), which corresponds to the first layer of the wall, this can be explained by the high thermal conductivity of the wood, in contrast in the insulation the color changes very quick (red to blue) showing a higher heat loss. In the measurement process, the heat flow comes from the high temperature side to the low temperature side. Physical entanglement of fibers during manufacture process created a unique structure, particular direction and also very high porosity (Table 1). The needle-punched fabrics consist of at least two different regions. The first one is the area marked by the needle. It contains fibers that are oriented out of the plane of fabric. The second zone is situated between the impacts regions that are associated with the striking of the needles. This zone is not directly perturbed by the needles and retains a structure similar to the carded original tape. This rearrangement of the fibers leads to a structural anisotropy [16]. When the heat flows through the low thermal conductivity phase, which is the textile insulator, it splits into two paths because textile insulation is considered as an anisotropic structure consisting of a skeleton of fibers and pores, which retains air within its micro-porous structure. It interrupts the flow of heat owing to its tortuous path [27,28]. From this figure, we can see that all the isotherms are parallel to each other. The heat flow streams in the same phase along the Temperature distribution in textile isolated walls.
Mathematical model
The heat transfer through the walls is assumed one-dimensional and the heat transfer through the studied composite wall is schematically represented in Figure 8. The wall consists of a number of layers with different thicknesses and thermal properties. The inner layer of the composite wall is exposed to heat transfer by forced convection (hc,i) which relates to the heating load to maintain the temperature at 36℃. The outer layer is exposed to convection (hc,o) that relates to the cooling load to maintain the temperature at 15℃.
Illustration of the composite wall.
The study was conducted according to the following assumptions:
No heat generation, Negligible interface resistance, Constant thermal properties with respect to temperature, One-dimensional temperature variation, and Convective heat transfer coefficient on the outer and inner surface is kept constant.
Accordingly, the equation governing the heat conduction in the composite medium is

Solution of equation (1) requires an initial condition and two boundary conditions to be specified at the inside and outside surfaces. The boundary conditions are given as follows:
(i) Boundary condition at the inside surface (x = 0)
where hc,i is the inside-surface heat transfer coefficient, λ1 is the thermal conductivity of the wood layer.
(ii) Boundary condition at the inside surface (x = L1)
(iii) Boundary condition at the inside surface (x = L2)
where λ2 is the thermal conductivity of textile insulation.
where λ3 = λ1 is the thermal conductivity of the wood layer.
(iv) Boundary condition at the inside surface (x = L3)
where hc,o is the outside-surface heat transfer coefficient and 
Method of solution
The current problem is solved by a finite difference method using an implicit scheme. The composite wall of three layers is discretized into a number of nodes and the finite equations are derived for each group of similar nodes applying the set the balance of energy. We see in Figure 8 that there are four types of nodes: namely, (i) the limit node on the inner surface (node number I), (ii) interior knots inside layers, (iii) interface nodes at the interfaces between the layers, and (iv) boundary knot on the outer surface (knot number N).
Replacing the partial derivation in the equation (1) by the backward finite difference terms, the problem then becomes an implicit problem. The indexes i and n relate to the space and time coordinates, respectively

Rearranging the above equation gives the following

The resulting equations can be represented in the condensed matrix form
{A}: Square dimension matrix (N, N) {T}: Square matrix of dimension unknowns (N, M) {SM}: Known column matrix of dimension (N, 1)
Coefficients appropriate to nodal equations and boundary conditions.

Validation of the mathematical model
The mathematical model proposed here refers to the thermal performance of walls equipped with different types of textile insulation (Wr, Wc, As, and Ak). In order to verify the accuracy of this simulation, the results of this simulation were compared with the experimental results. The experimental tests were carried out during a two-cycle period. For each cycle, the heat source inside the test cell is switched “on” for 5 h and its set point is 36℃. The finite (implicit) difference method was used for derivate numerically the one-dimensional heat conduction equation solution with a length of 0.000268 m, a total of 120 knot and step time of 6 min. The code was developed using simulation software and simulation results are compared to the measured during a two-cycle. Figure 9 shows the measured and simulated outside surface temperature of the four walls outfitted with the insulating mats. The black curve represents the measured data and the blue curve represents the simulated temperatures taking into account the thermo-physical properties of the textiles insulating mats presented in Table 1. It is clear that the measured show a very good agreement with simulated exterior surface temperatures with a difference between the two curves does not exceeding 0.35℃ on average. Therefore, the efficiency of the heat-transfer analysis is verified. Some simulated temperatures exhibit abrupt changes, which have not been well predicted in the numerical simulation in the range of 1000–1100 min. Another observation concerns the initial temperature value at t = 0, the two graphs do not start from the same value. This condition is probably attributed to the different initial temperature profiles.
Numerical and measured exterior surface temperature for wall outfitted with (a) Wr, (b) Wc, (c) As, and (d) Ak.
Insulation configurations applying on wooden walls
Two different wall configurations containing one, two, and three insulation layers are considered and shown schematically in Figure 10. LI and LW on the configurations is the textile insulation and wood thickness, respectively.
In configuration 1, the thickness of the insulation has varied from 1 to 10 cm and placed between the two wood layers. The purpose of this configuration is to determine the optimum thickness in terms of thermal performance (outside temperature reduction). In configuration 2, the location of the optimal insulation was discussed; Cfg2-insulation placed inside: Cfg2-b insulation placed outside. In configuration 3, wooden walls with two layers of LI/2 thick textile insulation, placed inside and outside (Cfg3-a), inside and in the middle (Cfg3-b), outside and in the middle (Cfg3-c).
Wall configurations showing layer arrangement.

Results and discussion
Saturation time and heat flux reduction
Figure 11 shows a plot of wall temperature at different times, during the heating period, which is a time-dependent period. The temperature inside the insulated wall changes due to temperature changes imposed on the boundaries. The temperatures inside the system change over time and tend toward a new equilibrium corresponding to new conditions. At the equilibrium, the heat flux in the system is again equal to the heat flux and the temperatures at each point inside the wall does not change anymore, this stability reflects the steady state [29].
Temperature distribution as a function of time (a) Wc, (b) Wr, (c) Ak, and (d) As.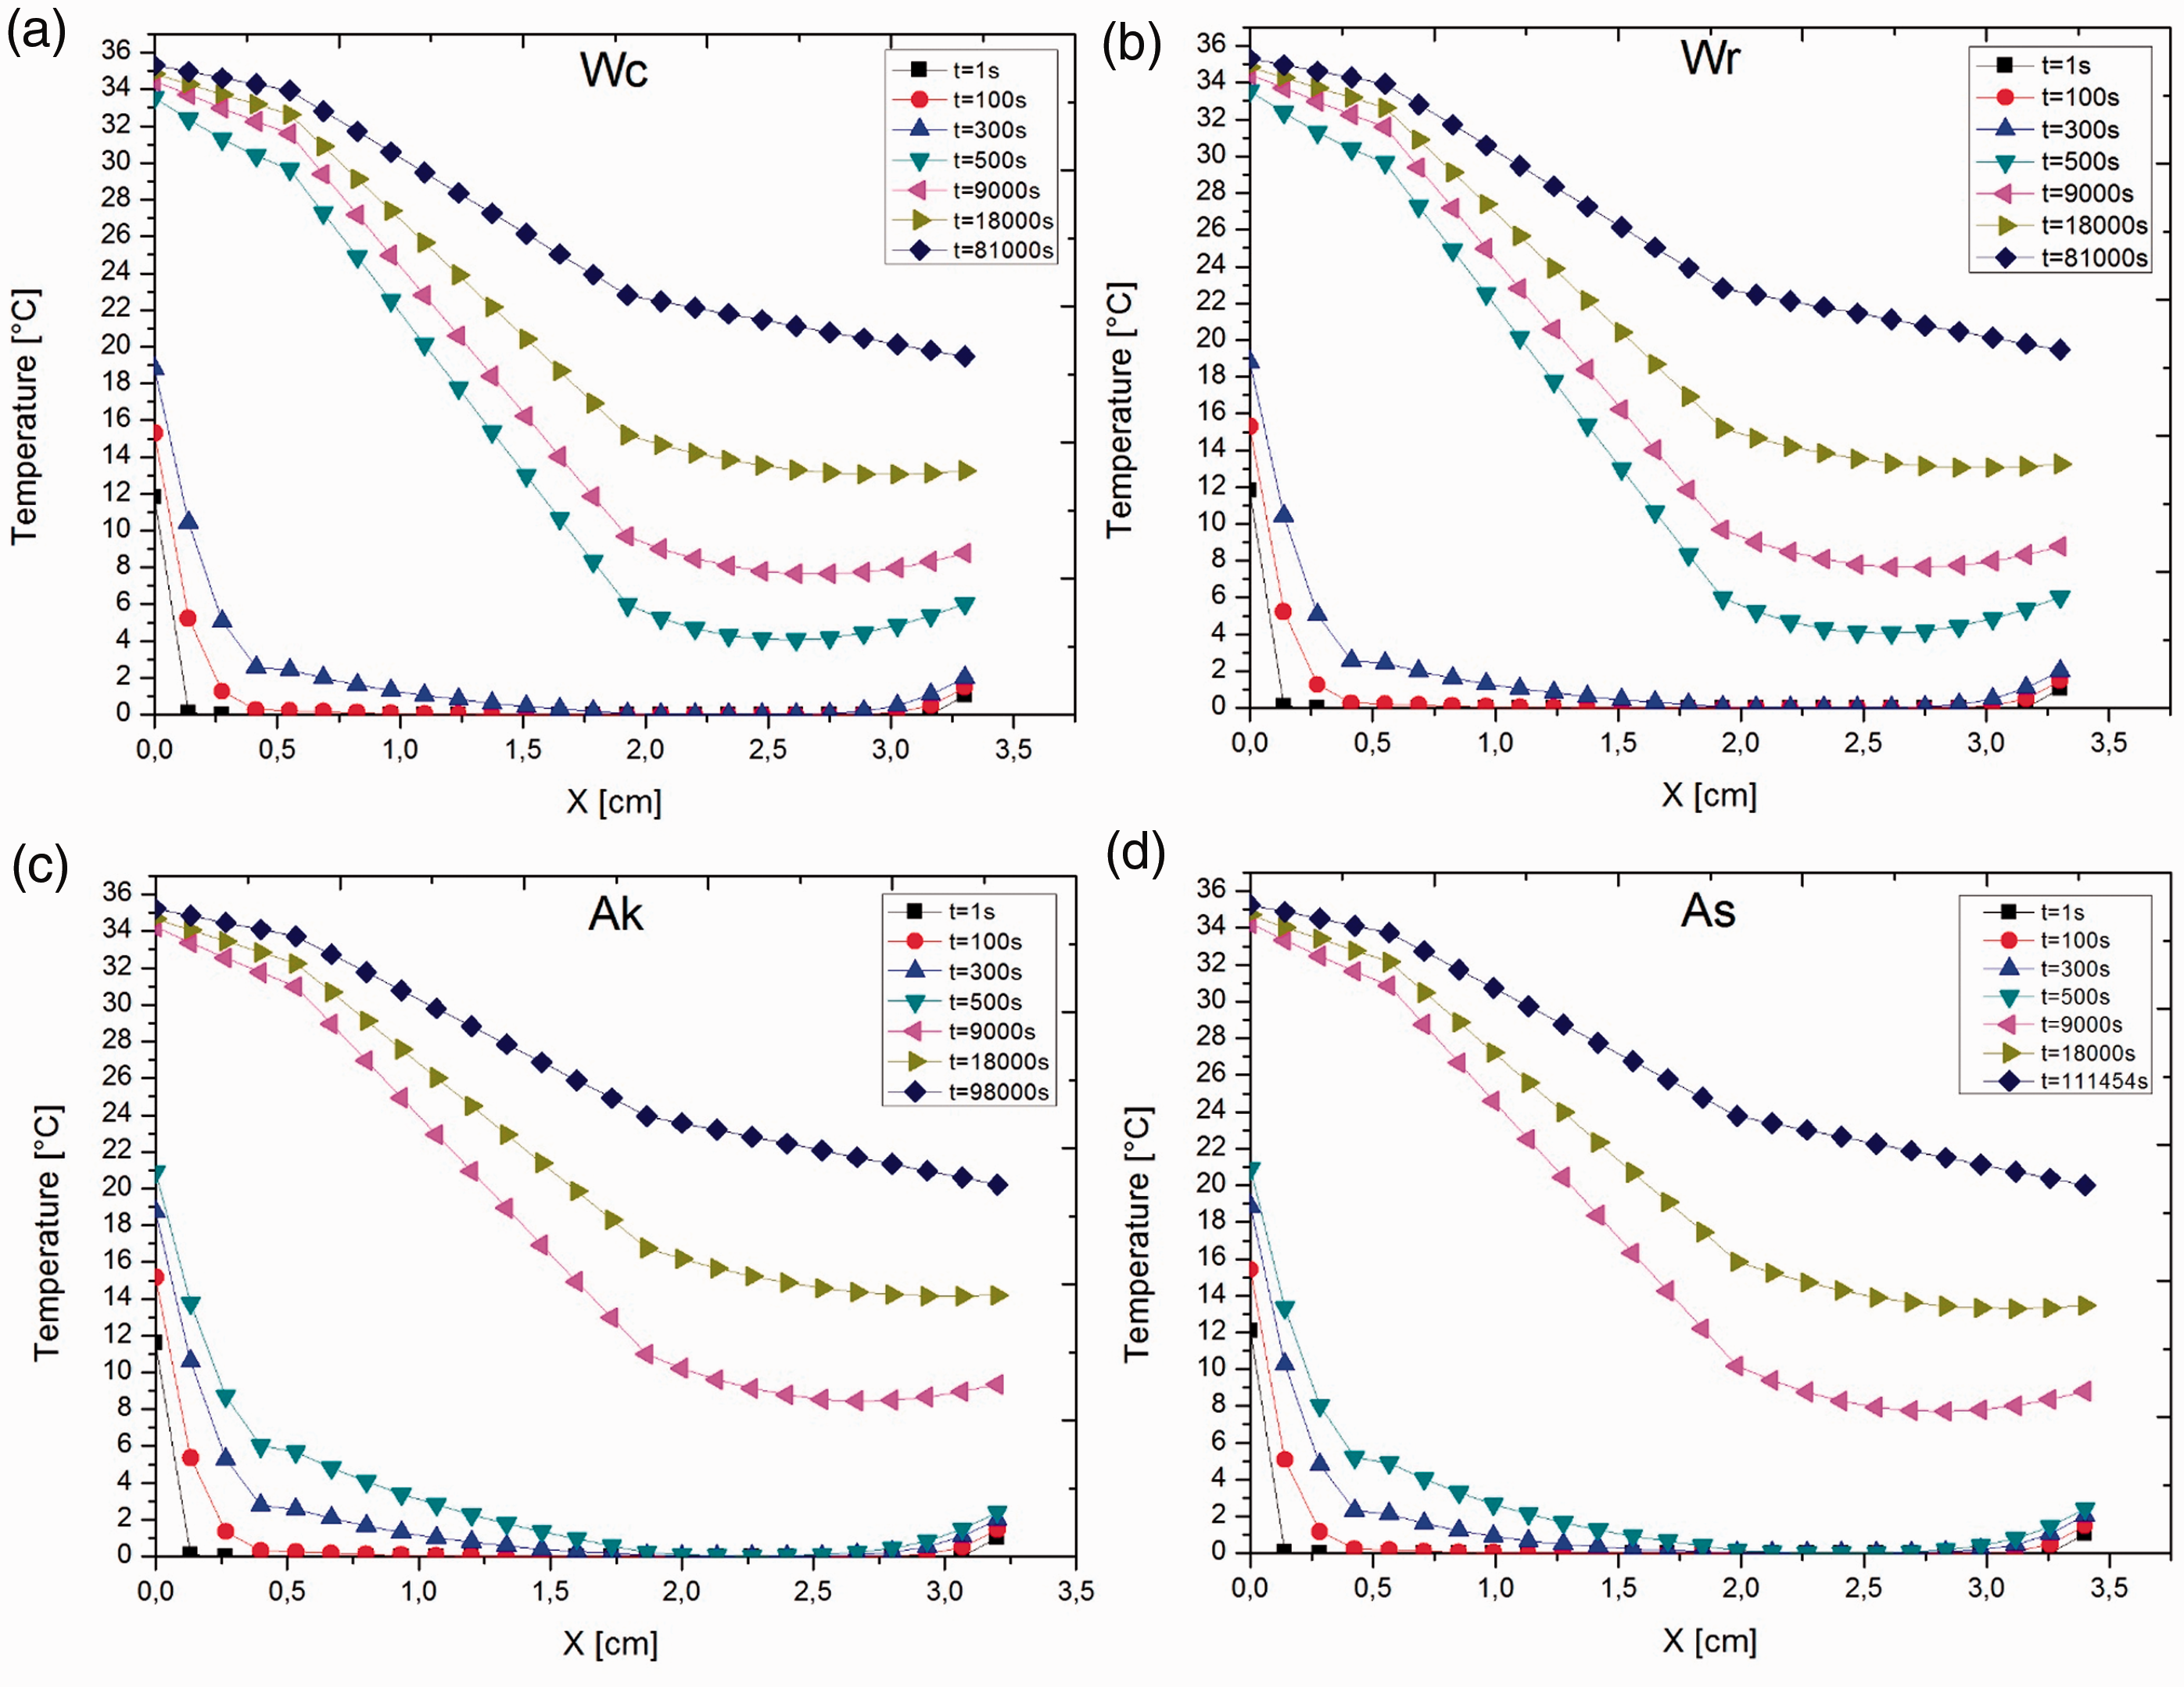
In case of As the steady state is reached at time close to 111,454 s, for Ak, Wr, and Wc the time was about 98,000, 81,000, and 70,698 s, respectively. This difference between the textile insulation is strongly related to the heat capacity, the greater the heat capacity, the longer the system (isolation) takes to reach equilibrium. These figures also show that there is a significant drop in temperature across the textile insulation layer, due to the lower thermal conductivity of textile insulation.
Figure 12 shows the simulated heat flux densities through the insulated walls. First, it is clearly observed that textile insulation has a large heat reduction ability. This conclusion is based on the comparison between the convective heat flux in the inner surface (equation (1)) and the outgoing heat flux measured at the outer surface. The reduction percentage of the heat flux at maximum of heating (300 min) was calculated using the following equation
Heat flux densities through the textiles insulated walls.

The percentage reduction of the heat flux of walls outfitted with the insulating mats.

Effect of the insulation thickness on the outer temperature/optimization of insulation layer thickness
It is obvious that when the thickness of the insulation increases, the thermal performances and the costs increases, it is necessary to determine the optimal thickness in term of thermal and economic performances.
In the present analysis, the optimization was done by considering only thermal performance (outside temperature reduction). Several thicknesses of insulation, 1–10 cm, were checked with an insulation placed in the middle of the thermal mass. The total thickness of layers of wood wall is maintained constant (20 mm).
The effect of the thickness of the insulation on the outside temperature of the walls is shown in Figure 13, it is clearly observed that the temperature suddenly decreases for the thicknesses between 1 and 5 cm for all samples (3.63%–1.87%), once it reaches 6 cm, the variation becomes less important (1.5%–0.9%).
Effect of insulation thickness on outdoor temperature.
The thermal behaviors of the walls agree with the values of the thermal properties related to textile insulation. In fact, thermal conductivity characterizes the behavior of materials during heat transfer by conduction. The lower the thermal conductivity, the more the product insulates well. The thermal conductivity is in the range of 0.03476–0.04877 W/(m·K), which explains the identical shape of the curves in Figure 13.
Figure 14 shows the calculated temperature distribution in the wall equipped with the Wr insulation, the different colors specify the levels of temperature with respect to thickness. The red and blue color part in the figure shows that maximum and minimum heat is retained in the fabric respectively. the effect of the insulation is clearly observed for the optimal thickness (6 cm), the change of the coloring, which is related to the temperature, takes place only at the level of the insulation (red to blue).
Temperature distribution in textile insulated walls. (a) configuration-1, (b) configuration-2c , (c) configuration-3a , (d) configuration-3b.
The simulated exterior temperature at 300 min (maximum heating) is shown in Figure 15(a), the difference in terms of outside temperature becomes negligible, and from this curve, it is possible to deduce the optimal thickness, which is about 6 cm. The corresponding thermal resistance (R) depicted in Figure 15(b) shows a linear increase with insulation thickness as expected. At optimal thickness (Lo,i), thermal resistance has a value of 1.5–1.9 (m2·K) / W for all textile insulators, which is a very acceptable value for a lightweight construction and is the optimal (recommended) wall R value under the present conditions.
(a) Outside temperature as a function of insulation thickness. (b) Thermal resistance of textile insulated walls as a function of insulation thickness.
Effect of wall configuration of exterior surface temperature under optimal insulation thickness
Five different locations of the insulation were tested to find the best conditions that could positively affect the outside temperature. The outside temperature values for all configurations are shown in Figure 16. In the wooden walls, the insulation was placed on the outer side and inner side of the thermal mass (Cfg2 a, b). The outside temperature varies between a maximum of 17.7℃ and a minimum of 17.1℃. In the case of two insulation layers with optimized thickness in different positions, placed inside and outside (Cfg3-a), inside and in the middle (Cfg3-b), outside and in the middle (Cfg3-c). The wall improves its thermal performance and allows lower temperatures. The maximum reached is 17.2℃ and the minimum is 16.8℃. It should be noted that outside temperature varies little for 2-a, b configurations for any wall. However, it is quite interesting to note that the 3-a, b and c configuration show a great effect on the outside temperature.
Outside surface temperature for different configurations.
The walls outfitted with Wr and Wc are nearly identical with a deviation of 0.16℃. The same observation for walls outfitted with As and Ak are nearly identical. Moreover, it is shown that Wr and Wc insulators has a better thermal insulation capacity than the As and Ak with an average difference of 0.38℃.
In Figure 14, the different colors specify the levels of temperature with respect to thickness. The red color part in the figure shows that maximum heat is retained in the fabric. The color change (red to blue) showing higher heat loss. First of all, the color change is at the level of the first layer of insulation and not in the wood. In configuration 2, the outside surface temperature is around 18–17℃, on the contrary, in the configuration 3 (a, b and c) the outside surface temperature is 16℃ with a decrease of 1℃, which shows that this latters are better; these results also show the reliability of the developed model.
Conclusion
This research paper focused on the investigation of the thermal performance of an external wall outfitted with new insulation materials based on textile waste. For this motive, a numerical model, which simulates a multilayers wall exposed to the laboratory conditions, is developed using the finite difference method. The numerical model is successfully validated with a previous experimental results published by the authors which concern a cavity at reduced scale with four vertical walls. Firstly, we used Comsol software to ensure that the heat transfer in the vertical walls is one-dimensional in order to use a corresponding model. Then the model is used to study the effect of the thickness and location of the textile insulation on the thermal characteristics of the walls of the cavity. The results indicated that textile insulators have great heat reduction ability with an average reduction percentage of 49.32% compared to a reference case. The impact of insulation thickness on surface temperature shows that from 6 cm, there is no influence of insulation thickness; therefore, the optimum insulation thickness is estimated to be 6 cm. It is also found that, the insulation location does not influence significantly the thermal performance of the wall.
Footnotes
Declaration of conflicting interests
The author(s) declared no potential conflicts of interest with respect to the research, authorship, and/or publication of this article.
Funding
The author(s) received no financial support for the research, authorship, and/or publication of this article.