
Abstract
Based on the research work of traditional electromagnetic shielding fabrics and frequency selective surfaces, the novel high-pass woven fabrics were proposed. Two different unit cell models were built and compared, and a series of design samples were further simulated based on the models. Through contrastive analysis and discussion of the simulated results, the validity of model 1 was verified and the influence rules of various parameters were explored. Compared with model 1, model 2 was more precise containing the textile information, like yarn crimp, fabric porosity and thickness, but model 1 could substitute model 2 to predict the transmission characteristics to some extent. The ratio of conductive and dielectric yarns affected the high-pass characteristics greatly, and different from two-dimensional high-pass woven fabrics, one-dimensional high-pass woven fabrics showed distinct polarization selective characteristics. Yarn electromagnetic parameters and fabric parameters could also exert an effect on the S21 curves in different degrees, which could help designers choose materials and determine the fabric parameters effectively. The modelling and simulation work could provide guidance to the development of actual high-pass woven fabrics.
Keywords
Introduction
The harm of electromagnetic (EM) wave has been discussed for many years, which mainly reflects in EM interference, environmental pollution and information disclosure [1,2]. Accordingly, EM wave shielding or absorption materials have been also widely studied, including the shielding properties of soft fabrics. Traditional EM shielding fabrics were fabricated through conductive polymer coating or conductive yarn weaving [3–5], which were hard to maintain the wearing properties. In order to develop the novel shielding fabrics with good shielding effectiveness (SE) as well as wearability, the concept of frequency selective fabrics (FSFs) was proposed and specific design ideas as well as fabrication methods were explored [6–10].
In the previous studies, the methods like silk-screen printing, computer embroidery technology, cloth hot stamping process were used to obtain the periodic conductive pattern on the surface of fabrics [6–9]. The uninvolved textile fabrication technology, like weaving, knitting and basketry processes, could be also used to fabricate the FSFs, in which the periodic conductive patterns are embedded in the fabrics, slightly different from the form of fabric substrates. Actually, some researchers carried out related work and obtained some conclusions based on the traditional design methods, while the research work did not involve the specialized model as well as simulation process applicable to fabrics and deeply explore the influences of relevant parameters [11–14].
There were small differences between the simulated and measured results, due to the fact that traditional models did not contain the textiles information. Considering the complexity of textile structures, it is necessary to build the sophisticated models and explore the influences of textile parameters. The conductive grid structure was proved to have high-pass characteristics, meaning the EM waves could pass through the materials in the high frequency region, while they could be totally shielded in the low frequency range. On the whole, the paper aims to solve some basic issues by means of computer simulation. Specifically, two kinds of unit cell models were built and used for the simulation process. Through the comparison of simulation results, the similarities as well as differences between two models were illustrated and some basic influence rules of parameters were explored.
High-pass woven fabrics and unit cell models
Structure of HPWFs
For most woven fabrics, the warp yarns and weft yarns are mutually perpendicular. Based on this feature, woven FSFs could be easily fabricated through periodic arrangement of conductive yarns and dielectric yarns. Although the position relation of warp and weft yarns is limited, the shape of unit cells can be various, because the number of conductive yarns could be adjusted freely. Figure 1 shows three kinds of high-pass woven fabrics (HPWFs), in which the coloured yarns are conductive while the dark yarns are dielectric. In Figure 1, the corresponding unit cells could be obtained by analysing the periodic arrangement of conductive and dielectric yarns, as marked using red dashed square frame.
Three kinds of HPWFs and unit cells (a) 2D unit cell; (b) 1D unit cell; (c) combined unit cell.
Figure 1(a) to (c) is HPWFs with two-dimensional (2D), one-dimensional (1D) and combined unit cell respectively, and they could represent almost all the orthogonal HPWFs. By extracting structure and material parameters of the unit cells, like conductivity of conductive yarns, dielectric properties of dielectric yarns, ratio of yarn arrangement number, yarn width and spacing, fabric thickness, etc., the equivalent models could be built and provide the basis for effective simulation process.
Model building
In order to simulate the transmission characteristics of EM waves precisely and efficiently, suitable unit cell models should be built, taking into account the practical situation as well as necessary assumptions. As a typical instance, two different unit cell models of Figure 1(a) were built and compared, and all the other HPWFs unit cells could be modelled using similar methods. On the basis of classical model, model 1 (simplified model) of HPWF unit cell could be easily built, which is shown in Figure 2(a). The model consists of conductor and dielectrics, which are corresponding to conductive yarns and dielectric yarns separately. The typical feature of model 1 is that it is compact and smooth. In Figure 2(a), a1 and a2 represent the length and width of the unit cell, and b1 and b2 refer to the length and width of the dielectrics, respectively, and t is the equivalent thickness.
Unit cell models of HPWF (a) model 1; (b) model 2.
Model 1 is ideal because the yarn crimp effects and possible pores between yarns are neglected, and therefore the simulation results are approximate, which could be used to provide reference for actual fabrics with similar dimensional parameters. Taking the yarn interlacement state into account, model 2 (sophisticated model) of HPWF unit cell could be built using TexGen, which is shown in Figure 2(b). In the model, m1 and m2 are warp and weft yarns number, and n1 and n2 refer to dielectric yarns number of the two directions, and w and g are yarn width and gap between yarns. t refers to the equivalent thickness of fabric, and the cross-section shape of yarns is assumed to be elliptic, with the value of long axis w and short axis t/2, respectively. Differing from model 1, model 2 is closer to the real fabric structure, because it depicts clearly the surface unfairness and fabric weave structure.
Model 1 does not contain the information of textiles, and therefore the influence rules of yarn as well as fabric parameters could not be explored, whether or not they are significant. However, the time consumed in simulation process of model 1 is certainly less compared with model 2. Two kinds of models could provide modelling basis for the other HPWFs and lay foundation for the following simulation process. Also, the internal differences of two unit cell models and corresponding causes could be investigated by comparing the simulated results.
Simulation process
Simulation settings
As the modelling process was completed, two kinds of models were imported into Computer Simulation Technology (CST) Studio Suite software for the following simulation process. Different from the finite element method used in our previous papers [6,8–10], the basic algorithm embedded in this software is finite integral technology. Figure 3(a) and (b) shows the simulation schematics of model 1 and model 2, respectively. Here, the periodic boundary conditions as well as Floquet port were employed, and two parts of the models were set as conductive and dielectric, respectively. The sweep frequency range was 1–30 GHz, with the step of 0.1 GHz, and adaptive tetrahedral mesh refinement was used in this research work. In Figure 3, the transmission direction of EM waves is perpendicular to the surface of HPWFs and of course the incidence angle could be adjusted to characterize the angle stability.
Schematics of simulation process (a) model 1; (b) model 2.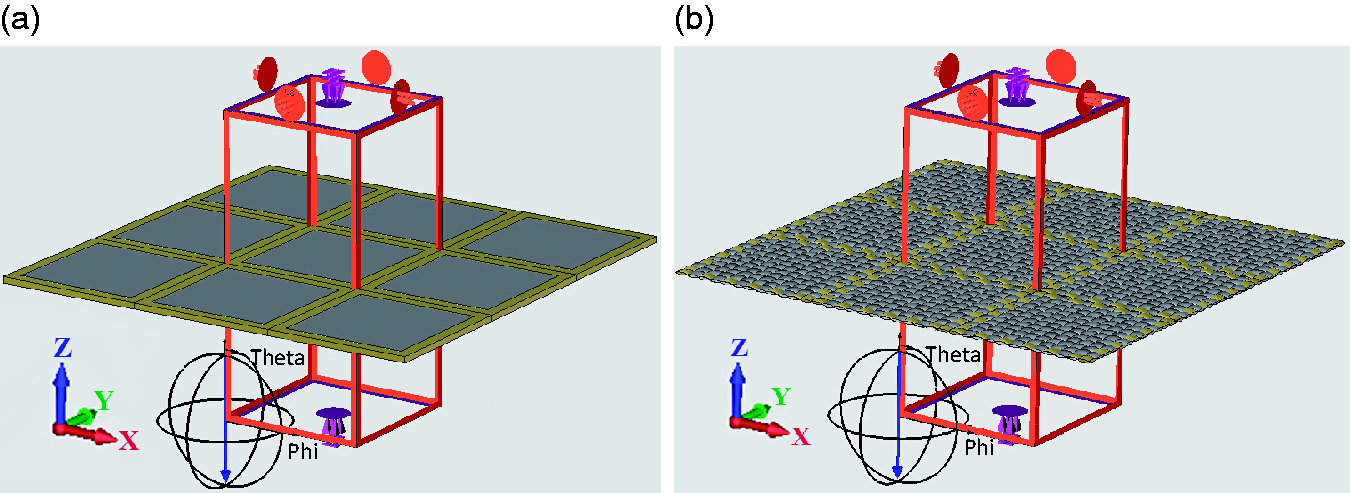
Simulation design
Simulation samples with different model types.

Analysis and discussion
Based on the above simulation process, the results of different samples could be obtained. Through contrastive analysis and discussion, the difference between two models was explored and the influence rules of various parameters were illustrated.
Result comparison of two models
To explore the transmission characteristics of proposed HPWFs, the specific ratio of dielectric yarns and conductive yarns was set as 10 to 2 in warp as well as weft direction, and therefore the unit cell was square including 12 warp yarns and weft yarns. According to the assumed pick count, the side length of the unit cell and the dielectrics should be 5.04 and 4.2 mm severally. The conductor was supposed to be perfect electric conductor (σ = ∞) and the dielectrics was supposed to be vacuum (ɛ = 1). Other parameters were also assigned values (w = 0.4 mm, g = 0.02 mm, t = 0.2 mm). Figure 4 shows the result comparison of two models, including the transmission coefficient (S21) and reflection coefficient (S11) curves, and the corresponding difference-value (|ΔS21| or |ΔS11|) curves. The meaning of S-matrix was illustrated at length in our previous paper, and it was not illustrated here [6].
Result comparison of two models. (a) Transmission coefficient and reflection coefficient curves; (b) Difference-value curves.
From Figure 4, it could be seen that the proposed HPWFs indeed show high-pass characteristics, which are different from the broad-spectrum shielding properties of traditional EM shielding textiles. In Figure 4(a), two S21 curves show the same rising trend, while the values of model 1 are a little smaller on the whole. Here, −10 dB (90% of EM waves could be shielded) was selected as the threshold value to evaluate the transmission characteristics, and the critical frequency points of model 1 and 2 are 9.54 GHz (point A) and 8.48 GHz (point B), respectively, with the difference of 0.2 GHz. Two S11 curves are also close to each other and they both show the declining trend as expected. Taking −0.5 dB (10% of EM waves is reflected) as the threshold, the common frequency 8.48 GHz (point B) could be obtained. Figure 4(b) shows more clearly the small difference-value, which is less than 1 dB in most of the frequency ranges and the maximum value is about 1.13 dB. With the increase of EM wave frequency, the difference-value of S21 and S11 decreases and increases, respectively. The reason for the small deviations between the two models could be explained through the simple equivalent circuit, as shown in Figure 5.
Equivalent circuit model and side view of two models. (a) Equivalent circuit of wire-grid FSS; (b) Side view of two models.
Figure 5(a) shows the parallel wires act as inductors as they are normal to the magnetic field, and the electric field may create positive and negative charges on the edges of conductive wires, producing the gap capacitors [15,16]. However, the wires are much thinner than the entire unit cell and they are connected by the vertical wires, both of which make the capacitance very small and could be neglected, and thus the equivalent inductors play the decisive role in the macroscopic characteristics. Figure 5(b) reveals that the conductive yarn in model 2 is a bit longer in practice due to the spatial crimp, although the projected lengths of two models are same, which makes the inductance of unit cell model 2 slightly larger. Thus, more EM energy may be converted into the electron kinetic energy and less transmittance occurs at this time, and that is why S21 values of model 2 are a little larger.
From the above discussion, we know that the results of two models are close to each other, verifying that model 1 could substitute model 2 to some extent, and the final results could be amended considering the influence of textile structure. However, model 2 is still necessary to obtain the precise results, because different yarn crimp modes and degree certainly have different effects. Further, different fabric weave structures will lead to different yarn crimp, and therefore the relevant influences could also be explored based on the above analysis.
Influence of structure parameters
During the actual product development process, it is essential to learn about the influence rules of relevant parameters. As the most important point, the effects of arrangement ratio and mode of dielectric yarns and conductive yarns were explored, which could offer the theoretical basis for the relative design. Figure 6 gives the S21 curves of samples in Table 2, from which the influences of structure parameters could be obtained.
S21 curves of samples in Table 2. (a) S21 curves with different m/n ratios; (b) S21 curves of 2D and 1D unit cells under two polarization modes. Simulation samples with different unit cell sizes.

In Figure 6(a), as m/n ratio changes from 12/10 to 12/8, the S21 curve moves to the high-frequency region, but as m/n changes to 18/16, the curve moves to the low-frequency region and becomes more ideal. Taking −10 dB as the threshold, the critical frequency points of 2#, 3# and 4# samples are 8.48 GHz (point B), 11.84 GHz (point C) and 4.15 GHz (point D), respectively. As the frequency is set as point B, the S21 values of three curves are −10, −7.39 and −3.08 dB separately, with large differences between each other. From Figure 6(b), we could see that S21 curves of 2# sample under TE and TM are totally the same, and 5# sample also shows the basically same transmission characteristics under TE mode. However, the S21 values of 5# sample are near zero under TM mode, which means all the EM wave could pass through the fabric at this moment.
The influences of structure parameters could be also explained through the equivalent circuit model shown in Figure 5, and the inductance of wire-grid frequency selective surfaces is given in formula (1) [16,17].

In Table 5, TE mode and TM mode are two kinds of two polarization modes. For TE mode, the relative position of electric field, magnetic field and transmission direction is shown in Figure 5. For TM mode, the direction of electric field is horizontal and magnetic field is vertical. From Table 5, it could be clearly seen that L value of 2# sample is larger than 3# sample, while it is smaller than 4# sample, consistent with the visible rule of S21 curve shift. Bigger value of L means that more EM wave would be converted to inductance loss, which would result in less transmittance. That is, S21 and S11 are directly related to the value of L, which therefore could be used to predict the transmission characteristics. It should be noticed that 2D unit cells are symmetrical and they are insensitive to polarization modes of EM waves, while 1D unit cells show distinct polarization selective characteristics, which could be used in some special fields.
Influence of yarn EM parameters
Simulation samples with different yarn EM parameters.


S21 curves of samples in Table 3. (a) S21 curves with different yarn conductivity; (b) S21 curves with different yarn permittivity.
Simulation samples with different fabric parameters.

Calculated L values of samples in Table 2.

Figure 7(a) shows with the decrease of yarn conductivity, the high-pass characteristics become worse gradually. As the conductivity of conductive yarns is 104 S/m (6# sample), the corresponding S21 curve is very close to the ideal curve (2# sample), with minor changes. However, as the conductivity decreases to 103 S/m (7# sample), the S21 curve changes drastically, especially in the low-frequency region. Figure 7(b) shows the permittivity of dielectric yarns could also affect S21 curves. As the permittivity changes from 1 to 3 and then to 5, the S21 values in the high-frequency region increase gradually, while there are not any differences in low-frequency region. The distinct changes of S21 curves in Figure 7(a) and (b) are marked using blue dashed boxes, which clearly presents the large variation amplitude.
The above discussion reveals that the conductivity of conductive yarns should be at least 104 S/m in the product development process and overlarge conductivity is not needed considering the limited room to adjust the S21 curve. The conductivity unit (S/m) could be translated into resistance unit (Ω or Ω/m) through the medium of cross-section area, and therefore it is practical. The use of yarns with high permittivity could improve the transmission characteristics of high-frequency region to some extent and then better meet the relevant requirements.
Influence of fabric parameters
The above contrastive analysis of two models proves that textiles’ features could bring effects to the transmission characteristics. To explore the influences of yarn width (w) and gap between yarns (g), samples 10# and 11# were simulated and compared with sample 8#, shown in Figure 8(a). Also the S21 curves of 8#, 12# and 13# were compared to study the influence of fabric thickness (t), shown in Figure 8(b). w and g greatly affect the fabric porosity and therefore they are classified into fabric parameters here, together with fabric thickness.
S21 curves of samples in Table 4. (a) S21 curves with different yarn width and gap between yarns; (b) S21 curves with different fabric thickness.
In Figure 8(a), as w decreases from 0.4 to 0.2 mm, and g increases accordingly from 0.02 to 0.22 mm, the S21 values of three samples increase gradually, especially in the middle part of the frequency range. Taking −10 dB as the threshold, the three critical frequency points are 8.48 GHz (point B), 7.35 GHz (point E) and 6.54 GHz (point F), respectively, showing the trend of moving to low-frequency region. The S21 values corresponding to 8.48 GHz (point B) are −10, −8.88 and −8.01 dB, respectively. To explain the causes of above changes, the vertical views of design samples 8#, 10# and 11# are shown in Figure 9(a) to (c). The size of three unit cells keeps the same (5.04 mm) and the weaving density is identical (12 warp as well as weft yarns). Also the thickness of three design fabrics has no change (0.2 mm), revealing that the crimp degree of yarns is identical. By comparing the three samples, it can be concluded all the other influencing factors keep the same, except w and g.
Vertical views of three design samples (a) 8#, (b)10# and (c)11#.
In Figure 9, the fabric porosity significantly increases as the value of w decreases or g increases, and then the area proportion or volume fraction of yarns in a unit cell decreases, causing the effective dielectric constant and loss of the fabric decreases. As the EM wave interacts with sample 11#, the EM loss caused by dielectric properties is less compared with sample 8# and 9#, which would make S21 values increase correspondingly. Besides, based on the influence rules of structure parameters, the decrease of w would increase the value of equivalent inductance (L) and then improve the transmission characteristics. In the practical fabrication process, the influence rule of linear density could be predicted based on the obtained results if the bulk density keeps unchanged, and therefore the simulation work has practical value.
In Figure 8(b), the S21 values decrease gradually as the fabric thickness t increases from 0.2 to 0.4 mm and then to 0.6 mm. Three critical frequency points corresponding to −10 dB are 8.48 GHz (point B), 9.85 GHz (point G) and 11.53 GHz (point H), respectively, moving towards the high-frequency position. The values corresponding to 8.48 GHz (point B) are −10, −11.27 and −12.85 dB, respectively. Similarly, all the other influencing factors of sample 8#, 12# and 13# keep unchanged except the value of t. The difference of fabric thickness could be attributed to the different degrees of yarn crimp. The influence of fabric thickness is fairly easy to understand, due to the fact that more reflection and refraction of the EM wave may occur if the fabrics become thicker, and then less EM wave would pass through the fabrics, making the S21 values become greater.
Although the changes of w, g and t could affect the S21 values, the effects are relatively smaller compared with the structure parameters. Figure 8(a) and (b) shows the S21 curves almost overlap each other in the low and high frequency region, revealing that the fabric parameters have few effects at the moment and the conductive grid structure plays the dominant role.
Conclusions
By analysing the structure of HPWFs, two different unit cell models were built for comparison and further simulated using CST software. The modelling as well as simulation work could offer theoretical basis for the related design, and the obtained rules could help designers determine the dimensions and choose materials effectively.
Specifically, the obtained conclusions could be summarized as follows. (1) Equivalent circuit reveals that model 1 could substitute model 2 to some extent and model 2 is necessary to obtain the precise results, for different yarn crimp modes and degree would have different effects. (2) Structure parameters exert a tremendous influence on the high-pass characteristics. 2D HPWFs are insensitive to polarization modes of EM wave, while 1D HPWFs show distinct polarization selective characteristics. (3) Yarn EM parameters, including the conductivity of conductive yarns and dielectricity of dielectric yarns, also have an effect on the transmission characteristics, reflecting in low-frequency and high-frequency region, respectively. (4) Changes in fabric parameters, like fabric porosity and thickness, can also lead to changes in the shape of the S21 curves, although the effect may not be significant.
Footnotes
Declaration of conflicting interests
The author(s) declared no potential conflicts of interest with respect to the research, authorship, and/or publication of this article.
Funding
The author(s) received no financial support for the research, authorship and/or publication of this article.