
Abstract
Sensory investigations of the functional textiles could be an alternative for the quality inspection and control of the products. The purpose of this research is to use subjective evaluation technique for assessing the tactile comfort of some functional textile fabrics based on AATCC Evaluation procedure 5-2011. Blind subjective evaluations and visual subjective evaluations were performed for sensory investigation. Ten fabric-skin-contact and comfort-related sensory properties were used to evaluate the handle of the functional textile fabrics. The reliability of the sensorial data obtained by subjective tests was evaluated using statistical data analysis techniques. A minimum and maximum consensus distances recorded were 0.58 and 1.61, respectively, using a descriptive sensory panel analysis and proves the consistency and similar sensorial perception between panelists. The Pearson correlation coefficient between panelists was up to 96% and hence a strong agreement between the panelist’s judgment. The results allowed to consider the subjective evaluation using a panel of experts could be validated in the case of functional fabrics. For functional textiles, additional visual subjective evaluation should be considered to have a similar human perception in addition to blind subjective evaluation.
Introduction
Clothing comfort is an immediate demand both psychologically and physiologically for the consumers [1,2]. It is very important especially for the functional fabrics, because these fabrics are used for special purposes such as sport, military, and medical clothing [3]. The subjective judgments of the clothing comfort involve complex processes which consist of a large number of various stimuli from the clothing to communicate with the brain through distinct channels of sensory responses [4].
The production and development of the functional textile fabrics started more than two decades [5]. However, the mechanisms affecting the physiological and psychological characteristics of these textile fabrics, which bring a discomfort-feel during wearing hasn’t properly addressed. The research focused more on the functionality aspect [6]. Comfort can be assessed by measuring fabric handle which can be defined as the total handle sensation, familiarized when a fabric touches to the skin [7]. The fingers and the palms are mainly used for assessing the handle assessment [8]; because the highest density of the mechanoreceptors in the glabrous skin found in the fingers and the palms. For fabrics that have a direct contact with the skin, the tactile properties should be explored [9] to assess the comfort of the fabrics. Therefore, it is important to characterize the tactile sensation of the functional garments. The tactile sensation when touched mainly dependent on the environmental and the human activities experienced during day-to-day activities [4].
The fabric-skin-contact when wearing garments applies pressure and vigorous mechanical fatigue to the skin which further initiates the various mechanoreceptors and produces a variety of tactile sensations [10]. Evaluation of the fabric hand perception can be done either using subjective or objective measurement techniques [11–17]. The subjective evaluation data have been analyzed using various statistical and soft computing systems such as regression analysis [18], ANOVA [19], Kendall’s coefficient of concordance [11,14], STAT-HAND [20], and fuzzy logic models [12,21,22]. These analysis techniques used to convert the qualitative data into interpretable data.
The reliability and reproducibility of subjective evaluation depend upon many factors. Panel training is one of them. Test–retest reliability investigation has been used to study the completion of panelists’ training [23,24]. The effect of training number on subjective evaluation results has been studied [11]. Training number plays a vital role for the agreement level between panelists during subjective evaluation.
A lot of efforts have been performed starting from the work of Binns [25], Peirce [26], Kawabata [27], and Bishop [28] on the sensory evaluation of the fabric handle. These hand evaluation methods which basically based on a tactile perception influenced by the panelist’s own experience, age, sex, economic, cultural and professional background, fashion trend and national differences [6,29]. In order to make reliable statistical judgments, a large number of data are required.
Fabric mechanical and chemical finishings contribute to the changes in the handle and physical properties of the fabrics [10,12,30]. Furthermore, it has been shown that fabric finishing such as heat setting, calendering and many chemical treatments have an effect on fabric handle properties [29,31,32].
This study aimed to provide a sensory profile data for functional textile developers and manufacturers to use as a quality control checklist. To the best of our knowledge, the subjective evaluation of the functional textile fabric hand hasn’t addressed well. The sensory data were studied and analyzed carefully using various descriptive panel analyses tools.
Experimental part
Materials and methods
Functionality and production details of samples.

CNT: carbon nanotubes; PLA: polylactic acid.
The substrate for all the samples except samples 7 and 8 (see Table 1) was 100% plain weave polyester fabric from Almedahl-Kinna AB, Sweden (gsm: 159; average thickness: 0.3 mm; ends/cm: 30; and picks/cm: 22), heat set and bleached by the supplier. (The surface properties of samples can be found in online Supplementary Table S1).
Training the panel of experts
Four male and six female trained experts of textile background aged between 23 and 54 years were recruited to carry out the sensory evaluation of the tactile properties of the samples. They were from the same nationality as a strong agreement of tactile perception has been suggested [33] using this method. Panelists were then trained for the functional fabric evaluation; training being the main factor in subjective evaluation [11], and panelists were introduced about the definition of the handle of fabric, the concept of bipolar attributes, the method of assessment, the grading scale, the sequence, and the timing based on AATCC 5-2011.The training was conducted based on a specific protocol followed in literature [32,34] under a controlled environment. For the training session, the panelists were provided samples which are different from the actual samples but which have tactile sensation such has hard, smooth, soft, rough, and flexible accompanying with demonstrations.
The panelists were seated in a group and discussed to generate the tactile sensory terms. They were also provided with certain questionnaires which can help them to generate sensory attributes for the subjective evaluation. Sensory attributes were then selected by merging terms which are most selected by panelists and eliminating terms those mentioned only once with that of the author selection. Practical session was conducted to use the prescribed techniques. In order to narrow down the variability of the perception of the experts, pictures were demonstrated to describe how to handle the sample before the trial and during the test. They were also provided visual and explanatory information on how to assess the bipolar attributes. For total hand value (THV), the proposed end use of each functional fabric for the smart garment was briefly explained and demonstrated.
Subjective evaluation
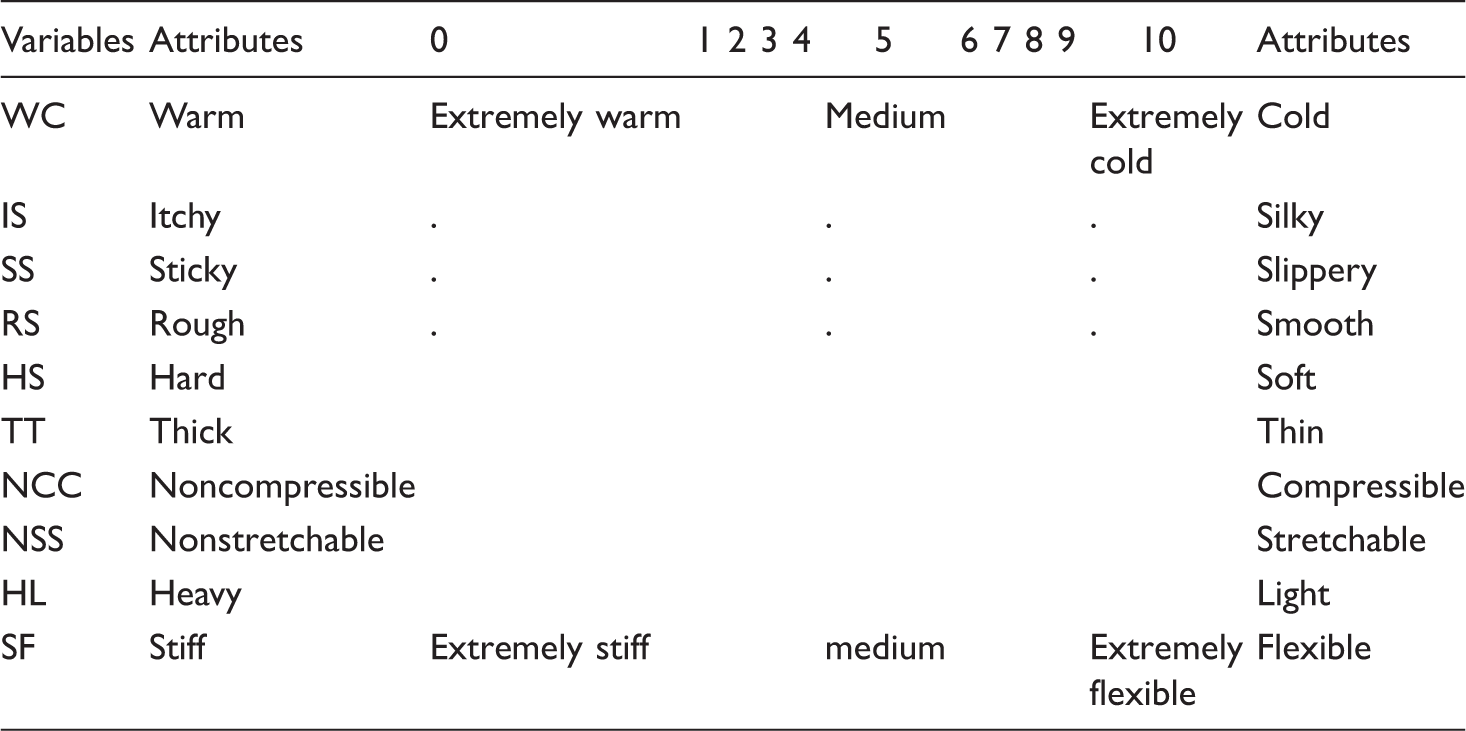
Bipolar attributes and their rating scales for hand value.
For the BSE technique, a box was provided to hide the samples from the panelist’s vision in which two hand holes in the box were provided during evaluation. Two facilitators were appointed and samples were randomly distributed to these facilitators and each panelist handled all samples and it took an average of 20 min for a group test. The test sessions took 3 days for both BSE and VSE tests including the training session. BSE and VSE were performed in a series. For all the samples, sides of the fabric worn next-to-skin were evaluated and each fabric sample proposed for specific end-use applications. Stretching and crushing more than one time during handling was the difficulty during the test for knitted samples. Therefore, separate samples were used for BSE and VSE techniques. The experts were first asked to differentiate between the two bipolar adjectives and then allowed to rate the fabric based on their first decision as per the scale given in Table 2. Each expert spent 15 min in the test room before performing the evaluation.
The applied statistical analyses
To quantify the subjective judgments of the experts on the tactile comfort of the functional fabrics and to observe the differences between BSE and VSE, some statistical analyses tools were performed. Among these:
– Panel analysis: to observe the consensus distance to perception using standard deviation; – Penalty analysis: to identify the preferences of the experts; – Two-sample comparisons of variances: mean values of BSE and VSE tests; and – Product characterization: to draw the sensory profile data of the sample for each bipolar attributes were performed to analyze and draw a meaningful interpretation and reporting of the subjective evaluation findings.
Plus, the Pearson correlation coefficients between experts and between mean values of BSE and VSE tests were analyzed using XLSTAT2017. Origin Lab 8.5 was used to convert some statistical data into diagrams. These statistical analyses gave a meaning to the subjective expert’s perception by breathing life into the subjective data to interpretable data. Furthermore, the XLSAT is a proper statistical tool meant for the interpretation of the sensory analysis. Therefore, this article tries to acquaint the reader with the basic sensory analysis tool and utilizing for the functional textile fabric subjective evaluation.
Results and discussion
Subjective judgments using human experts were presented for the tactile comfort evaluation of the functional textile fabrics. The tactile data obtained by BSE and VSE techniques were analyzed using various statistical methods and tools to yield results in a tabular or a graphical form, which can help to interpret, summarize, and validate the performances of the human perception on the subjective judgment of the functional fabrics.
The ability of the panelist’s perception on the functional textile fabrics with selected bipolar attributes depends on the tactile nature of the fabric. In this regard, Pearson correlation analysis was performed to see the tactile handle perception similarities between experts.
The tactile perception results of the functional textile fabrics were performed by analyzing the agreement level between panelists by panel analysis method using the standard deviations as a consensus distance. Consensus distance is the perception difference between each expert with the mean value of the perception. The panel analyses results of the samples are illustrated in Figures 1and 2 for BSE and VSE assessments, respectively.
Comparisons of expert’s perception using blind subjective evaluation.
This chart is a typical rating result for each assessor to the mean value. From Figure 1, the maximum inconsistency occurred at RS bipolar attribute variable for fabric C, where a standard deviation of 2.4 was recorded. While a minimum value recorded at NSS attribute variable with a standard deviation of 0.3 for fabric B. The rating scales were from 0 to 10; this means 2.4 differences of two or more than two expert’s perception means the range of the judgment between the bipolar descriptors has nearly in the same category even with the largest deviation. This indicates that the panels of experts have a similar perception on the tactile sensations of the functional fabrics. The other fabric sample results are between the aforementioned maximum and minimum consensus distance.
Comparably, for VSE test, as shown in Figure 2, the maximum perception difference occurred at the bipolar attribute variables of SF, where a 2.0 standard deviation existed for fabric H. At the same time, a 0.5 minimum standard deviation was recorded at NCC attribute variable for fabric I. In both BSE and VSE cases, we can observe that variables which are related to tensile strength (NSS) and compression (NCC) are easily identifiable and have small consensus distance for each expert. All other samples consensus distance is between this maximum and minimum standard deviation. However, the consensus distance recorded in VSE is better than that of BSE.
Comparisons of expert’s perception using visual subjective evaluation.
Therefore, the reliability of the panelist’s perception can be qualitatively checked by observing their behavior whether each subject feels nearly similar perception such that the standard deviation isn’t that large. Some panelist’s perception for each attribute appears to be indistinguishable; the perception is on the same side of the bipolar attribute. The experts showed roughly similar preferences for the samples that they handled, giving close values of the bipolar attributes, reported to be the average values generated by the panels. The range of the perceptions didn’t show big variation between rankings and this could be a clue of homogeneity within the panel of individuals.
Pearson correlation between experts using blind subjective evaluation.

Pearson correlation between panelists using visual subjective evaluation.

All the correlation values are different from 0 with a significance level of alpha equal to 0.05. However, there were low correlations between individual perception with expert 3 and expert 4 (the highlighted numbers) when compared. In fact, these weak correlation coefficients are still adequate for the subjective evaluation of the PEDOT-PSS-coated textile fabric. All the correlations are positive; indicates that all experts had nearly analogous kinds of preferences on the bipolar attributes for this fabric sample. Therefore, the linear associations between experts were significant when the functional fabric was assessed blindly. The results for other samples show nearly similar to the conductive-coated sample.
Similarly, in Table 4, it can be noted that the correlation coefficients indicated that strong association between experts when using VSE. However, still few (highlighted) weak associations were observed. In fact, the VSE recorded better correlation than that of the BSE.
This indicates each panelist showed a clear picture of consistency in evaluating the product. Therefore, subjective valuation could be used to predict the tactile comfort of the functional fabrics, which can be further used as a quality check evidence for functional and smart textile developers, manufacturers, and finishers. The Pearson correlation coefficients for other samples are nearly similar to the conductive-coated sample in both BSE and VSE methods with minimum and maximum correlations of 0.31 and 0.96, respectively. A multiple regression analysis was performed to observe the most determinant bipolar attribute for THV (VSE). Since VSE has better correlation coefficient than BSE, we chose VSE for multiple regression analysis. And the results are shown below: Fabric A = 9.9-0.58 WC-0.32 SS + 0.22 RS-0.45 HS-0.11 TT + 0.49 NSS-0.47 HL + 0.27 SF Fabric B = −21.3 + 1.1 WC-1.1 IS + 0.68 SS-1.5 RS + 1.5 HS-2.0 TT-1.1 NSS + 5.6 HL Fabric C = 2.2 -0.14 WC-0.61 IS + 0.48 HS + 0.28 TT-0.01 NCC + 1.1 NSS + 0.44 HL-0.67 SF Fabric D = −1.8-0.18 WC + 0.48 IS + 0.05 SS-0.34 RS-0.03 TT + 0.1 NSS + 0.30 HL + 0.52 SF Fabric E = 3.5 + 0.06 WC-0.23 IS + 0.05 RS + 0.17 HS-0.10 TT + 0.19 NCC-0.21 NSS + 0.29 SF Fabric F = 3.6 + 0.21 WC-0.23 IS-0.11 SS + 0.09 HS-0.06 TT-0.23 NSS-0.19 HL + 0.30 SF Fabric G = −8.2 + 0.25 IS + 0.94 SS + 0.67 RS-0.23 HS + 1.6 NCC-0.29 NSS + 0.57 HL + 0.42 SF Fabric H = 13.8-0.32 WC-0.91 IS-1.5 SS + 0.57 RS + 0.48 NCC-0.31 NSS-0.02 HL-0.14 SF Fabric I = −2.2 + 0.48 WC + 0.08 IS-0.29 SS + 0.71 HS + 0.70 TT-0.45 NSS + 0.14 HL-0.69 SF
In order to take the subjective evaluation as the quality check of all the functional fabrics, additional analyses were required. Statistical analyses that can establish the correlation between the mean values of each attribute for samples were carried out. The ability of experts to assess fabrics clearly depends on the particular bipolar adjectives being assessed. The average value can give a complete idea whether BSE and VSE test can give the same kind of result or not. From this, a conclusion can be drawn on the ability of the expert to subjective evaluation and the reliability of the data. To prove the correlation between mean overall hand values obtained by average blind subjective evaluation (AV-BSE) and average visual subjective evaluation (AV-VSE) were analyzed using a Pearson correlation analysis and the results are depicted in Figure 3.
Correlation between averaged valued of blind subjective evaluation and visual subjective evaluation test.
Based on the correlation analysis, 0.88 correlations coefficient existed between average values of the tests at 95% confidence level with a coefficient of determination 0.77. The coefficient of determination is a statistical measure which can tell us about how well the regression line close to the actual data points. All data points are inside the ellipse which indicates that the values are close to the regression line. This again gives an idea that panel members have a similar understanding of comfort sensations based on bipolar attributes both BSE and VSE kinds of tests.
A parametric test with two-sample (average value of BSE and VSE test) comparison of variances was conducted and the result shown in Figure 4. From the figure, F observed has a value of 1.11, F critical value of 3.72, and a two-tailed p-value of 0.88. As the computed p-value greater than the significance level (95%) alpha is equal to 0.05; it is possible to conclude that the ratio between the variance is equal to 1. The risk to reject this hypothesis (null hypothesis) while it is true is 87.44%.
Two-sample comparison of variances for average values of blind subjective evaluation and visual subjective evaluation tests.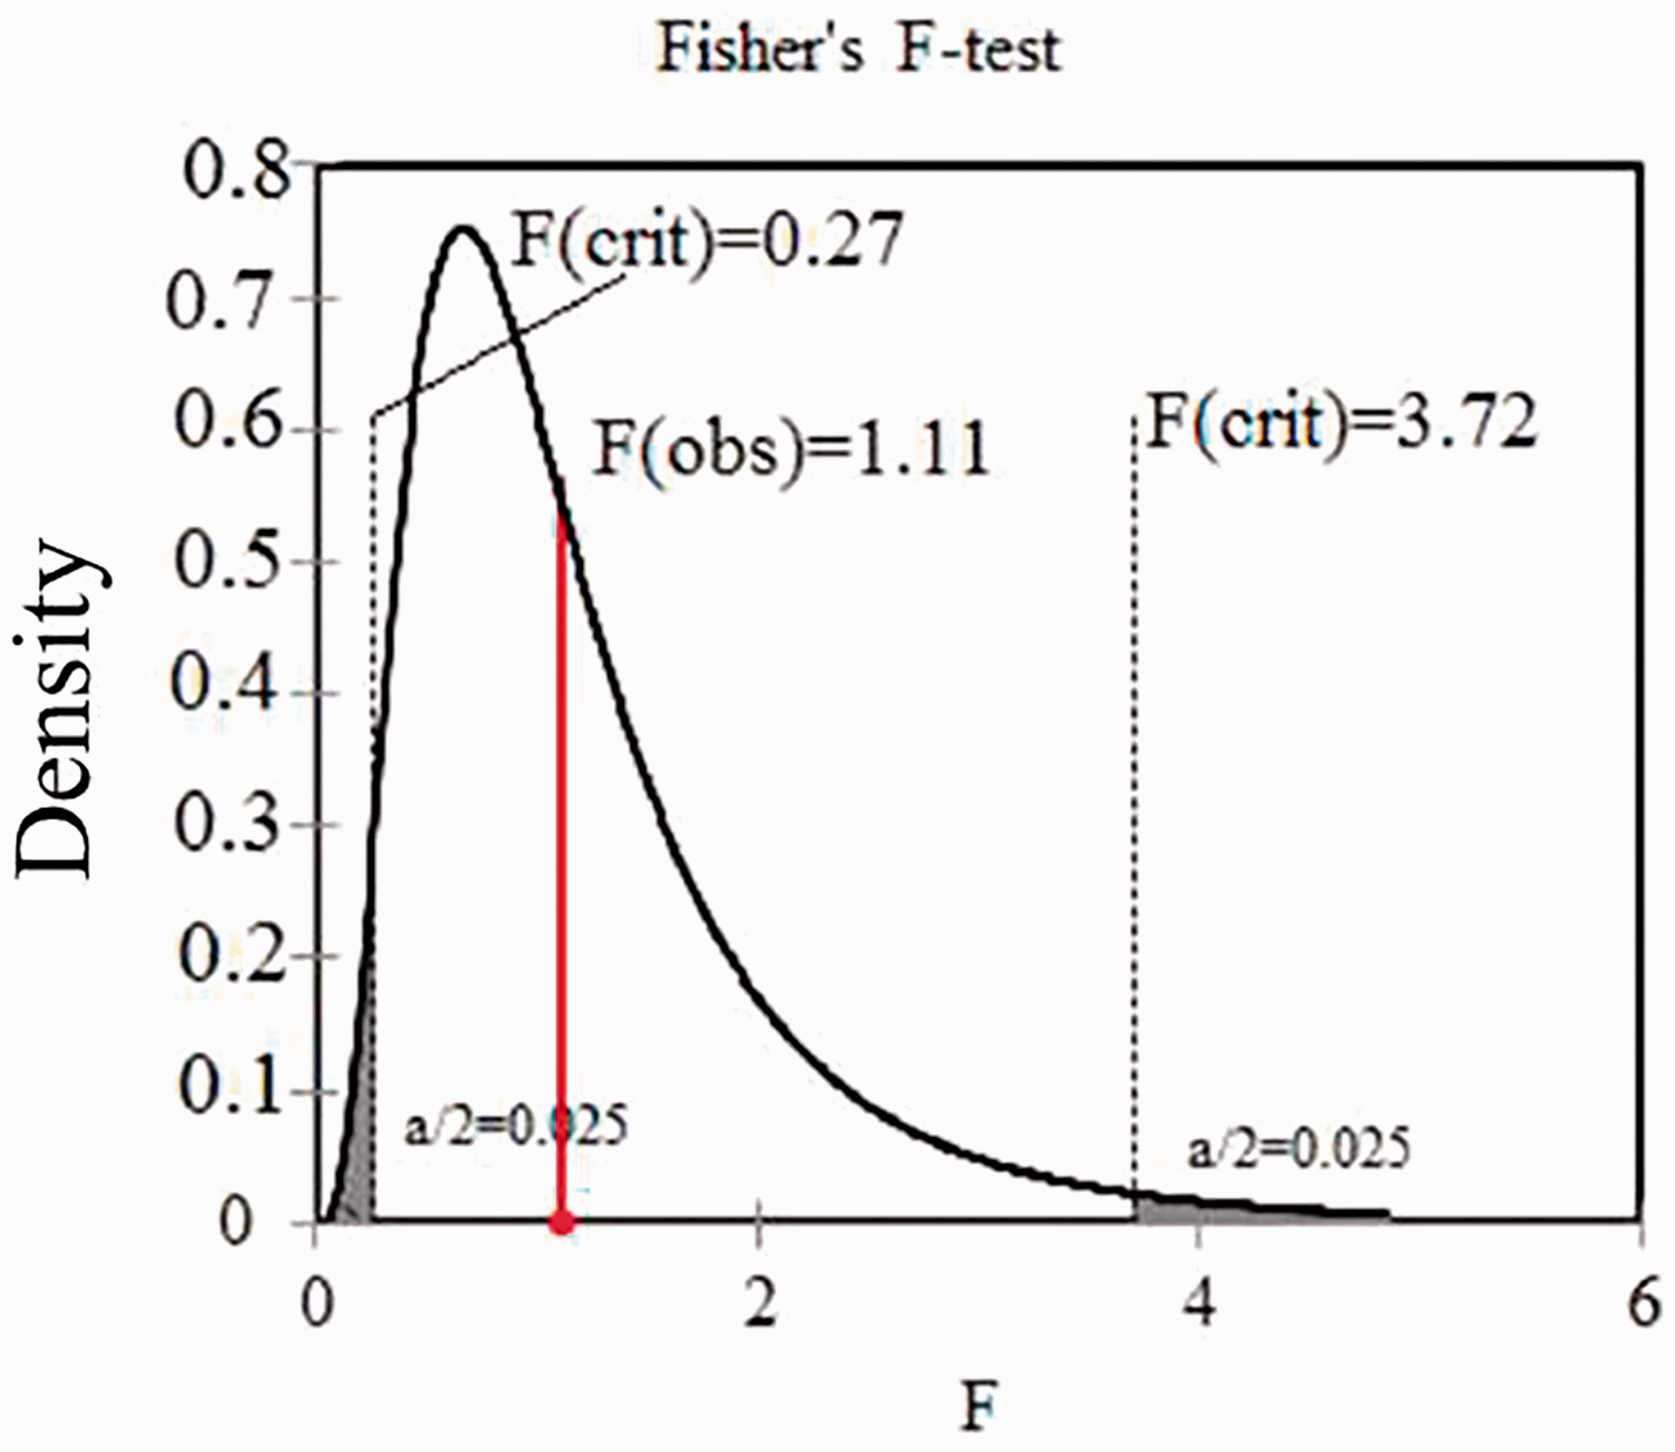
As can be seen in the results of Fisher’s test, statistically, there is no significant difference between the two means; the BSE data are similar to that of VSE. Therefore, the two populations follow the same distribution. This is not a guarantee that they have no individual difference in perception of the hands of the fabric as discussed above. Only the ratio between the variance of BSE test and VSE test is equal to 1.
In order to identify the potential directions for the improvements for these functional textile fabrics, penalty analysis (Figures 5 and 6) was executed. The result in this section describes only for one sample (sample 5) as representation due to a big number of data. The just-about-right (JAR) levels of other products can be found in the online supplementary file. The THVs obtained by the experts were used as the preference data (liking scores) that correspond to a total comfort (global satisfaction index) for each product with 1–5 grading scale. HV with grading scales from 0 to 10 was converted into a JAR intensity scale. The JAR rating defines acceptance of the product in a specific category. The JAR scale comprises words that can be interpreted as shades of liking with both ends fastened by opposite sensory attributes and the middle category anchored as “just-about-right” denoting the most acceptable region for sensory perception which is the reference point for the two opposite bipolar attributes.
A frequency of panelist on just-about-right category using blind subjective evaluation test. A frequency of panelist on just-about-right level using visual subjective evaluation test.

To fit the data on JAR categories, the grading scales were converted into below medium value, medium value, and above medium value without losing the fundamental information. This conversion was done because the JAR data works on a three-category scale only. Value with zero and 10 are converted into 1 and 9, respectively, as the scales in the penalty analysis were fixed between 1 and 9. Since the JAR levels are three; whether these values are converted or not, it does not have any effect on the results. Therefore, according to this definition of JAR scale, for example, for WC bipolar attribute below medium stands for a warm feeling and above medium stands for a cold feeling and the JAR shows neither warm nor cold.
The results of subjective evaluation based on the blind test are illustrated using bar diagrams in Figure 5. The result depicts that all panelists perceive the majority of the two categories. For the WC attribute, 10% of the panelist said the fabric is warm, 50% of them said it is cold, and 40% of the panelists feel the fabric is neither warm nor cold. Likewise, for NCC and NSS attributes, all of the panelists said 100% of the sample is noncompressible and nonstretchable, respectively which demonstrates the best agreement level observed for NCC and NSS attribute. However, for HL, the agreement level for experts indicates relatively low (30%, 20%, and 50%). Therefore, from this result, it is possible to conclude that the HL, IS, and WC bipolar attributes were relatively difficult to identify during the blind test.
For VSE, in comparison to BSE, the results are unlike except in NCC and NSS. For instance, in SS attribute, no one said the fabric is slippery and similarly; in RS attribute, no one said the fabric is rough. This may be due to the appearance of the coated-PEDOT-PSS polymer affects the rough-smooth and sticky-slippery sensation when seen. Otherwise, a similar sensorial perception observed with BSE and VSE techniques. In general, the results led to an important conclusion concerning the agreement level of the experts on the subjective evaluation of the functional textile fabrics. The expert panel can be taken as a trustworthy on the subjective evaluation. A nearly similar observation occurred for other samples in the JAR level. The results are shown in online Supplementary Figures S1 and S2.
Finally, product characterization performed to draw the sensory profile data of all samples. A comprehensive profile presentation of all attributes of functional fabric products demonstrated which could be very important for new product development process. Based on the perception and experiences of the experts, the data are presented in Figures 7 and 8. This data can be used for the evaluation and control of similar products of functional fabrics for smart fabric application that followed the same production technique.
Sensory profile data for the blind subjective evaluation test. Sensory profile data for the visual subjective evaluation test.
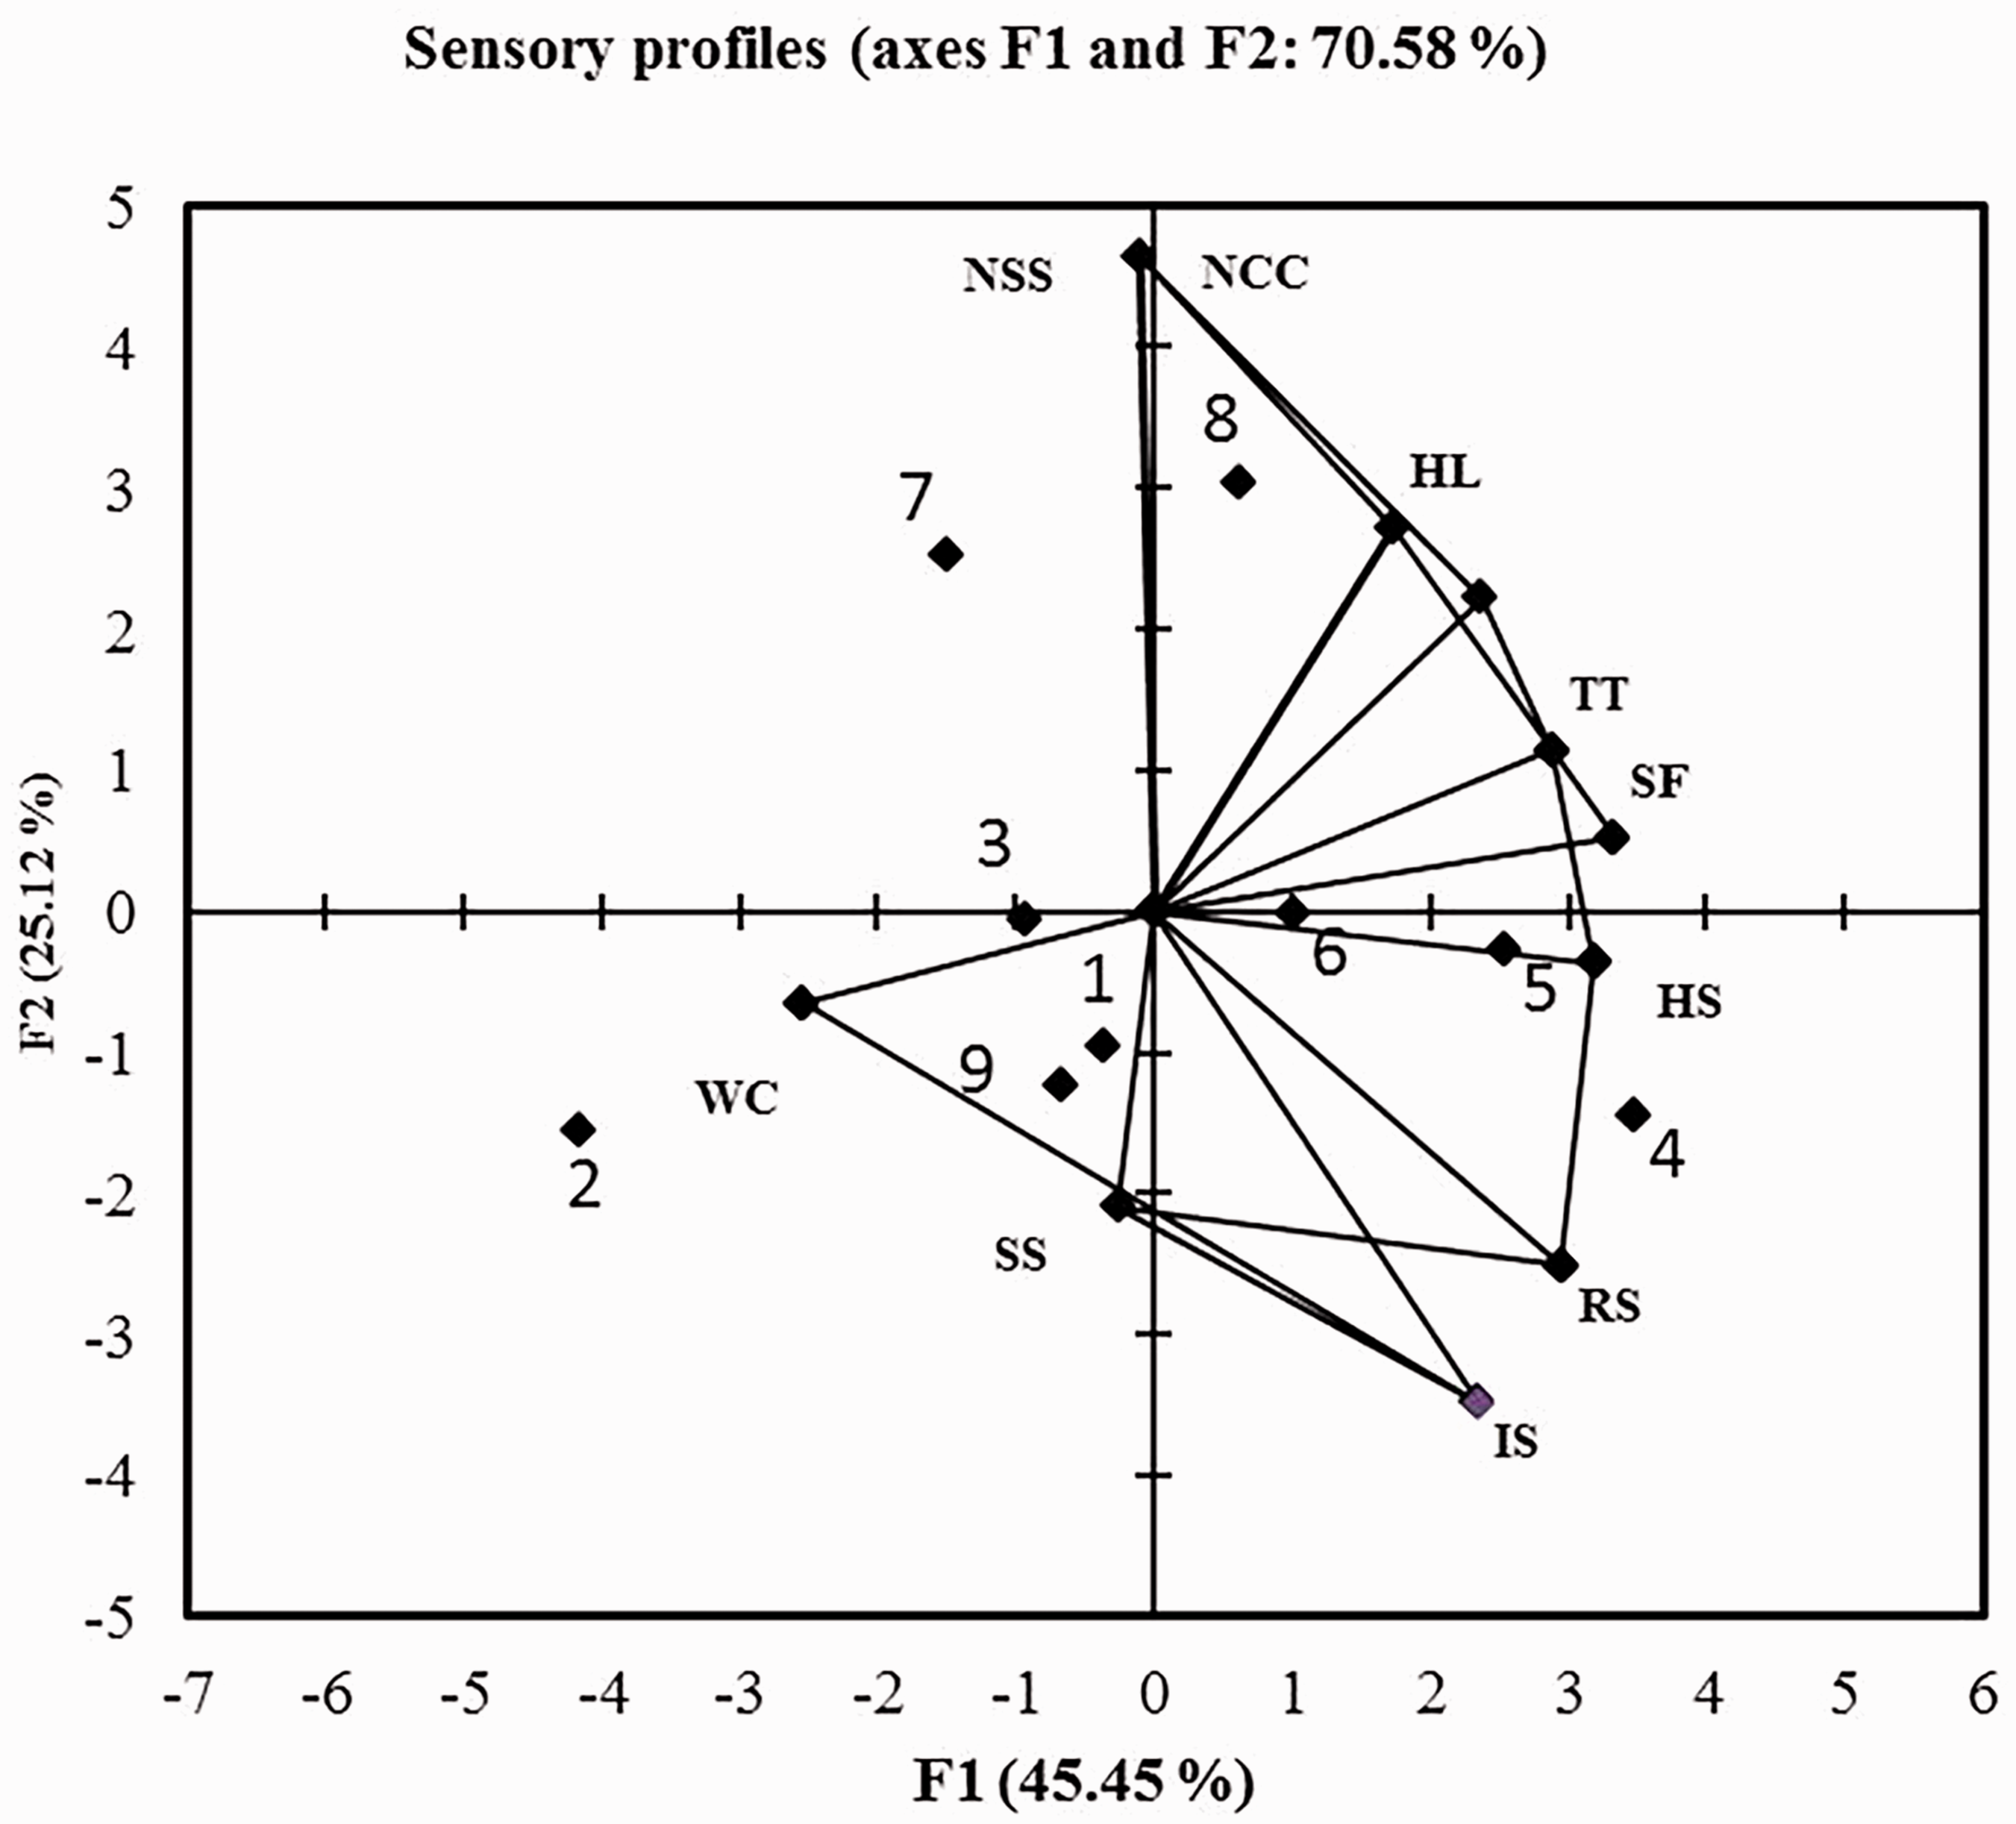
From Figure 7 illustrations, for instance, for sample 5, for the thick-thin, the stiff-flexible, and the heavy-light attributes are associated with coefficients that have a significant positive value while nonstretchable–stretchable associates to a coefficient that has a significant negative value. The positive coefficient correlates to the second bipolar attributes and the negative coefficient correlates to the first bipolar attributes. Therefore, the PEDOT-PSS-conductive-coated fabric found to be thin, flexible, light, and nonstretchable.
Likewise, in the case of VSE (Figure 8), sample 5 found to be flexible, thin, light, and nonstretchable fabric since it has a positive coefficient on SF, TT, and HL, plus a negative coefficient on NSS. The sensory profile data shows consistency between BSE and VSE observations except for sample 3. All products are on the same side of the bi-plot drawn using product characterization at 95% confidence level. The possible differences for sample 3 may be due to the fact that the sample was produced using 3D printing with a very soft, NinjaFlex, filament and the difference is anticipated during the visual test. The other reason may be due to the pattern created during the 3D-printing process since it creates an influence when seen [35]. All other samples can be interpreted as such.
These sensory profile data may help functional and smart textile manufacturers and developers in decision making when developing, finishing, manufacturing, and design of these fabrics. However, the geographical location should take into consideration that as the study was conducted within the specific geographical area.
A sensory profile characteristic of industrial product quality mainly depends on the product design and development process; the profile data can be obtained by using a trained panel of experts. Hedonic, THV, evaluation was not taken into account when sensory profile data determined. Therefore, by integrating the hedonic evaluation and sensory profile data of the given product, it is possible to develop and design new products that could satisfy the demands of the consumers in terms of tactile for various smart fabric applications.
Conclusions
The aim of this study is to find an easy strategy for the subjective evaluation of some functional textile fabrics that will be used for the production of smart fabrics and to provide the sensory profile data for the smart textile developers and manufacturers so that they can produce comfortable smart fabrics. Tactile perceptions were performed by a trained panel of experts using blind and visual subjective evaluation scenarios. The Pearson correlation coefficient between panelists was up to 96% and hence a strong agreement between the panelist’s judgment. The statistical analyses methods proved that the level of agreement of each expert on the attributes was high enough for the subjective evaluation and a strong national preference achieved between experts on hand values of functional textile fabrics.
Comparative analysis of blind and visual subjective method was made and particularly, the VSE gave a better result in terms of expert consistency when compared to that of BSE. In the study, it was found that noncompressible/compressible, nonstretchable/stretchable, stiff/flexible, and hard/soft attributes are the most easily identifiable bipolar attributes while heavy/light and thick/thin are the most difficult one.
This study talks about the first step toward the handle perceptions of the functional textile product and consumer perceptions. Like other textile products where sensory analysis already used, the handle sensory analysis technique approached by means of BSE and VSE could be a complementary method for the judgment, prediction, and control of functional fabrics’ quality, as an easily accessible strategy for the functional clothing industry.
Footnotes
Acknowledgements
The authors would like to thank TMT groups of Boras University, Sweden, for their help in producing and collecting the samples and students and professors in the Gheorghe Asachi Technical University of IASI, for their participation in subjective evaluation.
Declaration of conflicting interests
The author (s) declared no financial conflicts of interest for the research, authorship, and /or publication of this article.
Funding
The author(s) disclosed receipt of the following financial support for the research, authorship, and/or publication of this article: This work was financially supported by Erasmus Mundus Joint Doctorate Programme SMDTex-Sustainable Management and Design for Textile (Grant Number n°2015-1594/001-001-EMJD).