
Abstract
The processing and mechanical properties of two-dimensional woven carbon fibre-reinforced composites depend directly on the internal geometrical architecture, which presents typical multiscale nature, while the multiscale structures possess inevitable geometric variabilities during the manufacturing process. This work presents a stochastic multiscale geometric modelling framework containing two developed algorithms to facilitate reconstructing statistically equivalent structures on microscale and mesoscale of two-dimensional woven carbon fibre-reinforced composite considering internal geometric variability. The sequential random perturbation algorithm is proposed to realize the random distribution nature of fibres inside yarns on microscale by sequential smart movements of initial regular distributed fibres. Then, an algorithm based on Gaussian random sequence is developed to characterize the internal variabilities of yarn path and shape on mesoscale via reconstructing correlated stochastic deviations along yarns. The proposed modelling framework effectively reconstructs the geometric models of random microstructure and mesostructure, which is convenient to be implemented into computational micromechanical analysis on both scales, serving as the foundation of the numerical calculation of the multiscale processing and mechanical properties of the studied composite.
Keywords
Introduction
Carbon fibre-reinforced polymer (CFRP) composites have gained increasingly more employment in several industrial fields for their high specific strength and high specific stiffness [1]. In order to investigate the properties of CFRP, despite for traditional analytical approaches [2,3] and experiments, the numerical methods such as finite element (FE) simulation [4,5] with consideration of manufacturing process parameters and multiscale structures have been more and more studied. A prerequisite for virtual numerical computing schemes is the generation of appropriate virtual geometric models. In general, CFRP composites inherently exhibit a certain degree of spatial randomness across scales [6,7] due to process of manufacturing including weaving, wetting and moulding. Even following the ideal weaving operation, the weaving process may still lead to some degree of deformation due to softness of fabrics and exogenic forces. During the wetting procedure, the flowing matrix such as epoxy resin may influence the architecture a little for different permeability along flowing path and corresponding acting force, as well as the heat transfer. Finally, the moulding process will alter the relatively regular structures due to the forced displacement of moulds. As is widely recognized, the properties of composites are directly decided by the microstructures [8–10]. In order to improve the accuracy of multiscale FE modelling of CFRP, the primary task is to establish geometric structures of representative domains as closer to realistic geometric characteristics as possible.
Two-dimensional (2D) woven CFRP typically possesses multiscale structures, namely, microscale (fibre level), mesoscale (yarn level) and macroscale (laminate level) [11]. On microscale, the fibres within a yarn are generally parallel to each other along yarn axis; then, the yarn could be analogous to unidirectional composite [12], which presents transversely isotropic property. Trias et al. [13] have compared the periodic and random models of unidirectional CFRP, and then concluded that periodic models are suitable to calculate effective properties, but random models must be considered when accounting for damage and failure. Several approaches have been proposed to generate representative unit cell (RUC) geometric model with fibres’ random distribution. The direct image-based method [14,15], which extracts fibre distribution from scanned or optical images of cross sections, is obviously time consuming and only feasible to specific volume fraction once. Traditional hard-core model could hardly achieve a volume fraction higher than 50% due to jamming limit [16]. Based on the hard-core model, complex heuristic random movement regulations could increase the limit volume fraction [17,18]. Melro et al. [17] initiated the fibres’ distribution by hard-core model, then heuristic small random displacements directed by nearest fibres were applied to stir the fibres, which creates matrix rich regions to place new fibres. Yang et al. [18] proposed the hard-core model-based random sequential expansion (RSE) algorithm, which broke the jamming limit by controlling inter-fibre distances. Designing complex stirring rules based on initial periodic fibre array is another effective way to generate stochastically distributed fibres [19,20]. Wongsto and Li [19] started from an initial hexagonal periodic fibre array, and then shifted fibres with random displacements. However, statistical analysis is still needed to ensure the effect of this shaking process. Wang et al. [20] used global crisscrossing moving and local disturbing operations based on initial periodic configuration to generate random distributions. Moreover, Vaughan and McCarthy [21] proposed the nearest neighbour algorithm (NNA) combining experimental data and numerical methods, which adopted an adjusted measurement of experimentally observed first and second nearest neighbour distribution functions to define inter-fibre distances. Further, heuristic steps were avoided in this algorithm, but the reconstructed results were dependent on given experimental data. In order to capture the random fibres’ distribution inside yarns or unidirectional composites to facilitate further FE modelling, effective and efficient algorithms should be developed.
As to the mesoscale structure, during the manufacturing of textile-reinforced polymer composites, the spatial geometric parameters of yarns possess inevitable fluctuations due to deformation of textile and compression of mould. Take plain woven CFRP as an example, weft yarn goes over one warp and under the next, creating a grid-like pattern, the path and cross-sectional shape of yarn present spatial variability. Moreover, the internal geometric variability has influence on the properties of composites, such as elastic properties [7,22], the permeability [23,24] and the damage properties [25]. Three-dimensional (3D) images acquired by X-ray micro focus computed tomography (micro-CT) have been adopted to statistically analyse the internal geometry variability of composites [26], which is an efficient way to obtain the realistic geometric parameters. Furthermore, to construct the geometry structure of mesoscale representative volume element (RVE), one way is to build analytical geometric model usually combined with the parameters measured from images [7,27,28], or numerical method such as FE simulation could be used to predict the deformation process of textile geometry [29], while another way is to reconstruct statistically equivalent spatial geometric parameters based on the statistical information analysed from images, for example using Monte Carlo Markov Chain algorithm [30,31]. Developing statistical algorithms to characterize the spatial variability of yarns considering not only the mean trends but also the correlation information is essential to perform more accurate numerical simulations to gain the properties of composites.
This study develops a hierarchical geometric modelling framework including two algorithms corresponding to microscale and mesoscale structures, respectively. The objectives are to present a stochastic framework to (1) demonstrate the variability in geometry of 2D woven composites across scales using microscope and micro-CT, (2) derive the geometric characteristics and spatially statistical descriptions and (3) establish statistically equivalent geometric models of 2D woven CFRP closer to physical reality, then apply this framework to a plain woven CFRP sample.
Hierarchical stochastic modelling framework
In order to capture the inherent geometric variability on microscale and mesoscale, a hierarchical stochastic geometric modelling framework for 2D woven CFRP is developed as stated in Figure 1, which follows the detailed steps below:
Reconstruction of RUC geometric model of yarn on microscale as shown in Figure 1(a), with several assumptions here: the shape of fibre cross section is assumed to be a standard circular shape; the fibres inside a RUC are assumed to be straight without curliness as most fibres inside the unidirectional composites are, while the real path curve effect of yarn could be considered by defining a series of local coordinate systems when conducting further analysis of yarns; misalignment of fibres is not concerned in this research.
Cut the sample vertically near yarn peak position within which tangent lines of fibres are perpendicular to section the most, then polish the cross sections to prepare for the microscopic observation. Acquire high magnification microscopic images of yarn cross sections. Convert the yarn cross-sectional images into binary images, fibre volume fraction of yarn is calculated through averaging the proportions of fibre pixels within selected windows. Fit the fibre section using circular shape, based on which the mean fibre diameter is calculated. Generation of fibre random distribution using proposed sequential random perturbation (SRP) algorithm. Extrude the generated 2D sketch of randomly distributed fibres in fibre direction. Reconstruction of RVE geometric model on mesoscale as illustrated in Figure 1(b), with assumption: the shape of yarn cross section is assumed to be elliptical shape.
Preparation of samples consisting of several unit cells. Acquisition of 3D volume images of the studied composite specimen by X-ray micro-CT. Segment the 3D images to extract a series of equally spaced cross sections. Fit the extracted cross sections of each yarn using ellipse shapes. Statistical characterization of yarn path and shape parameters within each unit cell. Reconstruction of stochastic deviations of geometric parameters using the proposed correlated Gaussian random sequence (CGRS) algorithm. 3D geometric modelling in Computer Aided Design (CAD) software combining the mean values and generated deviations of defined geometric parameters.
Stochastic multiscale geometric modelling framework. (a) Microscale. (b) Mesoscale.

Multiscale structure scanning tests
The material sample in this work is plain woven CFRP composite consisting of epoxy resin from Huntsman and TC33 carbon fibre provided by Tairyfil. The laminated plate manufactured by vacuum infusion process (VIP) was placed in a pre-heated mould at 80℃ for 5 h and was then naturally cooled to room temperature. The nominal unit cell dimension of the studied composite is 4 × 4 mm.
On microscale, as the fibres inside yarns are nearly parallel to each other along yarn path, the distribution feature of fibres as shown in Figure 2(a) is obtained through images of yarn cross sections near peak positions, which are acquired using high magnification microscope. From the view of yarn cross section, fibres inside yarns are found to be randomly distributed without obvious clusters. The shape of the fibre section could be fitted by circle, which is also adopted as the assumption in the proposed microstructural generation method.
Multiscale structure images of plain woven CFRP. (a) Microscopic image of yarn cross section. (b) 3D X-ray micro-CT volume image and corresponding section image.
On mesoscale, a 3D X-ray micro-CT volume image of a material sample as well as an extracted cross section are illustrated in Figure 2(b). The 3D image is obtained by scanning the sample in micro-CT equipment Bruker SkyScan 1272 with high resolution of voxel size 7.8 µm. The quality of raw image has been improved by noise reduction and contrast enhancement. As can be intuitively observed, path of yarn is briefly the sinusoid curve like pattern, while the flat shape of yarn cross section is close to ellipse or lentoid. Moreover, yarn paths and cross-sectional shapes don’t seem to be totally regular but possess some degree of spatial variability, which is directly related to the manufacturing process.
Images of multiscale structures act as the basis of geometric parameter analysis and instruction to structural reconstruction procedure. The following two sections emphasize on the statistical analysis and construction algorithms on microscale and mesoscale, respectively.
Generation of random unit cell model on microscale
Reconstruction algorithm
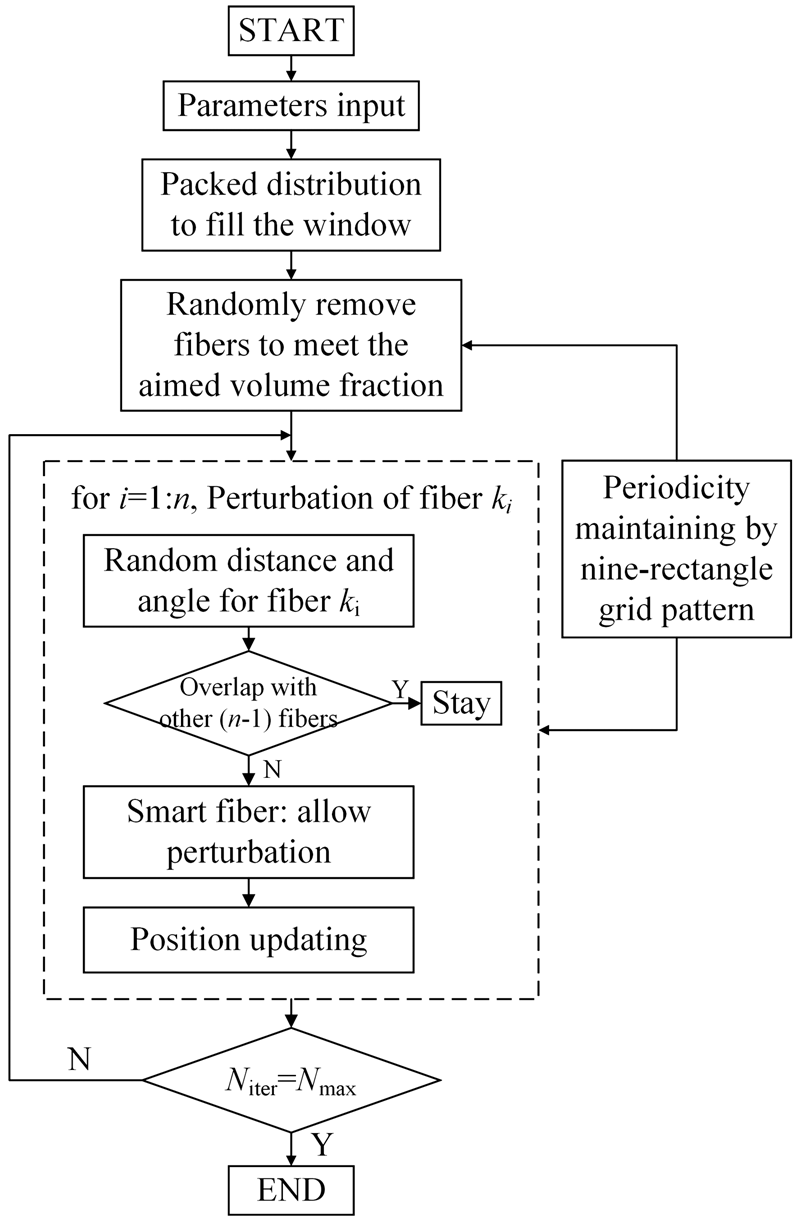
The key point of reconstructing RUC is to realize fibres’ random distribution in cross section of yarn. With the assumption of circular fibre cross section, the first stage of reconstructing progress is to generate randomly distributed circles in a given window such as square area, target volume fraction must be reached while no intersections between circles are allowed and periodic characteristic should also be guaranteed. An SRP algorithm is developed to generate the section of RUC with arbitrary fibre volume fraction which equals to the circle area fraction in the square window. The flowchart of SRP algorithm is shown in Figure 3 and procedures are described as below:
Set the initial parameters of the algorithm: window size s, radius of fibre r, target volume fraction Vf, minimum distance between fibre boundaries lmin, maximum cycle number N. Initialization of fibres. Circles with radius r are arrayed following a regular pattern that fibres are tangent to each other, which forms a very high area fraction and serves as the initial configuration. Achievement of target area fraction. Remove several fibres randomly from initial state, the number of removed fibres is decided by target volume fraction which could be calculated as:
Random perturbations of all fibres. In each cycle, all fibres are tending to move to nearby domain in a sequential manner. One circle is assigned with small values of random distance l and angle θ. Spatial relationships between this circle and other circles are calculated, which serve as judging criteria of allowing perturbation or not. If overlapping occurs, which is computed by comparing the value of diameter (2 r) plus lmin with centre-to-centre distances, the fibre is forced to stay in position. Otherwise, this fibre is a ‘smart’ one being allowed to perturbate in the random way. Geometric periodicity maintaining mechanism. A nine-rectangle grid pattern is adopted to maintain the periodic geometry of the target window in the centre. Eight windows of the same size with the central one are distributed around to form a regular nine-rectangle grid. Each circle in the central window is duplicated to the other eight windows. The corresponding circles of the nine windows have consistent relative positions in window and follow exactly the same pattern of movement. The circles and parts of circles lying in the target central window are retained. Termination of perturbation. Once all fibres have been perturbated sequentially in one cycle, the next cycle is proceeded following the same sequential manner. The overall procedure will be terminated when the maximum cycle N has been reached. The number of N is related to the ratio of window size s to fibre radius r, as well as the required fibre volume fraction. Generally speaking, to achieve the global random distribution of all circles in the window, the higher the ratio and volume fraction, the larger the N.
Flowchart of SRP algorithm.
in which n denotes the number of retained fibres. Meanwhile, random distributed circle poor areas are created for circles to move in next steps.

In general, following the steps of SRP algorithm described above, all fibres will tend to move to the initial fibre poor domains progressively via random perturbations in a sequential way, eventually a global random distribution state is formed. Examples of the generated random fibre distributions of different fibre volume fractions with lmin = 0.2 µm are exhibited in Figure 4, which intuitively proves the ability of the proposed algorithm to reconstruct random microstructures under wide range of volume fractions on microscale.
Examples of generated random fibre distributions of different fibre volume fractions. (a) 55%. (b) 60%. (c) 65%. (d) 70%.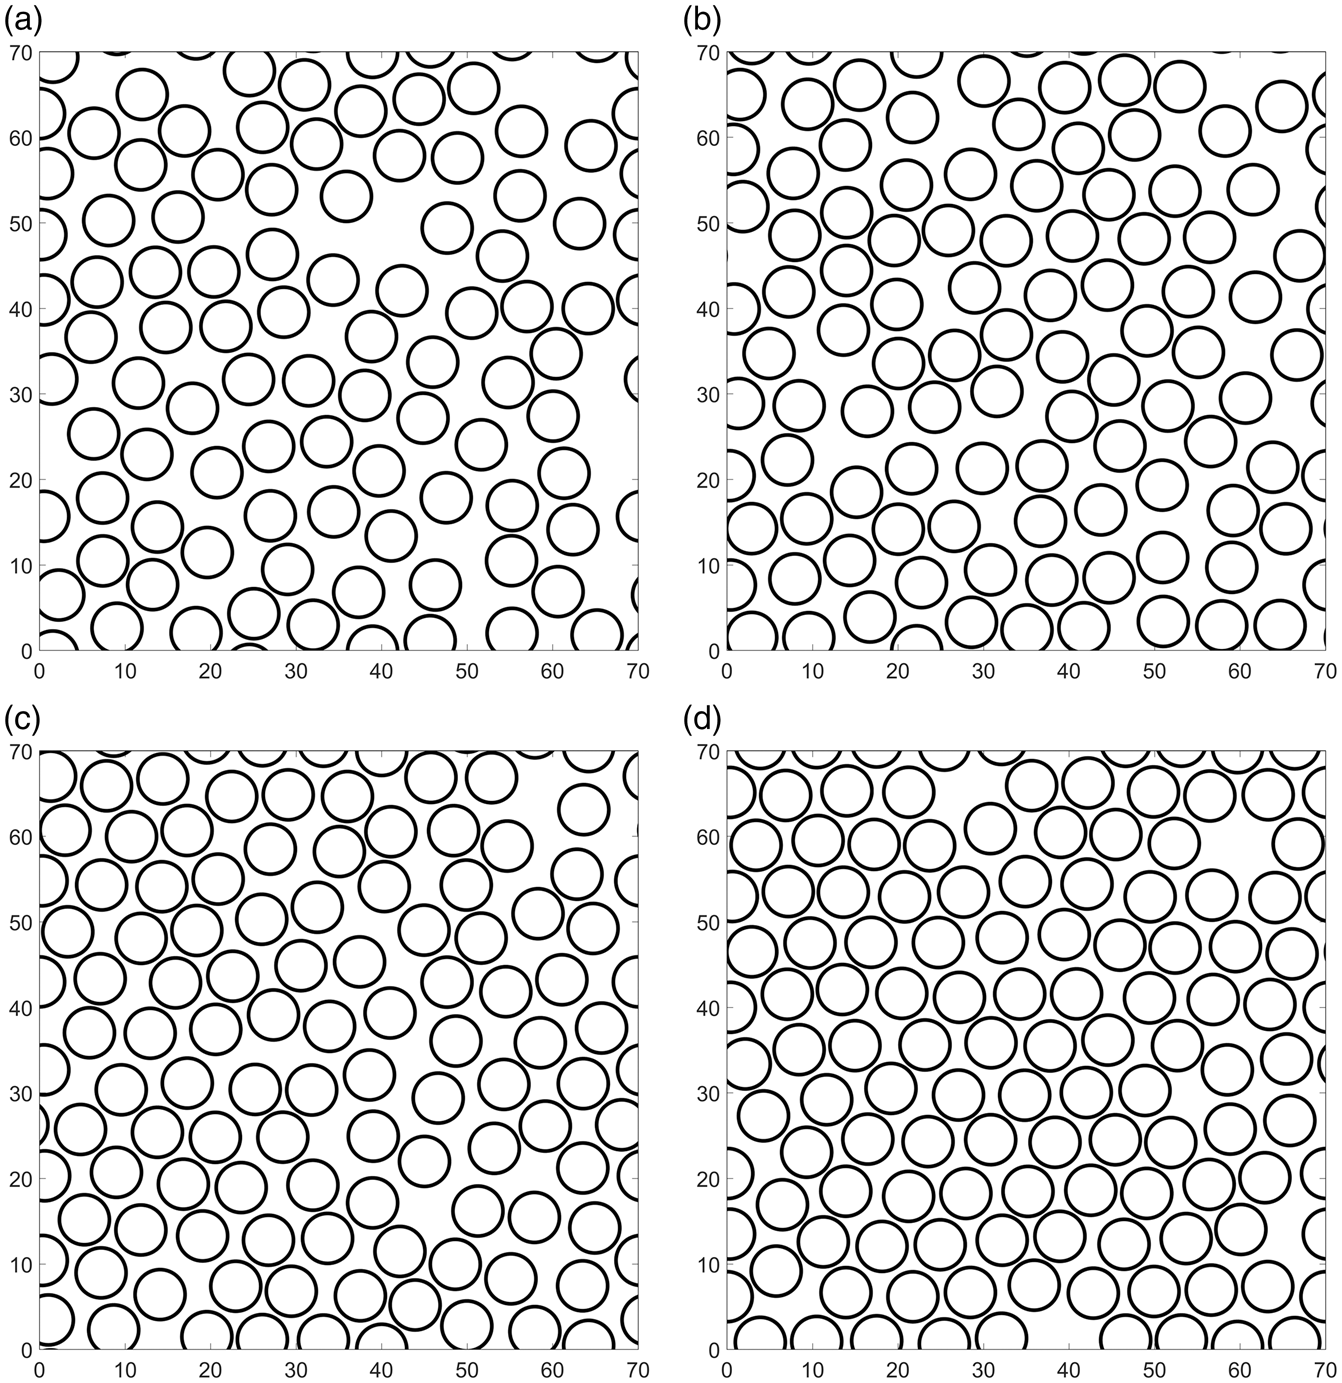
Statistical function characterisation
In order to further quantitatively verify randomness of fibres’ spatial distribution generated by the proposed algorithm, four statistical functions, namely, nearest neighbour distance function, nearest neighbour orientation function, Ripley’s K function and pair distribution function are adopted to demonstrate the statistical characteristics. Following the input parameters: Vf = 60%, r = 3.3 µm, s = 50 × r, lmin = 0.2 µm, 20 microstructures were generated to calculate the mean values of these functions. The overall curves of statistical functions are illustrated in Figure 5.
Statistical functions of generated structures. (a) Nearest neighbour distance distribution function. (b) Nearest neighbour orientation function. (c) Ripley’s K function. (d) Pair distribution function.
The nearest neighbour distance distribution function describes the probability density function (PDF) of the centre distance between one fibre and its nearest one, which reveals short-range interactions such as the degree of fibre aggregation among fibres. The PDF plot of nearest neighbour distances is shown in Figure 5(a). The curve exhibits a monotonic increase sharply from near the distance of 2.15r and then reaches a peak point at about the distance of 2.2r, which means the nearest neighbours occur most at the position of 2.2r. Following the peak value is a steep slope, the value decreases close to zero from the distance of about 2.5r. The PDF curve shows that the nearest fibres are mainly distributed in a distance range from 2.15r to 2.5r, which is related to fibre volume fraction and clustering. Generally speaking, the higher the volume fraction, the narrower the range, and the high peak value of the PDF curve relates to a high degree of fibre clustering.
The nearest neighbour orientation function is described by the cumulative distribution function (CDF) of nearest fibre orientation, which is calculated in terms of the rotation angle from horizontal axis to the line connecting the given fibre and its nearest neighbour in a clockwise direction. For the completely spatial random (CSR) pattern, in which all orientations have the same probability of lying the nearest fibre, so the CDF will be a straight line. According to the comparison of CDF curves of SRP algorithm and CSR pattern as shown in Figure 5(b), the SRP plot is nearly straight and only small gaps from CSR straight line exist, which means high degree of randomness of the nearest neighbour orientations obtained by the proposed algorithm.
The Ripley’s K function is defined as the ratio between the number of additional points lying within a radial distance h from an arbitrary point and the number of points in unit domain. Considering edge correction, Ripley’s K function K(h) is calculated as


As illustrated in Figure 5(c), curves of Ripley’s K function for the microstructures generated by the proposed SRP algorithm and CSR pattern are compared. The SRP curve locates a little below the CSR curve and exhibits a degree of stage type shape at short range. Generally speaking, the proposed SRP curve is very close to the CSR curve, which indicates the microstructures generated by proposed SRP algorithm present sufficiently random distributions.
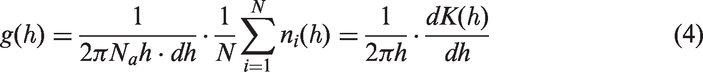
The pair distribution function is defined as the probability of finding an extra point within an area of ring from inner radius h to outer radius h+dh and calculated as
Stochastic geometric modelling on mesoscale
Statistical analysis of mesostructure
The spatial domain occupied by a complete RVE range was first identified by image segmentation. Then, the 3D micro-CT volume image of the target RVE scope is equally spaced divided and the slice images are labelled manually. The yarns could be grouped into different genera according to the nominal periodicity of woven architecture within characteristic range called reference period, each genus has identical geometry pattern. The characteristics of yarns are acquired by fitting ellipses to the yarn cross sections, and geometrical data are recorded using ImageJ. The image fitting yields the coordinates of centroid (x, y, z), yarn area (A), aspect ratio (AR) and yarn orientation θ of cross section along the entire yarn path, as shown in Figure 2(b).
As to the studied plain woven CFRP, a target RVE domain is divided into 20 equally spaced parts, namely 21 slices are analysed in both directions. Considering the geometric symmetry of the studied plain woven composites on mesoscale, we assume that the geometric variability follows the same pattern in warp and weft directions, namely one genus is defined. Similar statistical method as described in Bale et al. and Vanaerschot et al. [26,32] was adopted. Define the warp direction as y axis, the yarn dataset is presented by The systematic trends of the warp yarn geometrical feature parameters with one reference period. Global mean values and standard deviations of each parameter. AR: aspect ratio.


Once the systematic values were calculated, the deviations of defined parameters from the systematic mean trend were computed. The CDFs and normal probability plots of these deviations are presented in Figure 7. The CDF curves exhibit approximately S shape. While if the normal probability plot reveals closer to a straight line, then the distribution of parameters is closer to Gaussian distribution.
(a) Cumulative distribution functions and (b) normal probability plot of the normalized deviations for five parameters of warp yarn.
Moreover, due to the spatial continuity of yarn, the deviations of a geometrical parameter at nearby locations along yarn path possess inevitable correlation. The autocorrelation characteristics of deviations are summarized by the Pearson’s correlation parameter in function of separation of two slices along a yarn, which are determined by the whole data of the warp yarn genus. The autocorrelation graphs of feature parameters are shown in Figure 8.
Autocorrelation graph of the geometrical parameters for warp yarn.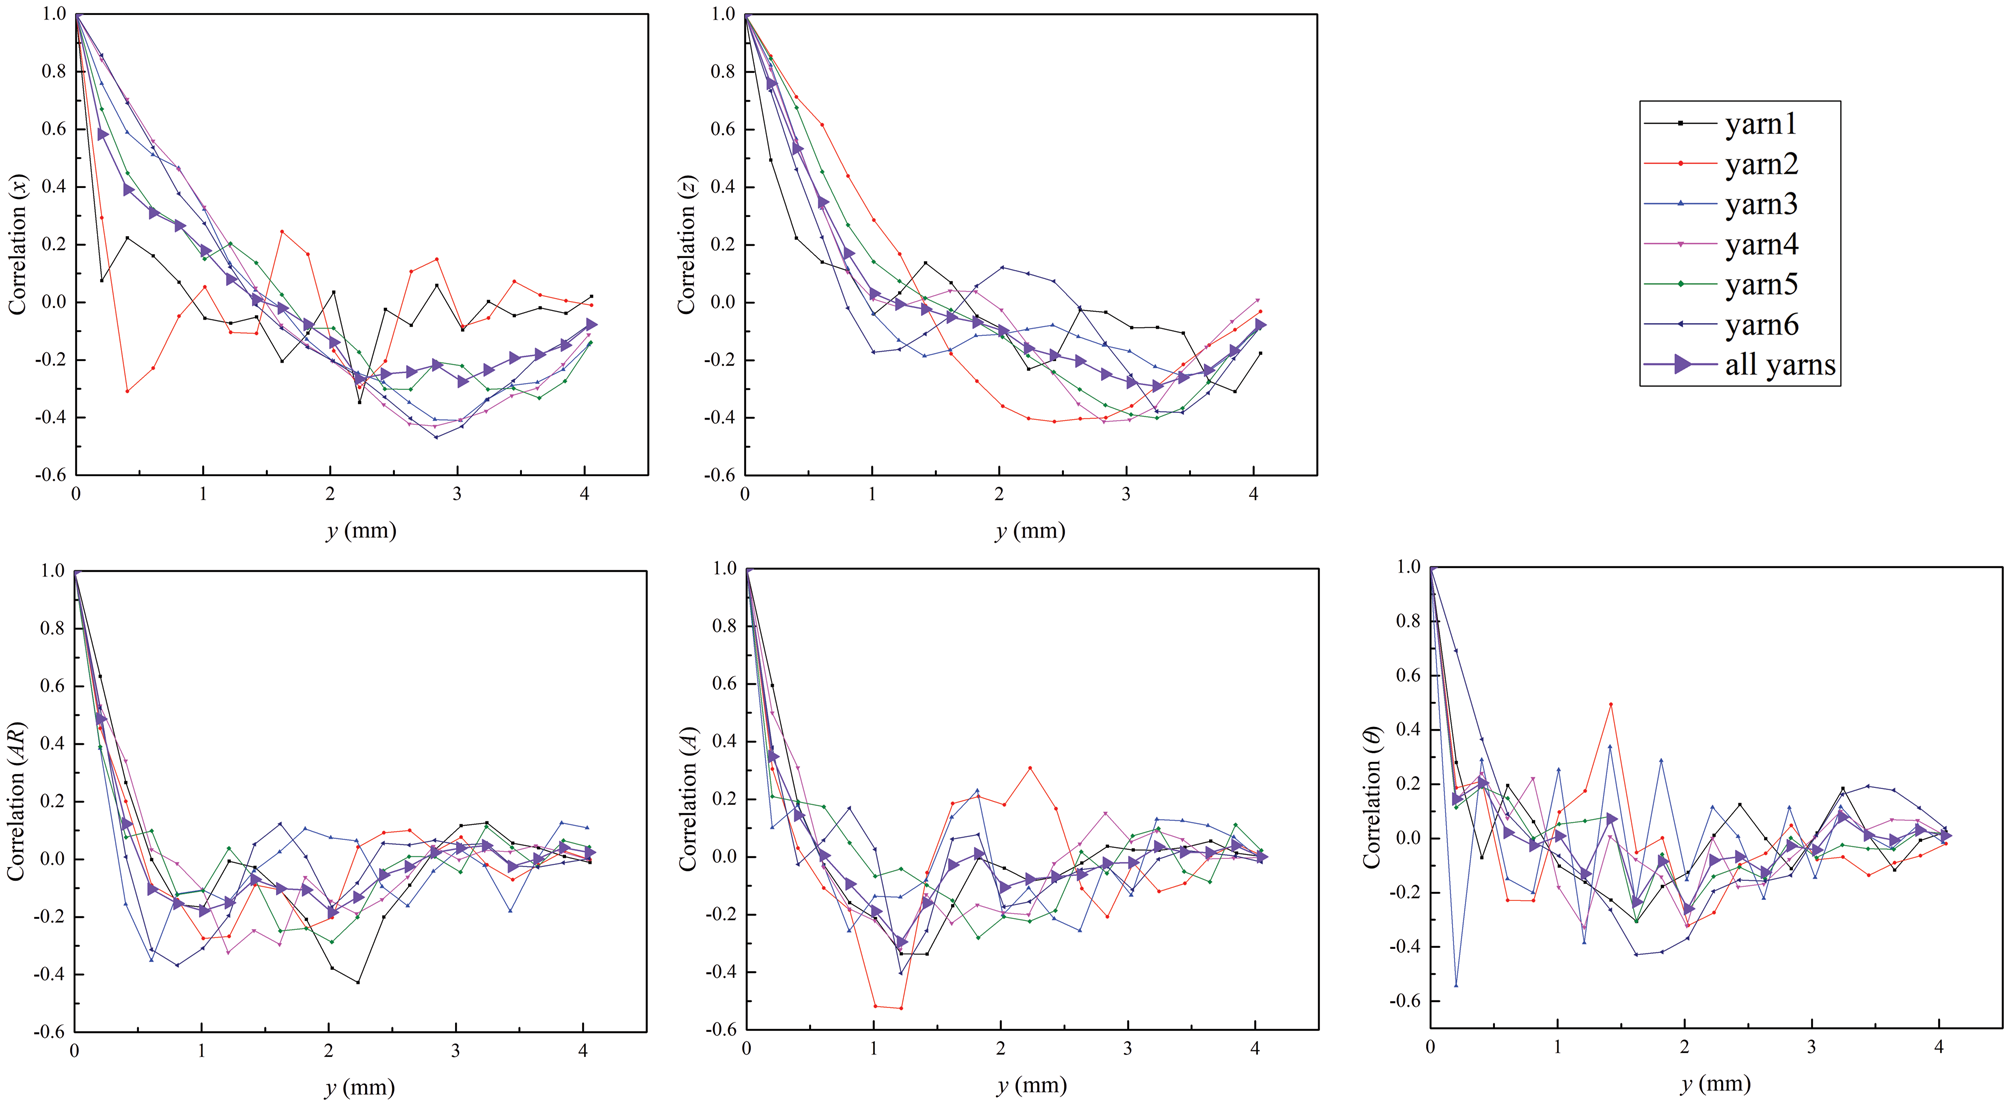
Statistical reconstruction
The aim of reconstruction is to generate virtual random plain woven RVE with the same statistics for the defined geometrical parameters as measured in the sample. On the basis of systematic values, the key point is to reconstruct the random deviation at each location along yarn path, meanwhile the correlations between different point locations should be maintained.
According to the CDF and normal probability plots shown in Figure 7, the distributions of deviations of feature geometrical parameters are assumed to be normal, based on which CGRS algorithm is developed. The core idea is to transform generation of deviation values along grids on the yarn path to reconstructing a Gaussian random sequence with equivalent statistical moments and correlation information. The reconstruction procedures are described as below:
Assume that deviation values at N locations are needed to be decided, namely, the yarn is N–1 equally sliced. For each parameter, take 
with 
in which RX(m) is the covariance function of 
where the standard autocorrelation function in the form of exponential function is determined by fitting the autocorrelation graphs as shown in Figure 8.
In order to reproduce the correlated normal random vector 
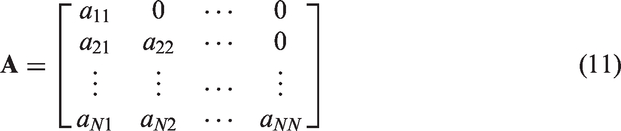
According to matrix theory, symmetric positive definite matrix 
Each component of 
Following the proposed procedures described above, the CGRS algorithm is coded in Matlab, then the statistically equivalent correlated deviations of each parameter are reconstructed randomly. Along with the systematic values of these geometric parameters, the complete geometric information is obtained, which is further used to build the geometric model of mesoscale RVE of 2D woven composite.
A set of reconstructed feature parameters.

Results and discussion
Following the steps in ‘Generation of random unit cell model on microscale’ section, the overall moving trend of all fibres is diffusing towards fibre poor areas in a smart way to randomly fill in all spaces. The proposed algorithm is of great effectiveness which could generate cross sections with randomly distributed fibres of any required area fraction, meanwhile, the jamming limit problem in hard-core-based methods and any complex heuristic rules are avoided. Once 2D cross section with randomly distributed circles is generated, the 3D RUC geometric model is then constructed by extruding 2D sketch in fibre direction. If the interface of ring shape between matrix and fibre is needed to consider, it’s also convenient to operate by increasing the minimum distance lmin from initial value by the thickness of ring to reserve the interface space. An example of the generated 2D and 3D geometric RUC models is illustrated in Figure 9(a). Once the geometric RUC model on microscale is reconstructed, it could be used to computational micromechanical analysis such as FE simulation to gain the properties of yarn in 2D woven composites. The predicted properties will serve as inputs in mesoscale model, in which the shape of yarn is accommodated by defining a series of local coordinate systems according to corresponding yarn path. It should be pointed out that the proposed algorithm will also be applicable to other shapes of fibre cross-sectional fittings, such as ellipse as Gommer et al. [33] observed, with the intersecting judging criterion changed according to specific shapes. This is out of scope of this research, but could be considered in future work.
Illustrations of reconstructed geometric models. (a) RUC on microscale. (b) RVE on mesoscale.
Following the proposed procedure in ‘Stochastic geometric modelling on mesoscale’ section, the statistically equivalent correlated deviations of each parameter are reconstructed. Along with the systematic values, the complete geometrical information could be obtained, which is further taken as initial input geometrical feature parameters to build the geometric mesoscale RVE model in CAD software such as Siemens Unigraphics NX (UG) and Dassault Computer Aided Three-dimensional Interactive Application (CATIA) by interpolation methods. Through periodic processing and interpolation, as well as creating the geometry of the polymer matrix by intersecting a hexahedron with the yarns, the final whole RVE geometric model could be established. The proposed method takes not only the mean trend of yarn geometry in composites but also the correlation information about the parameters along yarn path into consideration. An example of the reconstructed 3D geometric RVE model using the dataset listed in Table 2 is exhibited in Figure 9(b). However, this paper demonstrates ability of the proposed algorithm to generate statistically equivalent mesostructures using example of plain woven CFRP with the assumption that yarns in warp and weft direction follow the same pattern. This assumption could be valid for plain woven CFRP for its totally symmetry characteristic, while for other types of 2D fabrics such as twill and satin, this assumption is not true as illustrated by Rinaldi et al. [34] and Vanaerschot et al. [31]. Number of types of genus should be decided by specific woven architecture. However, the proposed reconstruction algorithm is still suitable for each genus by combining the systematic trends and reconstructed deviations that are equivalent to the experimental data.
The proposed framework has effectively analysed the geometric variability and reconstructed statistically equivalent structures on each scale of plain woven CFRP. The framework is also suitable for other types of 2D woven textile composites, in which the fibre distribution inside yarns follows the same pattern on microscale. There only exist differences of topological architectures and yarn paths’ shape on mesoscale, correspondingly several genera could be defined. The reconstructed RUC and RVE geometric models could be directly used in multiscale FE modelling to predict the multiscale properties of composite, in which yarn properties predicted by microscopic RUC FE modelling serve as an input of the mesoscopic RVE FE modelling to eventually predict the properties of composite, which will be studied in future work.
Conclusions
Following the proposed hierarchical stochastic modelling framework, the multiscale structural features of plain woven CFRP sample were first obtained from microscopic images and 3D X-ray micro-CT volume image. The geometrical variability of the object plain woven carbon fibre–epoxy textile laminate was found to be significant, which mainly manifests in the randomness of fibre distribution inside yarns on microscale and spatial variability of yarn path as well as yarn shape parameters. Based on microscopic images of yarn sections, size and distribution characteristics of fibres inside yarn were extracted. The proposed SRP algorithm successfully realized the random distributions of fibres while maintaining the periodicity of RUC geometry model on microscale, which was verified by the statistical functions as well. On mesoscale, the systematic values, deviations and correlations of geometric yarn parameters were statistically analysed using micro-CT data. The developed CGRS algorithm captured the randomness together with correlation of the deviations of spatial geometrical parameters along yarn path. Then statistically equivalent RVE geometry model with stochastic spatial yarn structures on mesoscale was established.
With two individual algorithms corresponding to microscale and mesoscale efficiently and effectively reconstructing the feature geometry structures on each scale, the proposed stochastic multiscale geometric modelling framework could serve as the basis of further multiscale FE simulation of 2D woven CFRP, in which the reconstructed geometric models closer to physical reality could make virtual tests more reliable.
Footnotes
Acknowledgement
The authors acknowledge the support from the Adjunct Professor position provided by the Shanghai Jiao Tong University to Wei Chen.
Declaration of Conflicting Interests
The author(s) declared no potential conflicts of interest with respect to the research, authorship, and/or publication of this article.
Funding
The author(s) disclosed receipt of the following financial support for the research, authorship and/or publication of this article: The research leading to the above results was supported by National Natural Science Foundation of China (Grant No. 11372181, No. 11772191), National Science Foundation for Young Scientists of China (Grant No. 51705312) and National Postdoctoral Foundation of China (Grant No. 17Z102060055).