
Abstract
In this study, the Taguchi method, analysis of variance, and principal component analysis were used to design the optimal parameters with respect to different quality characteristics for the continuous electrospinning of polyacrylonitrile nanofibrous yarn. The experiment was designed using a Taguchi L9(34) orthogonal array. The Taguchi method is a unique statistical method for efficiently evaluating optimal parameters and the effects of different factors on quality characteristics. The experimental results obtained by this method are more accurate and reliable than one-factor-at-a-time experiments. The control factors discussed in this work include the draw ratio, nozzle size, flow rate, and draw temperature. The quality characteristics taken into consideration are fiber diameter, fiber uniformity, and fiber arrangement. The parameters to optimize the different quality characteristics were obtained from the main effect plot of the signal-to-noise ratios, after which analysis of variance and confidence intervals were applied to confirm that the results were acceptable. Multiple quality characteristics were analyzed by principal component analysis from the normalized signal-to-noise ratios and the principal component score. Combining the experimental and analysis results, the optimum parameters for multiple quality characteristics were found to be a draw ratio of 2.0, a nozzle number of 22 G, a flow rate of 7 ml/h, and a draw temperature 120℃.
Introduction
Electrospinning (ES) technology is a promising manufacturing technique to extract continuous fibers from a polymer solution or melt under a strong electrostatic field. By adjusting the type of polymer solution and by varying the manufacturing parameters, fibers can be produced with diameters ranging from several tens of nanometers to several micrometers [1–4]. Fibers manufactured using this method possess several attractive features such as small diameter, high specific surface area, flexibility in surface functionalities, and high porosity. Such nanofibers can be used as filter materials, biomedical elements, tissue scaffolds, biosensors, photoelectric components, and materials in reinforced composites [4–17].
For certain applications, it is both interesting and important to electrospin alternative structures instead of the non-woven mats that are commonly formed in an ES process. Several techniques have been developed to control the deposition of the electrospun nanofibers and to obtain a continuous yarn using different methods, namely, by manipulating the electric field, by changing the static collection geometry, and by varying the collection mode. However, individualizing and assembling these nanofibers and spinning them into a yarn are still under investigation by researchers working in the areas of nanofabrication and engineering. The processes of converting the fiber into a yarn or the yarn into a fabric are difficult and complex. Therefore, the first goal to be achieved is to develop a process and the equipment for continuous production at a stable state.
Some novel approaches have been reported to control the ES process that move away from collecting disordered nanofibers toward collecting ordered yarns. In a recent paper, Fennessey and Farris [18] reported a process where they linked and twisted unidirectional tows of electrospun nanofibers into yarns using an electric twister. This allowed testing of the effects of twist on the tensile strength and other properties of the yarn. Yan et al. used a pair of concave collectors to collect nanofibers. Nanofibrous yarn has been formed by the rotation of the collector and a middle take-up unit [19]. Smit et al. and Teo et al. used a coagulation bath as a collector. When the nanofibrous web was pulled from the coagulation bath, the nanofibrous yarn was formed at same time [20,21]. Li et al. used a novel method to produce a nanofibrous yarn that included a funnel-shaped collector and a vacuum pump [22]. Dabirian et al. placed two nozzles to apply positive and negative voltages; once the fibers were drawn through the nozzle, these were gathered in air, after which they were twisted and collected by the rotating collector [23,24]. In recent years, several studies have adopted a similar approach for the preparation of nanofibrous yarns [25,26].
The Taguchi design of experiments method has been found to be an effective approach to statistically optimize the critical parameters used in ES, so as to effectively tailor the resulting electrospun fiber diameters and morphology [27–32]. This method is a useful engineering approach to determine the optimal levels of processing parameters with the minimal sensitivity to different causes of variations. Thus, it can reduce the number of tests to a practical level, significantly saving the experimental time and associates costs as opposed to the traditional full-factorial counterpart. To determine the significant factors, and optimum combination of factors, an analysis of variance (ANOVA) was utilized in order to offer a measure of confidence by determining and analyzing the data variance [31,32].
Nanofibrous yarns have many potential applications in micro-electronics, photonics, and biomaterials [33–35]. This kind of yarn possesses the special properties of nanofibers and higher strength than nanofibrous membranes, advantages that increase the possibility to develop functional and novel materials. This work systematically studied the process of ES of nanofibrous yarn by thoroughly analyzing the effects of different factors and finding optimal parameters using the Taguchi method, ANOVA, and principal component analysis (PCA). The results obtained using these statistical methods are valuable for evaluating the real contribution of a particular factor on quality characteristics. The obtained results showed that such a process can be developed to further study the production of continuous nanofibrous yarns.
Experiment
Materials
A 10 wt% polyacrylonitrile (PAN) spinning solution for ES was prepared by dissolving PAN (92% AN, 6% MMA, 2% itaconic, Tong Hwa Synthetic Fiber Co., Ltd.) in dimethylformamide at 80℃ and stirring until the solution became homogeneous.
SEM observation
A scanning electron microscope (JSM – 6390LV, JEOL) was used to observe and determine the nanofiber diameter and fiber arranged angle. The number of pixels over the scale bar in the SEM image was calibrated by the given length of the scale bar in the corresponding image. Subsequently, the fiber length perpendicular to the fiber axis was measured manually for each fiber. The total number of fiber measurements was 15 in each SEM image and associated average nanofiber diameters along with their standard deviations were calculated accordingly.
Tensile strength measurement
A tensile tester (ORIENTEC) was used to measure the tensile strength of the nanofibrous yarn under ASTM D2256 standard with a gauge of 250 mm and test speed of 300 mm/min.
ES setup
Typical needle-type ES and a modified rotation collector were designed to enable the continuous production of nanofibrous yarn. A high-voltage electrostatic potential difference is applied between the needle and the collector, and a cone-type collector applies a twist function to the nanofibrous yarn. The collector is grounded and can be set at different angular velocities using a motor drive system, which is coordinated with a take-up device to produce a continuous nanofibrous yarn. In this study, we applied twist on the nanofibrous yarn, which significantly improved its mechanical properties. As shown in Figures 1 and 2, the environmental conditions were set at 26 ± 2℃ and 40 ± 5% relative humidity (RH), and the distance between the two spinnerets was 25 cm. The distance between the collector and the take-up unit was set about 100 cm, and the rotation speed of the collector was set to about 150 rpm. The take-up velocity was set at 100 cm/min. When a voltage of 20 kV is applied, the polymer solution contained in the syringe is released through the needle, forming ES jets. The resulting yarn is collected on the collector. Because of the repulsion between the positive electrodes of the two needles and the attraction between the needles and the collector, the nanofibers can be collected directly on the collector. In addition, because of the rotation of the collector, the nanofibers are distributed evenly on the collector to form a membrane. Next, a nanofibrous yarn can be obtained if a suitable drawing force is applied to pull out the nanofibrous membrane from the collector. By adjusting the parameters to reach a suitable take-up velocity, a dynamic equilibrium can be achieved to enable the continuous production of nanofibrous yarn through this process.
Schematic of the continuous electrospinning of nanofibrous yarns. Experimental process to obtain continuous electrospun nanofibrous yarns.

Experimental factors and levels to identify the parameters for the continuous electrospinning of nanofibrous yarn.

Design of experiment
Taguchi method
The Taguchi method combines the concepts of engineering and statistics. Its goal is to improve production quality and save on the cost of production to reach the most efficient and stable production level. It has been widely used in scientific research and in engineering [36,37]. The Taguchi method was done by using the following steps for experimental process optimization:
Process parameters are chosen. The number of levels on each process parameter is decided. Orthogonal arrays are determined based on the number of parameters and parameter levels. Selected samples from orthogonal arrays are produced and the property is measured. Performance statistics are taken. The best option of the levels from the parameters is calculated. The best sample is produced and the calculation is verified by measuring the property of the produced sample. If the property values are in the calculated tolerance, then the optimization process is finished. If not, then the combined effects of two or more parameters are analyzed.
A logic scheme of the design of experiments for continuous electrospun nanofibrous yarns was shown in Figure 3. The experiment is designed using a Taguchi L9(34) orthogonal array, where the degree of influence of each factor can be found from the signal-to-noise (S/N) ratio [37,38]. To achieve the “lower is better” characteristics, the S/N ratio is given by
Logic scheme shows the design of experiments for continuous electrospun nanofibrous yarns. ANOVA: analysis of variance; CI: confidence interval; PCA: principal component analysis; RH: relative humidity.

The quality characteristics considered in this study were fiber diameter, fiber uniformity, and fiber arrangement. The standard deviation of fiber diameter was particularly investigated to study the effect of inputs on variation in fiber diameter. The Taguchi model was validated by predicting diameter of four new combinations of experimental variables (not included in the original experimental design), and by comparing the predicted results of these combinations with the experimental results.
ANOVA was used to analyze which process parameters are statistically significant. This was accomplished by separating the total variability of the S/N ratios, which was measured by the sum of the squared deviations from the total mean of the S/N ratio, into contributions by each of the process parameters and the error. First, the total sum of the squared deviations SST from the total mean of the S/N ratio, η can be calculated as

Total variance of each factor (SSi) can be calculated as


The relative percentage contributions of ES factors were determined using equations (1)∼(7).
Principal components analysis
In many cases, the Taguchi method is only used to evaluate a single quality characteristic. If multiple quality characteristics are considered, different statistical and analysis methods will be combined to obtain a more accurate and in-depth analysis [38,39]. In 1901, the method of principal components analysis (PCA), which uses dimensionality reduction techniques, was proposed by Karl Pearson [40]. The aim of PCA is to reduce the dimensions of a large data set while retaining the contribution of the individual characteristics to the variance in the data set. According to the covariance matrix, the eigenvector and eigenvalue can be obtained for streamlining complex data and analyzing the factors.
Results and discussion
Taguchi method – Analysis of the S/N ratios and ANOVA
In ES, the average fiber diameter is generally an important indicator. In most experiments, finer nanofibers can exhibit a very specific nature. In this study, to successfully carry out the process of forming a yarn, a higher flow rate was set to increase the diameter of the nanofibers. To reduce the impact of this factor, the average diameter of quantified values for nanofibers was used in the analysis. During the SEM observation (as shown in Figure 4), the samples were equally divided into nine parts under 1500 × magnification and the diameters of 15 nanofibers were measured in each of these parts. In this experiment, the goal was to obtain values for the fiber diameter under the criterion of the smaller-the-better (STB), and the arithmetic mean of the nanofiber diameter values was set as the quality characteristic. Using the Taguchi L9(34) orthogonal array, the experimental results and S/N ratios for each quality characteristic are listed in Table 2 and the response table and the results of ANOVA are shown in Tables 3–5, which will be discussed as below.
SEM observation on the (a) morphology of nanofibrous yarn and (b) morphology of nanofibers, which were fabricated by the parameter sets (I: Exp1-A1B1C1D1; II: Exp2-A1B2C2D2; III: Exp3-A1B3C3D3; IV: Exp4-A2B1C2D3; V: Exp5-A2B2C3D1; VI: Exp6-A2B3C1D2; VII: Exp7-A3B1C3D2; VIII: Exp8-A3B2C1D3; IX: Exp9-A3B3C2D1.). Experimental results and S/N ratios for each quality characteristic. S/N: signal-to-noise; CV: coefficient of variation. S/N ratio response table and results of ANOVA for the S/N ratio for nanofiber diameter. S/N: signal-to-noise; ANOVA: analysis of variance; DOF: degree of freedom; SS: sum of squares; MS: mean square.

Analysis of the optimum parameters for nanofibrous diameter control
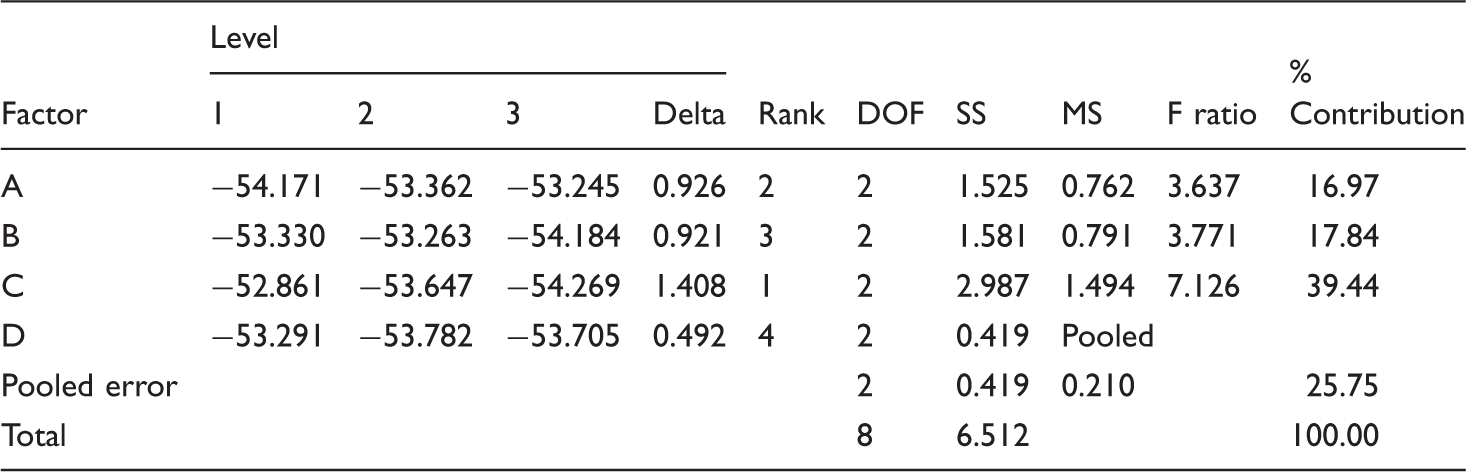
Table 3 and Figure 5 show, respectively, the S/N ratio response table and the response graph for the quality characteristics. The optimum combination of parameters corresponding to the individual quality characteristics were obtained from the response graph, as shown in Figure 5. The optimum combination of the set of parameters for fiber diameter was A3B2C1D1, which means that the experimental conditions should be set to have a draw ratio of 2.0, a nozzle number of 22 G, a flow rate of 3 ml/h, and a draw temperature of 80℃. The degree of influence of the factors on the fiber diameter increased in the order: flow rate > draw ratio > nozzle number > draw temperature.
Main effects plot for the S/N ratio of the nanofiber diameter: (A) draw ratio, (B) nozzle number, (C) flow rate, and (D) elongation temperature. S/N: signal-to-noise.
To confirm the specific influence of the different factors on the quality characteristics, ANOVA was applied to the data in the response table. The effect of draw temperature was pooled into the error because of the low degree of influence in order to clearly identify the effects of the other factors. The results showed that the contributions of the individual factors to the fiber diameter were 16.97% for the draw ratio, 17.84% for the nozzle number, and 39.44% for the flow rate.
Analysis of the optimum parameter for coefficient of variation (CV) of fiber diameter.
The fiber diameter is a basic quality characteristic that needs to be considered during a parametric study of nanofiber production. The difference between a broad fiber diameter distribution and a centralized fiber diameter distribution can be clearly distinguished from their morphologies. The same average fiber diameter may result from different diameter distributions. To distinguish between such cases, the CV of the fiber diameter was set as the evenness characteristic of the fiber diameter, where a larger value implies a lower uniformity of diameter. The CV was obtained from 135 nanofibers with three sets and the results are shown in Table 2.
S/N ratio response table and results of the ANOVA for the S/N ratio for CV of fiber diameter.
S/N: signal-to-noise; ANOVA: analysis of variance; CV: coefficient of variation; DOF: degree of freedom; SS: sum of squares; MS: mean square.

Main effects plot for the S/N ratio of CV for fiber diameter: (A) draw ratio, (B) nozzle number, (C) flow rate, and (D) draw temperature. S/N: signal-to-noise; CV: coefficient of variation.
S/N ratio response table and results of the ANOVA for the S/N ratio for standard deviation of the angle of fiber arrangement.

ANOVA: analysis of variance; S/N: signal-to-noise; DOF: degree of freedom; SS: sum of squares; MS: mean square.
Optimum parameters for the standard deviation of the fiber arrangement angle.
As the number of the fibers arranged along the yarn axis direction increased, more fibers shared the effect of the applied force, causing the mechanical properties of the yarn to increase. In this study, the standard deviation of the fibers arranged at an angle with respect to the yarn axis direction, called the fiber arrangement angle, was set as a quality characteristic indicator. A lower standard deviation implies better orientation, which means that in this case, the criterion of the STB holds good for the quality characteristic. The standard deviation in the angle of fiber arrangement was obtained by testing the angle of orientation of 135 nanofibers in three sets. A comparison of the experimental and S/N ratios is given in Table 2.
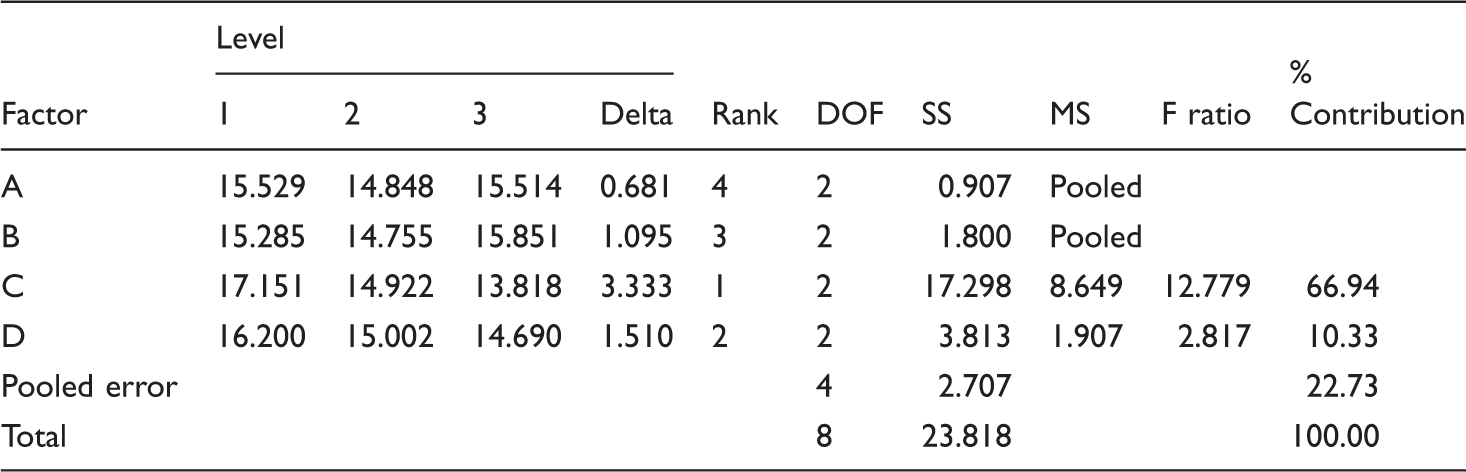
Table 5 and Figure 7 show, respectively, the response table and response graph for the quality characteristics. Clearly, the largest impacting factor on orientation is the draw ratio, followed by the draw temperature. The optimum parameter set was A3B1C3D2, which was the same as for experiment 7 in the orthogonal array. The parameters are a draw ratio of 2.0, a nozzle number of 20 G, a flow rate of 7 ml/h, and a draw temperature of 100℃. As Table 5 shows, once the low-impact factors were pooled together to lie within error limits, the contributions of the other factors were 55.14% for the draw ratio, 3.73% for the flow rate, and 8.64% for the draw temperature.
Main effects plot for S/N ratio for standard deviation of the fiber arrangement angle: (A) draw ratio, (B) nozzle number, (C) flow rate, and (D) draw temperature. S/N: signal-to-noise.
Taguchi method – Confirmation test
Confidence intervals (CI) are a method to confirm the confidence of the optimum parameter; it is also used to verify the credibility and reproducibility of data, as defined in Equation 1 [11]. If the obtained data range is within the CIs, it means that the results of the parameter optimization analysis are reasonable and also that the results are credible and reproducible. Experiments need to be re-planned if data do not lie within the CIs.


In our study, the optimum parameter set was A3B2C1D1 for fiber diameters under the STB quality characteristic. The verification experiment was carried out with respect to this parameter to verify whether the data were within the 95% CI. According to the Taguchi Method – Confirmation Test, reasonable data should range within the interval 320–516 nm. The obtained average fiber diameter was 470 nm, indicating that this result is reproducible; the value for the fiber diameter is also in accordance with the observation of the morphology by SEM shown in Figure 8.
Morphology of the nanofibrous yarn obtained using parameters A3B2C1D1: (a) morphology of nanofibrous yarn and (b) morphology of nanofibers.
The optimum parameter set for the CV of fiber diameter under the STB quality characteristic was A1B3C1D1. According to the Taguchi Method – 95% Confirmation Test, reasonable data should be in the range 0.130–0.192. The obtained average value was 0.137, indicating that this result was reasonable; the corresponding SEM images of the morphology are shown in Figure 9.
Morphology of the nanofibrous yarn obtained using parameters A1B3C1D1: (a) morphology of the nanofibrous yarn and (b) morphology of nanofibers.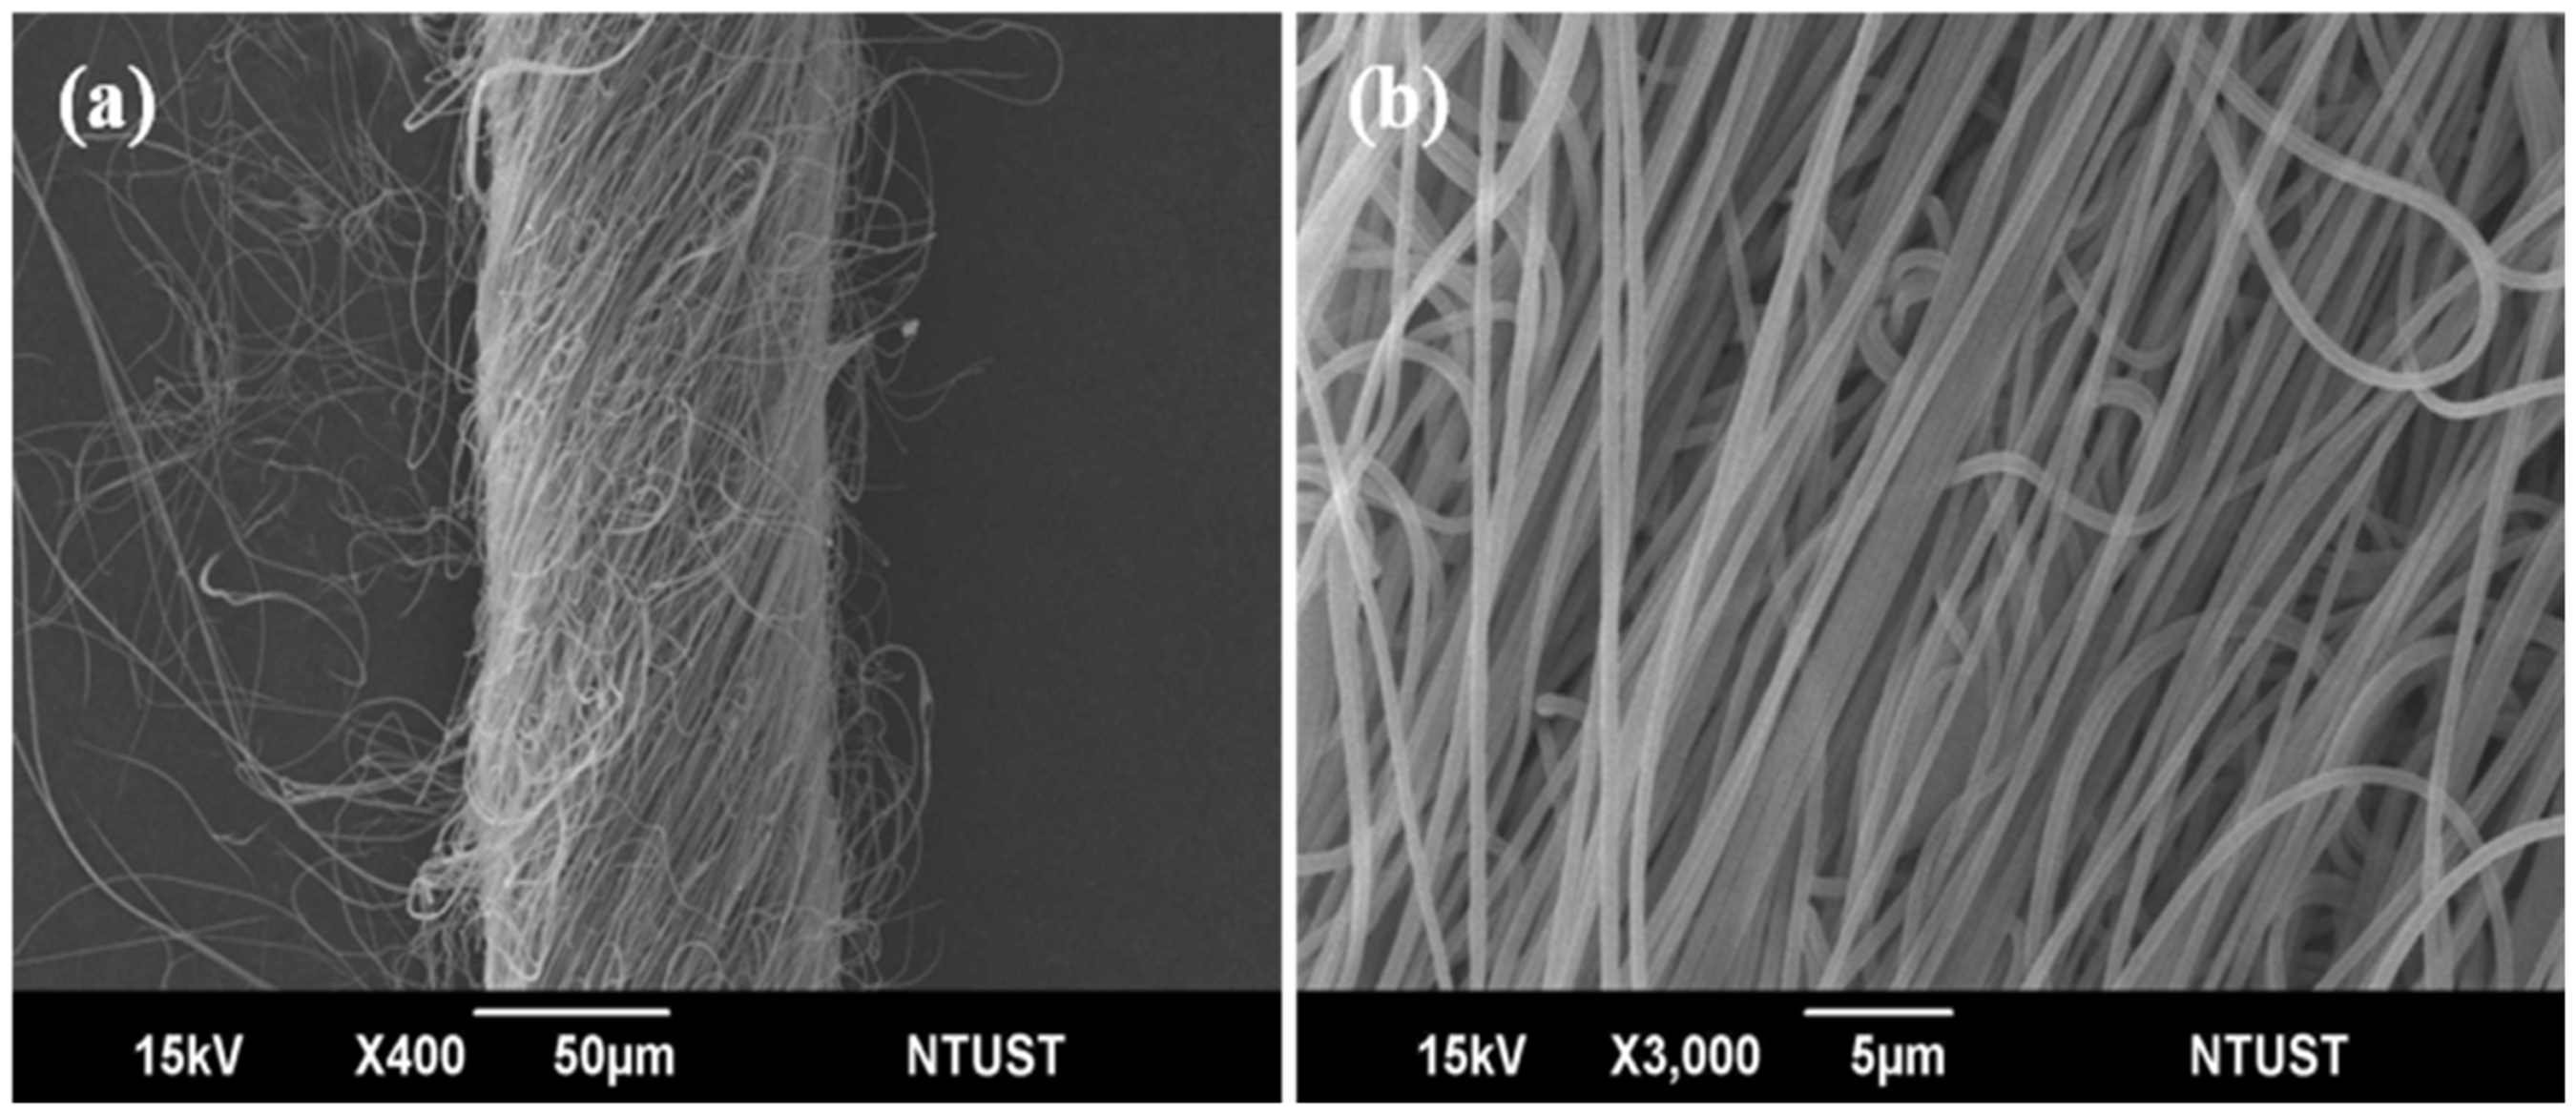
The optimum parameter set for fiber orientation (the standard deviation of the fiber arrangement angle) under the STB quality characteristic was A3B1C3D2. According to the Taguchi Method – 95% Confirmation Test, reasonable data should range within the interval 2.863–7.627. The average value was 4.177, indicating that this result was reasonable; the corresponding SEM images of the morphology are shown in Figure 10. Results of confirmation test for three quality characteristics are summarized in Table 6.
Morphology of nanofibrous yarn obtained using parameters A3B1C3D2: (a) morphology of nanofibrous yarn and (b) morphology of nanofibers. The results of confirmation test for three quality characteristics. CV: coefficient of variation.

PCA for multiple quality characteristics
The optimum parameters for each quality characteristic: (A) draw ratio, (B) nozzle number, (C) flow rate, and (D) elongation temperature.
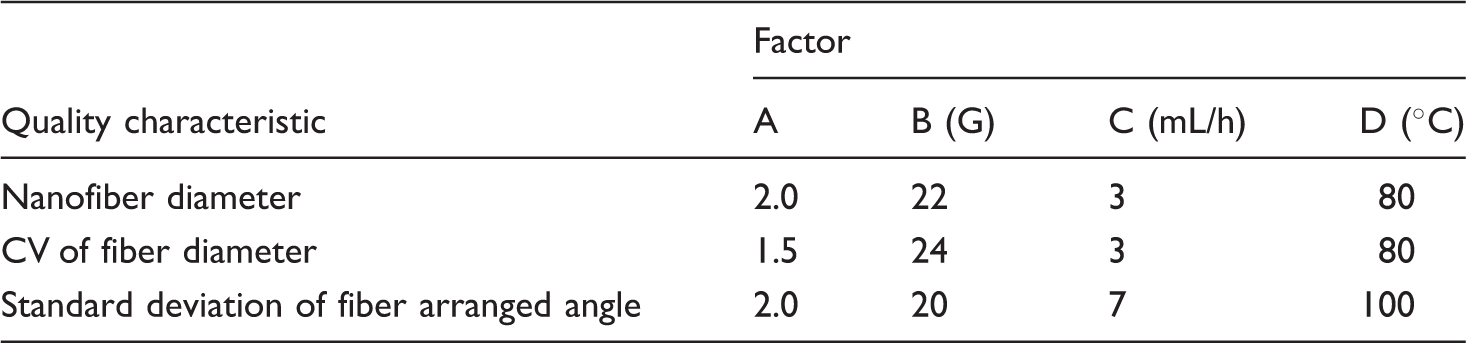
CV: coefficient of variation.
The normalized S/N ratios and principal components of the three quality characteristics.

S/N: signal-to-noise; CV: coefficient of variation.
Eigenvalues and explained variation for the principal components.

The response table for the total principal component score: (A) draw ratio, (B) nozzle number, (C) flow rate, and (D) draw temperature.


Main effects plot for total principal component score: (A) draw ratio, (B) nozzle number, (C) flow rate, and (D) draw temperature.
Footnotes
Conclusions
In this study, a comprehensive study was carried out on different quality characteristics and multiple quality characteristics were employed for the continuous production of a nanofibrous yarn. From the results of the Taguchi method and PCA, it was found that finer nanofibers can be obtained with the parameter set A3B2C1D1, which includes a draw ratio 2.0, a nozzle number of 22 G, a flow rate of 3 ml/h, and a draw temperature 80℃. A smaller variation in nanofiber diameter could be obtained with the parameter set A1B3C1D1, meaning a draw ratio of 1.0, a nozzle number of 24 G, a flow rate of 3 ml/h, and a draw temperature 80℃. A better orientation of the nanofiber arrangement could be obtained with the parameter set A3B1C3D2, which translates to a draw ratio 2.0, a nozzle number of 20 G, a flow rate of 7 ml/h, and a draw temperature 100℃. Considering all the three quality characteristics mentioned above, the parameter set A3B2C3D3, meaning a draw ratio of 2.0, a nozzle number of 22 G, a flow rate of 7 ml/h, and a draw temperature 120℃ should be selected to achieve a better level of performance for each quality characteristic.
Declaration of Conflicting Interests
The author(s) declared no potential conflicts of interest with respect to the research, authorship, and/or publication of this article.
Funding
The author(s) disclosed receipt of the following financial support for the research, authorship, and/or publication of this article: The work was partially financially supported by the Ministry of Science and Technology of Taiwan, ROC (Grant Numbers: MOST 104-2221-E-011-157 and MOST 105-2218-E-011-013).