
Abstract
In an environmentally polluted environment, woven curtain fabrics that collect dust and pollen play an important health-protective role in interior decoration. However, devices or evaluation factors for measuring the dust adsorption ability of interior products have not been developed. To resolve this deficiency, we developed an apparatus that directly measures the dust adsorption and devised two test parameters (dust interrupting capability and fine dust adsorption capacity) for quantifying the dust adsorption. We also investigated the physical properties affecting the dust adsorption ability of fabrics with different denier weaves of air-textured yarns and draw-textured yarns, which adsorb dust in their fluffs and crimps, respectively. The air permeability and weight of the fabrics were strongly correlated with fine dust interrupting capability. The air permeability, dust adsorption, and interruption capability of the air-textured yarns largely depended on the loops formed by the overfeed rate in the weft direction. The strong sound-absorbing performance of the samples (especially at higher frequencies) was also obtained by loops, fluffs, and crimps of air-textured yarns and draw-textured yarns of fabrics. The best sound-absorbing performance was exhibited by S20, made from 760 D with many loops on the yarn surface.
Keywords
Introduction
Continued industrialization has elevated environmental pollution to serious levels. In particular, rapid industrialization due to economic development has generated large quantities of “fine dust,” which consists of tiny particles with diameters of less than 10 µm, e.g. soot from diesel vehicles or incinerators. In addition to environmental issues, improving the techniques for filtering various kinds of emitted particles is important to the industries that recover them. Capturing this airborne powder could add value to the by-product released into the atmosphere, increasing the overall profits of the industry [1]. Furthermore, the number of patients suffering from atopy, allergy, asthma, and other diseases aggravated by the external environment has increased exponentially in decades, and the annual social cost of fine dust has reached 12.3 trillion won. With the increasing intensity of these environmental problems, interest in comfortable living environments has increased, and products and technologies that eliminate harmful emissions such as exhaust gas are attracting attentions. In addition, much attention has been focused on dust performance in many aspects [2–8]. Liu et al. [2] analyzed the effect of industrial structures and policies on air pollution in China. Chiang et al. [3] applied a polymer desiccant to solve the dust problem in fluidized beds.
The dust collecting performance of various materials has been extensively studied. Lu et al. [4] investigated the dust pollution on a solar photovoltaic cell by computational fluid dynamics. Hoeflinger et al. [9] suggested the importance of filter media porosity properties and developed transmitted light microscope and analysis software to compare the porosities of different surface-treated filter media. Jackiewicz et al. [10] used an X-ray computed tomography to explain a very complex process of the non-steady state aerosol particle filtration in fibrous filters. And standard method of filtration efficiency like as ISO 11057 (air quality test method for filtration characterization of cleanable filter media) is also available. In addition, there are not many cases where the interior fabric is used as a dust adsorbent and there is no device capable of measuring its performance.
Devices based on conventional particle capture technology, such as gravity filters, cyclones, bag filters, venturi scrubbers, spray scrubbers, and wet electrostatic scrubbers, have also been developed but their cost has limited their popularity in everyday life [7]. Many products in the market, such as mops, masks, and dustproof outdoor clothes, almost serve as nonwoven or woven fabric filters, but interior products with dust absorption properties are scarce. Although fibrous air filters that deposit dust particles have been reported in many theoretical and experimental studies [1, 9–11], there are no standards or regulations for dust-adsorbing products in interior decoration, especially for woven fabrics. Pollutant levels are frequently 2–100 times higher in indoor than in outdoor environments [12]. Indoor air pollutants have been ranked among the top five environmental risks to public health.
In this paper, we propose a dust adsorption test apparatus for interior woven products. At present, there is no established apparatus and method for measuring the fine dust adsorption of fabrics. To address this deficiency, we seek an appropriate mechanism and test method of fabric adsorption. We then try to design and weave dust-trapping fabrics and measure their dust adsorption abilities, which play an important role in interior decoration. Curtains with dust adsorption capability have been inadequately developed in our country, although dust-absorbing fabrics would reduce the pollution exposure to people living indoors. Therefore, we newly designed and prepared mock leno fabrics and different face woven fabrics with large air spaces, ensuring good dust absorbance. The fabrics were woven from air-textured yarn (ATY) and draw-textured yarn (DTY), which adsorb dust in their fluffs and crimps, respectively.
The fluffs in ATY and crimps in DTY are also effective on absorbing sound. When a sound wave strikes an acoustic material, the sound wave causes the material constituents such as fibers to vibrate because of friction. Sound absorption is accomplished in a process whereby the acoustic energy is transformed into heat [13]. Considering that human hearing is most sensitive in the 1000–3000 Hz range, the acoustic properties of the woven fabrics were investigated in the frequency range 100–5000 Hz. As a result, the fluffs in ATY and crimps in DTY are expected to be effective not only for dust absorption but also for sound absorption.
Material and methods
Materials
Properties of yarn materials.

Dust was purchased from PTI (A1, Power Technology Inc., USA), which was lead manufacturer of ISO 12103-1 test dust grades as well as other contaminants used for testing.
Preparation of woven fabrics
S18 fabrics with a basic mock leno/plain weaving pattern (number of repeats: 7/3) and different face wovens are shown in Figure 1. The fabrics were woven from warp DTYs and weft ATYs according to the fabric structure diagrams, as shown in Table 2. The weaving density of the resultant woven fabrics was 36–38 picks and 45–44 ends per 5 cm.
Pattern design of (a) mock leno/plain fabrics (number of repeats: 7/3) and (b) different face woven fabrics. Weaving conditions of dust-absorbing fabrics. ATY: air-textured yarn; DTY: draw-textured yarn.

The mock leno fabrics S18 and S19 were prepared similar to lace fabrics, which reveal the effect of the texture processing of DTY and ATY. Like leno fabric, the mock leno fabric has an open structure with a small pore structure. The micropores of the mock leno fabric should increase the sound absorption by reducing the energy of the sound, and the looped ATY and bulky DTY should increase the fine dust adsorption.
The different face wovens of S20 and S21 were designed for high dust adsorption performance and sound absorption performance. The DTY and ATY yarns maximize the conversion of sonic to thermal energy by creating friction between the fiber surface and the inner pore layer. The crimps and loops are expected to improve the dust and sound adsorption. The weight and thickness of the fabric are appropriate for interior decoration and the overall strength and elasticity of the fabric are increased by inserting a plain weave. In summary, the fabric was designed as a mixture of plain weave and mock leno weave.
Characterization of the woven fabric
The weight of the fabrics (in grams per square meter) was measured on an electronic balance with a capacity of 0.001 g. The thickness was measured by a PEACOAK, FED-7 under low pressure. The pressure foot was gradually lowered onto the fabric and rested there for 30 s while the gage measurement was recorded. The air permeability was measured by the standard TS 391 EN ISO 9237 method, using an FX 3300 air permeability tester with a constant pressure drop of 100 Pa (20 cm2 test area). Porosity and pore sizes were computed by equations (1) and (2), respectively [14], and the cover factor was obtained by equation (3) [15]. The degree of bulk was calculated by equation (4) [16]. All tests were performed under standard atmospheric conditions (20℃, 65% RH)

W: weight of fabric (g/m2),
d: diameter of yarn (mm),
T: thickness of fabric (mm),
L: fineness of yarn (tex).

A: 1/warp density (number of filaments/cm) − warp diameter (cm),
B: 1/ weft density (number of filaments/cm) − weft diameter (cm).

Where D1: warp density (number of filaments/cm),
d1: warp diameter (cm),
D2: weft density (number of filaments/cm),
d2: weft diameter (cm).

The dust adsorption properties were evaluated in a self-manufactured dust adsorption box (see Figure 2). The measurement conditions are shown in Table 3.
Dust absorption box for measuring the dust interrupting capability and fine dust adsorption capacity. Measurement conditions of dust adsorption apparatus. Method for measuring the dust interrupting capability.
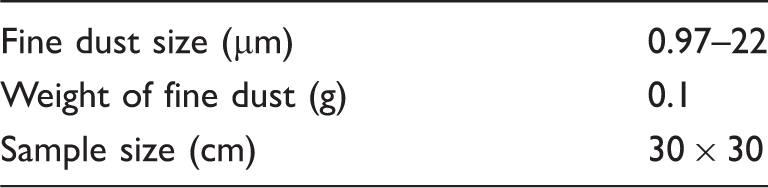

As shown in Figure 2, the sample was held in the middle and subjected to wind generated from the right-side propeller. The fine dust (A1, size 0.97–22 µm) was sprayed from the top of the box, and compressor air was used to spread the dust evenly in the box instantly. At this time, a device (Air-blaster, dw-ab 100, Dongwon SM, Korea) for allowing the dust to flow into a certain amount of box was attached. The concentration of dust was measured by Fine Dust Concentration Meter (BR-AIR-82 K, BRAMC, Korea) of the measuring room on the right and the reference room on the left. The wind speed of the propeller was set to 2 m/s when injecting the fine dust, whose speed corresponds to “Light Breeze” of Beaufort wind force scale, and then adjusted to 2, 1, 0.1, or 0 m/s. The concentrations of fine dust in the reference and measuring rooms were checked at intervals of 10 s. The amount of fine dust was adjusted so that the dust concentration did not exceed 800 µg/m3. The dust adsorption property, fine dust barrier ability, and fine dust adsorption capacity of the test fabric were measured. This series of experiments was carried out at 20℃ and 60% RH conditions.
The fine dust barrier was defined as the difference in maximum fine dust concentration between the measuring room and the reference room. That is, the dust barrier ability was examined by measuring the amount of fine dust in the airflow passing through the sample at the given wind speed 2 m/s at the fine dust input step. The result is shown in Figure 3.
In general, the concentration of fine dust in the measuring room increased rapidly to its maximum and then decreased as part of the dust fell freely. Other dust portions were carried into the reference room or onto the sample by the airflow. At this time, the higher the dust barrier capacity of the sample, the smaller the amount of fine dust passing through the reference room, and the greater the concentration difference between the measuring and the reference rooms.
Measurement of fine dust adsorption capacity (by image analysis): To quantitatively compare the number of dust particles, and the sizes and distribution of the particles, test samples were placed in a dust measuring apparatus and subjected to a quantitative evaluation technique using a fast and objective statistical image analysis program. The specimens were collected in the evaluation device and then observed with a digital microscope. The degree of fine dust collected on the sample surface was measured in microphotographs of the samples, captured by a digital camera at 60× magnification using a Dino-Lite Pro Microscope (Max 250 magnification). The photographs were centered on the area of greatest uniformity of the fine dust dispersed on the sample surface and were stored on a disk. Their resolution was (1280 × 1024) pixels. The fine dust in the obtained photographs was analyzed by an image analysis program (Leica, LAS V4.2). The image analysis technique digitizes the pixel contrast values on the digital screen and converts them to arbitrary units on the screen. An algorithm then displays the units as statistical numerical values.
Image processing was performed by the following procedures. First, the original photographs stored on the computer were converted to grayscale images. In Step 2, the boundaries of the fine dust particles were detected. To optimize the image, the background image was adjusted to remove unnecessary background images and uneven light sources in Step 3. Step 4 executed the auto threshold that separates the detection objects (fine dust) from the nondetection objects (background). The particle count analysis and linearization were executed by MaxEntropy (decided as the most suitable method for this purpose). In Step 5, the number, size, and distribution of the fine dust particles were automatically quantified and quantitatively evaluated by the Analyze Particles function. The whole process is outlined in Figure 4.
Image processing procedure for counting the number of fine dust particles on S20.
To evaluate the sound absorption properties, the sound absorption coefficients [17, 18] were measured by impedance tube methods. The sound absorption coefficient is defined as the incident acoustical energy absorbed by the material over a number of specific frequencies and is usually expressed as a decimal between 0 and 1. For example, if a material absorbs 55% of the incident sound energy, its absorption coefficient is 0.55. The absorption coefficient of a material that absorbs all incident sound waves is unity. Moreover, to generate a single number index of the sound-absorbing efficiency of a material, the sound absorption coefficient is measured at four frequencies (250, 500, 1000, and 2000 Hz), and the results are averaged to obtain the noise reduction coefficient (NRC). The NRC defines the percentage of sound absorbed by the surface, i.e. the percentage of sound that hits the surface and is not reflected back into the room. The NRC clearly and simply quantifies how well the surface absorbs sound in the 250–2000 Hz range [19].
Impedance tube methods: The impedance tube method was implemented by an Acoustic Duck (SC 9301) according to KS K 2814-2:2002, and ASTM E1050. The sample is fastened to the left rigid wall of the tube, and a loudspeaker that emits sound waves of well-defined frequencies is attached to its right wall. The nodes and antinodes of the standing waves emitted by the loudspeaker and those reflected from the sample are detected by a small microphone that slides along the tube axis. In other words, the analyzer generates a random signal, which is then amplified. Next, a frequency weighting unit in the tube is applied to the sound source. Finally, the analyzer measures the response of the two microphones and calculates the frequency response function between the two microphone channels.
Results and discussion
Effect of yarn structure on dust adsorption
Figure 5 is a schematic of the dust adsorption mechanism of fabrics made from ATY and DTY. The DTYs and ATYs were selected as the best yarns for achieving fabric that adsorbs fine dust. Under the processing conditions, porosity and the loop structure simultaneously appeared in the fabric texture. Loops or crimps in the yarn increase the surface area of the fabric, influencing the fabric permeability, dust capture ability, and retention capacities for dust particles of specific sizes. The increased surface area of the yarn increases the space in which dust can be adsorbed. The surface fluffs and crimps also facilitate the capture of dust, pollen, and fine dust in curtains with these fabric structures.
Schematic of dust absorption on ATY and DTY.
Relationship between the dust barrier and physical properties of fabrics
Physical properties of fabrics and dust interrupting capability of woven fabrics.

First, when interrupting fine dust at different wind speeds, the different face woven fabrics showed better performance than the mock leno woven fabrics, except in strong winds (2 m/s). This result is attributed to the thicker, higher cover factor, and lower air permeability of all the fabrics. As the wind speed increased, the fine dust interrupting capability decreased in all the fabrics. At high wind speed, the fine dust was not adsorbed on the fabric and could be viewed as passing through the fabric. However, the mock leno fabrics showed excellent fine dust interrupting capability in strong winds. It can be estimated that the airflow pressure of the mock leno fabric is relatively low because the pores are larger than the different face woven fabric. As a result, the amount of dust flowing along the air stream is small and a relatively large amount of dust adheres to the between yarns loops or fluffy.
Figure 6 plots the fine dust interrupting capability as a function of various physical properties of the fibers. The interrupting capability was strongly correlated with air permeability and thickness of fabrics, of which coefficient of determination (R2) was 0.98. It was inversely proportional to the air permeability and was directly proportional to the thickness. Next, the correlations with the fine dust interrupting capability were in order of weight (R2:0.9), cover factor (R2:0.9), open free volume (R2:0.88), and bulkiness (R2:0.89), which were proportional. However, the correlation between the fine dust interrupting capability and pore size was very low of which coefficient of determination (R2) was 0.73.
Relationship between fine dust interrupting capability and physical properties of the all fabrics.
Comparing the fine dust interrupting capabilities of the 760d (S18, S20) and 530d (S19, S21) fabrics woven from ATY, we confirm the excellent performance of 760d. The high overfeed rate in the processing of this fabric created many loops, which were exposed on the surface of the yarn and reduced the air permeability. In this way, the loops formed by the overfeed rate of the weft ATY greatly influenced the dust adsorption and interrupting capability of the woven fabrics.
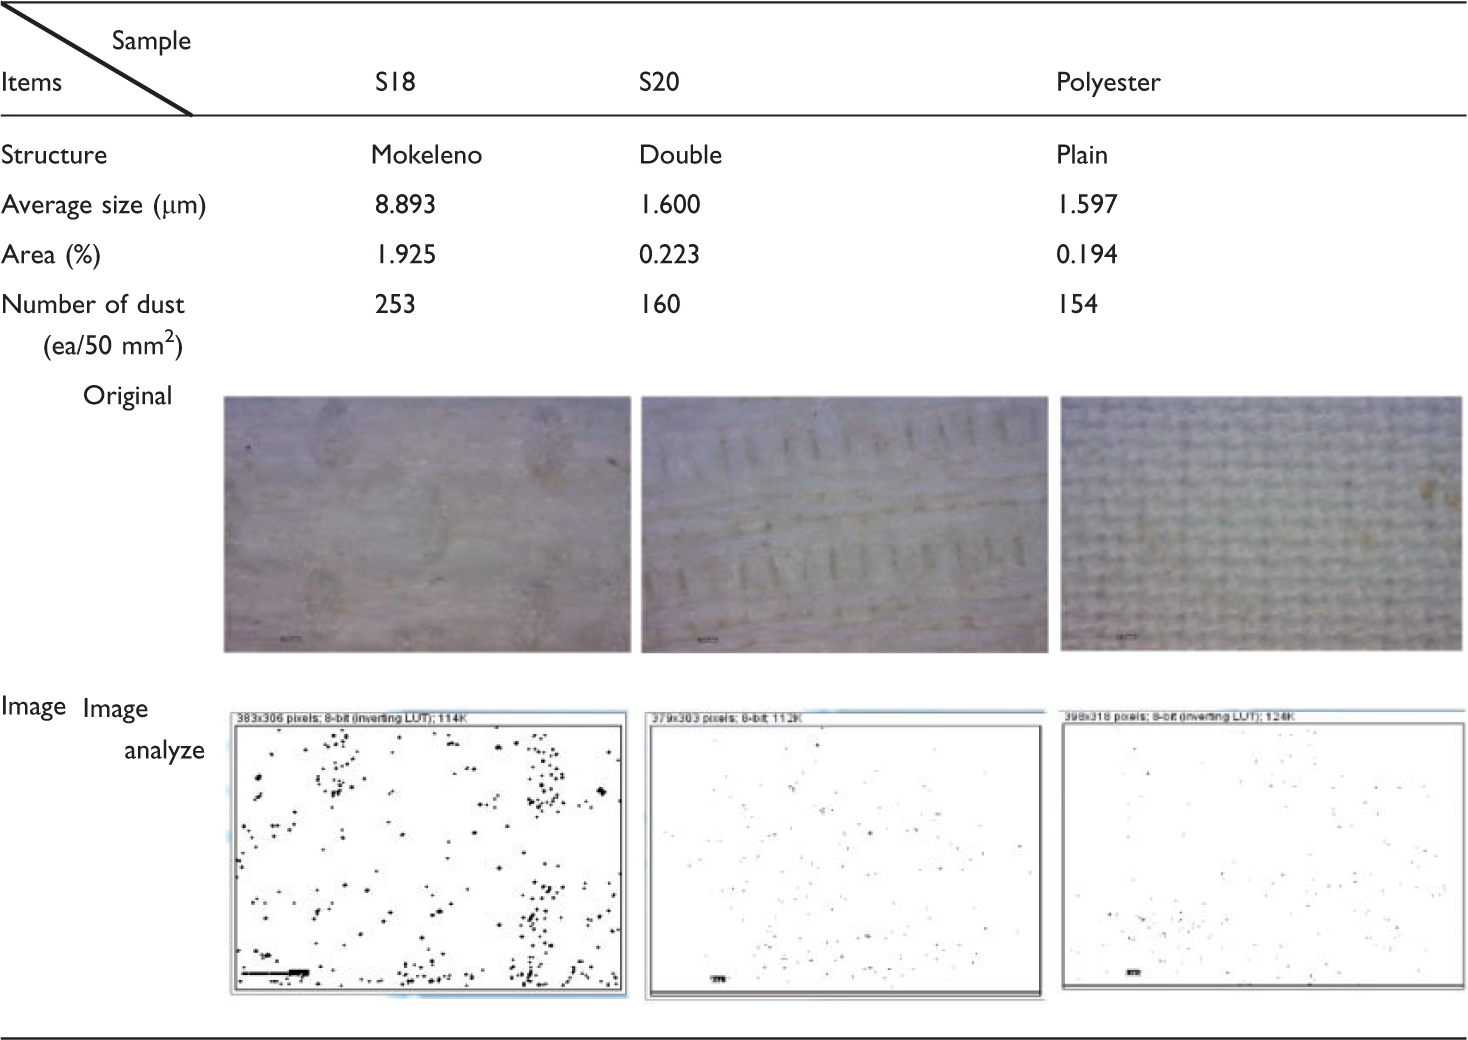
Fine dust adsorption capacity
Results of image analysis for measuring the fine dust adsorption capacity.
Sound absorption properties by the impedance tube method
Figure 7 shows the sound absorption coefficients as functions of sound frequency. The absorption coefficient of all fabrics increased with increasing frequency and was highest in S20 over the measured frequency range, followed by S21. The air permeability was lowest in S20 (23 mm/s; see Table 4). As the air permeability of the fabrics increased, the sound absorption coefficient decreased.
Sound absorption coefficients of the fabrics versus sound frequency, measured by the impedance tube method.
Noise reduction coefficient (NRC) of fabrics obtained by the impedance tube method.

Conclusion
We have designed and woven highly functional curtain fabrics with sound-adsorbing properties and the ability to collect dust, pollen, and fine dust. Both capabilities play an important role in interior decoration. Our newly designed mock leno and different face woven fabrics possess large fluffs and crimps; those are possible by using ATY and DTY, which easily absorb dust particles. We developed an apparatus for measuring the dust adsorption and devised measures of dust absorbency (namely, the dust interrupting capability and fine dust adsorption capacity). We also investigated the physical properties of the fabrics that affect their dust adsorption ability. The air permeability, weight, of the fabrics was highly correlated with the fine dust interrupting capability. The interrupting capability increased with increasing weight and cover factor, degree of bulk, open free volume, thickness and decreased with increasing air permeability and pore size. The loops formed by the overfeed in the weft direction of S18 and S20 were greatly effective on the dust adsorption capacity, and dust-interrupting capability of the woven fabrics. As confirmed in the image analysis, the dust adsorption capacity was highest in the mock leno fabric (S18) than in the different face woven fabrics. The sound absorption coefficient of S20 and S18, which were having many loops on the yarn surface, was more effective than S21 and S19. Although the NRC was poor (0.11–0.23) in the low-frequency range, it was satisfactory in the high- frequency range.
Footnotes
Declaration of Conflicting Interests
The author(s) declared no potential conflicts of interest with respect to the research, authorship, and/or publication of this article.
Funding
The author(s) disclosed receipt of the following financial support for the research, authorship, and/or publication of this article: This work was supported by technical innovation development program funded by Korea Small and Medium Business Administration in 2015 (Grant No. S2296452).