
Abstract
The mutual effects of nano-TiO2 and alkaline hydrolysis on the morphology, chemical structure, water absorption, and the dyeing behavior of poly(ethylene terephthalate) nanofibers were investigated via employing scanning electron microscope, Fourier Transform Infra Red Spectroscopy (FTIR) and X-ray diffraction, and measuring water contact angle, 3M repellency, and dye absorption. A direct relation between the alkaline hydrolysis rate and nanofibers hydrophilicity was observed, while the addition of the nano-TiO2 led to more hydrophobicity. However, the alkaline hydrolysis had the prominent effect. FTIR spectra illustrated no chemical interaction between the nanoparticles and nanofibers. It was also shown that the dye absorption at dyeing equilibrium and the rate of dyeing were increased by the presence of the nano-TiO2 and these effects were intensified by the alkaline hydrolysis. These observations were related to the reduction in the nanofibers diameter and the increase in the surface roughness, as evidenced in the scanning electron microscope, and the increase in the amorphous regions of the nanofibers, as shown by the X-ray diffraction diffractograms.
Introduction
Nanofibers show different properties in comparison to the regular fibers; for example, they have a high surface to volume ratio and also, they possess a high surface roughness [1]. It is claimed that the high surface roughness of the nanofibers is due to the application of volatile solvents in their production that are rapidly evaporated and separated from the polymer [2]. There are different techniques to produce nanofibers and all of them produce a nonwoven layer. Some of these production techniques are meltblowing, spinbonding, flash spinning, and electrospinning [1]. The electrospinning technique is widely used because of having a simple and low-cost process [2]. Different nanoparticles have been used in the nanofibers production by mixing them with the polymer before spinning, or by coating them on the nanofibers. In a research conducted by Meng, nano-TiO2 with 10–20 nm particle sizes was homogenously mixed with poly(ethylene terephthalate) (PET) and then electrospun; finally, the crystallinity and the morphology of the resulted nanofibers were investigated [3]. In another research, SiO2 nanoparticles were mixed with PET and the crystallinity and the thermal resistance of the nanofibers were examined [4]. Lee et al. dyed nylon 66 nanofibers with high molecular mass acid dyes and examined their DSC, X-ray diffraction (XRD), amino end groups, and water absorption, as well as the rate of dyeing, the extent of exhaustion, and the washing fastness. Their results showed that the nanofibers had lower crystallinity, amino end groups, and washing fastness than the regular fibers, but they showed higher water and dye absorption and a larger rate of dyeing [5]. A team of researchers studied the dyeing of cellulose nanofibers by the cold pad-batch method, using some reactive dyes. The dye fixation and washing fastness of dyed cellulose nanofibers obtained in this work were very good [6]. In another research, the dyeing of polyvinylpyrrolidone nanofibers with three different dyes (coumarin 6, rhodamine 6G, and sulforhodamine 101) were studied [7]. In a research carried out by Daneshvar et al., Nylon 66 nanofiber yarns were produced and dyed in a dyebath. They also produced colored nylon nanofiber yarns using a colored electrospinning solution. Their results showed that the dye concentration in the yarns was increased by the dye concentration in the dyeing bath and the amount of the dye in the electrospinning solution. However, they reported that the dye strength of the yarns produced by the colored electrospinning solution was lower than that of the yarns dyed in the dyebath [8]. In another research, polyester nanofiber was produced and dyed using disperse dyestuff. The results were compared to regular polyester fibers, showing that dye affinity and disperse dyestuff penetration into the polyester nanofibers were more than those of the regular polyester fibers [9]. The comparison between the dyeing behavior of acrylic nanofibers and the regular acrylic fibers at 85℃ and 105℃ revealed that acrylic nanofibers in both temperatures had a higher rate of dyeing in comparison to the regular fibers [10]. To the best of authors’ knowledge, no research has addressed the mutual effect of nano-TiO2 and alkaline hydrolysis on the surface properties, water absorbency, and the dyeing behavior of polyester nanofibers. Accordingly, in this research, the changes in the morphology, surface, water absorbency and dyeing properties of polyester nanofibers were investigated via adding different amounts of nano-TiO2. In addition, while the alkaline hydrolysis severely damaged the nanofibers, for the first time, a proper mild hydrolysis condition was examined and different aspects of its effects on the samples were studied.
Experimental
Materials
The pellets of PET, Mw = 18,000–25,000 g/mol, were obtained from the Tondgooyan Co., Iran. The TiO2 nanoparticles in the anatase form, with 21 nm particle size and the purity of 99.5%, were supplied by Evonik, Germany. Electrospinning solvents, dichloromethane and trifluoroacetic acid, and DMF solvent, which were all of the analytical grade, were supplied by Merk, Germany. Ekalin F, a dispersing agent, was supplied by Sandoz Co, Switzerland. The disperse dye used in this research was Disperse Blue 56 supplied by Hangzhou Weiyi Chemical Co. Figure 1 shows the chemical structure of the dye.
Chemical structure of C.I. Disperse Blue 56.
Nanofibers production
Preparation of the PET nanofibers was done by a home-made horizontal electrospinning apparatus with a cylindrical collector covered by an Al foil (with rpm equal 50). A syringe with the tube tip diameter of 23 gauge (inner diameter: 0.4 mm and length: 34 mm) was chosen. For creating an electrical field between the needle and the collector, a high-voltage power supply generating a DC voltage up to 40 kV was utilized. The solution flow rates were controlled by a pump pumping the solution at a rate of 0.2 ml/h. The optimized conditions for obtaining nanofibers with this electrospinning apparatus were the concentration of 10 w/v(%) polymeric solution, the applied voltage of 13 kV, and the tip to the collector distance of 15 cm. The nanofibers were collected on a screen made of PET with the mesh number of 65 per inch. PET nanofibers containing 0, 1, 2.5, 4, and 5.5 wt(%) of the nano-TiO2 were prepared using the electrospinning apparatus. The PET chips (10 w/v(%)) and the nano-TiO2 were dissolved in the mixed solvent of dichloromethane/trifluoroaceticacid, with the volumetric ratio of 1:1, at room temperature. The procedure of the nanofiber preparation is based on Reneker and Chun paper [11].
Alkaline hydrolysis
To investigate the effect of alkaline hydrolysis on the topography of the surface and subsequently, on the dyeing properties of the resulted nanoweb, the nanofibers were treated in a 0.5% NaOH solution for 5 s at room temperature. The condition of the alkaline hydrolysis was set by firstly adjusting the temperature to the room temperature and then the maximum concentration of NaOH and time were found by trial and error in a way the samples are processable in subsequent stages. It means that using a longer time and/or a higher alkaline concentration could severely damage the nanoweb. Then, the treated samples were washed for 20 min in water with acidic pH and finally they were rinsed with distilled water.
Dyeing procedure
The dyeing of the nanofibers was carried out using an AHIBA 1000 Polymat dyeing machine, Data color Co., Swiss. The dyebath contained 1 g of the sample, 0.5% owf of the disperse dye, and 3 g/l of a 10% (w/w) solution of the Ekalin F and the L:R was 1000:1. The pH of the solution was controlled to 5.5, using an acetic acid/ammonium acetate buffer solution. The dyeing procedure started at 50℃ and reached to 90℃ in 15 min and continued at this temperature for 45 min. Finally, the dyebath was cooled to 70℃ in 10 min and the samples were removed, rinsed in cold water, and dried at ambient temperature. It is important to note that the necessary corrections for the presence of the PET screen were made.
Evaluation methods
The repellent properties of the electrospun webs were evaluated by measuring contact angle [12] and employing 3 M water repellency tests. The details of these tests could be found in Mazrouei-Sebdani et al. [13].
In order to identify the equatorial diffraction profile of the specimens, the XRD patterns were recorded in an X-ray diffractometer (Philips, the Netherlands) at room temperature, using CuK tube radiation with the wavelength of 1.5409 Å, as generated at 30 kV and 30 mA.
The Fourier Transform Infra Red Spectroscopy (FTIR) spectrum of the samples was recorded by MB-Series 100, Hartman & Braun, Canada, to identify and study the chemical structure of the nanofibers. The samples preparation was done via incorporating them in a thin KBr disk prepared under high pressure.
In order to investigate the sample surface morphology and porosity, the scanning electron microscopy (SEM) of the samples was obtained using FESEM Hitachi-s-4160. To make the nanofibers conductive, a nano-layer of gold was coated on the sample.
To measure the absorbance of the dye solution at the end of the dyeing process, Shimadzu Spectrophotometer, UV mini-1240, Japan, was used. In this regard, Beer–Lambert law, equation (1), was applied.

The exhaustion (%) of the dyeing solution was calculated according to equation (2).

As the nanowebs were supported by a screen made of PET, and the applications of the assembly is going to be in a way that the tensile strength of the nanofibers are not important, the tensile strength of the nanowebs were not measured.
Results and discussion
Contact angle and 3M water repellency of electrospun PET nanofibers.
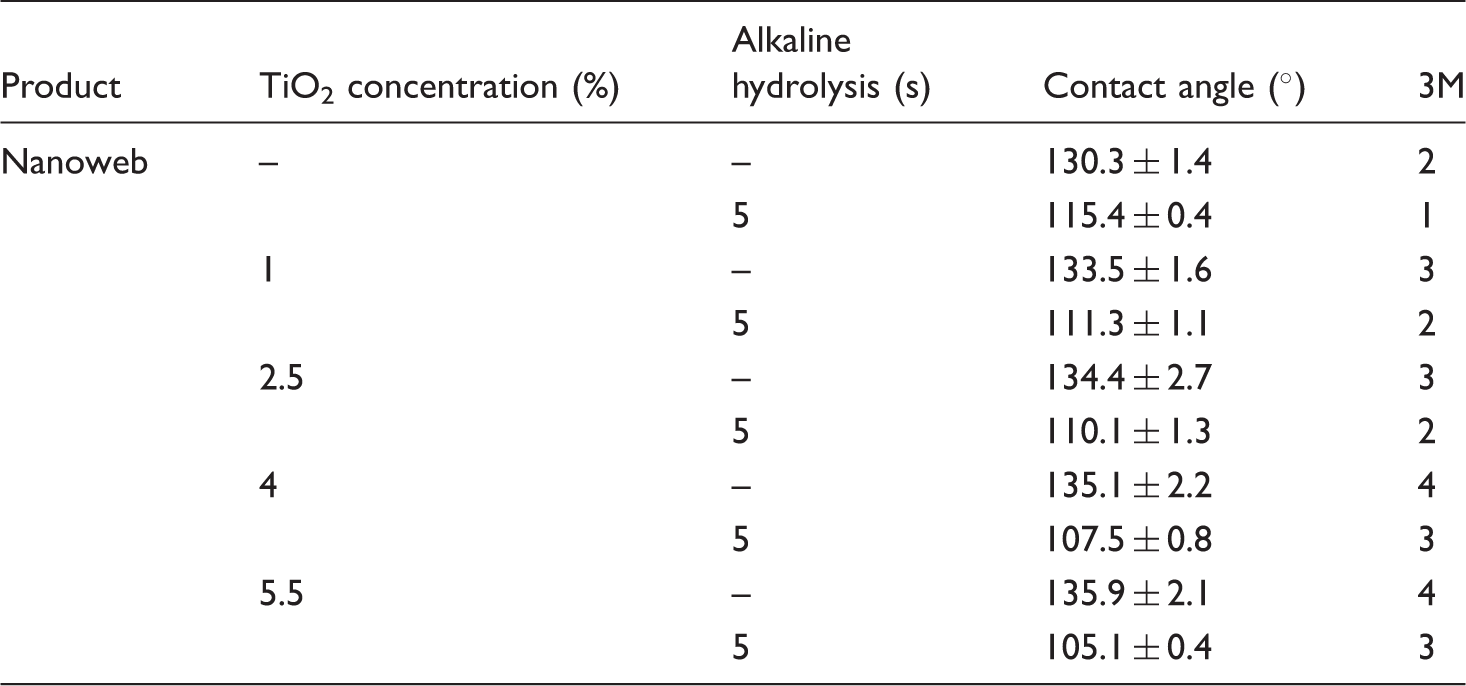
As suggested by Zeronian et al. [15], it is likely that the functional groups created on the nanowebs surfaces as a result of polymer chain scission after alkaline hydrolysis can lead to the higher hydrophilicity of the nanofibers. Furthermore, the generation of the surface pits on the surface of the hydrolyzed PET by alkaline hydrolysis could be taken as another phenomenon affecting the samples hydrophobicity [13]. However, the increase in the hydrophilicity of the PET fiber after alkaline hydrolysis has also been reported by Montazer and Sadighi [16]. By explaining that alkaline hydrolysis produces carboxylate ions on the PET surface, they have implied that the reason for the increase in the hydrophilicity of the fiber is the introduction of the functional groups on the surface of the hydrolyzed PET fiber.
For samples with no alkaline hydrolysis, a direct relationship between the concentration of the nano-TiO2 and the water contact angles, as well as the 3M water repellency grades, was observed. This observation could be ascribed to the more irregularity of the surface due to the presence of more nano-TiO2, leading to more hydrophobicity. The high water contact angle of the untreated control sample revealed that the samples surface was hydrophobic; subsequently, by an increase in the concentration of the nano-TiO2, proper surface roughness was created, thereby increasing the sample hydrophobicity.
With this nanoweb hydrophobic surface, the obtained results could be attributed to the introduction of double roughness with the original roughness appearing from the nanoweb structure itself and the next from the layer of the nanoparticles. A double scale roughness provides the appropriate topography to develop superhydrophobic, self-cleaning surfaces [17].
Moreover, it is reported that TiO2 particles are responsible in some of the occurring changes on the PET fiber surface due to hydrolysis, particularly the formation of surface pits. The pits were generated by the preferential hydrolysis of the lower order polymer chains around the TiO2 [18]. Yang et al. [19] stated a similar effect for SiO2 nanoparticles on the alkaline hydrolysis of PET, arguing that the same effect would apply for the nano-TiO2 on PET nanofibers.
The FTIR spectra of the PET nanofibers with varying concentrations of the nano-TiO2 (0.0, 1, 2.5, 4, and 5.5%) are shown in Figure 2. There was only a new peak in the FTIR spectra of the nanofibers containing the nano-TiO2, as compared to the one without the nano-TiO2. It could be concluded that the nanoparticles were physically entrapped in the polyester nanofibers. The peak related to the nano-TiO2 was revealed at 600/cm for the samples with the nano-TiO2. This peak was more noticeable in the spectra captured from 800 to 400/cm, as shown in Figure 2(b).
The curves of the infrared spectroscopy for the PET nanofibers with varying amount of the nano-TiO2: (a) full spectrum, (b) spectrum in the 800–400/cm range.
The different surface structure of the alkaline hydrolyzed samples, as compared to the nanofibers with no alkaline hydrolysis, was revealed from SEM images shown in Figure 3. As can be seen from Figure 3, the alkaline hydrolyzed nanofibers, Figure 3(c) and (e), showed a rough surface in comparison with the comparatively smooth surface of the non-hydrolyzed ones, Figure 3(a). It could be observed from Figure 3(d) and (f) that after the alkaline hydrolysis, the created pits, due to releasing nano-TiO2, had been oriented in the direction of the nanofiber axis on the nanofiber surface. This observation is compatible with the findings of other researches, implying that the alkaline hydrolysis of PET fibers leaves an axially oriented, elliptical void around the particle/nanoparticles [18,19].
SEM images of nano-TiO2–PET nanofiber composites before and after alkaline hydrolysis: (a, b) without, (c, d) with 2.5%, and (e, f) with 5.5% nano-TiO2.
Nanofibers diameter histograms, as shown in Figure 4, were statistically analyzed through SPSS software. Figure 5 shows the average of the nanofibers diameter for the samples before and after alkaline hydrolysis. Figure 5 reveals that by increasing the nano-TiO2 concentration from 0 to 5.5%, the average nanofibers diameter was decreased from 332.7 ± 29.4 to 276.1 ± 57.0 nm. These changes could be addressed by the more electrical conductivity of the electrospinning solution with the nano-TiO2, as compared to that for the one without the nano-TiO2 [20,21], resulting in the more stretchability of the polymeric solution between the syringe and the collector of the electrospinning apparatus.
SEM images of hydrophobic nano-TiO2–PET nanofiber composites: (a) without, (b) with 1%, (c) with 2.5%, (d) with 4%, and (e) with 5.5% nano-TiO2. Average diameters of PET nanofibers with and without the nano-TiO2.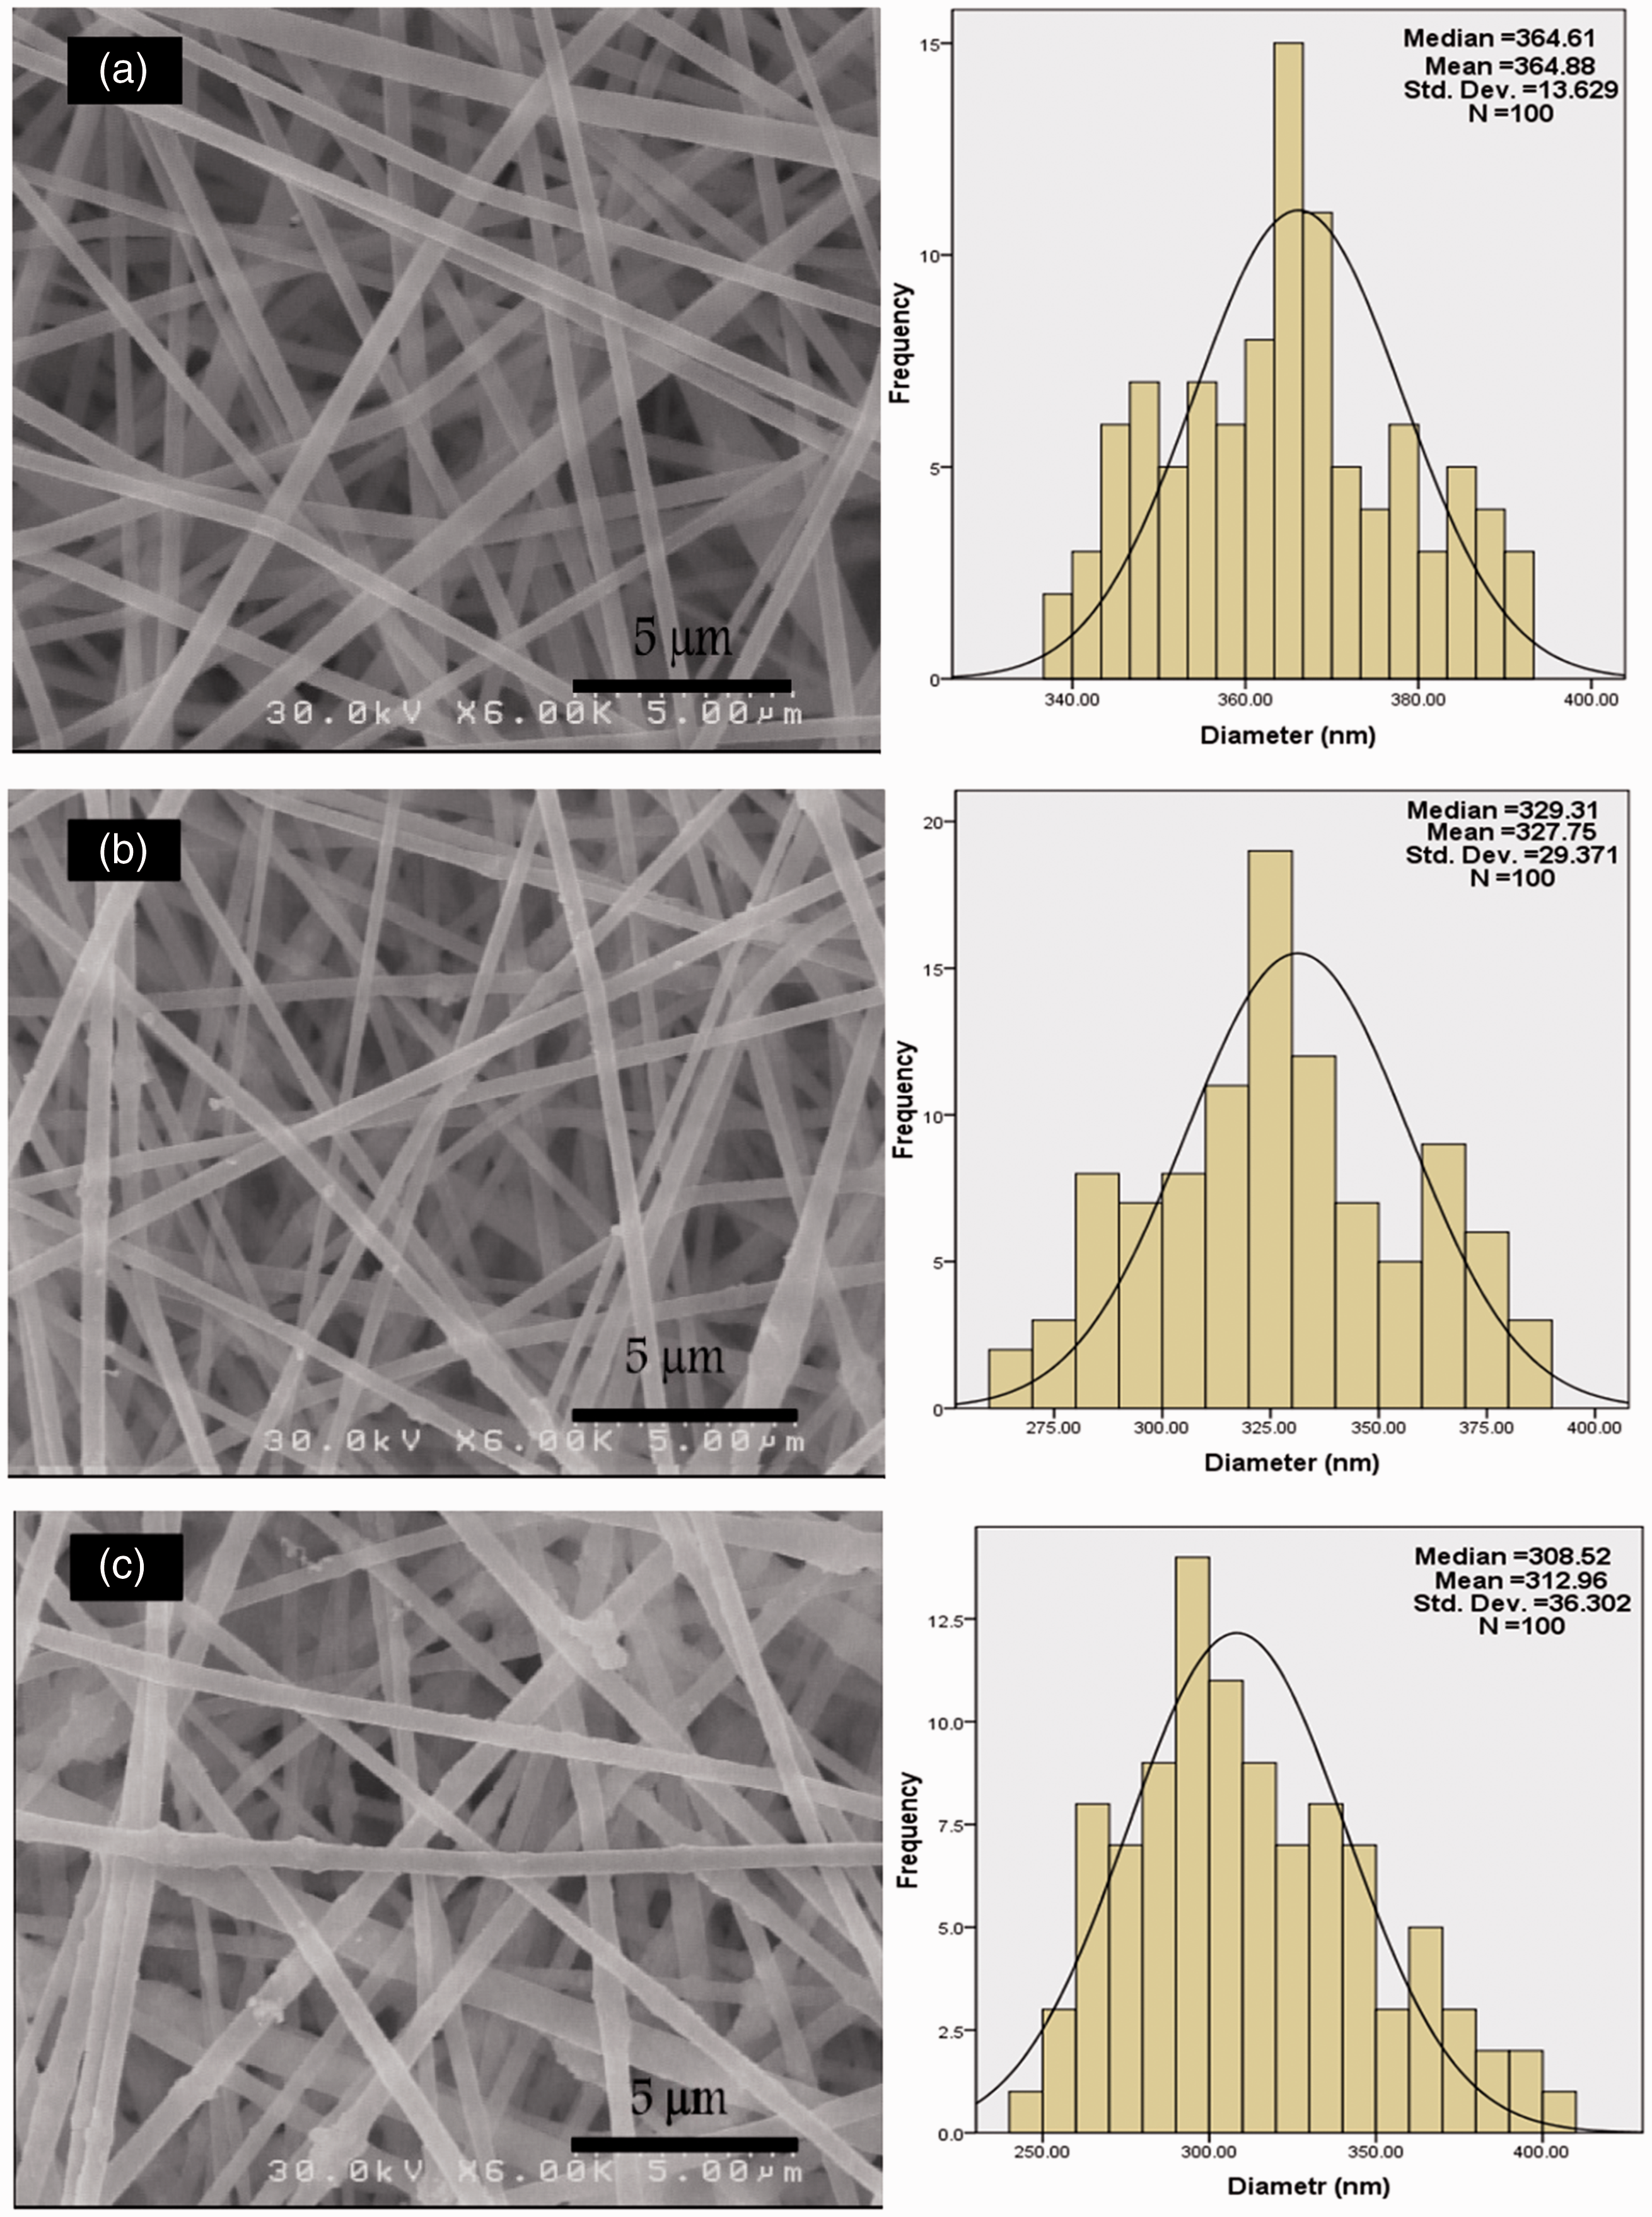

Also, alkaline hydrolysis can lead to the diameter reduction of fibers [13], making the surface structure of the fibers more appropriate for generating roughness, as already reported by Sadeghi [22]. As shown in Figure 4(a), there was no nano-TiO2 in the nanofibers; only the reduction of the nanofiber diameter without any pits or indentation could be observed; however, as shown in Figure 4(b) and (c), in the presence of the nano-TiO2, the reduction in the diameter was rooted in both the electrical conductivity of the solution of the nanoparticles in the solvent and the etching effect of the alkaline hydrolysis.
The crystallinity of the nanofibers was investigated by XRD analysis. Figure 6 shows the XRD pattern of 0, 2.5, and 5.5% nano-TiO2–PET nanofiber composites. According to the XRD pattern, it could be demonstrated that the resulted nanofibers contained the nano-TiO2 and were more amorphous in comparison with those without the nano-TiO2; so the more the nano-TiO2 concentration, the more the amorphous region of the nanofibers. A pick at the 15–20° was related to the polyester molecule. With the increase in the nano-TiO2 concentration, the nanowebs developed a significant peak at 25°. Also, the small peaks revealed at the regions of 38°, 48°, 54°, and 64° were contributed by the nano-TiO2. Since the peaks related to the polyester were flattened by the increase of the nano-TiO2 concentration from 0 to 5.5%, it could be concluded that the crystallinity of the nanofibers was reduced by the presence of the nano-TiO2. This observation could be due to this fact that the presence of the nano-TiO2 in the nanofibers limits the moveability of the polymer chains during the electrospinning process and consequently, the crystallization process is hindered [23].
X-ray diffraction patterns of the varying nano-TiO2–PET nanofiber composites with 0, 2.5, and 5.5% nano-TiO2.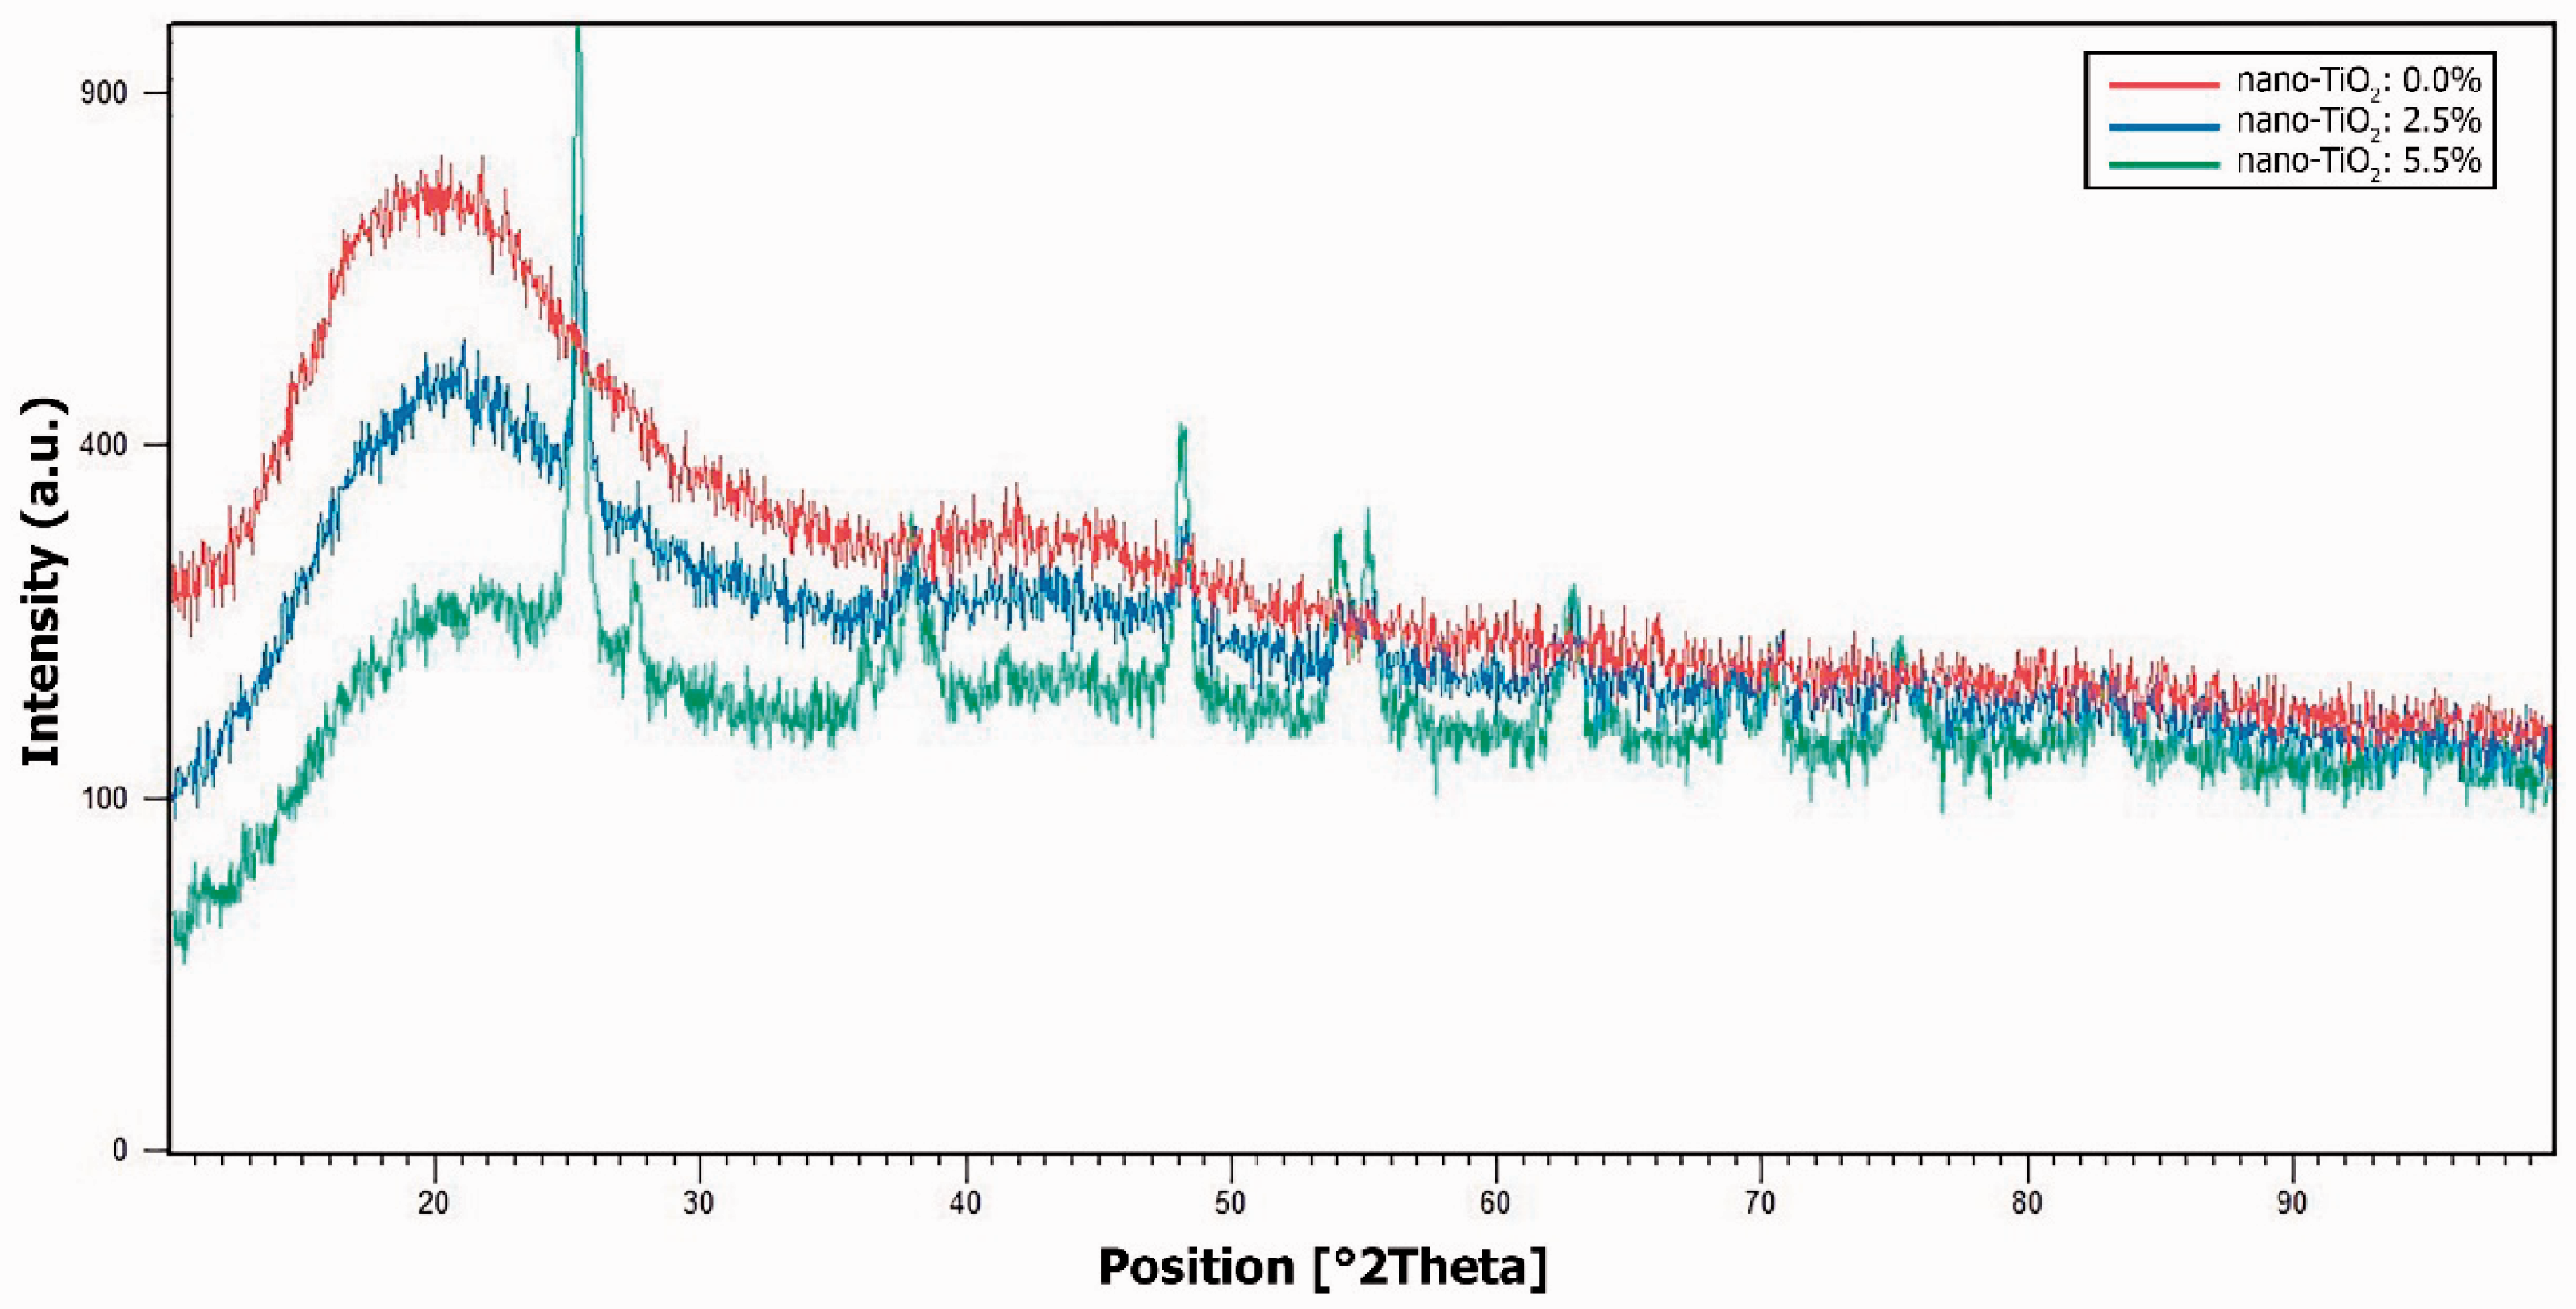
The dyeing rate of samples containing different concentrations of the nano-TiO2, before and after alkaline hydrolysis, was analyzed based on Giles suggestion [24] by measuring the dye exhaustion in 0, 20, 60, 90, 120, 180, and 300 min of the dyeing time. The concentration of the dye in solutions was measured by the spectrophotometer after mixing the dye solution with DMF in 1:1 ratio [25]. The dye exhaustion results are shown in Figure 7.
The percentage of exhaustion for varying concentration of the nano-TiO2 in PET nanofibers (a) before and (b) after alkaline hydrolysis.
According to Figure 7(a), which shows the effect of the presence of the nano-TiO2 on the dyeing rate of the nanofibers before the alkaline hydrolysis, the rate of dyeing was raised by the increase in the concentration of the nano-TiO2. Figure 7(b) illustrates the same trend for the samples treated with the alkali. However, the effect was intensified by the alkaline hydrolysis. For example, the dye exhaustion, after 20 min of dyeing for the hydrolyzed sample containing 1% nano-TiO2, was 32% which is slightly higher than that for the non-hydrolyzed sample containing 5.5% of the nano-TiO2 (30%) at the same dyeing time. A similar effect was observed for the same samples at the end of dyeing (300 min). In order to explain these observations, it should be considered that the presence of the nano-TiO2 may reduce the nanofibers diameter [20,21], thereby increasing the surface area of the nanofibers, increase the surface roughness [1] and therefore, the surface area of the nanofibers, and increase the amorphous/crystalline ratio of the nanofibers [23].
For the hydrolyzed samples, the effect of the presence of the nano-TiO2 was almost three-fold in comparison to the non-hydrolyzed one. This observation may be attributed to the preferential hydrolysis of the areas around the nano-TiO2 [18,19] and consequently, a rise in surface roughness, the reduction of the nanofibers diameter because of the etching of the polymer by the alkali.
It is also important to compare the rate of the dyeing of the hydrolyzed and non-hydrolyzed samples which had no nano-TiO2. Figure 7(a) and (b) demonstrates that the dye exhaustion for the hydrolyzed sample with no nano-TiO2 after 20 min was twice more than that for the corresponding non-hydrolyzed sample and the situation remained more or less the same up to the end of the dyeing. This observation could be addressed by the reduction in the nanofibers diameter and/or the increase in nanofibers hydrophilicity after the treatment.
It is noteworthy that intensifying the alkaline hydrolysis conditions may eventually reduce the surface roughness of the nanofibers and ultimately disintegrate the nanoweb.
In the present research, 300 min was considered as the dyeing equilibrium time. Figure 7(a) illustrates that for the non-hydrolyzed nanofibers, the dye exhaustion at the equilibrium time was increased by an increase in the concentration of the nano-TiO2. This increase could be justified by the higher amorphous/crystalline ratio of the samples with the higher nano-TiO2 content. It is important to note that, as Strain et al. [26] quoted from Wang et al. [27], a mesomorphic phase, an oriented amorphous phase, was formed inside the electrospun PET fibers. This phase could not be observed clearly in XRD diffractogram. It is also likely that a reduction in the orientation of such phase occurred due to the presence of the nano-TiO2 in the nanofibers.
Comparison between the dye exhaustion curves in Figure 7(a) and (b) reveals that the dye exhaustion at the equilibrium for the hydrolyzed samples was about 20% higher than that of the corresponding non-hydrolyzed samples. If the assumption that in 300 min, the system reaches the dyeing equilibrium is taken to be true, then the increase in the dye exhaustion at equilibrium is likely to be explained by the accessibility of more sites for the dyes to be absorbed due to the increase in the nanofibers hydrophilicity after alkaline hydrolyzation.
The differences between the dye exhaustion of the samples with no and 1% nano-TiO2 for both hydrolyzed and non-hydrolyzed samples at the equilibrium time were minor, showing that to ensure the full benefits of the effect of adding nano-TiO2, more than 1% of the nanoparticles should be used.
Conclusion
In the present research, PET nanofibers containing nano-TiO2 were produced by introducing the nanoparticles in the PET solution. Then, the nanofiber was exposed to an alkaline hydrolysis. The results of the FTIR for the non-hydrolyzed PET showed the nano-TiO2 had no chemical interaction with the PET. The higher hydrophilicity of the resulted nano-TiO2–nanofibers composites after alkaline hydrolysis was proved by water contact angle and 3M water repellency tests. The SEM images showed a decrease in the nanofibers diameter and an increase in the surface roughness. Also, the XRD diffractograms showed a rise in the proportion of the amorphous regions of the nanofibers. It was shown that the rate of dyeing and the dye absorption at dyeing equilibrium were increased by the presence of the nano-TiO2 and the effect was intensified by the alkaline hydrolysis of the samples due to the increase of the amorphous regions and/or hydrophilicity of the nanofibers. As the mutual effect of the presence of the nano-TiO2 in the PET nanofibers and the alkaline hydrolysis of the nanofibers significantly increased the dye absorption capacity of the nanofibers, the potential of the resultant nanofibers for application in filters for wastewater treatment could be considered for the future research work.
Footnotes
Declaration of Conflicting Interests
The author(s) declared no potential conflicts of interest with respect to the research, authorship, and/or publication of this article.
Funding
The author(s) received no financial support for the research, authorship, and/or publication of this article.