
Abstract
The properties of fibers were significantly affected by drawing during the spunbond process. In this paper, the influence of drawing pressure on the properties of spunbonded PET/PA6 hollow pie wedge bicomponent filaments was studied, and their performance was characterized by differential scanning calorimetry, X-ray diffraction, scanning electron microscopy, Beion F6 fiber fineness tester, and single fiber strength tester. The hollow pie wedge bicomponent fiber had a distinct interface between the two polymers due to poor compatibility. With increasing of drawing pressure, diameter of the fibers reduced regularly. When the drawing pressure increased, both the degree of crystallinity and orientation of bicomponent fibers enhanced, and the melting point of polyester component increased as well. Furthermore, with increasing of drawing pressure, the breaking strength of the fibers increased, but the breaking elongation and linear density decreased.
Introduction
Spunbond was a nonwoven manufacturing technology which involved the spinning of continuous filaments laid down a forming belt followed by mechanical, heat, or chemical bonding [1,2]. Spunbond process was highly efficient due to the one step polymer-to-nonwoven fabrication process. What’s more, the conducts with excellent properties were widely used in agriculture, packaging, medicine, filtration, and other fields. Bicomponent fibers had been applied in the production of spunbond nonwovens for decades in order to achieve the properties that could not be obtained by only using homocomponent fibers. Bicomponent spunbond technology, based on bicomponent filament technology, used two completely separate feeding and screw extrusion system [3]. Drawing process was an important step which significantly influenced the properties of fibers [4]. From drawing process, the fibers which obtained higher orientation and crystal structure resulted to excellent mechanical properties of fibers.
Bicomponent fibers with superior performance could be categorized into side-by-side, core/sheath, islands-in-the-sea (INS), and hollow pie wedge according to the arrangement of the two polymers in the cross section [5]. Side-by-side bicomponent fibers were developed at the earliest, and crimped fibers might be prepared, utilizing differential curing shrinkage of two polymers. Core/sheath type was usually used to produce the bicomponent fiber which could achieve both the properties of core and sheath components. INS bicomponent fibers consisted of dissolvable sacrificial sea polymer and islands polymer and could get superfine fibers after removing the sea polymer [3]. Hollow pie wedge bicomponent fibers could be split into superfine fibers via mechanical, heat, or chemical treatment [6–8]. The most famous commercial pie wedge superfine nonwovens was Frendenberg’s Evolon® which was made by 16-pie bicomponent fibers [9–11].
Previous reports on bicomponent materials were focused on the methods of fibrillation and the mechanical properties [12]. Hollowell et al. [13] used hollow pie wedge bicomponent to produce nonwoven fabrics with low porosity and tear strength by hydroentangling. Lu and Qian [14, 15] recently investigated the splitting method of bicomponent spunbond fiber and found the hydroentangling was the best. Yeom and Pourdeyhimi [16] studied the feasibility of INS spunbond webs for aerosol filtration. It turned out that the filtration efficiency of the webs followed typical behavior for fibrous filtration media in which the most penetration particle size was ranging from 0.2 to 0.3 µm. Fedorova and Pourdeyhimi [17] reported the use of INS fibers in a spunbond process and demonstrated the sea polymer in islands in the INS fibers could be fibrillated to release the islands to form sub-micron fibers. Zhao and Liu [18] prepared the spunbonded PET/PA6 hollow pie wedge bicomponent fiber and thought that the fineness and strength of the fibers were enormously influenced by the drawing parameters. Gong and Nikoukhesal [9] produced microfiber nonwoven fabrics from pie wedge bicomponent utilizing air-laying and hydro-entanglement and considered that the microfiber nonwoven fabrics had higher tensile strength, lower elongation, higher water absorbency than that of the homocomponent nonwoven. The properties of fibers were significantly affected by drawing during the production process. Zhang et al. [19] researched the influence of draw ratio on the morphology, orientation, and properties of polyimide fibers and found that the fibers diameter decreases and the degree of orientation increases with draw ratio. Liu et al. [20] investigated the effect of velocity of drawing air on the condensed structure of polyester (PET) fiber during spunbonding. The results showed that the velocity of drawing air do not influence the surface morphology of spunbonded PET fibers, and with the increasing of velocity of drawing air, the diameter of spunbonded PET fiber decreased gradually. The previous studies are focused on the effect of draw on properties of single component fibers. Meanwhile, the influence of drawing pressure on properties of bicomponent fibers also needs to investigate.
In this paper, the influence of drawing pressure on the thermal, orientation, morphological, diameter, and tensile properties of spunbonded bicomponent fibers was studied, which was benefit for the parameters optimization of producing PET/PA6 bicomponent spunbonded nonwovens.
Experimental
Materials and methods
Basic properties of the polymers.

In this study, PET/PA6 spunbonded bicomponent fibers were produced in Hualun spunbond system, and the process were given in Figure 1. After being dried, the PA6 and PET resin were fed into the hopper, melted, and moved in the extruder. The melts were filtered and then pushed into the spin pack by the pump, and they were extruded into filaments from the spinneret. The filaments were cooled by quench air and drawn by the high velocity air system. The drawing pressure ranged from 0.5 Bar to 3.5 Bar, and temperature and velocity of quench air were 20℃ and 0.8 m/s, respectively. The composite fibers were PET/PA6 (70/30), and its modal of surface and cross section were shown in Figure 2.
The production process of PET/PA6 bicomponent fibers. Illustration of hollow pie wedge biocomponent fiber.

Differential scanning calorimetry
The thermal and crystallization behaviors of the fibers were characterized by Perkin-Elmer DSC8000 differential scanning calorimetry (DSC). The fibers were heated from room temperature to 300℃, and the heating rate was 10℃/min under 20 ml/min N2 atmosphere.
Wide angle X-ray diffraction (WAXD)
X-ray diffraction (XRD) patterns were tested on a Thermo ARL X’TRA X-ray diffractometer using CuKα radiation with a wave length (λ) of 1.542 nm. The intensity was recorded from 10° to 50° for 2θ, and scanning rate was 3o/min. The method of the sample preparation for XRD was fiber diffraction.
Orientation testing
The orientation of fibers was tested on SCY-III sound velocimeter developed by Donghua University.
Scanning electron microscope
The morphologies of the fibers were obtained from JSM-5610LV scanning electron microscope. The fibers were previously sputter-coated with a gold layer to avoid charging. The acceleration voltage used in the test was 5 kV.
Diameter testing
The diameters of the fibers were examined on Beion F6 fiber fineness tester. Fiber diameters were tested as many as 100 times for each kind of fibers randomly, and then the average diameter and distribution were calculated.
Tensile testing
The tensile properties were conducted on a YG001B single fiber strength tester. Single fiber with a gauge length of 20 mm was drawn at a speed of 40 mm/min. The tenacity and elongation were obtained by calculating the average value of 20 trials for each sample.
Results and discussions
Thermal properties
Figure 3 showed the DSC first-heating scan of fibers with different drawing pressure. In each curve, there were two melting peaks where the peak at lower temperature (220℃) belonged to PA6 component and the other one (254–263℃) was PET component. There was cold crystallization in the fibers in the condition of 0.5 Bar, because of the imperfect crystal structure in the bicomponent fibers. When the drawing pressure was below 1.0 Bar, the crystalline structure of bicomponent fibers did not change dramatically. When drawing pressure was greater than 1.5 Bar, PA6 component melting peak had no significant change but the melting behavior of PET component appeared two consecutive melting peaks. In the curves of PET component, the lower temperature melting peak represented defective crystallites while the higher temperature melting peak corresponded to perfect crystallites. It was due to the fact that some folded-chain platelet of the PET component transferred into extended chain platelet. Therefore, the melting temperatures of PET shifted right with an increase of the drawing pressure.
DSC melting curves of fibers with different drawing pressure.

Thermal properties for bicomponent fibers with different drawing pressure.

Crystalline orientation
Figure 4 shows the WAXD patterns for bicomponent fibers with different pressure. In XRD patterns, each diffraction angle (2θ) represented a crystalline phase. The principal diffraction peaks 2θ of PET were near 18.4° (010) and 26.4° (100), while diffraction peaks 2θ of PA6 were about 21.9o (200) [21]. The shape of diffraction peaks depended on the grain size. When the grain size was small, diffraction peaks diffused [22]. When the drawing pressure was less than 1.5 Bar, the diffraction peak of PET component was not obvious. The diffraction peak intensity of PET increased with an addition of the drawing pressure, while the drawing pressure was greater than 1.5 Bar. When the drawing pressure at a low value, it was quite difficult for the molecular chains in the amorphous region moved along the fiber axial. With increasing of the drawing pressure, drawing force was sufficient to make molecular chains in the amorphous region move along the fiber axis orderly, and therefore diffraction peak intensity of the bicomponent fibers increased. The diffraction peak intensity of the PA6 components increased slowly with an addition of the drawing pressure, which was due to its relatively stable crystalline properties.
WAXD patterns for fibers with different drawing pressure.
Generally, the orientation function ƒa was given by following equation (2)
The orientation function of fibers with different drawing pressure.

Morphological analysis
The hollow pie wedge bicomponent fibers were made of PET/PA6 (70/30), the cross-section and surface of fiber were shown in Figure 6. It could be seen that the arrangement and distribution of PET/PA6 in cross section were similar to an orange petal, and the fiber was straight with several ridge line on the surface paralleled to the fiber axis. There were 16 pie wedges in the component fiber cross section with alternating 8 pie wedge PET and 8 pie wedge PA6. It could be found there was sharp interface between the two polymers, which implied these two components were incompatible. Moreover, these pie wedges could be easily split into superfine fibers with fan-shaped cross section by mechanical, chemical, or heat treatment.
Cross-section (a); and surface (b); SEM images of PET/PA6 hollow pie wedge bicomponent fiber with 0.5 Bar. SEM: scanning electron microscopy.
Surface morphology of component fibers with different drawing pressure was presented in Figure 7. It could be seen that the spunbonded precursor fibers were separated from each other after being drawn. There was no obvious change on the surface of bicomponent fibers with different drawing force. Fibers with 0.5 Bar drawing pressure were not homogeneous. When the pressure was larger than 1.5 Bar, the fineness of fibers became more well-distributed.
Surface morphology of component fibers with different drawing pressure: (1) 0.5 Bar, (2) 1.5 Bar, (3) 2.5 Bar, (4) 3.5 Bar.
Diameter
Figure 8 highlighted the relationships between drawing pressure and average diameter of fibers. Generally, with increasing of the drawing pressure, the average diameter of the fibers decreased. The average diameter of fiber was 23.68 µm with drawing pressure as 0.5 Bar, while it reduced sharply to 22.11 µm when the drawing pressure increased to 1.0 Bar. Bicomponent fibers with 3.5 Bar possessed the smallest diameter and the narrowest distribution. It was also observed that the distribution of fiber diameter with 0.5 Bar was wider than other fibers. It was thought that during the drawing process, the fibers caused by drawing pressure were relatively uneven and unstable.
Average diameter of component fibers with different drawing pressure.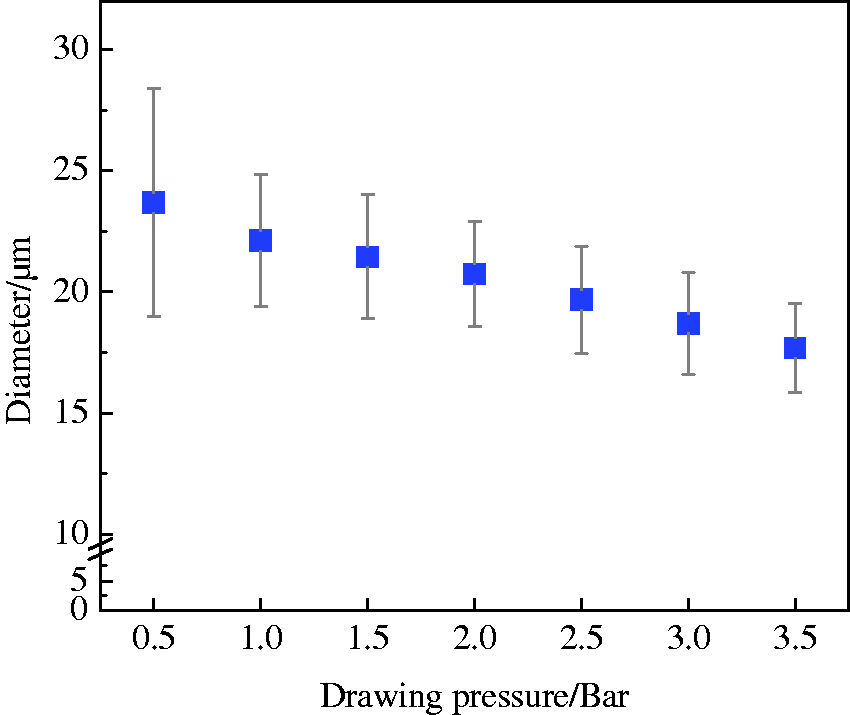
Tensile properties
One of the important results of this study was to evaluate the tensile properties of bicomponent fibers. Thus, the fineness, breaking strength, and elongation of bicomponent fibers were investigated, as shown in Figure 9. It was clear that bicomponent fibers became finer ranging from 6.71 dtex to 2.03 dtex, with increasing of the drawing pressure. The orientation was a crucial factor in predicting fiber strength and elongation. As expected, when the drawing pressure raised, the breaking strength increased, but the breaking elongation reduced. Fibers with 3.5 Bar possessed the highest breaking strength (4.72 cN/dtex) and the lowest breaking elongation (58.48%). This was because increase of drawing pressure not only made the chains of fibers arrange more neatly but also made the chains arrange along the fiber axis. Theoretically, increase of orientation for the same fibers, which was due to an increase in the degree of molecular chains extension, would increase breaking strength and reduce breaking elongation. Above theoretical analysis was in accordance with the experimental results.
Mechanical properties for fibers with different drawing pressure.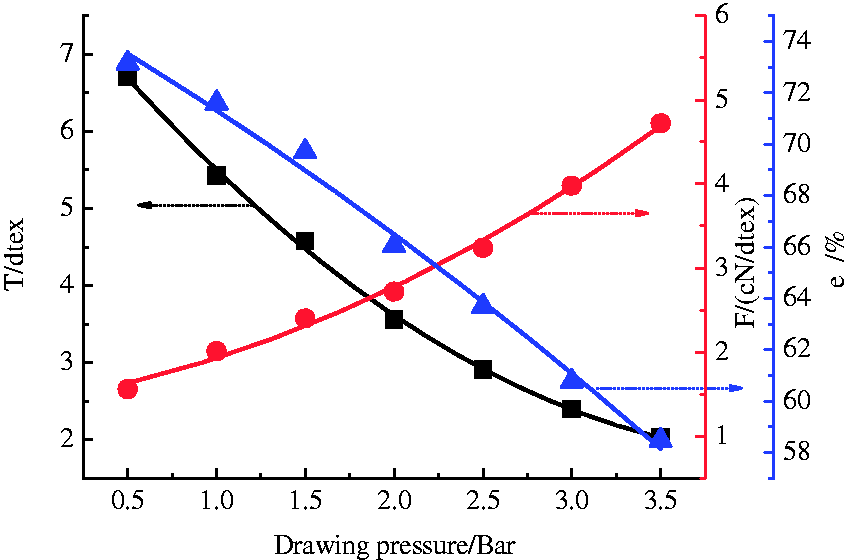
Conclusion
In this work, thermal, orientation, morphological, diameter, and tensile properties of spunbonded hollow bicomponent fibers were investigated. According to the hollow bicomponent fibers morphology, it was easy to found that a sharp interface presented between the two polymers. It might imply that PET and PA6 were incompatible. With increasing of the drawing pressure, the fiber diameters decreased. When drawing pressures were greater than 1.5Bar, there were two melting peaks in the DSC melting curves of PET component, fold-chain and extended-chain coexisting. Overall, with increasing of drawing pressure, both crystallinity and orientation degrees of composite fiber increased gradually. During the spunbond process, with increasing of drawing pressure, the breaking strength of the hollow bicomponent fibers increased, while their linear density and breaking elongation declined.
Footnotes
Declaration of Conflicting Interests
The author(s) declared no potential conflicts of interest with respect to the research, authorship, and/or publication of this article.
Funding
The author(s) disclosed receipt of the following financial support for the research, authorship, and/or publication of this article: This research work was supported by the Program of International S&T Cooperation (2014DFG52520), Zhejiang Province Key Science & Technology Innovation Team Subproject (2011R50003-04) and 521 Talent project of ZSTU.