
Abstract
This paper presents a new region-based image fusion algorithm and its applications for measuring essential parameters of nonwoven structures. The algorithm combines a series of partially focused images of the same sample view captured at different focusing points to form a fully focused image that is fundamental for accurate detections of fiber edges in the structure. It starts with selecting a number of source points based on the maximum gradient matrix, and locating initial fiber boundaries using the pixel-based image fusion algorithm. Within the fiber boundaries, the source points diffuse in the same rate, and the boundaries are formed when their expanding fronts encounter each other. These new boundaries divide the image view into regions of various sizes, each representing a coherent area centered at one source point. Finally, each region is filled with the corresponding region that has the highest average sharpness value among all of the multi-focus images. The paper also presents the experimental results on the fiber diameter, fiber orientation and pore size distributions of nonwovens generated by using this algorithm, in comparison with the results from other methods.
Introduction
The performance of a fibrous material is greatly influenced by fiber fineness, porosity and defects of the structure. Various image analysis algorithms have been widely used for fiber detection and structural analysis of fibrous materials, including skeleton analysis [1,2], Fourier transform [3,4], flow field analysis [5], and pattern recognition [6]. However, the effectiveness of these algorithms for the structural measurement of nonwoven materials heavily relies on the quality of image [7]. The clarity of the fibrous material image directly affects fiber edges, orientations and dimensions. In a microscopic imaging of a nonwoven sample, it is often difficult to focus the fiber web across the full entire view regardless of the focus position. This predicament is called the multi-focal plane phenomenon, in which only partial targets are focusable in one image frame. This phenomenon is very common in imaging nonwoven structures, because the thickness of a nonwoven is normally larger than the depth of field of the light microscope. Figure 1 shows a microscopic image of a spun-laced nonwoven that demonstrates the severity of defocused fibers. In the image, while a few surface fibers are in-focus, the majority of fibers appear fuzzy and distorted. Fiber geometrical measurements based on this kind of images would be inaccurate or even misleading.
Microscopic image of a nonwoven (800 × 600 pixels, 0.93 µm/pixel).
Image fusion techniques have been applied to reconstruct a completely clear and sharp image from a set of images of the same area captured at various focal planes of a camera. These sequential images are called multi-focus images comprising complementary information that can be merged seamlessly into one image more suitable for the subsequent processing. The number of multi-focus images needed for a specific project varies with the accuracy requirement and time limit of the project. Up to now, the single-pixel based [8] and the region based algorithms [9], the pyramid transform [10], and the wavelet transform [11] are the commonly used methods for solving the multi-focal problem. However, each of these algorithms has a certain limitation in real applications. For instance, the single-pixel-based algorithm ignores the connection of pixels and brings in artifacts into the fused image [12], and the pyramid transform is only applicable to fusion of two images [13]. For a nonwoven microscopic analysis system, the wavelet transform seems inefficient in processing of the multi-focus images required to be real-time in many cases [14]. In a previous study [14], we developed a region-based image fusion algorithm based on the fact that multi-focus images contain compensatory focused regions that can be selected to create a merged image, and demonstrated the region-based image fusion algorithm is an efficient way to combine a set of partially focused images into a fully focused image. But this method may occasionally omit some portions of objects because of inappropriate region divisions made by the algorithm.
The current research is the continuous development of this region-based image fusion algorithm with a region-dividing method by using object boundaries to limit the expansions of the source points. The new algorithm starts with the determination of the sharpest gradient matrix (SM) using the pixel-based image fusion algorithm [12], and then selects the peak points in the SM as the source points. Within the fibers boundaries, the source points diffuse to form the boundaries when their expanding fronts encounter each other, dividing the image view into different regions. Finally, each region was filled with the corresponding region selected from the multi-focus images. The major steps of the new algorithm are illustrated in Figure 2, and are implemented with a microscopic imaging system that transforms a set of multi-focus nonwoven images into one sharp image to record the web structure for accurate measurements of structural parameters, such as pore size, fiber diameters, and orientations.
Flow chart of the image fusion algorithm.
Image acquisition
An optical microscope image acquisition system with automatic focusing functions was used in this project for capturing consecutive images of a nonwoven on different focal planes. As illustrated in Figure 3, the system had three step motors on the x–y–z axes to control the movements of the microscope stage. The sample image could be focused at different depth levels when shifted vertically by the z-axis. The sample slide was translated in the x–y axes to multiple locations, and at each x–y location the camera captured a sequence of images of the same view by stepping the z-axis from a farther focusing position to a near one. Each sequence of images was processed in real time before the stage stepped to the next x–y location. The shifting intervals of the x–y–z axes were set to 1.2 mm, 1 mm, and 5 μm in the project, respectively. According to the thickness of a tested sample, the number of images to be captured at one location could be adjusted within the range of (20, 100). Each image has 800 × 600 pixels with a resolution of 0.93 µm/pixel under the 10 × objective lens, and is saved as the 24-bit color BMP. The tri-axial movements and the image capturing were synchronized by the computer through a RS-232 serial port and a USB port. Figure 3 also includes a few of multi-focus images of a nonwoven, which show different fibers focused in respective image layers.
Image acquisition system.
Image fusion
Image fusion is a process to merge the multi-focus images of the same area into a new image in which all the objects are well focused. The proposed region-based image fusion algorithm consists of two important steps, region division and region selection. The first step is to generate a map that can individually divide all the multi-focus images into a number of regions, and the second step is to find the sharpest layer from the multi-focus images for each region to construct the fused image. As fiber arrangements are diverse in different nonwovens, the image cannot be simply divided into certain size-fixed blocks.
Calculation of pixel sharpness
Let

Fusion of sharpest pixels
Once the sharpness values of a pixels at (x, y) in all the multi-focus image layers are calculated, the layer in which the pixel that has the maximal sharpness value can be selected to construct the sharpest layer matrix M(x, y)
Processing a nonwoven image (800 × 600 pixels, 0.93 µm/pixel): (a) pixel fused image; (b) Otsu segmentation; (c) denoising; (d) boundary extraction; and (e)–(h) are the zoom-in views of the red boxes (145 × 90 pixels) on the left sides.


Extraction of fiber boundaries
Based on the PFI, fiber boundaries can be extracted in the following steps. Firstly, apply the Otsu segmentation method [11] to convert the PFI in Figure 4(a) into a binary image (Figure 4(b)). Secondly, remove small black and white spots by using morphological opening and closing [11] (Figure 4(c)). Finally, take out the boundaries via morphological erosion and subtraction operations [4] (Figure 4(d)). Figure 4(e) to (h) are the zoom-in views of the red boxes in the images on their left sides.
Diffusion of selected source points
In the PFI, local maxima, such as edge points, can be regarded as starting points or source points where a region with coherent sharpness can be originated. This source diffusion idea is instilled from some physical phenomena, such as dissolution of solute, heat transfer, and spread of vibration, in which particles or energies distend radially to the surrounding with decreasing intensities. Each source point will grow into a region limited by the regions of adjacent sources points and near fiber boundaries. Our goal is to determine impermeable coupled boundaries among these diffusing sources once they encounter each other. To find the local maxima in the PFI, a small window, e.g. 7 × 7 pixels, is shifted across the image, the pixel whose sharpness value is the maximal in the window and surpasses the mean sharpness of the PFI is identified (Figure 5(a)). The number of selected source points determines the number of regions that split the PFI. Figure 5(b) is a close-up image of the selected window from Figure 5(a).
Source points in an image (800 × 600 pixels, 0.93 µm/pixel) (a) and a close-up view of a window (145 × 110 pixels) (b) in (a).
The selected source points represent local maxima of image sharpness, and have a declining tendency when expanded to their surroundings. The spreading process is based on the homogeneous diffusion model presented in the previous paper [14], in which the diffusion rates of sharpness from a source point was constant and the same as other source points. But in current project, three changes were made to make the diffusion algorithm more robust. The first change was to increase the diffusion directions by adding the two diagonal directions the previous two orthogonal directions (4-connectivity). The diffusion in the 8-connectivity can make the division lines smoother than in the 4-connectivity (Figure 6). The second change was to make the constant diffusion rates be linked to the sharpness values of the source points. Thus, the source points with higher sharpness values would spread more quickly than others. The third change was to increase the stop criteria by introducing fiber boundaries as diffusion limits. As diffusion proceeds, the diffusion fronts move away from the source points and eventually run into other fronts or fiber boundaries. Once such a contact of two fronts occurs at one point, the spreading ceases at that location. When the diffusions of all the source points stop, the separation lines are established, dividing the image into the same number of miniature regions as the number of the source points. Figure 7 shows the division lines of the PFI in Figure 4(d) generated by this algorithm, in which the fiber boundaries are marked in black and the sub-regions in other colors. Each region represents an area that has the highest coherence in sharpness.
Diffusion directions in the 8-connectivity. Region divisions of the image in Figure 4(d) (800 × 600 pixels, 0.93 µm/pixel).

Fusion of sharpest regions
This step is to fill each region with the highest sharpness values selected from the corresponding regions in the all multi-focus images. To determine from which image layer the pixels are chosen to fill a region, the average sharpness (gradient magnitude) of the corresponding regions in the multi-focus images are calculated, and the region of the layer which has the highest average sharpness is used to replace the region in the PFI. Once all the regions in the PFI are updated in this approach, a new image is formed by fusing sub regions together.
Figure 8(a) shows the final result with this region-based image fusion algorithm and Figure 8(b) shows the result with the algorithm presented in Wang et al. [14]. Figure 8(c) and (d) are the close-up views of the divided regions in a small window by the two different algorithms, demonstrating the previous algorithm allowed the diffusion to cross the fiber boundaries and yielded unrealistic divisions. The divisions by the new algorithm do not disrupt the fiber boundaries. Figure 8(e) and (f) are the fused image in the window by the two different algorithms. The fiber in Figure 8(e) appears sharp and in good continuity, while the one in Figure 8(f) does not have enough integrity.
The fused images (800 × 600 pixels, 0.93 µm/pixel) by the current algorithm (a), by the algorithm in Wang et al. [14] (b), the divided regions of the selected window with 100 × 65 pixels by the current algorithm (c) and by the algorithm in Wang et al. [14] (d), and the close-up views of the selected window with 100 × 65 pixels by the current algorithm (e) and by the algorithm in Wang et al. [14] (f).
Figure 9 shows the fused images of five samples processed by using four different algorithms. The samples are a polyester thermal bonding nonwoven (PET thermal), wool fibers, a PET yarn, PET staple fibers, and a spun-laced nonwoven. The four used image fusion algorithms are I—the algorithm proposed in this paper, II—the pixel-based algorithm [12], III—the point-based algorithm [8], and IV—the region-based algorithm with 4 × 4 blocks [9]. Each image also includes a zoom-in window for the close-up view of the fused image. Visually, algorithm I yields the smoothest and cleanest fiber boundaries among the four algorithms.
Fused images of five samples by means of four different algorithms.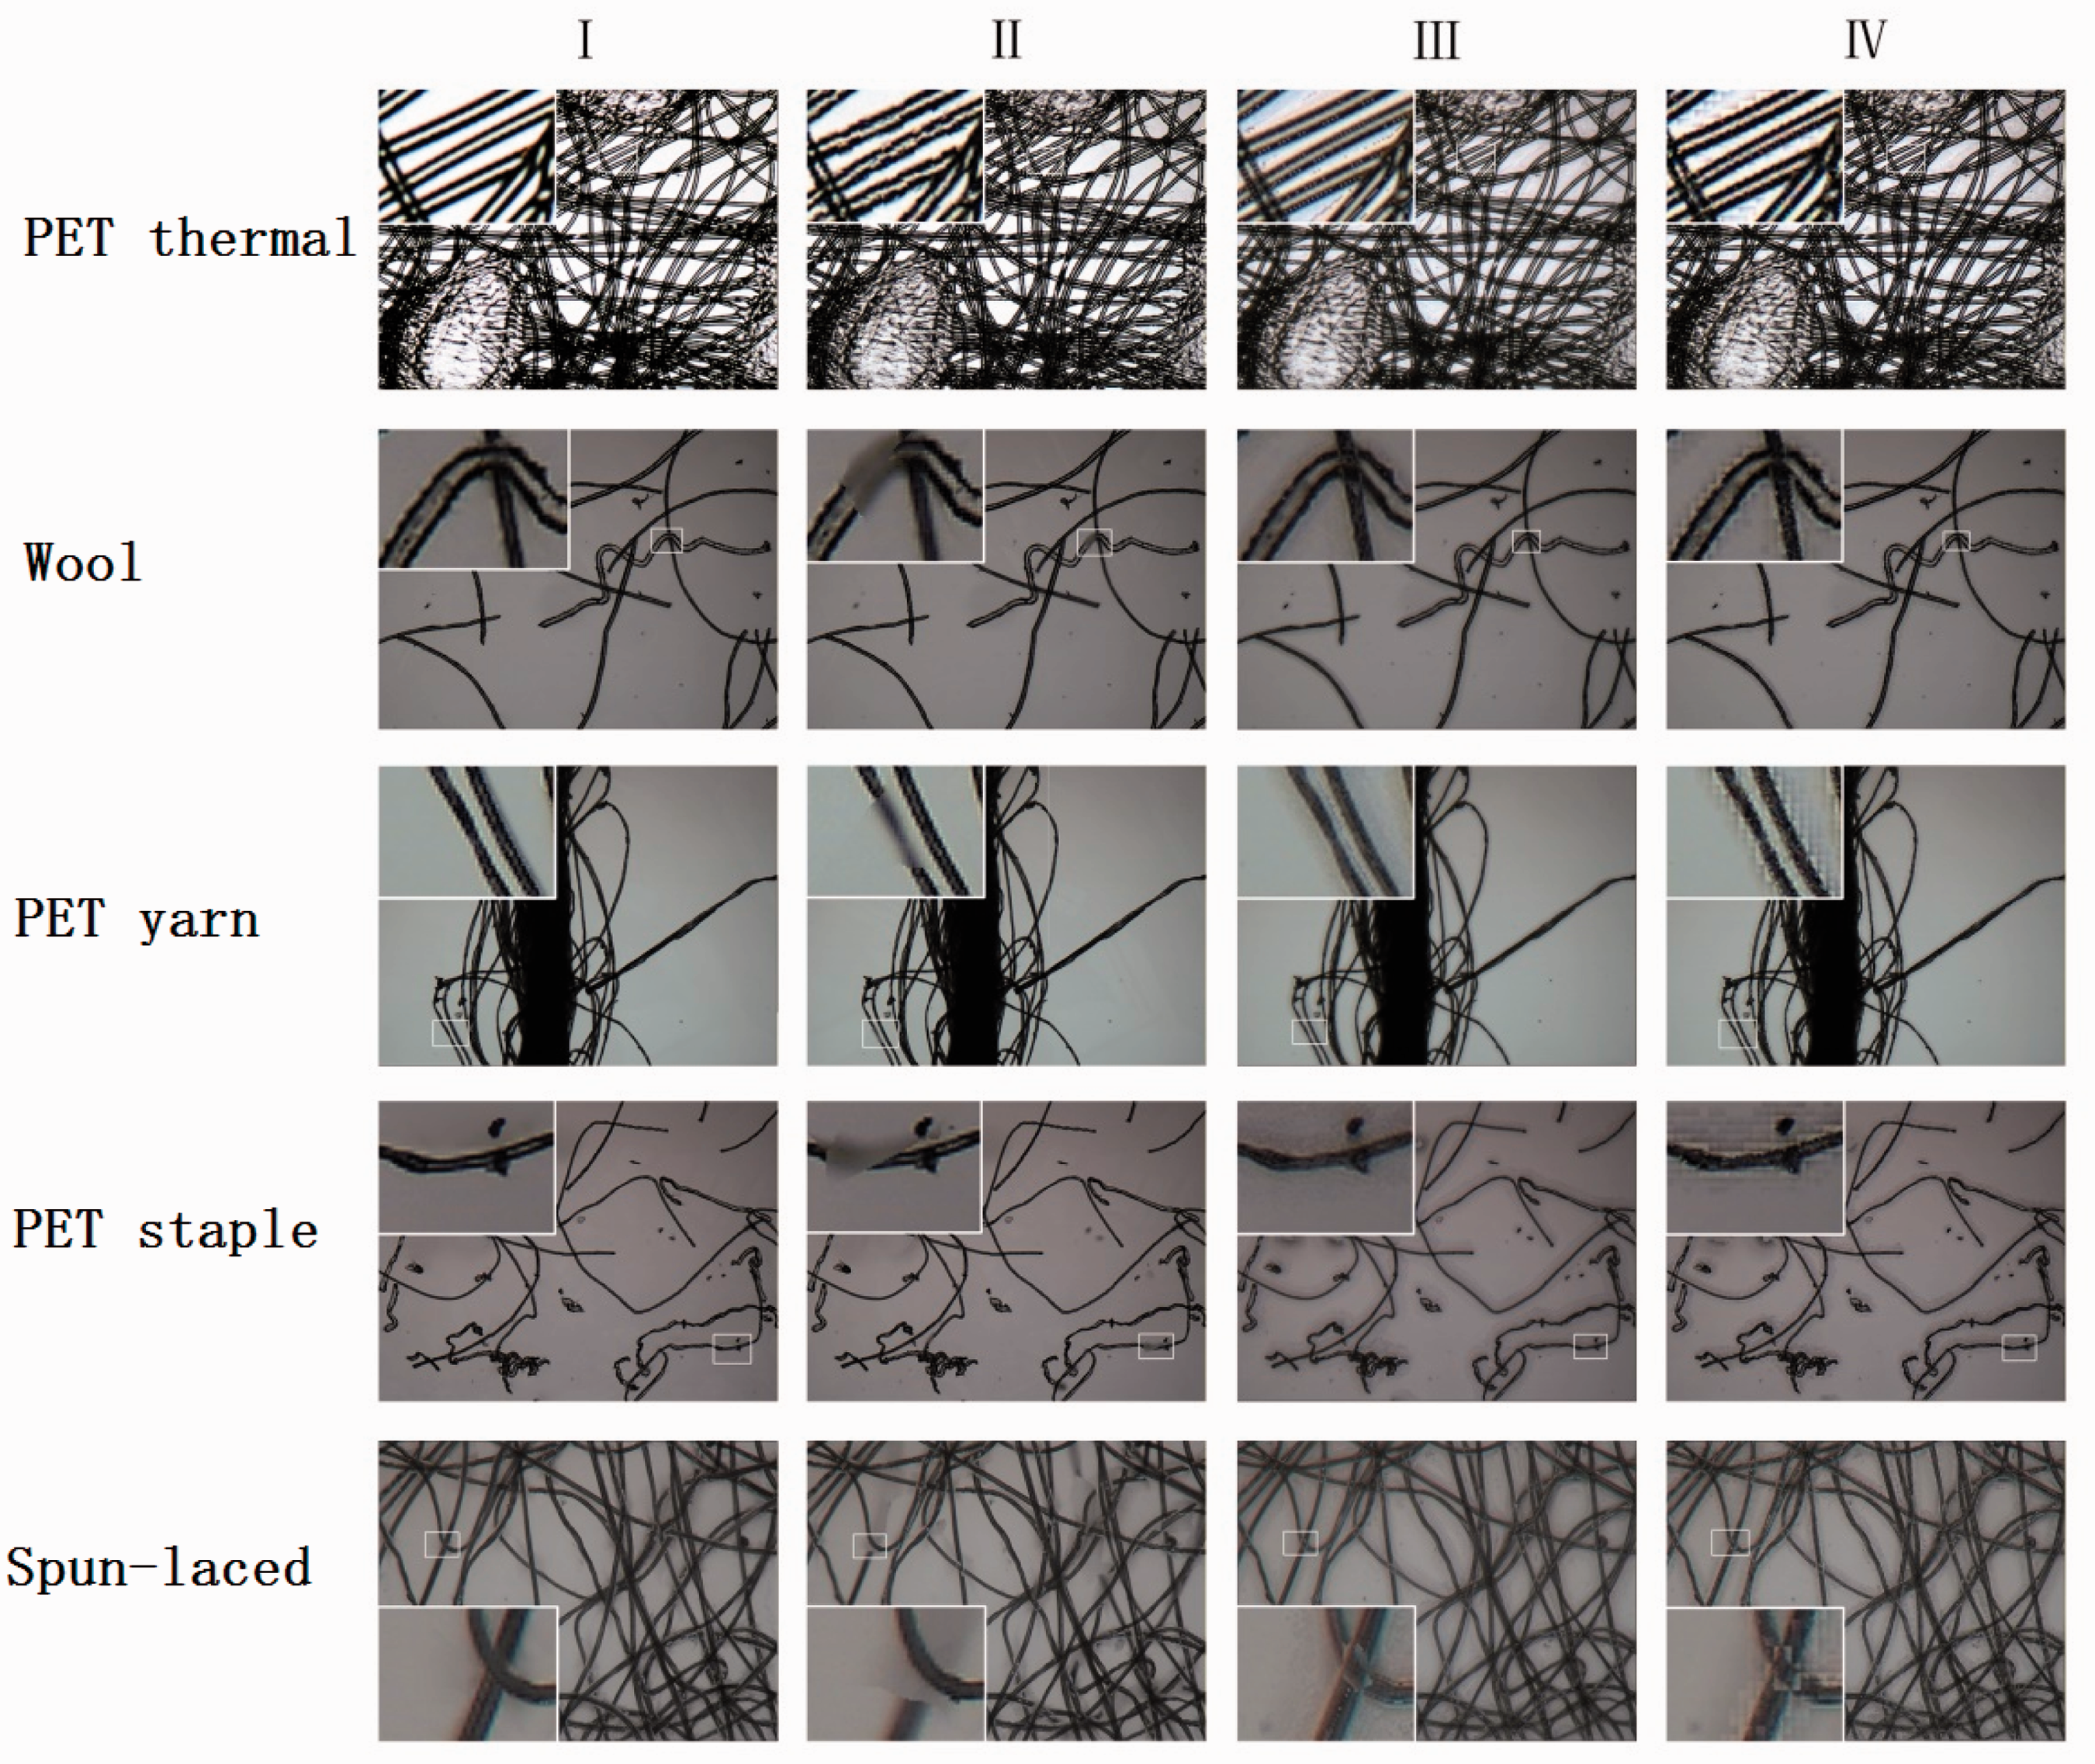
Experiments
Fiber diameter, fiber orientation and pore size are the important structure parameters of nonwovens, and they can be measured based on the fusion image analysis (FIA) discussed above. Two nonwoven samples, a viscose spun-laced nonwoven and a PET thermal bonding nonwoven, were used in the experiments to compare the results from the FIA with those from the single image analysis (SIA) and the scanning electron microscopic (SEM) image analysis (the SEM magnification was 800×). Five locations were randomly selected on each sample to capture sample images, and at each location 100 multi-focus images were grabbed for the FIA. One of the multi-focus images was chosen for the SIA. Since the SEM images are considered to have the best resolution and sharpness, the results from the SEM images can be used as the benchmarks for the FIA and the SIA. Figure 10 displays example images of these two nonwovens. In the PET thermal bonding image, there are scattering thermal bonding spots that strengthen the fiber web.
Single focus images, fused images, and SEM images of two nonwoven samples.
Fiber diameter distribution
The fiber diameter distribution of a nonwoven reveals the variability of fiber diameters in the structure, which has an impact on the uniformity of the structure. The grayscale image of a nonwoven is firstly converted into a binary image in which fibers are in black pixels, and the central lines of fibers are then extracted using a skeletonizing algorithm [7,15]. The fiber diameter (or ribbon width) at a point on the central line is measured by scanning the fiber from edge-to-edge in a direction perpendicular to the central line. Figure 11 displays the fiber diameter distributions of the two samples measured by the SIA, FIA, and SEM. It is clear that the FIA generates the fiber diameter distributions far more consistent with the SEM than the SIA does. For the both samples, the distributions of the SIA have apparent leftward shifts, meaning it underestimates fiber diameters due to inaccurate fiber edges. This difference is also evidenced by the mean fiber diameters and the coefficients of variation (CV) of the two samples presented in Table 1. The SIA yields higher CVs of the fiber diameters than the FIA.
Fiber diameter distributions of the viscose spun-laced (a) and PET thermal bonding (b) samples. Fiber diameters measured by different methods. SEM: scanning electron microscopy; FIA: fusion image analysis; SIA: single image analysis.

Fiber orientation distribution
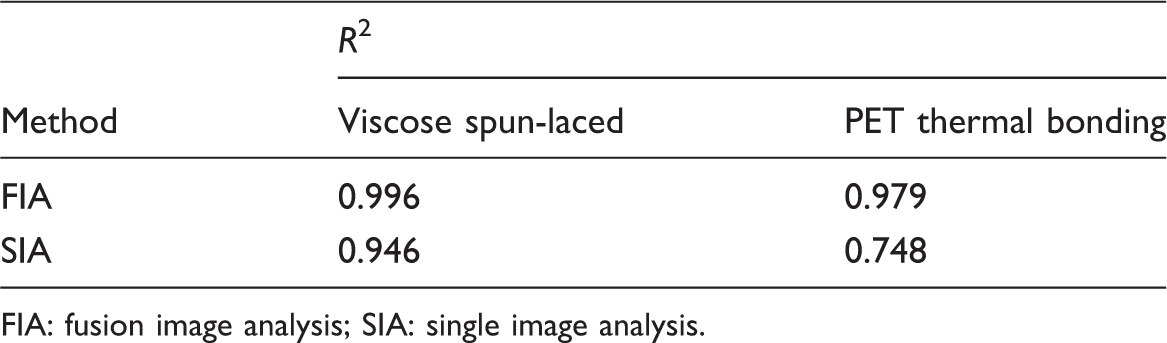
The fiber orientation distribution of a nonwoven affects the mechanical anisotropy of the structure. The orientation of a fiber refers to the angle, θ, between on the fiber edges and the horizontal direction of the nonwoven sample. The edges of fiber segments are located through Canny edge detection and then thinned to one-pixel-wide borderlines via the thinning algorithm [14]. The angles of all the pixels on the edge lines are calculated and then assigned into corresponding frequency counters [14]. Based on the counted frequencies, the fiber orientation distributions of the nonwovens can be generated. Figure 12 shows the fiber orientation distributions of the two samples measured by the SIA, FIA, and SEM. Again, the FIA produces more consistent fiber orientation distributions with the SEM (R2 = 0.996 for the viscose spun-laced and 0.979 for the PET thermal bonding, respectively) than the SIA does (R2 = 0.946 for the viscose spun-laced and 0.748 for the PET thermal bonding), as shown in Table 2.
Fiber orientation distributions of the viscose spun-laced (a) and PET thermal bonding (b) samples. FIA and SIA correlations in fiber orientations with SEM. FIA: fusion image analysis; SIA: single image analysis.
Pore size distribution
The pore size distribution of a nonwoven is another important structural characteristic that dictates the filterability, permeability and coverage of the material. A pore size refers to the region encircled by three or more fiber boundaries. Since the SEM image measures the reflectance of the fabric surface, it does not show high contrasts in open areas as an image with transmitting light (see Figure 10). On the other hand, the image in the SIA does not have realistic pore sizes because many fibers are out of focus. Thus, the pore size distributions cannot be accurately measured by the SEM and the SIA. In the pore size test, we chose another commonly used method, the capillary flow analysis (CFA) [16], for comparison with the FIA measurements.
In the FIA, pores are the white regions separated by fibers. The computer searches each region and calculates the equivalent diameter, i.e. the diameter of a circle that has the same area as the region. Figure 13 shows that the pore size distributions in the two samples measured by the FIA and the CFA, which have very consistent trends (R2 = 0.986 for the viscose spun-laced and 0.992 for the PET thermal bonding, respectively). The average pore sizes of the two samples are provided in Table 3. The differences in the mean pore size between these two methods are under 7% for both samples.
Pore size distributions of the viscose spun-laced (a) and the PET thermal bonding (b) samples. Mean pore size (equivalent diameter). CFA: capillary flow analysis; FIA: fusion image analysis.

It needs to be noted that although the multi-focus image fusion technique presented above tremendously increases the accuracy of measuring structural parameters of nonwoven, it requires the a z-shifting device which a regular microscopic system is not equipped with, and it increases computation time proportional to the number of the multifocal images used.
Conclusions
A new region-based image fusion algorithm and its application to enhancing nonwoven images and measuring structural parameters are presented in the paper. In this algorithm, a number of source points are selected from the sharpest gradient matrix, and the initial fiber boundaries are located by using the pixel-based image fusion algorithm. The source points are then diffused to form separate regions dividing the image view, but these diffusions are limited by the fiber boundaries so that the region division does not cross over any fiber. Each region is finally filled with the pixels of the corresponding region that has the highest average sharpness value among all of the multi-focus images. Compared to the previous image fusion algorithms, this algorithm can yield the smoothest and cleanest fiber boundaries from the same number of multi-focus images. Fiber diameter, fiber orientation and pore size distributions are the key structural information of nonwovens. The measurement accuracies of these parameters directly rely on the clearness of fiber edges. The fiber diameter, fiber orientation, and pore size distributions measured from the fused images generated by the current algorithm exhibit high consistency with those from the SEM images and the capillary flow analysis.
Footnotes
Declaration of Conflicting Interests
The author(s) declared no potential conflicts of interest with respect to the research, authorship, and/or publication of this article.
Funding
The author(s) disclosed receipt of the following financial support for the research, authorship, and/or publication of this article: This research was supported by the Natural Science Foundation of China (Grant No. 61172119), the Fundamental Research Funds for the Central Universities of China, the Foundation for the Author of National Excellent Doctoral Dissertation of PR China (Grant No. 201168), and the Program for New Century Excellent Talents in University (Grant No. NCET-12-0825).