
Abstract
The Taguchi method was adopted to optimize the fabrication condition of solid state polymerized polyamide (SSP PA66) nanofibers with respect to minimizing nanofiber diameter. A novel fabrication system called air-sealed centrifuge electrospinning was used for preparing high-quality nanofibers. In this study, solution concentration, rotational speed, syringe content, and applied voltage were selected as key parameters affecting the diameter of the fabricated nanofibers. The morphology of the electrospun nanofibers was analyzed by using the field-emission scanning electron microscope. Nanofiber diameters ranging from 20 to 250 nm were successfully controlled by the Taguchi method, and the statistical data based on experimental results indicated that the syringe content and rotational speed had greater influences (35.76% and 23.93%, respectively) on nanofiber diameter than did solution concentration and voltage (21.36% and 11.49%, respectively). Lower syringe content as well as higher rotational speed decreased the nanofiber diameter. The minimum concentration and applied voltage decreased the diameter of SSP PA66 nanofibers. Additionally, altering rotational speed and syringe content had no influence on crystalline behavior of nanofibers.
Keywords
Introduction
Polymer nanofibers have recently attracted an increasing interest due to their outstanding features such as large surface area-to-volume ratio, superior mechanical performance, and high porosity. Nanofibers could be effectively employed in various fields such as tissue engineering scaffolds, drug delivery, wound dressing, filtration, and nano-sensors. Therefore, the fabrication of nanofibers has received more attention recently. Among the various methods used so far for producing nanofibers, like drawing, template synthesis, and self-assembly, electrospinning is an effective and versatile technique used to prepare polymer fibers with diameters varying from several ten nanometers to a few micrometers [1–3]. A typical electrospinning relies on electrostatic forces to stretch the liquid jet into the nanofiber membrane.
Although electrospinning is simple and straightforward, the mechanism for the formation of fibers involves a series of complex electro-fluid-mechanical stages that are governed by many factors and these influence fiber diameter and morphology. Thus the controlled production of finer polymer nanofibers with uniform diameter and structure still remains a challenge. Electrospun nanofibers usually have a wide diameter distribution, whereas the fiber diameter has a significant effect on the performance of nanofiber mats in many important applications. For example, wide range of applications such as filtration [4,5], artificial cornea [6], carbon nanofibers [7], and tissue engineering [8,9] require a more uniform and smaller nanofiber diameter. One method for obtaining finer nanofiber is to reduce the concentration of the polymer solution [10,11]. However, it needs to exceed a critical concentration to achieve high enough chain entanglements for producing uniform nanofibers [12]. Furthermore, increasing the surface tension and flow rate tends to increase fiber diameter, but nanofiber diameter is decreased with increasing the electric field strength [3]. The diameter and morphology of the electrospun fibers is critically dominated by solvent–polymer interactions. Also, it has been shown that with increasing dielectric constant, the applied voltage required to achieve stable jet increased, the frequency of bead-on-string morphology decreased, and fiber fineness increased [13]. It has been found that increasing the electrical conductivity of the polymer solution significantly decreases the electrospun nanofiber diameter; whereas with low conductivity of the solution, there is insufficient elongation of a jet by electrical force applied to produce uniform fiber, and beads may also be observed [14]. The usage of additives such as salts [14,15], polyelectrolytes [16], ionic surfactants [17], or some other additives allows the properties of polymer solution, mainly the conductivity to be changed [18]. It has been demonstrated that bead-free fibers with relatively smaller diameters are produced by addition of ionic salts [14]. Also, electrospun nanofiber diameter can be affected by the control of the process parameters such as applied voltage [15] and temperature [19]. Increasing the electrospinning voltage increases the diameter of the nanofibers [15]. Although all these approaches can influence nanofiber diameter, there are some restrictions due to the addition of undesirable components, insufficient and difficult controllability, and strict thinning effect. Therefore, it seems necessary to supply a way which can fabricate nanofibers with high uniformity and fineness without any additional procedures.
In recent years, attempt has been made to produce nanofibers with the development of electro-mechanical system. Some researchers have combined centrifugal forces from a rotating disk with electrostatic forces to fabricate nanoscale fibers [20,21].
Some researchers showed that applying the centrifugal force may result in a significant enhancement in production efficiency of nanofibers [22,23]. Forcespinning™ has been developed to produce nanofibers using centrifugal force rather than electrostatic force, as in the electrospinning process [23]. Also, a needleless electrospinning setup has been reported to fabricate nanofibers using an electroferous rotating cone as the spinneret [24]. Other nanofiber fabrication technique based on centrifuge spinning is electro-centrifuge spinning (ECS). ECS had been limited by a stream of rotating air surrounding the nozzle. Exposing the ejected liquid jet to the high velocity airflow causes the jet to lose its solvent rapidly and as a consequence, the extension of the jet becomes more difficult, resulting in thicker nanofibers [20]. Air-sealed-centrifuge-electrospinning system (ASCES) is a facile method which has solved that problem with isolating the electro-centrifuge spinning from surrounded air and using a rotating collector [25]. Nanofibers produced by this method have good uniformity and high fineness. This system which was recently reported (in our previous work) has been used to manipulate nanofiber diameter by controlling the rotating speed of the spinning head [25]. However, the question arises as to what is the effect of other controllable parameters (such as concentration, feed rate, etc.) on nanofiber diameter.
Because there are many parameters affecting on nanofiber diameter, analyzing all of them would be labor-intensive and time-consuming work. Therefore, a powerful design method that can optimize the parameters and conditions with enhanced performance is necessary [26].
The Taguchi method is a methodical and efficient approach to design factorial experiments [26]. The basic principle of this method is to examine the effects of experimental factors on the fabrication process using orthogonal arrays (OA) to design a minimum number of experiments [26]. In the Taguchi method, design of experiments (DOE) includes the study of any given system by a set of factors over a specific region of interest (levels) [26]. This method can be used to evaluate the degree of contribution of individual factors and achieve optimum performance for a few well-defined experimental sets. This technique is popular for manufacturing processes and quality control of materials because it can provide a systematic, simple, and efficient way to optimize the process [26].
This article reports the results obtained from the optimization of diameter of SSP PA66 nanofibers fabricated by novel method (ASCES). We used the Taguchi method to examine how some key operation factors can affect the diameter of nanofibers; while the objective is to minimize the nanofiber diameter. L16 orthogonal array was chosen according to Taguchi’s methodology and the effect of SSP PA66 concentration, rotational speed, syringe content, and applied voltage on nanofibers diameter were statistically investigated. Also, field-emission scanning electron microscopy (FESEM) was utilized to analyze the nanofibers morphology to achieve the optimum condition. It is important to note that SSP PA66 polymer was chosen and used because it is one of the most successful commercial polyamide products. Further, we were interested in comparing crystallinity of some nanofiber samples fabricated under different conditions.
Experimental
Materials
Solid state polymerized polyamide, PA66 (SSP PA66) with molecular weight of 77874 g/mol was used as received from Zanjan Tire Cord Co., Iran. Formic acid (98–100%) was purchased from Merck as a solvent of SSP PA66. Its density and boiling point are 1.22 g/mL (at 20℃) and 101℃, respectively.
Preparation of the polymer solutions
SSP PA66 was dissolved in formic acid to prepare solutions with concentration of 12–15 wt%. All solutions were gently stirred at room temperature for 24 h to ensure homogeneity. It is worth mentioning that beaded-fibers appeared when the concentration was lower than 12 wt%.
Characterization
Fiber diameter characterization
The morphology of nanofiber mats was characterized using FESEM (Hitachi S-4160) instrument. Before FESEM observation, all samples were gold coated. The nanofiber diameters were measured from multiple images, analyzing 200 random nanofibers using Digimizer4 software.
X-ray diffractometry
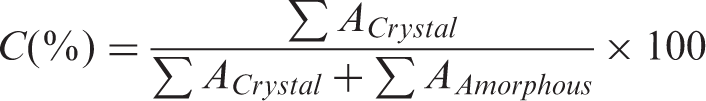
Diffraction pattern of nanofiber samples was recorded with an X-ray diffractometer (Philips X-ray generator, Holland). X-ray diffraction was performed at room temperature with a diffractometer; target, Cu (λ = 1.54 Å); filter, Ni; voltage, 40 kV; current 30 mA; scanning rate 0.04°/s; measured from 2θ = 5–50° at full scale 200. The area under the crystalline and amorphous portions was determined in arbitrary units using
Taguchi orthogonal design
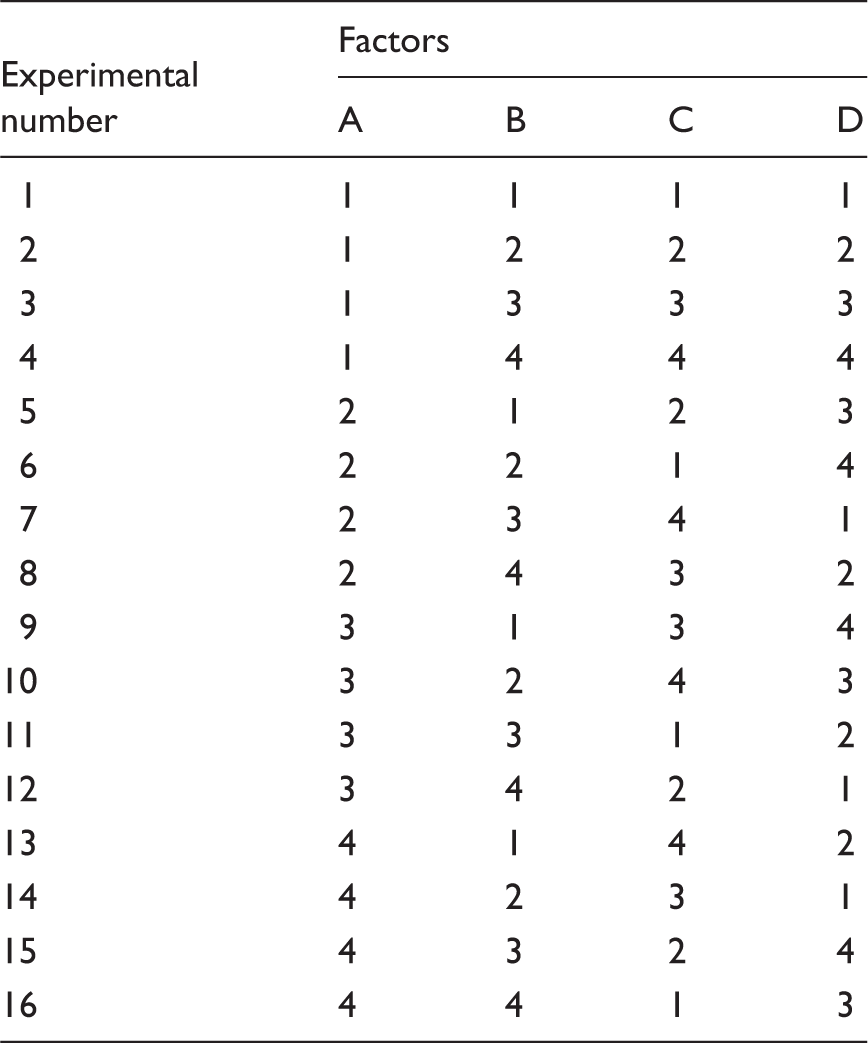
Experimental factors and their levels for Taguchi method.

Orthogonal table L16 design for selected factors.
Spinning setup
The spinning process of nanofibers through air-sealed centrifuge electrospinning (ASCES) as an enhanced spinning system was introduced as follows.
A syringe containing polymer solution has been held by rotating cylindrical receptacle (Figure 1). A nozzle is attached to the syringe and an electric field is applied between the nozzle and cylindrical collector. Increasing the rotational speed of spinning head tends to eject a fluid jet from the tip of the nozzle. The electric field as well as centrifugal force direct the liquid jet toward the collector and stretch the jet to become very fine. The traveling jet is solidified through solvent evaporation and the solidified jet, turning into the nanofiber, is collected in the form of nanofiber mat on the metallic cylindrical collector.
Schematic of air-sealed centrifuge electrospinning system: (A) rotating drive shaft; (B) insulated plate; (C) rotating cylindrical receptacle; (D) rotating metallic cylindrical collector; (E) transparent door; (F) high-voltage power supply.
Results and discussion
Nanofiber morphology
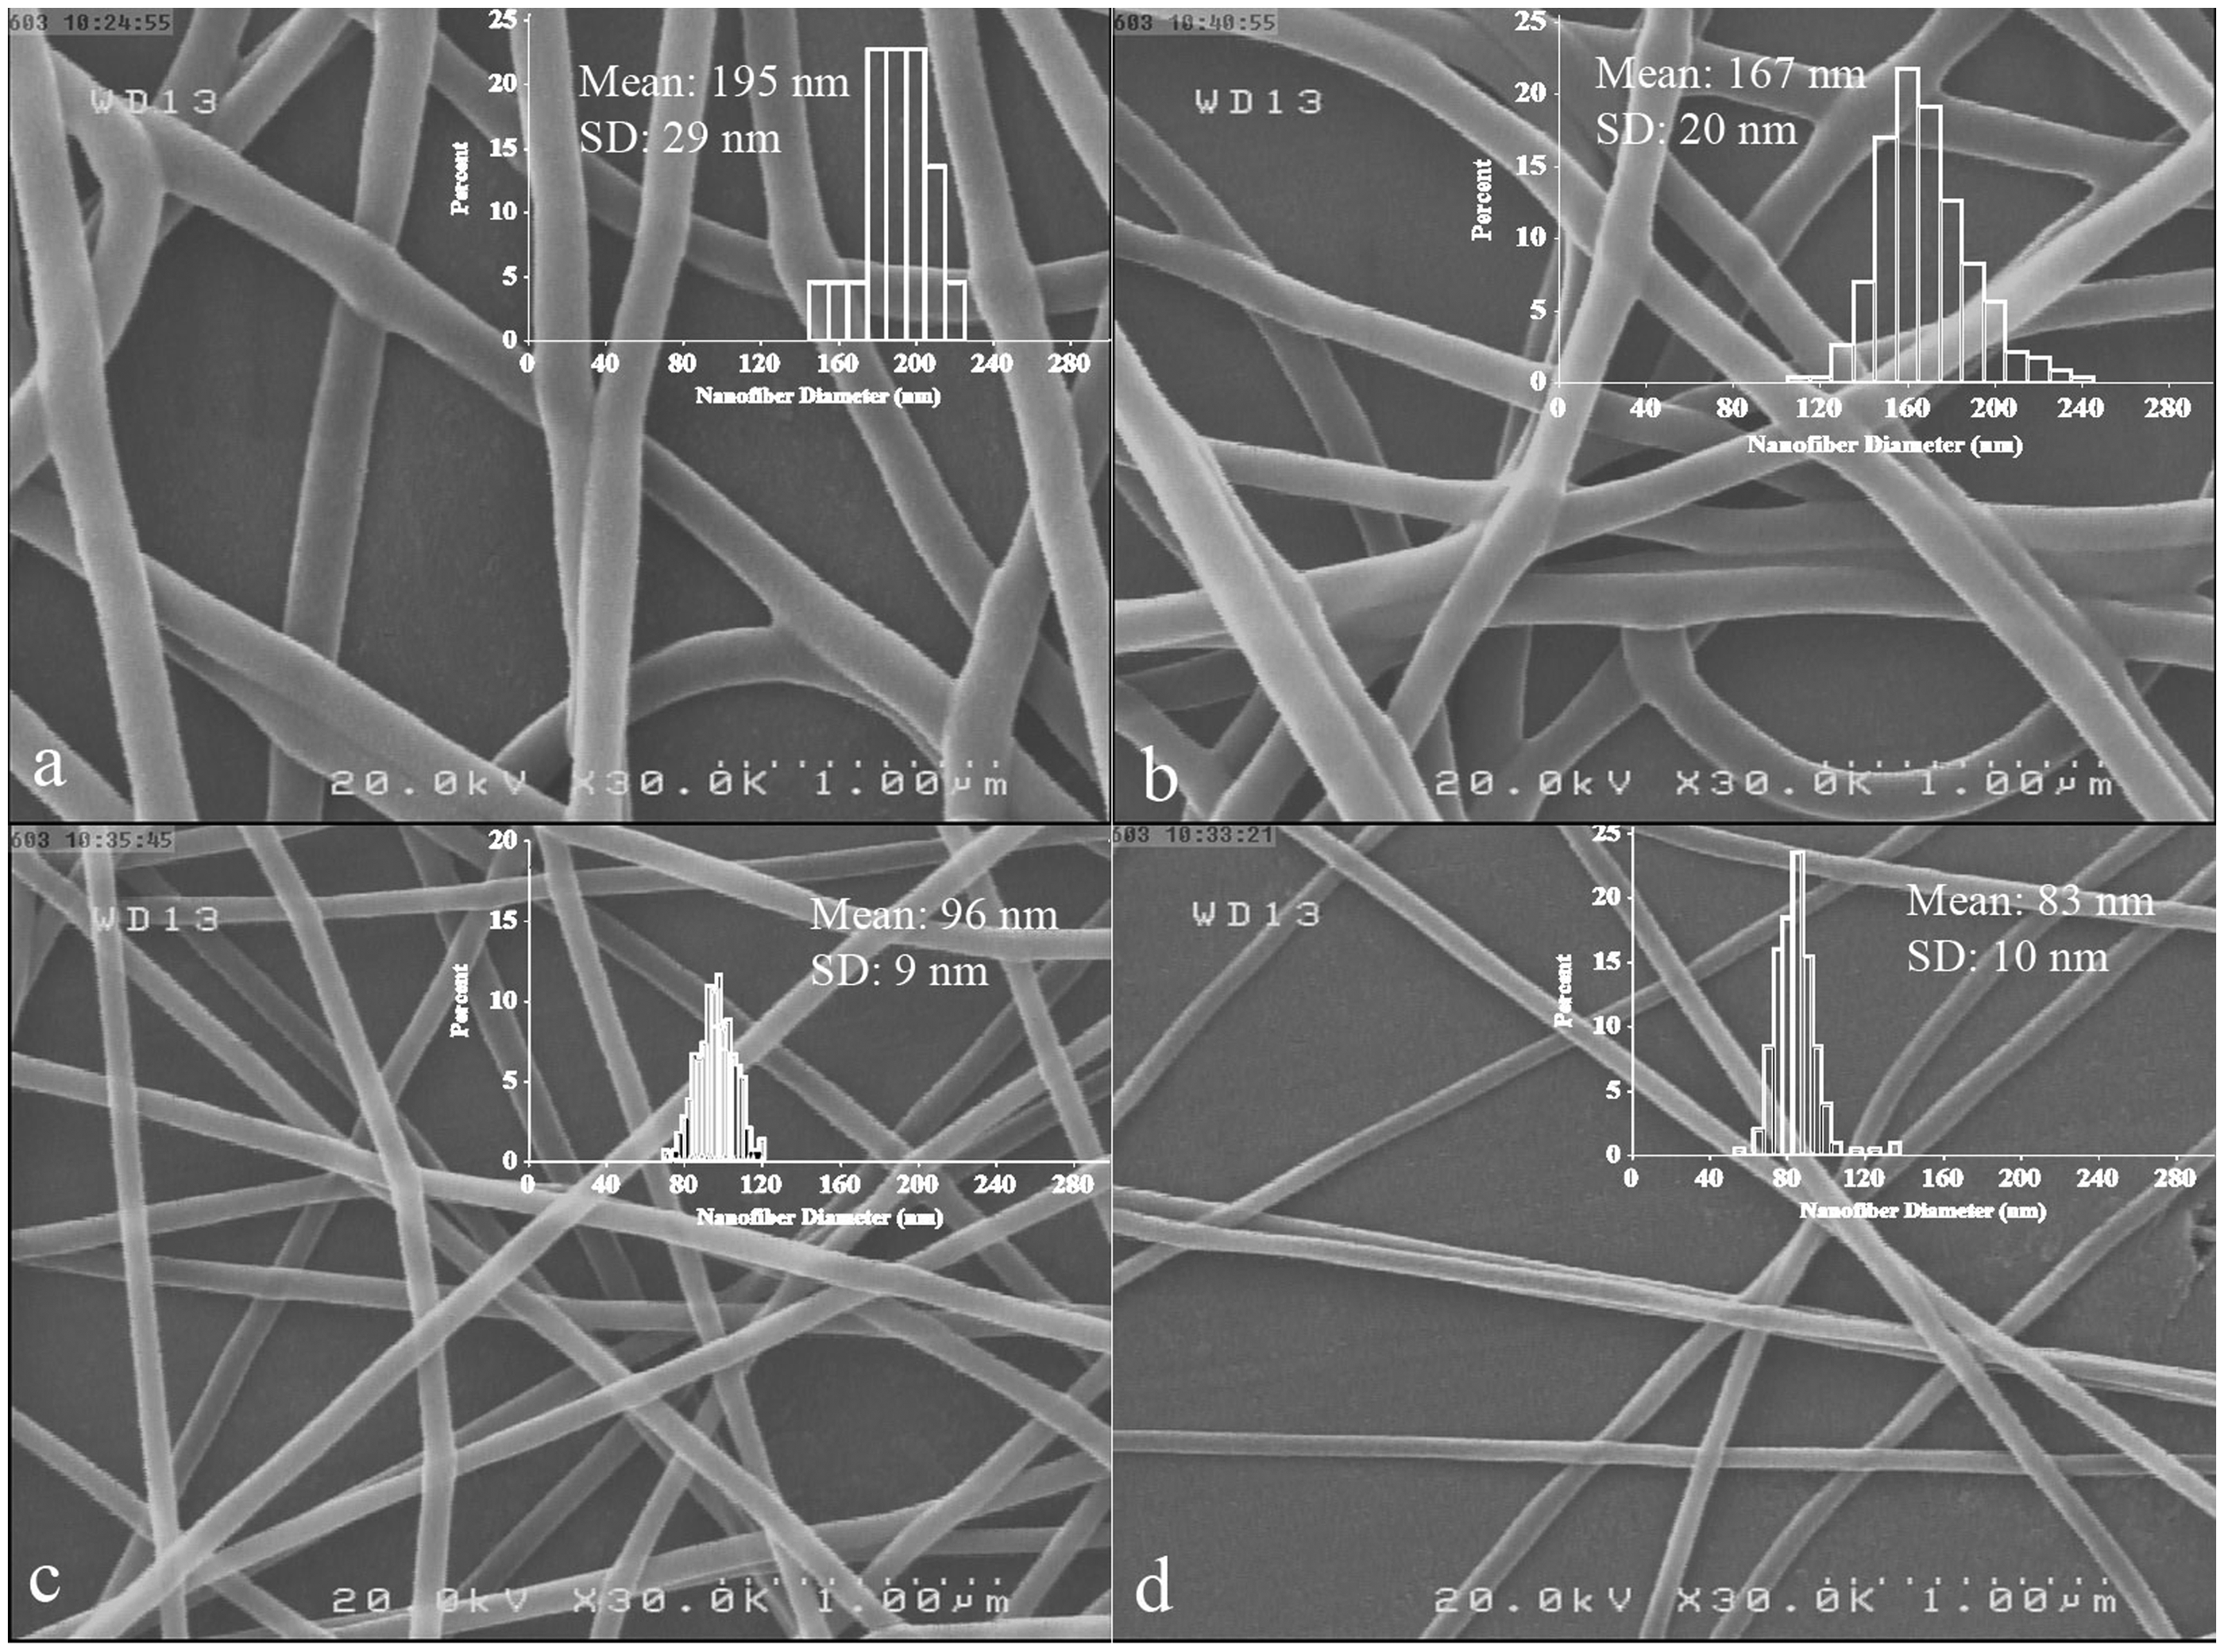
FESEM images, together with their corresponding histograms showing the sizes of the samples fabricated according to Taguchi experimental design (Tables 1 and 2), are shown in Figures 2 to 5.
FESEM images of SSP PA66 nanofibers fabricated by ASCES system at: (a) A1 B1 C1 D1; (b) A1 B2 C2 D2; (c) A1 B3 C3 D3; (d) A1 B4 C4 D4. FESEM images of SSP PA66 nanofibers fabricated by ASCES system at: (a) A4 B1 C4 D2; (b) A4 B2 C3 D1; (c) A4 B3 C2 D4; (d) A4 B4 C1 D3.

Figures 2, 3, 4, and 5 depict nanofibers fabricated from solutions with concentration of 12 wt%, 13 wt%, 14 wt%, and 15 wt%, respectively. The FESEM images confirmed the formation of bead free SSP PA 66 nanofibers. The mean nanofiber diameter and standard deviation calculated from the values are summarized in Table 3. These pictures revealed that processing parameters have a large effect on nanofiber diameter. Differences exist between the FESEM images of the samples depending on the spinning conditions. The finest fibers have been obtained for the experimental run 16 (A4 B4 C1 D3), shown in Figure 5(d). The corresponding spinning condition (high rotational speed as well as low syringe content) provides high centrifugal force as well as low flow rate. This condition facilitates stretching of polymer solution along the distance between the needle and the collector and enhances the solvent evaporation leading to the formation of nanofibers with small diameters. The thickest fibers have been achieved at experimental run 9 (A3 B1 C3 D4), illustrated in Figure 4(a), which involves the setting of factors at the nearly opposite levels to those in experimental run 16. The corresponding spinning condition (low rotational speed as well as high syringe content) provides low centrifugal force as well as high flow rate. Such condition is not capable of stretching the ejected solution due to the insufficient extensional force. Figure 2 shows that increasing the rotational speed and syringe content simultaneously, disregarding voltage, causes to increase nanofiber diameter, slightly. Increasing rotational speed as well as decreasing syringe content tends to decreasing nanofibers diameter (Figure 4). Nanofiber samples illustrated in Figure 5 shows that increasing rotational speed as well as decreasing syringe content tends to decreasing nanofibers diameter, severely. It can be seen that the effect of rotational speed and syringe content on decreasing nanofiber diameter is more effective at higher solution concentration. It is worth mentioning that there are samples with diameter lower than 100 nm formed from all concentrations. Sanatgar et al. [27] found that SSP PA66 nanofibers had average diameters of 117 nm, 196 nm, and 246 nm from solutions with concentrations of 10 wt%, 14 wt%, and 18 wt%, respectively. This shows that the enhanced electro-centrifuge spinning has ability to produce fine nanofibers without considering the concentration by properly adjusting the process parameters. Therefore, this novel system is a facile method for the fabrication nanofibers with smaller diameters and highly uniform structures.
FESEM images of SSP PA66 nanofibers fabricated by ASCES system at: (a) A2 B1 C2 D3; (b) A2 B2 C1 D4; (c) A2 B3 C4 D1; (d) A2 B4 C3 D2. FESEM images of SSP PA66 nanofibers fabricated by ASCES system at: (a) A3 B1 C3 D4; (b) A3 B2 C4 D3; (c) A3 B3 C1 D2; (d) A3 B4 C2 D1. Mean diameter and its standard deviation of SSP PA66 nanofibers in the 16 experiments.

Statistical analysis
S/N ratio and mean evaluation
Response table for signal-to-noise ratios: Smaller is better.

Response table for means.

Figure 6(a) and (b) shows the mean effect of the solution concentration, the rotational speed of spinning head, the syringe content, and the voltage on the average diameter of SSP PA66 nanofibers.
Main effect of SSP PA66 concentration (a), rotational speed of spinning head (b), syringe content (flow rate) (c), and applied voltage (d) on average fiber diameter.
ANOVA results of mean nanofiber diameter

Analysis of variance for means.

Main effect of parameters
Concentration
As shown in Figure 6(a), the increase of concentration up to 14 wt% increased mean nanofiber diameter. Further increasing concentration did not have significant influence on mean nanofiber diameter. Many researchers found that an increase in solution concentration tends to increase the mean diameter of nanofibers fabricated by conventional electrospinning [28–31]. Therefore this observation will be expected of enhanced electro-centrifuge spinning. Actually increasing concentration results in higher viscosity, which makes the extension of the jet more difficult and results in the formation of a thicker fiber.
Rotational speed
It was deduced from Figure 6(b) that the average diameter of nanofibers tends to decrease drastically with increasing the rotation speed. Indeed, the centrifugal force increases significantly with increasing the speed of rotation. As previously indicated, the centrifugal force accelerates and stretches the liquid jet. Thus, the higher the centrifugal force, the greater the extension of polymeric jet, which results in a thinner and uniform fiber.
Syringe content
As depicted in Figure 6(c), mean nanofiber diameter was increased by increasing the syringe content. It was theoretically found that increasing the syringe content causes to increase the hydrostatic pressure. Also, the increasing hydrostatic pressure resulted in higher flow rate [20]. It has been found that lower flow rates yielded fibers with smaller diameters [15]. In our case, the smallest diameters occur at the lowest flow rates (the lowest syringe content).
Voltage
Finally, Figure 6(d) represents the influence of voltage on mean nanofiber diameter. As previously indicated, voltage has no significant effect on nanofiber diameter. However, it can be seen from Figure 6(d) that the increase in voltage produces jets with larger diameters. However, the correlation between the fiber diameter and the voltage was ambiguous. Some researchers found that higher electrical field yielded fibers with larger diameters [12,15,32], while some others indicated that the fiber diameter tends to decrease with increase in applied voltage [33,34]. Zhang et al. [12] reported that the average diameter of PVA nanofibers slightly increased with an increase in the applied electric field, and explained that increasing the applied voltage increases the electrostatic repulsive forces on the fluid jet that favors thinner fiber formation. On the other hand, the solution will be delivered from the nozzle more quickly at higher voltage as the jet is ejected from the Taylor cone. In turn, this results in an increase in the fiber diameter. Mo et al. [35] found that diameter of poly(L-lactid-co-ɛ-caprolactone) (poly(LLA-CL)) nanofibers tends to decrease while increasing the applied voltage. They indicated that the electrostatic stress on the jet increases with increasing the voltage, resulting in a higher draw ratio and hence a thinner fiber. Furthermore, Gu et al. [36] and Adomavičiūt ė et al. [37] reported that there was no significant change in PAN and poly(vinyl alcohol) (PVA) nanofibers diameter by altering the applied voltage. Our results here, however, indicated that the voltage has no significant effect on nanofiber diameter.
Interaction effect of parameters
The graph presented in Figure 7 (figures generated by using MINITAB-14) clearly represents the interaction between affecting parameters. It was found that there is no special pattern between voltage and three other parameters. Interaction between the rotational speed and concentration can be seen from Figure 7(a). The interaction plot shows that increasing the rotational speed decreases nanofiber diameter particularly at higher concentration. Increasing the concentration from 12 wt% to 15 wt% tends to increase the effectiveness of rotational speed on nanofiber diameter. It has been found that increasing the solution viscosity by increasing the polymer concentration decreases the flow rate through electro-centrifuge spinning [20]. It was found that lower flow rates yield fibers with smaller diameters [15]. The highest concentration (15 wt%) and rotational speed (3960 r/min) yields the finest nanofibers. It can be seen from Figure 7 (b) that the effect of syringe content on nanofiber diameter is more effective at higher solution concentration. At the highest concentration, decreasing the syringe content causes a drastically decrease in nanofiber diameter. As previously mentioned, decreasing syringe content and increasing concentration decline the flow rate which tends to fabricate nanofiber with small diameter. Also, the finest nanofibers have been obtained at the highest rotational speed and the lowest syringe content (Figure 7(c)). This condition provides high centrifugal force as well as low flow rate.
Interaction plots for nanofiber diameter: (a) rotational speed vs concentration; (b) syringe content vs concentration; (c) syringe content vs rotational speed.
Optimum conditions
To obtain the optimum condition of finest fiber diameter achievement, the lowest point of the mean effect must be considered. Also, it is desirable to maximize the S/N ratio in Taguchi experiments. The level averages in the response tables (Tables 4 and 5) show that the S/N ratios and the mean were maximized and minimized respectively when the solution concentration was 12 wt%, the amount of syringe content was 0.1 mL, the rotational speed was 3960 r/min, and voltage was 10 kV. The mean effect plot confirms these results.
X-ray diffraction
In order to investigate the crystalline behavior and the variety of phases, SSP PA66 polymer and nanofiber samples obtained under different processing conditions were characterized by XRD, as indicated in Figure 8. These conditions are listed in Table 7.
XRD patterns of the SSP PA66 polymer and three nanofiber samples. Experimental conditions for fabrication nanofiber samples.
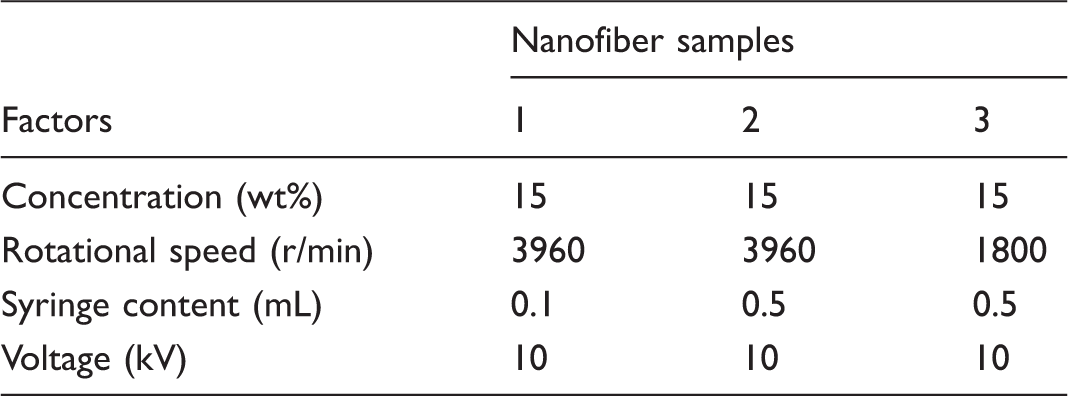
As mentioned previously, the rotational speed of spinning head and the syringe content had greater influences on nanofiber diameter than did solution concentration and voltage. Therefore, the influence of syringe content and rotational speed was investigated on crystallinity.
Neat polymer exhibits the two main peaks corresponding to the α crystalline form of PA66 located at 20.3° and 23.6°. Additionally, the diffractogram shows a peak at 21.6° as a γ phase.
The α phase consists of planar sheets of hydrogen-bonded chains with sheets stacked upon one another and displaced along the chain direction by a fixed amount. Pleated sheets of methylene units with hydrogen bonding between sheets rather than within sheets characterize the γ phase [27]. The α1 peak arises from the distance between the hydrogen-bonded chains, and the α2 peak arises from the separation of the hydrogen-bonded sheets. The γ phase structure is unstable and seldom appears in PA66 at room temperature, as the α phase is more stable than the γ phase. The existence of the γ phase at room temperature indicates the presence of additives added in the polymer to modify the properties [27]. The degree of crystallinity of SSP PA66 polymer obtained from XRD pattern is 41%. The results show that all nanofiber samples are amorphous in structure; only a broad peak is located around 21° and the α phase vanishes in all nanofiber samples. From these results, it follows that the crystallinity of the nanofiber samples does not seem to vary by altering the processing conditions. Increasing the rotational speed of spinning head and the syringe content does not influence crystallization rate of all nanofiber samples.
Conclusion
In summary, we have explored a simple, facile, and controllable method for fabrication SSP PA66 nanofibers. Enhanced electro-centrifuge spinning was used to produce high quality and fineness nanofibers. An experimental design has been performed to obtain nanofibers, which are as thin and homogeneous as possible. Nanofiber diameter has been successfully controlled from 20 to 250 nm based on the Taguchi design method by controlling the solution concentration, syringe content, rotational speed, and applied voltage. The sequence of the parameters influencing nanofiber diameter was syringe content (35.76%) > rotational speed (23.93%) > solution concentration (21.36%) > applied voltage (11.49). The most influent parameter on fiber diameter was the syringe content. A lower content yields thinner nanofibers. The second influent parameter on mean diameter is rotational speed. The higher the rotational speed, the greater the extension of polymeric jet which results in thinner and uniform nanofibers. The increase of concentration as another parameter increases mean nanofiber diameter. The influence of applied voltage is less significant that the rest of parameters.
The best parameters obtained after Taguchi optimization for thinner fiber formation are a concentration of 12 wt%, a syringe content of 0.1 mL, a rotational speed of 3960 r/min, and a voltage of 10 kV. Additionally, XRD analysis revealed that the nanofibers fabricated under three different conditions were amorphous in structure and the crystallization rate of all nanofiber samples is not influenced by increasing the rotational speed of spinning head and the syringe content.
Footnotes
Declaration of Conflicting Interests
The author(s) declared no potential conflicts of interest with respect to the research, authorship, and/or publication of this article.
Funding
The author(s) received no financial support for the research, authorship, and/or publication of this article.