
Abstract
This paper presents the results of a numerical simulation of the ultimate flax fibre (Linum usitatissimum) tensile mechanical behaviour using finite element analysis. Experimental data were used to develop a numerical multilayer model of the flax fibre. Thus, the influence of some parameters, such as cell wall thicknesses, microfibrils angles (MFAs), biochemical composition and mechanical properties of the biochemical components, on the flax fibre tensile mechanical behaviour has been investigated. Results show that the typical stress–strain curve profile of the flax fibre could be due to the mechanical properties of hydrophilic components (hemicelluloses) and thus to the environmental conditions. A parameter sensitivity study reveals that ultrastructural parameters (hemicelluloses and cellulose Young’s modulus) strongly influence the flax fibre mechanical behaviour and structural parameters (S2 cell wall layer MFA and thickness) significantly influence the fibre longitudinal Young’s modulus. Thus, the knowledge of the fibre ultrastructure seems to be the key of the understanding of the flax fibre mechanical behaviour.
Keywords
Introduction
Today there is a need for the development of eco-composites materials reinforced with natural fibres. Among these fibres, flax fibres present specific mechanical properties comparable with those of some synthetic fibres, such as glass fibres [1–3]. In addition, the low density (about 0.4 g/cm3) of the flax fibre permits mass saving, hence energy saving, which presents an advantage for application fields such as transport.
However, flax fibre, as all natural fibres, presents a high standard deviation of the mechanical properties due to the structure. Therefore, this numerical model would permit to determine the influence of structural and mechanical parameters (microfibrils angle (MFA), cell wall thickness, biochemical composition, mechanical properties of the components, etc.) on the flax fibre mechanical behaviour. This step is necessary since the mechanical behaviour of the reinforcement must be understood in order to use it in eco-composite materials.
Flax fibre has a diameter ranged between 10 and 30 µm and is 10- to 40-mm long [2,4]. Fibres are made of two cell walls, the primary and the secondary, which is subdivided in three layers: S1, S2 and S3 from the outer to the inner (Figure 1). A cavity, lumen, is located in the centre of the fibre [5,6]. Fibres’ cell wall layers are composites materials made of mostly crystalline cellulose microfibrils which act like a reinforcement embedded in an amorphous matrix mainly constituted of hemicelluloses, pectins, lignin and water [2,7–9]. In both primary and secondary walls, the cellulosic microfibrils are almost totally crystalline and represent between 60% and 90% of the total mass of the fibre [7,9–11]. The amount of each component is known to be dependent on different factors as the pedo-climatic conditions during the plant growth or the maturation degree of the plant [12–14]. The microfibrils are randomly dispersed in the primary wall while they are well-aligned parallel to one another in a steeply inclined helix within each layer of the secondary wall. The MFA with the longitudinal axis of the fibre, which strongly influences the mechanical properties, is estimated to about 10° into the thickest wall S2 and between 30° and 60° into S1 and S3 [4,15,16]. Therefore, the cell wall structure is analogous to the laminate structure of a synthetic fibre-reinforced composite.
Representation of the arrangement of the flax fibres cell walls.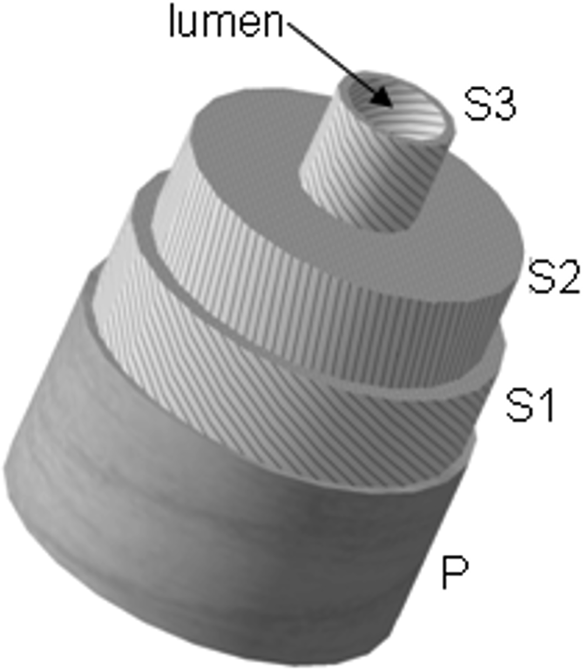
Davies and Bruce [17] have investigated an elastic model of a system made of three coaxial composite layers, presenting an orthotropic behaviour and perfectly interrelated. Each layer is characterized by its thickness and MFA. This model takes into account the multilayer structure of the plant fibres. However, the structural rearrangement under stress [12,18,19] was not considered and the model was not compared with experimental results. The Gassan et al. [20] model considers all the cell wall layers and their MFA. It highlights the importance of the mechanical properties of cellulose in holocellulose fibres. However, the cylindrical morphology of the fibre is yet to be treated in detail. Models developed by Bergander and Salmén [21,22] permit to investigate the influence of the elastic mechanical properties of the wood fibre components on the fibre elastic mechanical properties. In these studies, the investigated model was a stratified model including all the cell wall layers totally linked. The influence of the MFA, layers’ thickness and mechanical properties of the components on the longitudinal and transverse fibre mechanical properties was analysed. The models highlight the high influence of the MFA and layers’ thickness on the fibre mechanical properties. They also reveal that the hemicelluloses and lignin Young’s modulus do not significantly influence the fibre longitudinal mechanical properties contrary to the cellulose mechanical properties. In addition, these models show that the organization of the amorphous matrix components does not play a significant role on the fibre mechanical properties. Moreover, Salmén’s model takes into account the variation of the hemicelluloses Young’s modulus with the humidity and permits to obtain fibre longitudinal Young’s modulus comparable with the experimental values. However, these models do not present a tubular structure and the presence of the lumen is not considered. Placet et al. [23] have proposed an analytical model of the hemp fibre in order to highlight parameters which significantly influence its mechanical properties. It appears that ultrastructural parameters, especially the fraction of crystalline cellulose, its Young’s modulus and the MFA, have more influence than the morphological parameters. Authors have highlighted the necessity to consider a 3D model in order to understand the lumen’s effect on the fibre mechanical properties. However, even if this model takes into account all the cell wall layers, the microstructural rearrangement occurring during stressing [12,18] is not considered and the characteristic stress–strain curve shape is not explained. Finally, the Nilsson and Gustafsson model [24] puts forward an explanation of the characteristic S-shape of the flax fibre stress–strain curve representing its uniaxial tension behaviour. This model only considers the S2 layer and boundary conditions were defined in order to represent an experimental tensile test. Finally, the model makes it possible to attain a S-shape stress–strain curve by taking into account dislocations in the microfibrils network and the hemicelluloses plasticity. However, authors are conscious that the dislocations number and geometry and the hemicelluloses plasticity type do not really correspond to what it is experimentally observed. Moreover, the fact that the microfibrils helix thread is constant involves a variation of the MFA into the layer; the MFA value is so questionable and all the cell-wall layers are not considered.
In our study, a model will be put forward in order to explain the characteristic shape of the tensile test stress–strain curve of the flax fibre, considering all the secondary cell wall layers, the microfibrils structure, the fibre morphology and the structural rearrangement occurring under stressing. The understanding of the flax fibre mechanical behaviour is necessary in order to use it as reinforcement in composite materials.
This model presents the originality to consider the microfibrils rearrangement occurring into the fibre during a tensile test and experimentally highlighted. This structural rearrangement strongly influences the tensile mechanical behaviour of the flax fibre. In addition, this model takes into account all the layers of the secondary cell wall and their experimentally determined thickness, which is a novelty.
A parametric study will permit to determine which parameters, such as the biochemical composition, the MFA, the cell wall thickness and the components mechanical properties, have a significant influence on the flax fibre mechanical properties. The consideration of all these parameters leads to a more realistic model which could also be adapted to other natural fibres, considering their similar composition and physical structure. In addition, this model could be used in the numerical simulation of the complete composite materials for industrial applications.
Tensile Mechanical Behaviour of the Flax Fibre
Ultimate fibres of the Hermès variety, provided by the Institut Technique du Lin, were manually extracted from the bundles. Mechanical properties (strength, ultimate strain and Young’s modulus) of the fibres have been obtained from tensile tests carried out using a universal testing machine (Instron type 5566) equipped with a 2 N capacity load cell. Before testing, the diameter of the fibre was determined by the average of six measurements done along the fibre with an optical microscope. The tests were run at a crosshead displacement rate of 1 mm/min, as it was described in other papers [12,13]. A 10-mm gauge length was considered. Tensile tests data (crosshead displacement and force) were collected at a frequency of 100 Hz. These data permit to assess to the stress and strain values. At least 80 fibres were tested at 23℃ for each relative humidity value (21%, 32%, 46%, 68% and 85%) [19].
Figure 2 shows a nominal stress–train curve obtained from the experimental load and crosshead displacement measurements. The negligible influence of the compliance of the loading assembly on the strain evaluation from the crosshead displacement was checked on glass fibres. Thus, tensile tests were carried out on glass fibres, presenting a well known Young’s modulus (70 GPa) in the range of force applied on the flax fibre during tensile tests (less than 1 N). It appears that, after 20 tests, the mean Young’s modulus value is 70.1 ± 0.1 GPa. At low load values, the quite linear trend is associated to the progressive loading of the loose fibre and the elastic deformation of the cell wall. The shift of the curve is ascribed to the progressive alignment of the microfibrils with the fibre axis and the viscoelastic deformation of the polymers around them [12,13,18]. In the final deformation stage, the microfibrils are fully loaded, as the MFA is reduced. The slope of the loading curve in this domain is used for the evaluation of Young’s modulus [1].
Typical tensile stress–strain curve of a flax fibre.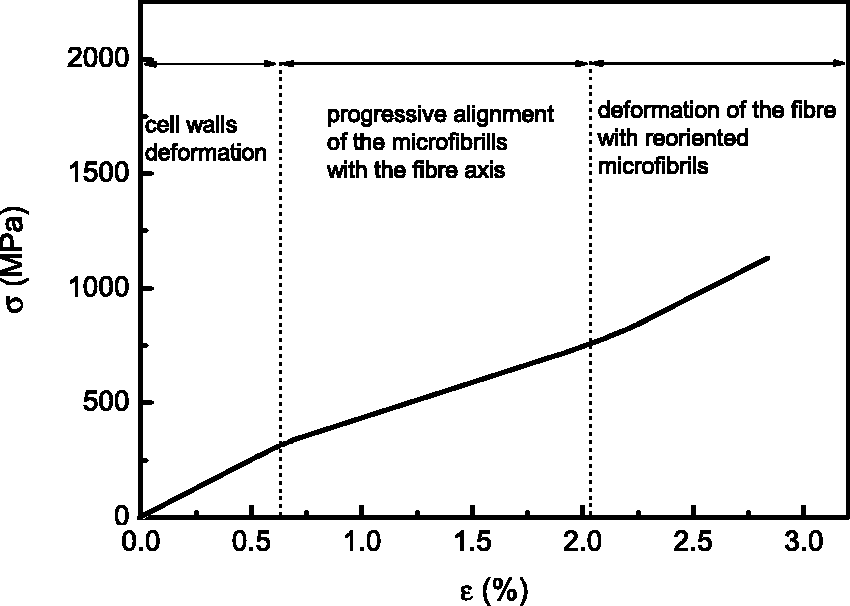
Flax Fibre Model Description
The understanding of the structure and mechanical behaviour of the flax fibre, experimentally determined, permits to elaborate a numerical model (using the ANSYS MultiPhysics © software).
Model Description and Geometry
In this model, we consider the flax fibre as a 20 -µm diameter and 800 -µm length cylinder. This aspect ratio has been chosen to limit the calculus computational time since it does not influence the fibre mechanical properties obtained (Figure 3). The fibre is represented by three concentric cylinders totally linked and a central cavity which represent, respectively, the cell wall layers S1, S2, S3 and the lumen (Figure 4). The primary wall has intentionally been omitted because of its weak thickness, its low cellulose amount, its non-oriented microfibrils network and thus its weak mechanical properties [24]. As determined by Transmission Electronic Microscopy observations [19], S1, S2 and S3 represent, respectively, 10%, 70% and 20% of the fibre cell wall total thickness and the lumen has a 5 -µm diameter. Initially, MFA was fixed at 45° for S1 and S3 whereas S2 angle is 10° [4,15,16] (Figure 4b). The initial conditions are summarized in Table 1.
Influence of the fibre aspect ratio on the fibre Young’s modulus (results obtained by numerical simulation). (a) Structure of the modelled fibre; (b) microfibrils arrangement; (c) FE Reinf 264, 20 nodes. Numerical simulation initial conditions.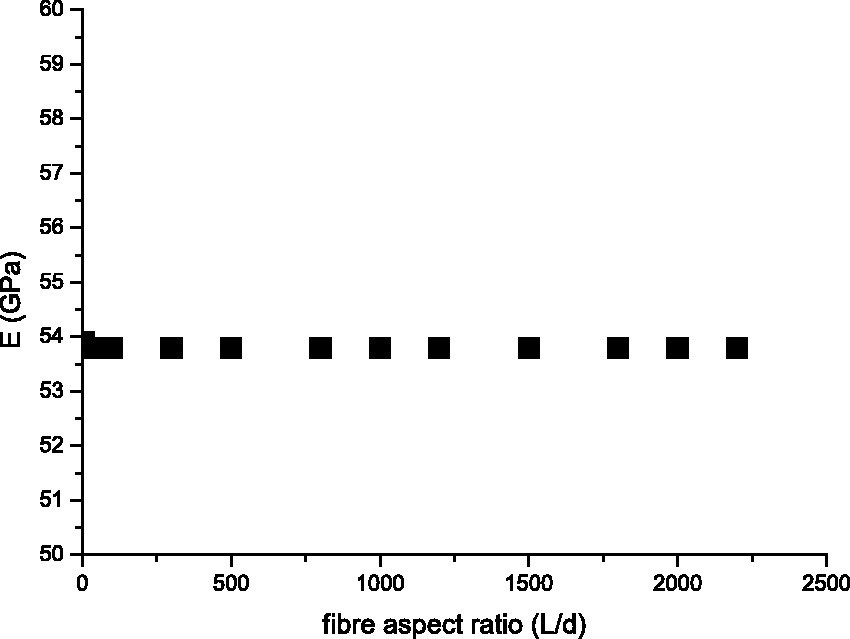


Finite Element
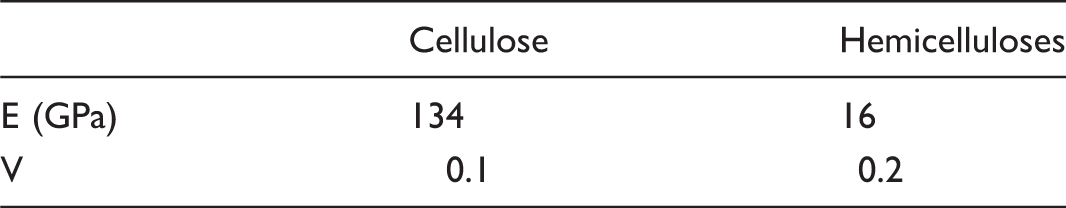
As lignin and hemicelluloses have similar mechanical properties, and considering the limited knowledge on the mechanical properties of pectins [20,22,25], we chose to attribute the mechanical properties of hemicelluloses to the matrix, such as Davies and Bruce [17], Gassan et al. [20] and Nilsson and Gustafsson [24]. Hence, we have attributed a Young’s modulus of 130 GPa for cellulose and a Young’s modulus of 10 GPa for the matrix [22]. The volumes proportion of the reinforcing phase was adjusted in order to be close of the biochemical composition experimentally determined [9] (densities of cellulose, hemicelluloses and lignin are similar [26,27]). Therefore, the initial biochemical proportions were fixed at 70% of the volume for the cellulose reinforcement and 30% for the matrix. As we only consider the longitudinal mechanical behaviour, all the components were considered isotropic. Experimental load–unload experimental tests curves carried out on the flax fibre (Figure 5) show that the hysteresis area represents an average of 0.8% of the total area under the stress–strain curve which confirms a weak visco-elastic character. Thus, the visco-elastic character of the fibre will be neglect in this numerical model and the proposed model will be purely elastic. The cellulose crystallinity rate was not discussed since experimental measurements revealed that it does not significantly vary among different fibre varieties [28].
Load–unload test carried on flax fibre.
Meshing
Preliminary tests have permitted to evidence that microfibrils length does not influence the fibre mechanical properties, in the case that they are considered discontinuous, by adjusting the mesh density (Figure 6). These tests also reveal that, above 432 elements representing the microfibrils per fibre cross-sections, mechanical properties do not vary and are close to those of the real fibre which is made of a high number of microfibrils (Figure 6).
(a) Influence of the number of finite element per section on the fibre mechanical properties; (b) influence of the finite element length on the fibre mechanical properties (results obtained by numerical simulation).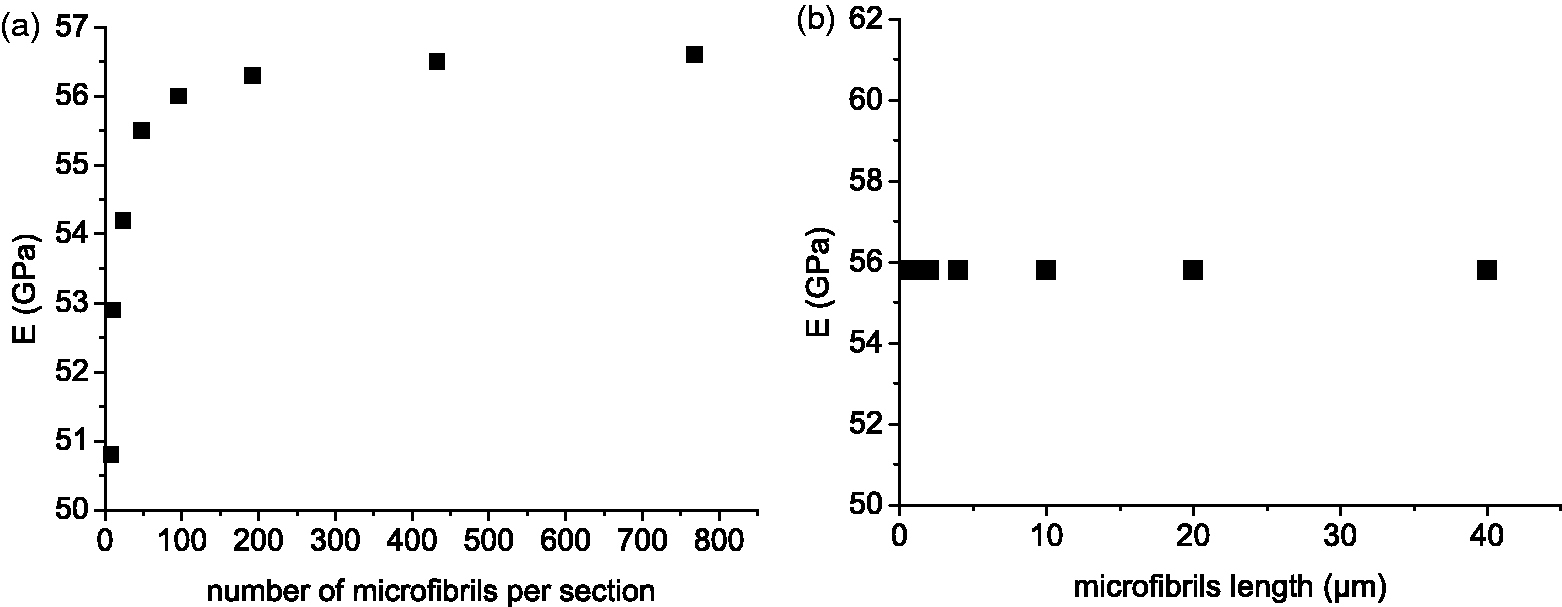
Boundary Conditions
Boundary conditions were defined to represent a tensile test. Thus, rotation and radial displacements were blocked at the fibre tips. Longitudinal displacements were blocked on a face and applied on the other to obtain a 3% strain which corresponds to the strain value generally obtained during the experimental tensile tests. The small displacement theory was considered and the displacement continuity between each layer was assumed considering the experimental flax fibre fracture surface (Figure 7).
Scanning electron microscopy of the flax fibre fracture surface after tensile test.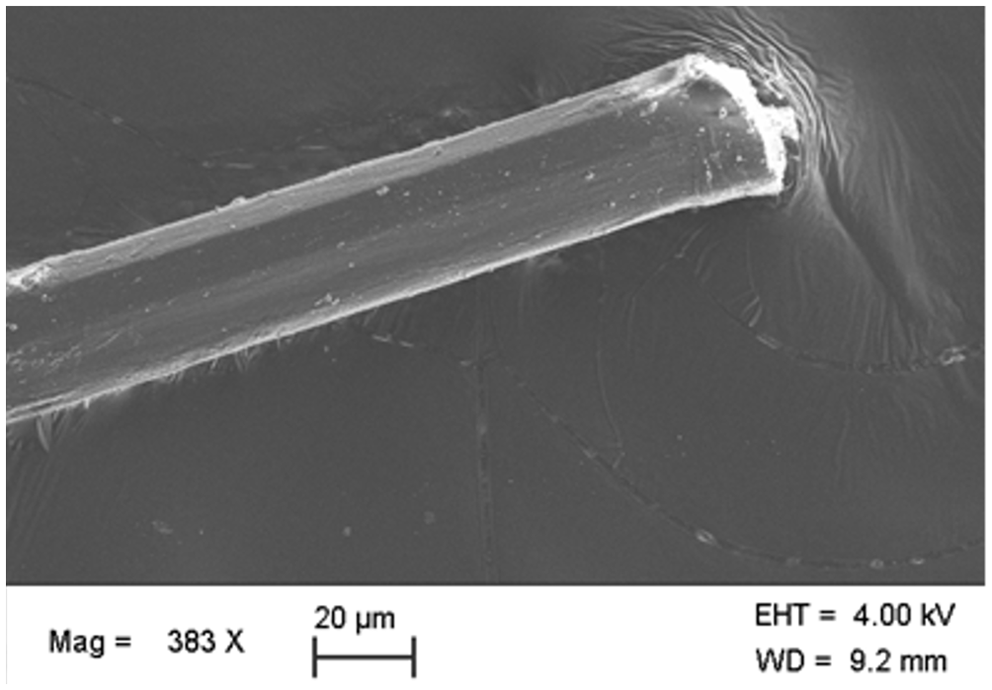
Results
Influence of the Cell Wall Organization
First, the influence of the number of cell wall layers was investigated. Therefore, a one-layer model, representing S2, was compared with a three-layer model which represents S1, S2 and S3 in order to highlight the influence of S1 and S3 on the fibre mechanical behaviour.
It was noted that the three-layer model attains a weaker tensile strength, closer to experimental results than the one-layer model (Figure 8). Thus, since MFAs of S1 and S3 layers are higher, the global MFA in the three-layers model is higher than in the one-layer model. Hence, less microfibrils are aligned with the tension direction after a strain of 3% which explains the weaker tensile strength reached. Thus, it appears that the internal organization of the cell walls must be well known in order to precisely understand the flax fibre mechanical behaviour.
Influence of the cell wall organization on the fibre mechanical behaviour.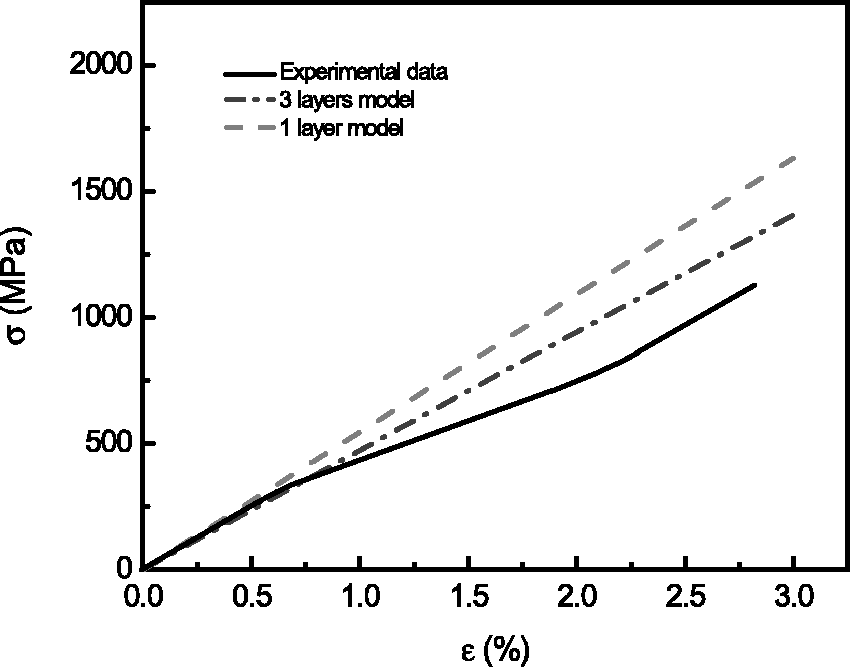
Then, effect of the layers’ thicknesses and their MFA was studied (Figure 9). Therefore, thickness values were ranged between the extreme values experimentally determined by TEM [19]. The thickness of S1 ranges between 5% and 15%, S2 between 60% and 80% and S3 between 15% and 25%. Moreover, since the fibre mechanical behaviour is influenced by the MFA values into each layer, different values reported by other studies were tested [2,19,29] from 6° to 12° for S2 and from 30° to 60° for S1 and S3.
Young’s modulus evolution as a function of the thickness and MFA of the cell wall layers.
It was noted that the increase in the S1 thickness involves a decrease in the fibre Young’s modulus since a larger proportion of the microfibrils has a high MFA value. Therefore, a 10% variation of the S1 thickness leads to a 7-GPa variation of the fibre Young’s modulus and a 15° variation of the MFA involves a 2.5-GPa variation of the fibre Young’s modulus. This is explained by the fact that the S1 MFA increase leads to a weaker proportion of microfibrils taking fully part to the reinforcement of the fibre. MFA value plays a more important role with the increase in the thickness. However, it was noted that, for MFA values higher than 45°, the fibre Young’s modulus does not significantly change whatever the MFA value. This could be explained by the fact that, for MFA > 45°, no fibres are aligned with the tension axis for a 3% strain. So, in this case, the microfibrils present in the S1 layer do not influence the fibre Young’s modulus.
The thickness of the S2 layer strongly influences the fibre Young’s modulus. A variation of 10% of the relative thickness leads to a variation of about 8 GPa of Young’s modulus. It must be noted that a variation of about 20% has been experimentally observed. MFA value acts similarly, so, in the extreme case, variations of the S2 thickness (20%) and of its MFA (6°) change the fibre Young’s modulus values from 45 to 68 GPa.
Finally, it was observed that the thickness and MFA of the S3 layer have a negligible influence on the fibre mechanical properties. This is due to geometrical consideration. Thus, for a same thickness, S1 layer represents a more important volume than S3 layer, so a higher microfibrils proportion.
Influence of the Biochemical Composition and Mechanical Properties of the Fibre Components
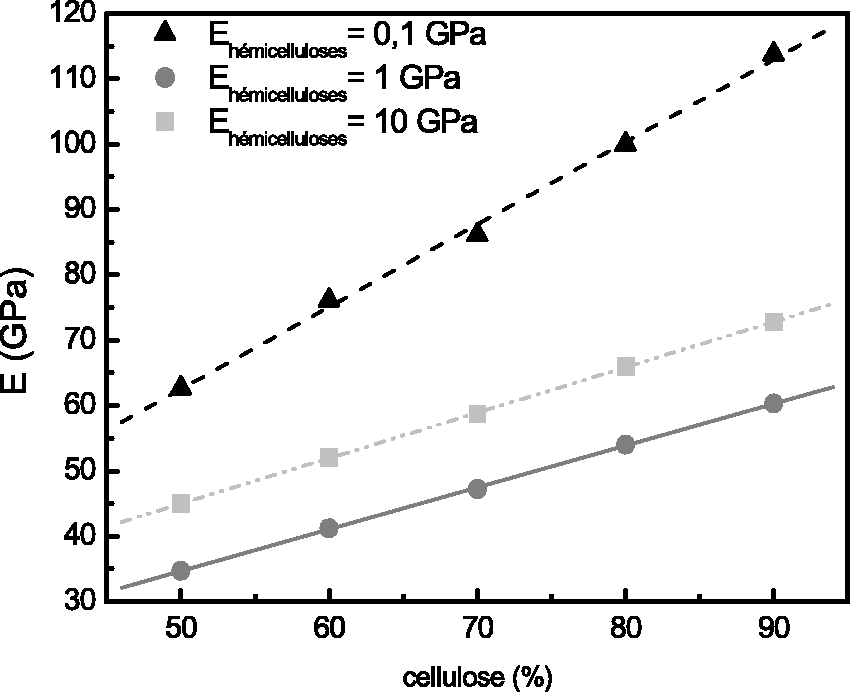
The influence of the biochemical composition on the mechanical properties was also investigated. For this purpose, the volume fraction of the bar element in the 3D element was modified. Biochemical composition analyses [9] reveal that the cellulose amount ranges between 70% and 80% of the mass (the water fraction is not considered in these analyses made on dry fibres). Hence, the proportion of amorphous components, hemicelluloses in this model, is ranged between 20% and 30%. In order to consider the biochemical composition values encountered in the literature for different fibre varieties, harvesting year, pedo-climatic conditions, the cellulose rate were considered ranged between 50% and 90% of the mass fibre. In addition, the influence of the cellulose mechanical properties on the fibre mechanical behaviour was also studied (Figure 10) since authors [20,22,25,30] show that the cellulose Young’s modulus is ranged between 100 and 160 GPa.
Influence of the biochemical composition and cellulose Young’s modulus on the fibre mechanical properties.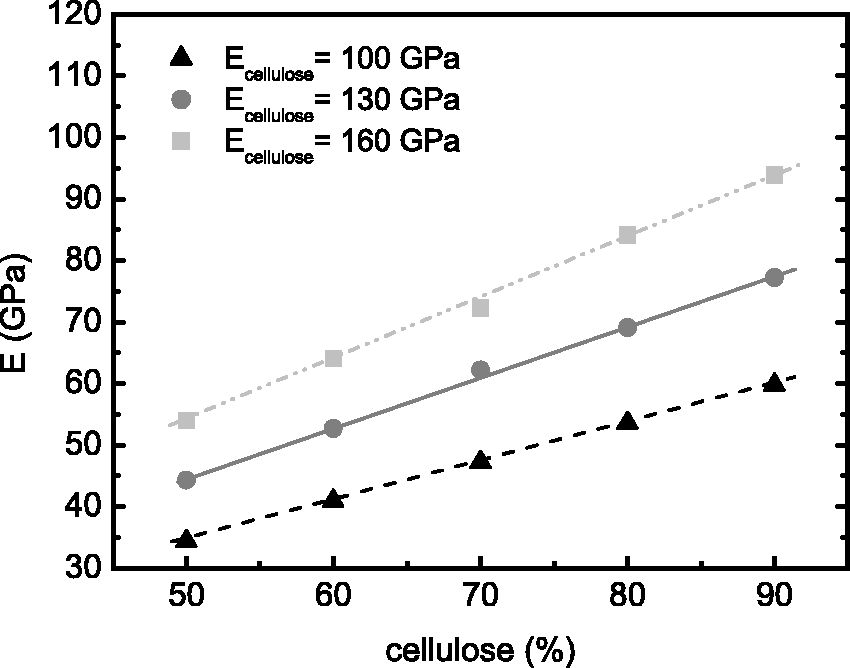
It was noted that a 10% variation of the cellulose content leads to a 6–12 GPa variation of the fibre Young’s modulus (depending on the cellulose Young’s modulus). It was observed that a cellulose Young’s modulus higher than 130 MPa leads to fibre Young’s modulus values higher than those experimentally determined [19]. However, due to the non-consideration of the lumen presence in the calculation of the experimental values [31], the apparent fibre Young’s modulus experimentally determined is under-estimated (between 15% and 25% [23]). Hence, a cellulose Young’s modulus of 130 GPa will be considered in the rest of the study.
Hemicelluloses Young’s modulus is not well known and varies with the hygrometry between 8 and 0.02 GPa [22,32,33]. However, their value strongly influences the fibre mechanical properties (Figure 10). Comparing the results obtained for hemicelluloses Young’s modulus values of 1 and 10 GPa, it appears that the higher the hemicelluloses Young’s modulus, the higher the fibre Young’s modulus (determined on the last part of the stress–strain curve [9]), is. This is explained by the mixture’s law (equation (1)).

If the hemicelluloses Young’s modulus value is 0.1 GPa, the fibre Young’s modulus is clearly higher than the values previously obtained. This could be explained by the fact that a low hemicelluloses stiffness permits an easier microfibrils alignment with the tension axis and so a higher Young’s modulus. This hypothesis is confirmed by the stress–strain curves obtained for different hemicelluloses Young’s modulus values (Figure 11). The decrease of the hemicelluloses Young’s modulus, i.e. of the matrix Young’s modulus, permits to obtain non-linear stress–strain curves. Thus, this model is in good agreement with the experimental observations which revealed that the inflection points are characteristic of the microfibrils alignment and the rearrangement of the amorphous parts [18,19]. If we consider a strain of about 0.5%, it is noted that the fibre Young’s modulus is proportional with the hemicelluloses Young’s modulus, which is explained by the mixture’s law. At this stage, the microfibrils alignment with the tension axis would be limited, even in the case of a hemicelluloses Young’s modulus of 0.1 GPa. Then, the microfibrils alignment would occur with the increase in the strain. Hence, the fibre Young’s modulus becomes higher in the case of weak hemicelluloses Young’s modulus values (Figure 12).
Influence of the hemicelluloses Young’s modulus on the stress–strain curve. Influence of the biochemical composition and hemicelluloses Young’s modulus on the fibre mechanical properties.
The experimental stress–strain curves of a fibre tested at a relative humidity of 85% and for which the layers’ thickness and cellulose rate are similar to the numerical simulation initial conditions, which presents a non-linear shape comparable with the one obtained for a simulated curve in the case that the hemicelluloses Young’s modulus is equal to 0.1 GPa (Figure 11). On the other hand, the experimental stress–strain curves of a fibre tested at a relative humidity of 46% and for which the layers’ thickness and cellulose rate are similar to the numerical simulation initial conditions, which is comparable with the simulated curve obtained when the hemicelluloses Young’s modulus considered is equal to 1 GPa (Figure 11). Thus, the model seems to be able to suitably represent the mechanical behaviour of the flax fibre for different relative humidity value. In addition, these results confirmed the experimentally observed fact that the S-shape of the stress–strain curve is more obvious when the relative humidity increase.
Finally, it seems that the hemicelluloses Young’s modulus value and thus the hygrometry during the tests determines the stress–strain curve aspect. When the hygrometry increases, the hemicelluloses Young’s modulus decreases and the stress–strain curve becomes non-linear. Moreover, the hypothesis of an easier microfibrils alignment when the hemicelluloses Young’s modulus is lower could permit to explain the increase in the fibre mechanical properties with the hygrometry increase, experimentally evidenced [19,34].
Relative Influence of the Parameters
A parameter sensibility study was carried out in order to quantify the influence of the structural and mechanical parameters investigated, on the fibre Young’s modulus. The different input values were generated using stochastic calculus [35]. Generally, the impact of an input parameter on an output parameter is determined by:
The amount by which the output parameter varies across the variation range of an input parameter. The variation range of an input parameter (Table 3). Indeed, the wider the variation range is, the larger the impact of the parameter is; 200 values in each range were stochastically considered. Variation range of input parameters.

The statistical sensitivities used are based on the Spearman-Rank Order Correlation coefficients rs (equation (2)), taking into account both those aspects at the same time. Basing sensitivities on correlation coefficients follows the concept that the more strongly an output parameter is correlated with a particular input parameter, the more sensitive it is with respect to changes of that input parameter.

Results (Figure 13) show that ultrastructural parameters such as the hemicelluloses and cellulose Young’s modulus strongly influence the flax fibre longitudinal Young’s modulus. Besides, structural parameters (MFA and layers’ thickness) of the S2 layer significantly influence the fibre Young’s modulus. Fibre Young’s modulus moderately depends on the cellulose rate and the S1 layer MFA and thickness, whereas the S3 layer MFA and thickness do not present noticeable influence on it. Therefore, the knowledge of the fibre ultrastructure should permit to apprehend the flax fibre mechanical behaviour.
Sensitivity of the investigated structural and mechanical parameters on the fibre Young’s modulus.
Conclusions
The aim of this work was to put forward a model of the flax fibre in order to understand its tensile mechanical behaviour and determine the structural and mechanical parameters influencing it, in order to use this fibre as reinforcement in composite materials. Moreover, the proposed model seems to be able to represent the experimentally determined mechanical behaviour of the flax fibre. Some important points were highlighted:
The fibre tensile stress–strain curve shape could be influence by the fibre amorphous matrix mechanical properties, mainly made of hydrophilic components. Hence, the environmental condition, especially relative humidity, would determine the curve linearity. A soft matrix could make easier the microfibrils alignment with the tension axis and leads to a non-linear stress–strain curve. The strong influence of the S2 layers thicknesses and MFA on the fibre mechanical properties. The influence of the cellulose content and of the cellulose mechanical properties on the fibre mechanical properties. The noticeable influence of the environmental conditions, and especially hygrometry, during mechanical testing since they influence the hemicelluloses mechanical properties and the tensile stress–strain curve shape. The fibre ultrastructure strongly influence the flax fibre longitudinal Young’s modulus.
Footnotes
Funding
The authors would like to thank CNRS and Région Basse-Normandie for the financial support.