
Abstract
Polysulfonamide (PSA) is one of the functional materials with excellent heat and flame resistance properties, which can be potentially utilized in aerospace field and other civil fields. This work presents a feasible method for the preparation and characterization of the electrospun polysulfonamide fibers at nanoscale. The micro-surface morphology and micro-structure of the manufactured polysulfonamide fibers were characterized using the scanning electron microscope. The effects of electrospinning parameters on fibers’ micro-surface morphology and properties were investigated accordingly. It was found that high solution concentration favors the formation of smooth fibers and the low solution concentration leads to the formation of beaded fibers or beads. Small diameter fibers can be spun by increasing applied voltage. A considerable number of thin fibers with diameters <100 nm can be spun with the setting of 12 wt% concentration, 28 kV applied voltage and 15 cm tip–target distance. The crystallinity of the polysulfonamide fibers was measured by X-ray diffraction and its thermal property was investigated based on the thermogravimetric analysis. The experimental data show that the crystallinity and thermal behavior of polysulfonamide fibers can be influenced by the electrospinning parameters, including the solution concentration, applied voltage and tip–target distance, while the applied voltage has no significant effects on the crystallinity of fibers.
Introduction
Electrospinning is one kind of advanced fiber spinning technique used for the production of superfine fibers at nanometer scale; those polymers can be stretched continuously under the electrostatic force, and the spun fibers with diameters ranging from nanometer to micrometer can be formed after the solvent evaporation. Compared with the conventional fibers, the electrospun fibers can be at least one or two orders smaller at the diameter magnitude. As the electrospun fibers have the advantages of large specific surface areas and pores at nanoscale, the products of nanofibers can be used for the filtration [1], sensors [2], coating [3], battery isolation film [4], biomedical applications [5,6], etc. In recent years, more than 100 different types of polymer fibers have been manufactured by electrospinning technique successfully, including some organic synthetic polymers [7], synthetic biodegradable polymers [8], cellulose natural polymers and its derivatives [9], etc.
However, only a few of the investigations on the development of the polysulfonamide (PSA) fibers or composites using electrospinning have been reported. Figure 1 shows the PSA chemical structure. Based on –NHOC and –SO2– groups, PSA can be defined as a kind of heat-resistant polymer [10–12]. It has the advantages of excellent heat resistance, electric insurability, flame retardant property and chemical stability and has been widely used in aerospace and other civil fields with special requirements of flame resistance. Conventionally, the PSA fibers can be spun by wet spinning, with a diameter distribution at the micrometer scale; however, it cannot satisfy some special requirements, such as the filtering of particles at nanoscale and the development of high temperature resistance textiles. Therefore, the development of PSA fibers at the nanometer scale is very useful for the application of expanding of PSA fibers.
The chemical structure of PSA.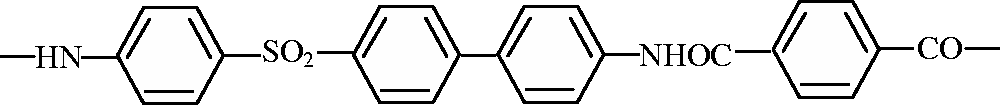
Liu and Xiao [13] presented a new magnetic electrospinning method for the development of the regular aligned PSA fibers. However, the electrospinning techniques used for the PSA solution and its composite fibers are still under investigation and some further study, especially study on the fabrication and characterization of PSA fibers should be conducted comprehensively.
Our research aims to prepare the PSA fibers via electrospinning and investigates the effects of spinning parameters such as solution concentration, applied voltage and tip–target distance on the surface morphology, crystallization behavior and thermal properties of electrospun PSA fibers. Scanning electron microscopy (SEM), X-ray diffraction (XRD) and thermogravimetric analysis (TGA) were used to characterize the properties of the electrospun PSA fibers.
Experimental
Materials
The PSA solution (intrinsic viscosity of 2.0–2.5 dL/g and concentration of 12 wt%) was collected from Shanghai Tanlon Fiber Co. LTD; the dimethylacetamide (DMAC) used as solvent (CP grade) was also supplied by Shanghai Tanlon Fiber Co. LTD.
Equipments and measurements
A high-voltage generator (Model: ES-203, Shanghai Lingshi Electronic Co. LTD) with 0.1–30 kV ± 5% output voltage was used to provide high voltage. A syringe with stainless steel needle (1.2 mm inner diameter, Changzhou Yuekang Medical Equipment Co. LTD.) was used to spin the PSA fibers. The morphologies of PSA fibers were examined using the S-3400N scanning electron microscope.
Preparation of PSA solutions
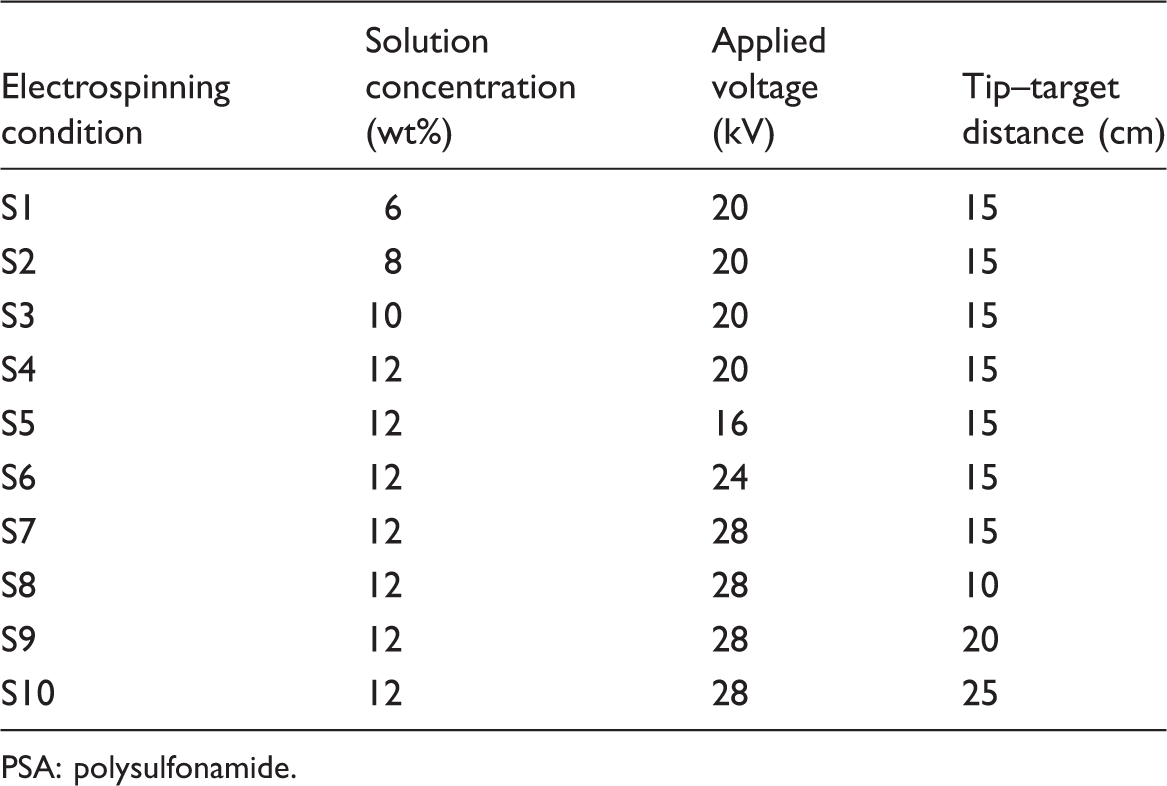
Specifications of the spinning solutions used.
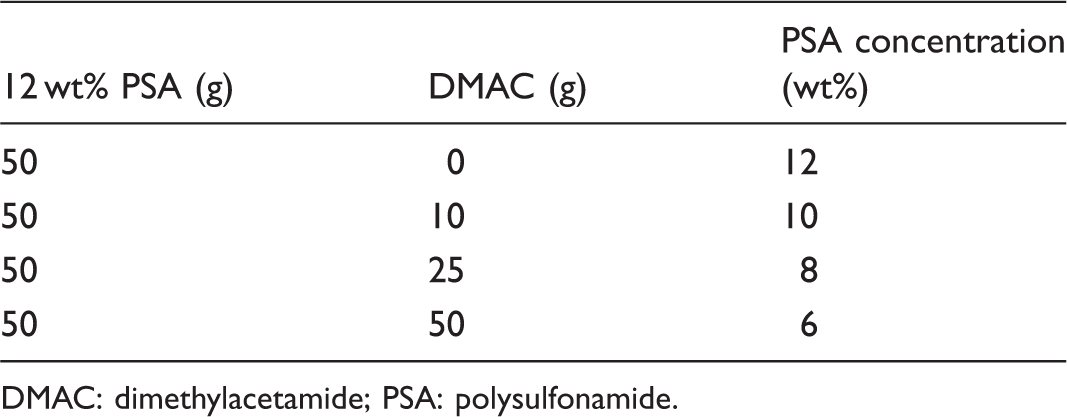
DMAC: dimethylacetamide; PSA: polysulfonamide.
Preparation of PSA fibers
The schematic of the electrospinning set-up for manufacturing PSA fibers is illustrated in Figure 2. The syringe was located horizontally to a metal collector; the collector was wrapped around a rotating drum, which can be controlled by a stepping motor. Tip–target distance was set to be 10 cm, 15 cm, 20 cm and 25 cm, separately. The applied DC potential ranged from 16 kV to 28 kV. The rotation velocity of grounded collector was set at 42 r/min and the flow rate was set at ∼0.1 mL/h.
System set-up of the electrospinning set-up for manufacturing PSA fibers.
Characterization of PSA fibers
The S-3400N scanning electron microscope with a maximum resolution of 4 nm was used for the morphology characterization of the fiber specimen, which was operated at 10–15 kV, the system magnification was around 300,000×. A small section of the fiber mat was placed on the SEM sample holder and sputter-coated with gold (E-1010 coater). The average diameter of the electrospun fibers and its distribution were determined by Image-Pro-Plus software using the SEM pictures captured at the magnification of 5000×.
The crystallinity of the PSA fibers was measured using an XRD instrument (k780FirmV_06, Cu Kα radiation (λ = 0.154 nm)). The XRD experiments were done at 40 kV and 40 mA, with a scan rate of 0.8°/min, the measured diffraction curve was collected by scanning the sample through a range of the Bragg angle (2θ) from 5° to 90°.
Thermal behaviors of the PSA were characterized by TGA, which was performed with a thermogravimetric analyzer (STA PT-1000, Germany). For each sample measurement, 15 mg of PSA small slice was loaded in a platinum pan and scanned at a rate of 20℃/min from room temperature to 700℃ under a dry nitrogen environment with the gas flow of 80–100 L/min.
Results and discussion
Effect of concentration on fiber morphology
The SEM images of the PSA fibers are depicted in Figure 3. Upon increasing the concentration, the fiber morphology changed from spherical beaded shape (Figure 3(a)) to the spindle-like beaded shape (Figure 3(b)) and then to the uniform structure (Figure 3(d)).
Effects of concentration on PSA fibers morphology at voltage of 20 kV, tip–target distance of 15 cm. (a) Concentration of 6wt%, (b) Concentration of 8wt%, (c) Concentration of 10wt% and (d) Concentration of 12wt%.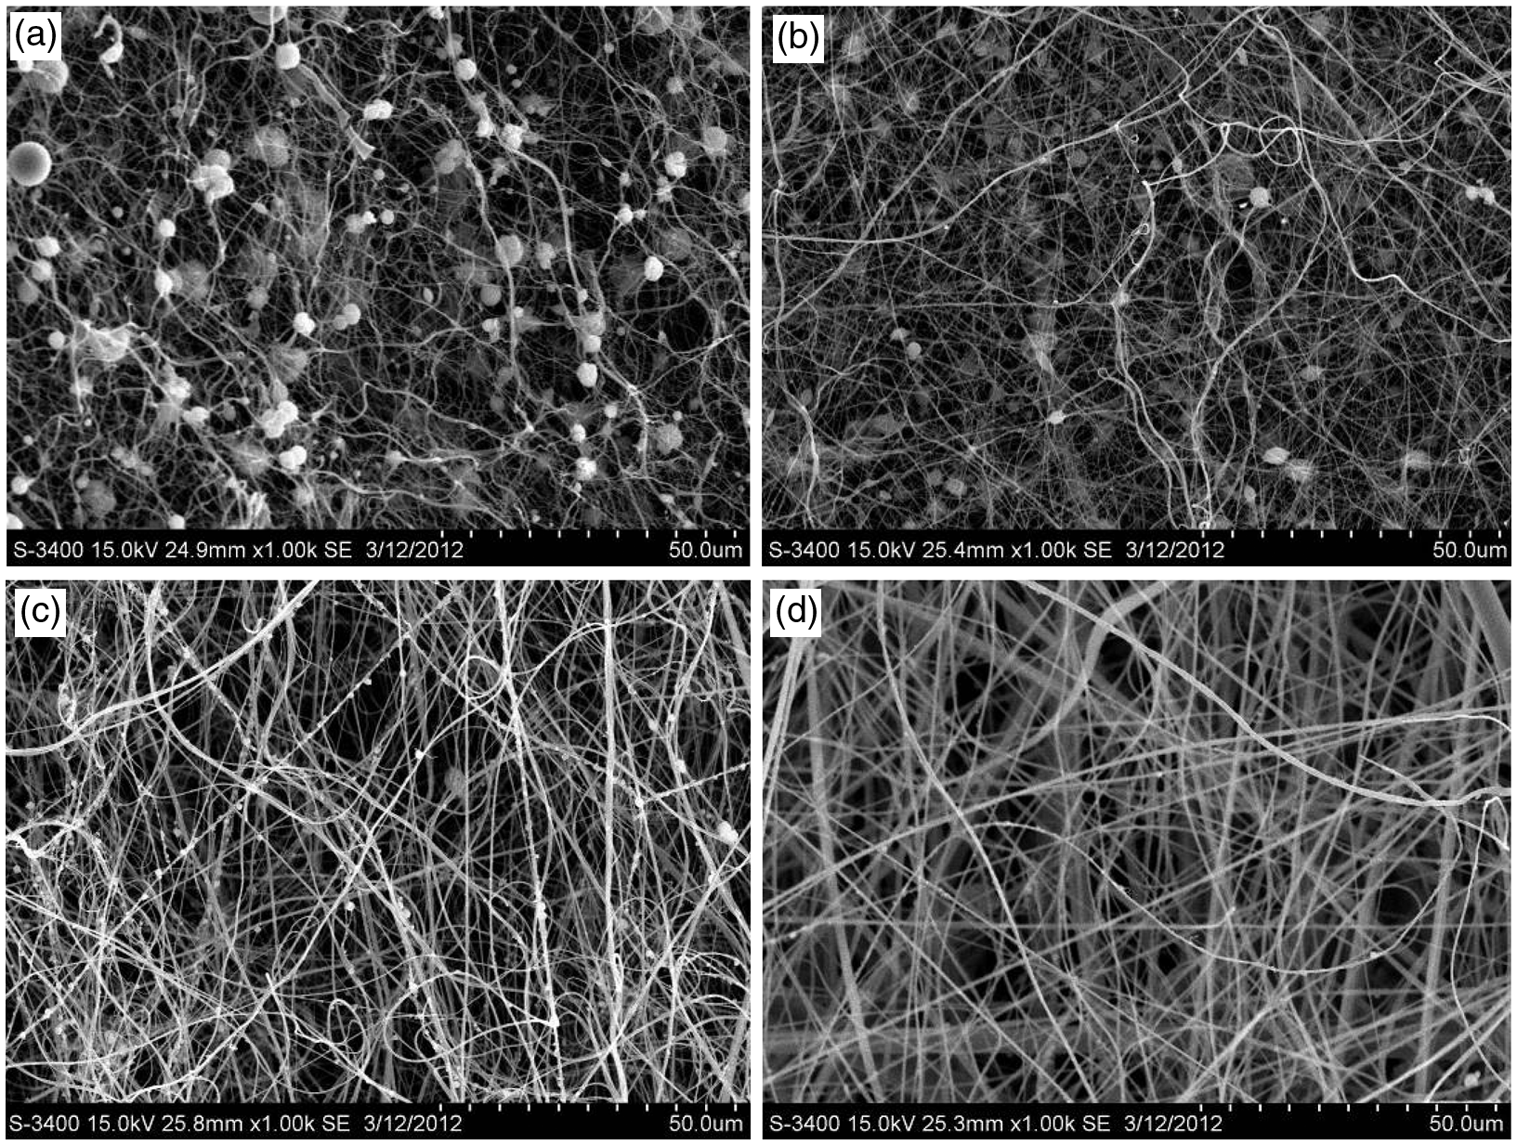
At lower concentrations, the local chain entanglement density was not sufficient to resist the external forces and caused a premature break-up of chain–chain coupling. In addition, the tension acting on the jet was non-uniform and the molecular orientation was different during the electrospinning process. Thus, spherical beaded fibers can be observed (Figure 3(a)) [14]. With the increasing concentration, the chain entanglement density improved, and the shape of the beads changed from spherical to spindle-like (as shown in Figure 3(b)).When the concentration increases further, the break-up among local molecular chains can be controlled effectively and molecules can be oriented along the axial of the jet when the jet is stretched by electric field force, which favors the formation of uniform fiber structures (Figure 3(d)) [15].
It was interesting to find that the average diameter of the fibers decreased gradually with the concentration varying from 6 wt% to 8 wt% (Figure 3(a)); however, the average diameter of the fibers that spun 12 wt% solution was larger than the average diameter of the fibers that spun 10 wt% solution. Some researchers found that the fibers’ diameter is highly correlated with the three orders of the concentration of the spinning solution [16,17].
Effects of voltage on fiber morphology
The morphological structure can be changed by changing the applied voltage. As shown in Figure 4, there was an obvious decrease in average diameter of the fiber and diameter distribution upon increasing the applied voltage. In addition, when the applied voltage varied from 16 kV to 20 kV, the average diameter of fibers changed slightly. In contrast, at voltages >20 kV, there was an obvious change in the average diameter of the fibers.
Effects of voltage on PSA fibers morphology at concentration of 12 wt%, tip–target distance of 15 cm. (a) 16 kv applied voltage, (b) 20 kv applied voltage, (c) 24 kv applied voltage and (d) 28 kv applied voltage.
Many researchers presented the following reasons to explain the voltage effect on the diameter of the fiber during electrospinning [18,19]. One reason is that the net charge density on the surface of the jets increases as the applied voltage increases, the whipping ability of the jets is enhanced and the split ability is also improved, which favors thinner fiber formation; the other reason is that increasing the applied voltage will increase jet velocity and the jets can be solidified quickly on the collector without enough draft. Consequently, a larger average diameter of fibers can be observed.
The results show that the electrospinning for PSA solution is suitable to the first situation. In addition, stable jets can be formed in electric field as the PSA solution conductivity was low, which contributed to narrow distribution of fiber diameter. However, it was impossible to spin the PSA solution if the applied voltage was >28 kV because of the coronal discharge.
Effects of tip–target distance on fiber morphology
It has been observed that tip–target distance had complicated effects on electrospun fiber morphology as illustrated in Figure 5. Regardless of the concentration of the polymer in the solution, low tip–target distance led to a serious adhesion phenomenon among fibers (Figure 5(a)). Increasing the tip–target distance can decrease the average diameter of fibers as seen in Figure 4 (a) and (b). However, a considerable number of thick fibers were found when the distance was improved further (Figure 5(c)). At lower distances, the time is not enough for the jet to fly in the space and the solvent cannot volatilize sufficiently, which leads to the fiber adhesion. In contrast, increasing the distance will increase the volatilization time and the jet can be drafted sufficiently, which favors thinner fiber formation.
Effects of tip–target distance on PSA fibers morphology at concentration of 12 wt%, voltage of 28 kV. (a) 10 cm tip-target distance, (b) 15 cm tip-target distance, (c) 20 cm tip-target distance and (d) 25cm tip-target distance.
However, when the distance increases further, the electric field intensity weakens, which decreases the accelerated velocity of the jet and the tension on the fibers, thus the diameter of the fiber is larger eventually. In addition, we found that when the tip–target distance was >20 cm, there was a slight increase in the average diameter of fibers as seen in Figure 5(d).
Effects of concentration on fiber crystallinity
Figure 6(a) shows the XRD intensity curve of PSA fibers manufactured by the PSA solution with the concentration ranging from 6 wt% to 12 wt%. Figure 6(b) shows the variation between the crystallinity of the PSA fibers and the concentration.
(a) The XRD intensity curve of PSA fibers manufactured by the PSA solution with different concentration and (b) the relation curve between solution concentration and the crystallinity of fibers.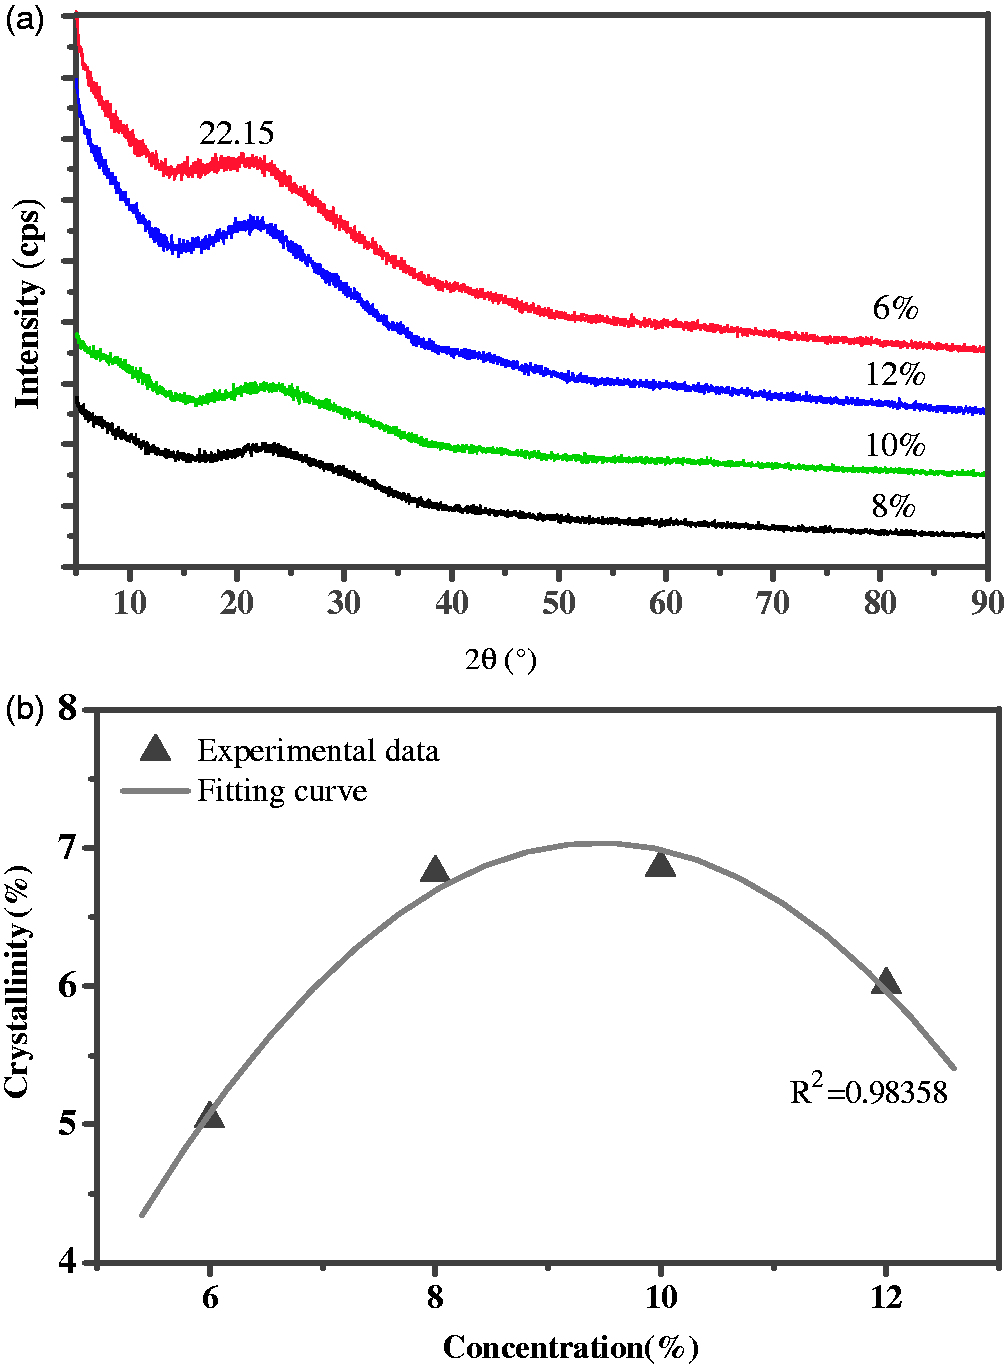
The functional relation between the concentration and crystallinity is shown in equation (1).


Effects of voltage on fiber crystallinity
Figure 7(a) shows the XRD intensity curve of PSA fibers manufactured by electrospinning PSA solution under the applied voltage ranging from 16 kV to 24 kV. Figure 7(b) shows the variation in the crystallinity of the PSA fibers with applied voltage. Equation (3) shows the functional relation between the applied voltage and crystallinity. As shown in Figure 7(b), the crystallinity of the fibers decreases with increasing applied voltage, reaching a minimum of 6.08% when the applied voltage is 28 kV.
(a) The X-ray diffraction intensity curve of PSA fibers manufactured by the PSA solution with different applied voltage (b) Relation curve between applied voltage and the crystallinity of fibers.

Effects of tip–target distance on fiber crystallinity
The experiment results show that the crystallinity of PSA fibers was affected by the tip–target distance. Figure 8(a) shows the XRD intensity curve of PSA fibers manufactured by the PSA solution with the tip–target distance ranging from 10 cm to 25 cm.
(a) The XRD intensity curve of PSA fibers manufactured by the PSA solution with different tip–target distance and (b) relation curve between tip–target distance and the crystallinity of fibers.
There was a dispersion peak at 22.15° and Figure 7(b) shows the variation of the crystallinity of the PSA fibers with the tip–target distance. When the tip–target distance increased from 10 cm to 20 cm, the crystallinity of the fibers increased, reaching a maximum of 7.36% at 20 cm tip–target distance. However, the crystallinity then decreased on further increasing the tip–target distance from 20 cm and the crystallinity decreased to 7.18% when the tip–target distance was 25 cm. In a certain range, the jet had sufficient time to crystallize during flight and the crystallinity of fibers thus increased gradually with the increase in the tip–target distance from 10 cm to 20 cm. However, when the tip–target distance exceeded a certain value, the electric intensity decreased, leading to the decrease in both stretching forces on fibers and applied electric force inducing molecular chain to order.
Effect of different electrospinning parameters on fiber heat resistance
PSA samples manufactured under different electrospinning parameters.
PSA: polysulfonamide.
Figures 9(a), 10(a) and 11(a) illustrate the TG curves, while Figures 9(b), 10(b) and 11(b) show the DTG curves of PSA samples under different concentration, applied voltage and tip–target distance, respectively.
The TG curve (a) and DTG curve (b) of PSA fibers spun by the PSA solution with different concentrations.
The TGA analysis (Figures 9, 10 and 11) of PSA showed that the thermal decomposition of PSA samples was a decomposition process of mass loss. As shown in Figures 9(b), 10(b) and 11(b), when the temperature was at about 100℃, all PSA samples had a high mass loss rate. This was due to the volatilization of DMAC solvent and some water in the PSA samples because of not drying before testing. The curves then gradually changed to be gentle until about 330℃, during which the weight loss was attributed to both the continuing volatilizing of residual DMAC solvent and some tightly bound water in the PSA samples and additives, such as oiling agents added during the preparation of PSA solution. The TG curve of each sample between ∼330℃ and 390℃ was almost a platform.
The TG (a) and DTG (b) of PSA fibers manufactured by the PSA solution with different applied voltages. The TG (a) and DTG (b) of PSA fibers manufactured by the PSA solution with different tip–target distance.

The weight loss of S1, S2, S3 and S4 was 38.82%, 31.5%, 29.5% and 29%, respectively at this stage (Figure 9(a)) due to the decreasing residual DMAC solvent inside the PSA fibers. The TGA curve (Figure 10(a)) of the PSA samples prepared under different applied voltage showed that the mass loss of samples gradually increased from 28.7% to 29% and from 29.5% to 32%, respectively, with the applied voltage ranging from 16 kV to 28 kV. When the applied voltage was increased during electrospinning, the jet flied much faster, which shortened the time of DMAC volatilization between needle tip and collector and more DMAC solvents were contained in the prepared samples. The same mechanism was applied to the samples manufactured under different tip–target distance conditions. As shown in Figure 11(a), the order of samples’ mass loss was 10 cm >15 cm >20 cm >25 cm, suggesting that the sample prepared under the shortest tip–target distance had the highest weight loss. This is because the short tip–target distance reduced the flying time of the jet and DMAC solvent cannot be volatilized sufficiently.
Thermal characteristic parameters from TG curves of the different samples.

TG: thermogravimetric curve; Ti: initial decomposition temperature; T0: epitaxial initial temperature; Te: epitaxial termination temperature; Tf: terminal temperature; α: mass loss ratio.
Thermal characteristic parameters from DTG curves of the different samples.
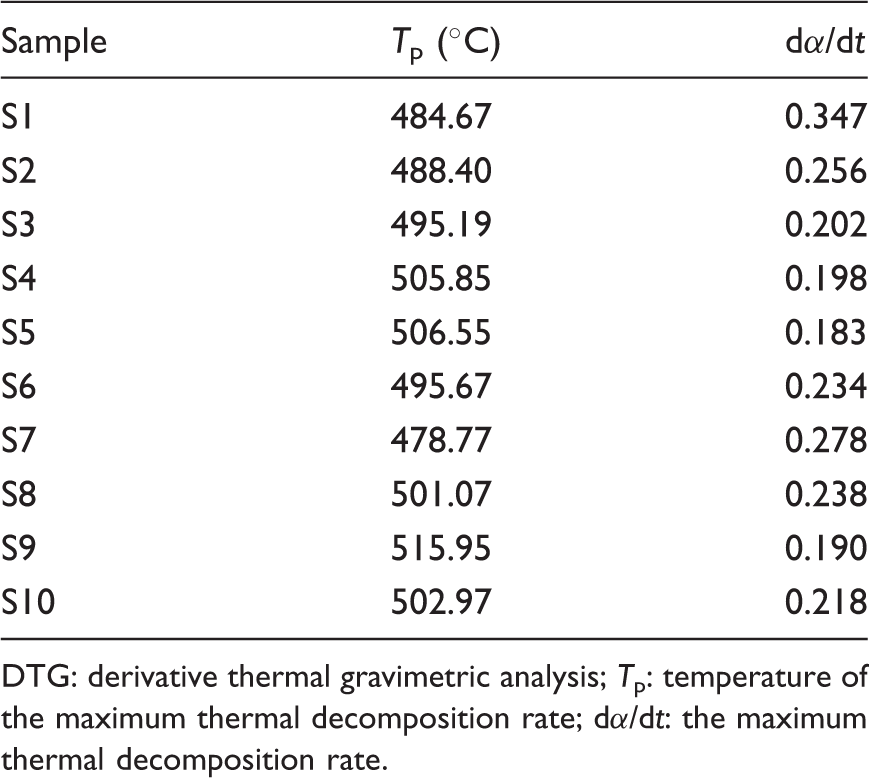
DTG: derivative thermal gravimetric analysis; Tp: temperature of the maximum thermal decomposition rate; dα/dt: the maximum thermal decomposition rate.
Ti is defined as the initial decomposition temperature when the change of accumulation mass can be detected by thermal balance. The point, at which the TG curve begins to deviate from baseline [22], is used to represent Ti. The crossing point between the tangent of descending curve and the extension cord of baseline is T0. Similarly, when the descending curve transforms into a horizontal line, Te means the tangent of the descending curve extended to the horizontal line to form a crossing point. The stability of materials is usually characterized by Ti, T0 and Te. As shown in Table 3, the Ti order of S1, S2, S3 and S4 was same as that of T0 and Te, S1 < S2 < S3 < S4, which indicated that the thermostability of samples gradually increased with the increasing concentration. Besides, the difference between Tf and Ti also showed opposite trend, S1 > S2 > S3 > S4, suggesting that the internal structure of the manufactured PSA samples by the PSA solution with low concentration needed to be completely transformed in a very wide temperature range and the stability of these samples’ internal crystalline structure was correspondingly poor. This was because when the solution concentration was low, fibers with beads distributed along its longitude were manufactured. The schematic model of fibers with beads transferring heat is illustrated in Figure 12.
The schematic heat transferring model of the bead fibers.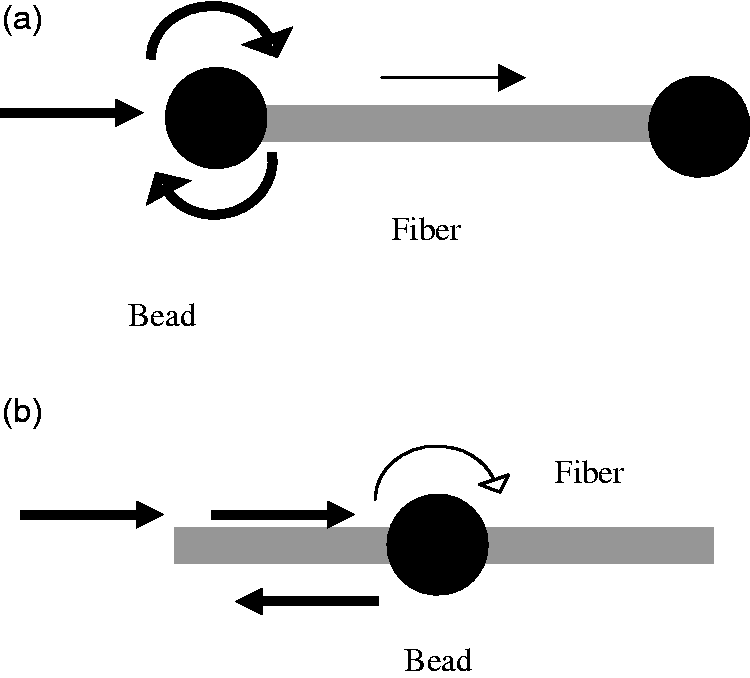
The conductivity of system has significant effects on the thermal decomposition rate of the samples. Bead fibers consist of beads and fibers. The internal structure of beads was different from fibers, which leads to the difference in conductivity. The heat cannot be delivered uniformly and concentrated on either beads or fibers, and then one of them was decomposed when reaching its decomposition temperature. Therefore, the samples of electrospinning low solution concentration showed lower thermal stability and higher weight loss ratio.
On the other hand, the crystallinity also has effects on the thermal stability of PSA fibers. As illustrated in Table 4, the order of the PSA fibers’ Tp was S1 < S2 < S3 < S4, and the order of the PSA fibers’α was S1 > S2 > S3 > S4. It indicates that the fibers spun by electrospinning low concentration solutions have weak crystal structures and low crystallinity, showing poor thermal stability.
Compared with the concentration, the applied voltage showed opposite effect on the PSA fiber’s thermal stability. Based on the comprehensive analysis of Ti, T0, Te, (Tf –Ti), Tp, α and dα/dt, it suggests that the order of thermal stability is S5 > S4 > S6 > S7. Two factors were related to this phenomenon: (1) the crystallinity of PSA fibers gradually decreased with the increasing applied voltage. Compared with the crystal structure, non-crystalline structure demonstrates a relatively weak heat resistance. When the temperature was increased, the non-crystalline structure broke down first. Therefore, the samples with low crystallinity showed poor thermal stability and (2) when the applied voltage increased, the average diameter of fibers decreased and the specific surface area of fibers greatly increased [23], which allowed the fibers to absorb more heat in the same temperature environment. Therefore, the thermal stability of PSA samples decreased gradually when the applied voltage increased.
The comprehensive analysis of S8, S7, S9 and S10 key thermal parameters, Ti, T0, Te, (Tf –Ti), Tp and α showed that the tip–target distance had complicated effects on the thermal stability of PSA fibers. In Table 3, Ti, T0 and Te of PSA fibers were sorted as: S7 < S8 < S10 < S9; (Tf –Ti) and α of PSA fibers was sorted as: S7 > S8 > S10 > S9. In Table 4, Tp and dα/dt followed the order of S7 < S8 < S10 < S9 and S7 > S8 > S10 > S9, respectively. This was an indication that at the beginning of the decomposition stage, increasing tip–target distance can weaken the thermal stability of PSA samples. However, when the tip–target distance increased further, the thermal stability of samples began to be enhanced. This is due to the small average diameter and corresponding large surface area. With the distance increasing from 10 cm to 20 cm, the crystallinity of PSA fibers had the tendency to increase, but the fineness of fibers prepared at 15 cm distance is the smallest and absorbed more heat in the same environment. Therefore, S7 showed the biggest weight loss rate (Table 3) and the worst thermal stability. S10 had similar diameter with S9, but the crystallinity of S9 was higher than that of S10. Consequently, S10 showed more weak thermal stability than S9.
Conclusion
The PSA nanofibers have been prepared by electrospinning technology in this study. The effects of electrospinning parameters on the morphology, crystallinity and thermal stability of PSA nanofibers have been investigated. The experimental results can be summarized as follows:
Upon increasing the concentration, the morphology of PSA fibers can be changed from spherical beaded shape (Figure 3(a)) to the spindle-like beaded shape (Figure 3(b)) and then to the uniform structure (Figure 2(d)). The average diameter of the fibers decreased gradually with the concentration varying from 6 wt% to 8 wt%; however, the average diameter of the fibers spun at 12 wt% solution was larger than the average diameter of the fibers spun at 10 wt% solution. When the applied voltage increased from 16 kV to 28 kV, the average diameter of the fibers decreased gradually and the diameter distribution narrowed. Tip–target distance has complicated effects on the electrospun PSA fiber morphology. When the distance increased from 10 cm to 15 cm, the average diameter of the fibers decreased gradually and the adhesion phenomenon among fibers could be remitted. However, with a further increase in distance to 25 cm, the average diameter tends to increase. Spinning parameters have effects on the crystallinity of PSA fibers. When the concentration ranged from 6 wt% to 10 wt%, the crystallinity of fibers gradually increased. However, with a further increase in concentration, the crystallinity of PSA fibers gradually decreased; the crystallinity of fibers gradually decreased with increasing applied voltage; when the distance increased from 10 cm to 20 cm, the average diameter of the fibers decreased gradually. However, with a further increase in distance, the crystallinity of PSA fibers showed the tendency to decrease. With an increase in PSA solution concentration, the thermal stability of the manufactured PSA fibers gradually increased; when the applied voltage increased, the heat resistance of PSA fibers gradually decreased; the fibers manufactured with 12 wt% solution concentration, 28 kV applied voltage and 15 cm tip–target distance showed the worst heat resistance.
Footnotes
Funding
This work was supported by the Excellent Young Teachers Program of Shanghai Municipal Education Commission (gjd10013); Technological Innovation Fund of Shangtex Holding (Group) Corporation (2011-zx-03-2); Graduate students Innovation Fund of Shanghai University of Engineering Science (2011yjs42); Visiting Scholarship Program funded by the China Scholarship Council(CSC).