
Abstract
In this study, a system was designed and constructed in order to measure the drag force acting on the swimmer simulator. This system must be able to obtain the drag force for a range of swimsuit fabrics to characterize the hydrodynamic properties of swimsuit fabric. In this system, a DC motor was used as the propelling unit; also a voltmeter and an ammeter were applied to measure the input power of motor. To find the relationship between input powers and drag force, calibration was done. The simulator was made from wood in two different sizes. The samples of fabrics were prepared from three kinds of weft knitted fabrics, which are common in production of swimsuits, and were knitted from polyamide6 (nylon), polyamide6-elastan (nylon-lycra) and polyester. The statistical analysis of results show the importance of fabric surface properties and swimsuit design on swimmer’s performance, so clothing engineering and technical clothing design can play a key role in sport engineering.
Introduction
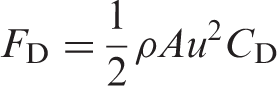
While an object is moving through a fluid, a resistant force from the fluid on the opposite direction is acting on it, which retards the movement. This force is called drag force. The forces that provide resistance against the swimmer movement in the water or the runner and cyclist movement in the air are examples of the drag force. The mathematical expression of drag force (FD) is presented by equation (1).
The drag force can play a key role in swimming, especially in swimsuit design. Hence, the swimsuits might play a significant role in reducing the drag force [2].
In the early days of organized swimming, suits were designed just to cover the body [3]. Notably, in the early 18th century, wool and flannel were chosen as a suit fabric covering almost the entire swimmer’s skin [2]. It was highly absorbent, did not fit particularly well, and caused drag. The suit did not have elasticity and would easily wrinkle or form air pockets and slow down the swimmer [3]. After the World War II, polyamide6 (nylon) replaced the silk and wool in major events’ competitive suits. In 1990s, swimsuits continue to evolve to mimic skin and the elastan (lycra) was introduced and quickly became popular. In 2000s, Speedo launched the full-body Fastskin swimsuit based on so-called Shark Skin pattern and mimicked in V-shape ridges. Since Beijing Olympic 2008, almost all major manufacturers introduced full-body swimsuits made of polyurethane combined with elastan (lycra) fabric. One of the most submitted swimsuits of these categories is LZR Racer [2]. In order to measure the drag force and study about swimsuits, many research have been undertaken.
Drag force can be measured as passive drag or active drag. Passive drag is the resistance by the water that an object experiences in an unchanging position and active drag is the water resistance related to the swimming motion [1].
Raberts et al. [4] used two water jets to supply water flow in a swimming flume. The swimmer was fixed in the specific depth of water in a horizontal position below the water surface in the flow while is grapping a nylon handle attached a tethering cable. The tension of this cable was measured as a drag force.
Buder and Odenwald [5] used a manikin instead of swimmer in the flow. In these studies, passive drag was measured.
Toussaint et al. [6] cited Hollander et al. developed an approach to measure active drag named MAD-system in 1986. This system allows the swimmer to push off from fixed pads with each stroke. If a constant swimming velocity is maintained, the mean propelling force equals the mean total drag force. In another study, Kolmogorov and Duplishcheva [7] used velocity perturbation method (VPM) to measure active drag. In this method, swimmer swims 30-m lap twice in maximal effort: once swimming ‘free’ and once swimming while towing a hydrodynamic body that creates known additional resistance. Under this assumption that in both swims the power output to overcome drag is maximal and constant, active drag can be calculated.
Many researchers have studied about performance of swimsuits, some of them believe suits affect the drag force [2], but others do not believe it [4]. The particular aim of this study was to construct a system in order to measure the drag force. This system must be able to measure and detect the difference between the drag forces of fabrics. Hence different fabrics used in the experiments.
Experimental
Measuring active drag is more realistic than passive drag, but it has disadvantages that cannot be negligible, for example swimmer’s technique, swimmer’s exhaustion, and other human factors’ effect on results. In this study, passive drag was measured using simulator swimmer.
Construction of drag force measuring system
In order to obtain hydrodynamic properties experimentally for a range of swimsuit fabrics, a drag force measuring system was designed and constructed. This system was made of a DC motor to pull the manikin, and a voltmeter whit 0.01 volt precision and an ammeter whit 0.01 Ampere precision to measure input power of motor. The manikin was pulled using a nylon cable and two pulleys were used to guide the cable, and two nylon rails crossed the middle of the manikin to direct it through the path. All experiments were done in a frame work, which had 3 m width, 4 m length, and 0.5 m depth. The manikin was streamlined and fixed 0.25 m below the water surface using rails, as shown in Figure 1. The nylon cable and the rails had no deformation in these experiments.
Schematic view of drag force measuring system.
Calibration system
The input power of motor was measured as propulsion at constant speed. The propulsion will be in balance with drag [8]. The input power was calculated using input voltage and input electric current. A calibration system was designed to find the relationship between input power and drag force. The relationship between input power and output power is discussed. The efficiency and free rotation power of motor are studied and then the effect of intermediate pulley is calculated.
Relationship between input power and output power
The input power (Winput) was calculated according to equation (2).

Also, the output power (Woutput) is power required to pull the object in determined speed. The output power does not equal input power because the efficiency of motor is not 100% and input friction of motor is not negligible. The output power was calculated by cable’s tension (F) and manikin’s speed (U), according to equation (3).

To find the relationship between input power and output power, an object with determined weight was pulled on a smooth plate and the cable tension was measured using two mechanical force gauges 1 ± 0.01 N for low weight and 2 ± 0.5 N for high weight, as shown in Figure 2. The time for the object to travel a determined distance was obtained, and then the speed of object movement calculated.
Schematic view of calibration system.
Every experiment was repeated 15 times because the 15 times has a good accuracy and a narrow tolerance in 95% confidence level (5.02 ± 0.04 watt). Thus, 15 amounts were obtained for each parameter (input voltage, input electric current, cable’s tension and speed of object). Then object was replaced by a heavier weight and same steps were performed again. Information of every experiment gave a point of input power–output power diagram; it was used as calibration diagram as shown in Figures 3–7.
Calibration for low weight in u = 0.12 m/s. Calibration for low weight in u = 0.21 m/s. Calibration for low weight in u = 0.40 m/s. Calibration for high weight in u = 0.24 m/s. Calibration for high weight in u = 0.40 m/s.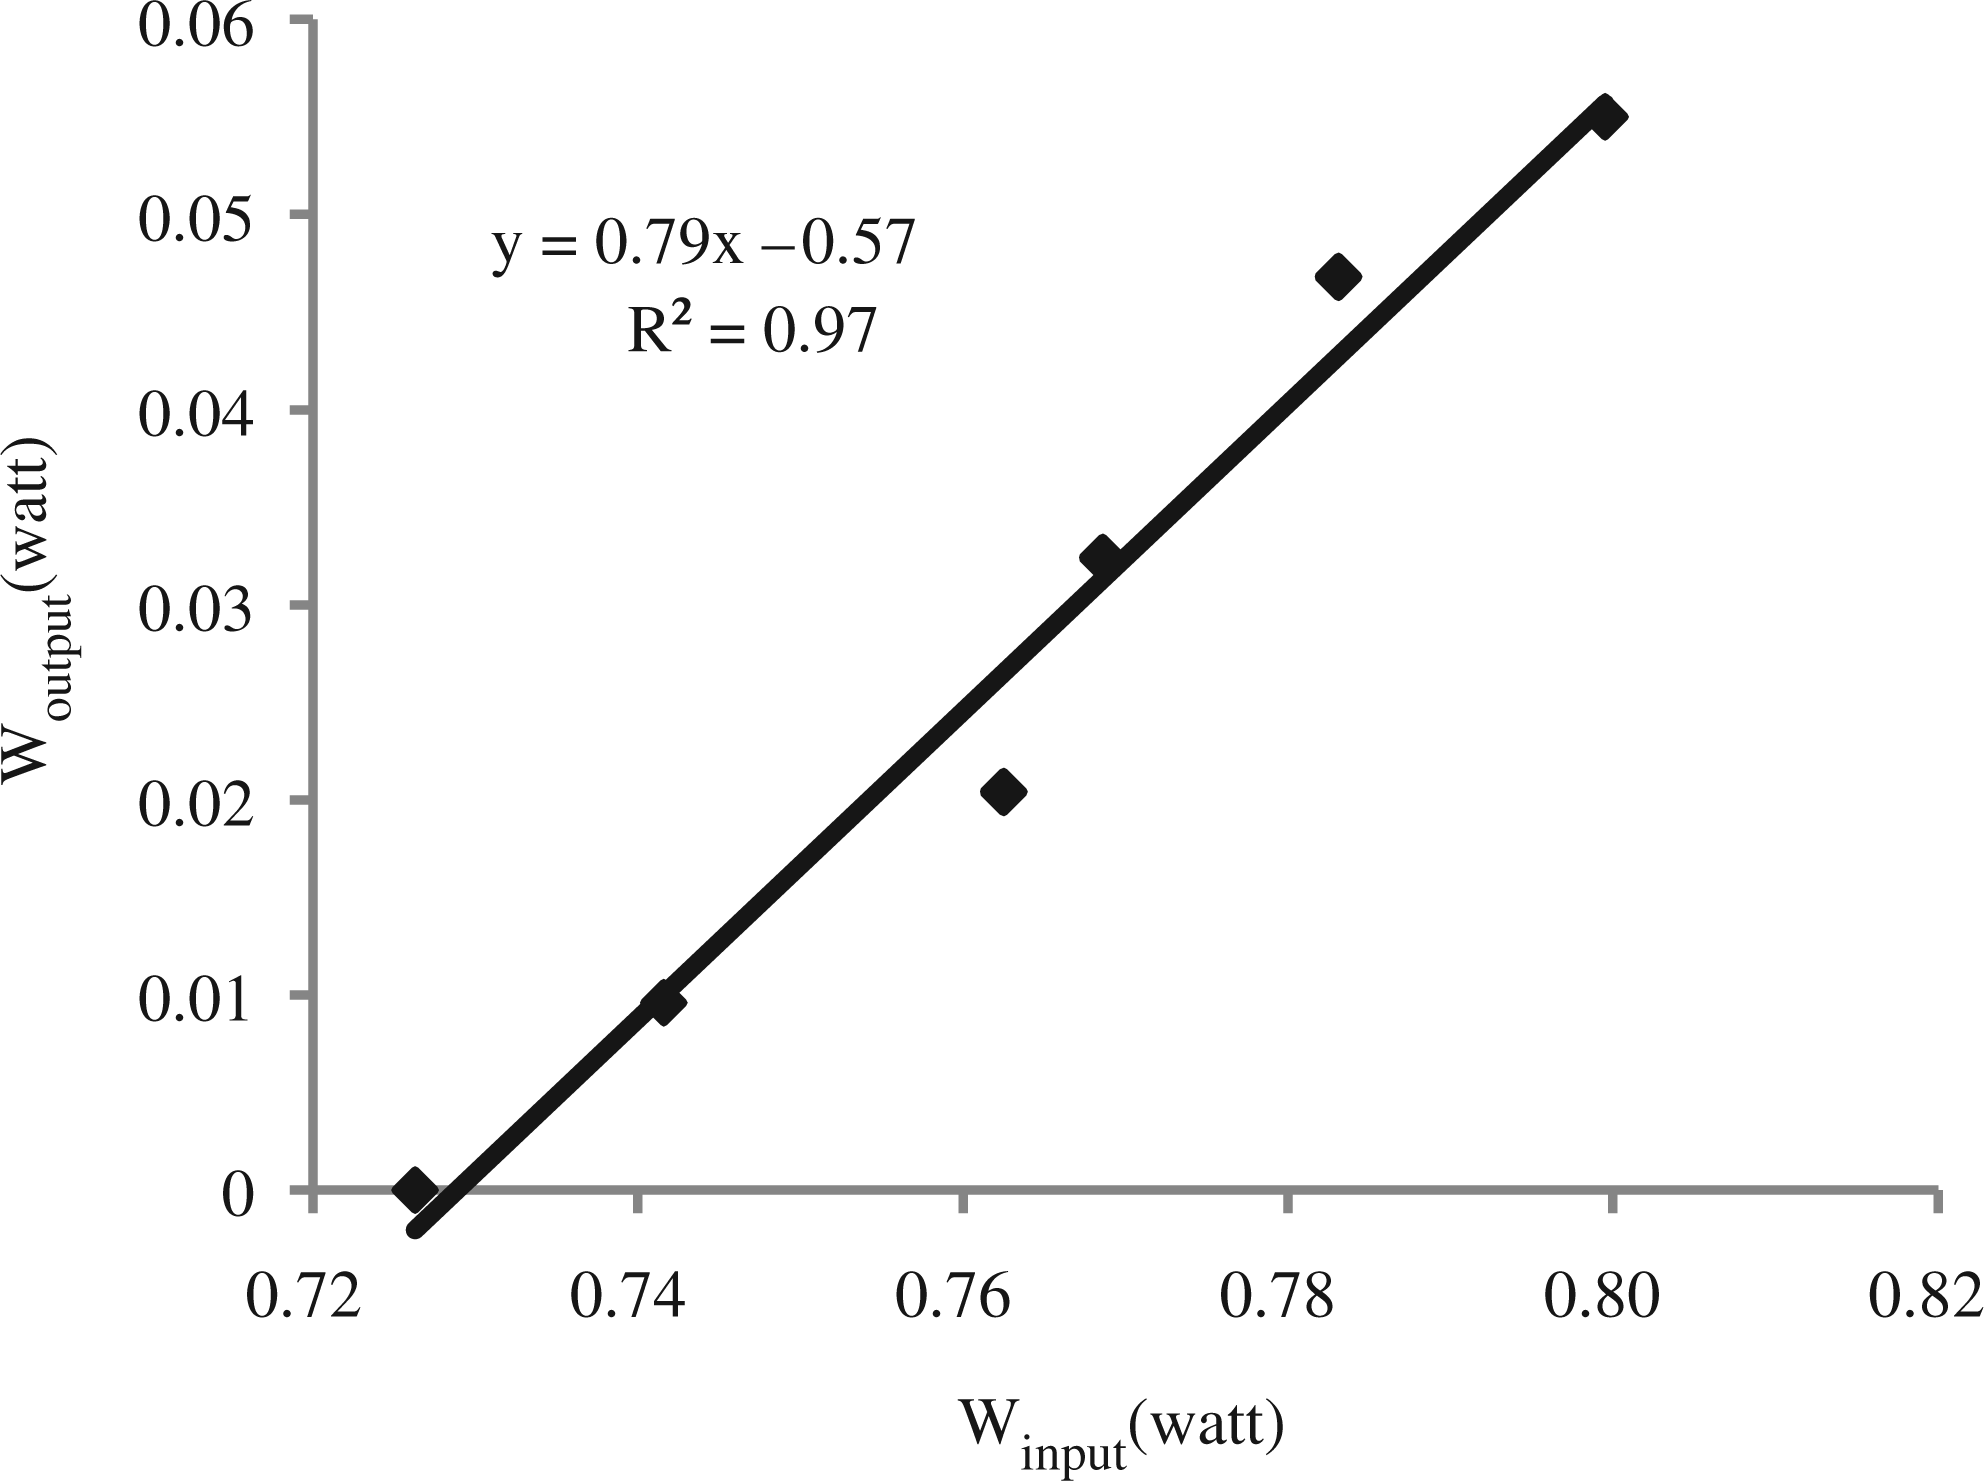


The manikin was made in two different dimensions; therefore, the calibration process was performed for two ranges of weight (low and high). Also, calibration process was carried out in three different speeds for low-weight ones and two different speeds for high-weight ones. Speed of low-weight calibration was 0.12 m/s, 0.21 m/s, and 0.40 m/s and for high-weight calibration 0.24 m/s and 0.40 m/s.
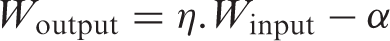
As shown in Figures 3–7, the relationship of input power and output power was linear. The slope of the lines shows the efficiency of the motor (η), and the intercept (α) is the free rotation power. The free rotation power is a power which the motor uses when no load is applied. So the relationship of input power and output power would be as equation (4).
The relationship between efficiency and speed
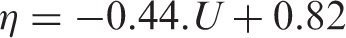
The dependence of efficiency on speed was studied as shown in Figure 8. In many cases, the regression coefficient (R-square) is not an appropriate scale to evaluate the accuracy for a few data. When there are a few data, the error is an appropriate scale. In this case, ‘the average error (Ē)’ and ‘the maximum error (Emax)’ are well, and diagram is linear. To simplify the calculation, the relationship between efficiency and speed was obtained, and efficiency would be as equation (5).
Relationship between efficiency and speed.
The relationship between free rotation power and speed. Also ‘the average error (Ē)’ and ‘the maximum error (Emax)’ are reported in the case of Figure 9, both of them are well and diagram is linear. The free rotation power in different speeds can be calculated using equation (6).
Relationship between free rotation power and speed.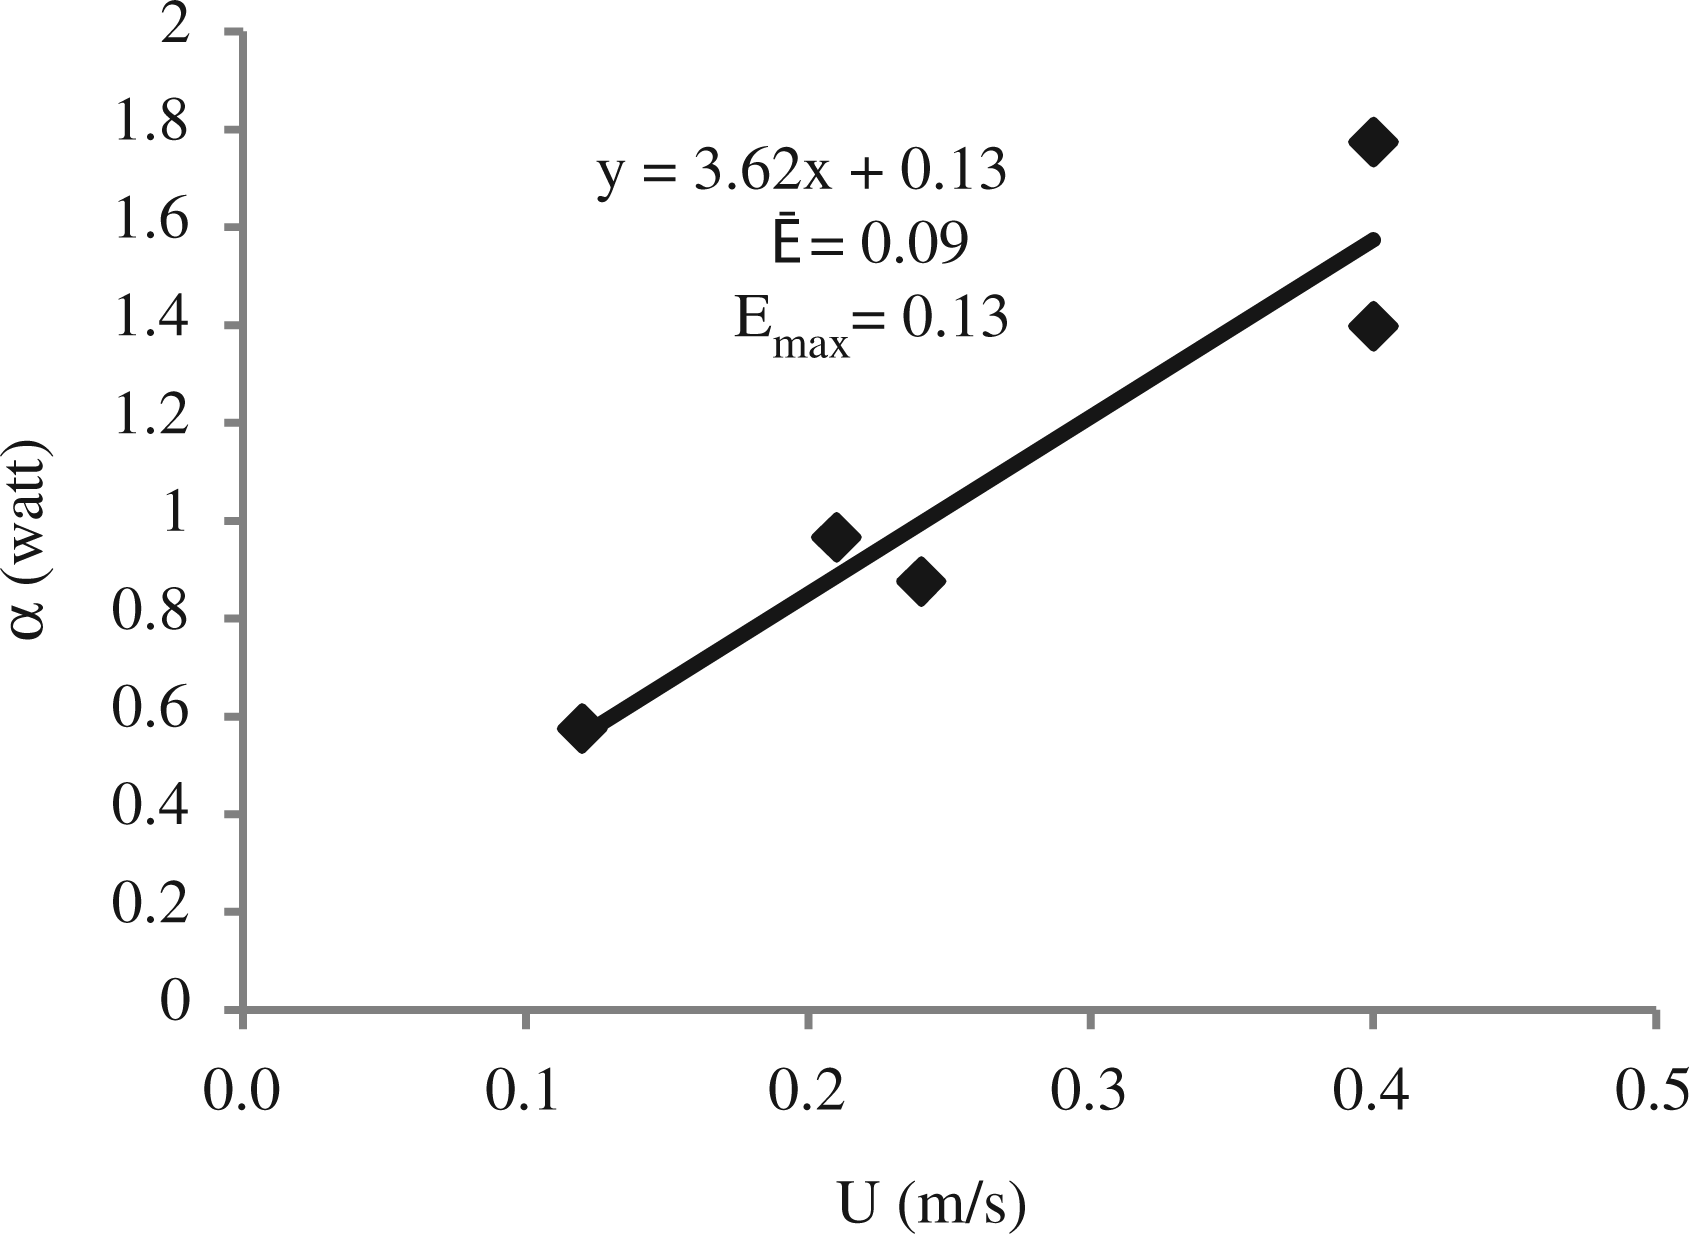

The effect of the intermediate pulley
As mentioned previously, an intermediate pulley was used to guide the nylon cable (see Figure 1). The friction between nylon cable and intermediate pulley causes an additional force which affects the drag force. In order to eliminate this effect, the calibration process was performed in presence of the intermediate pulley, as shown in Figure 10.
Schematic view of calibration system in presence of the intermediate pulley.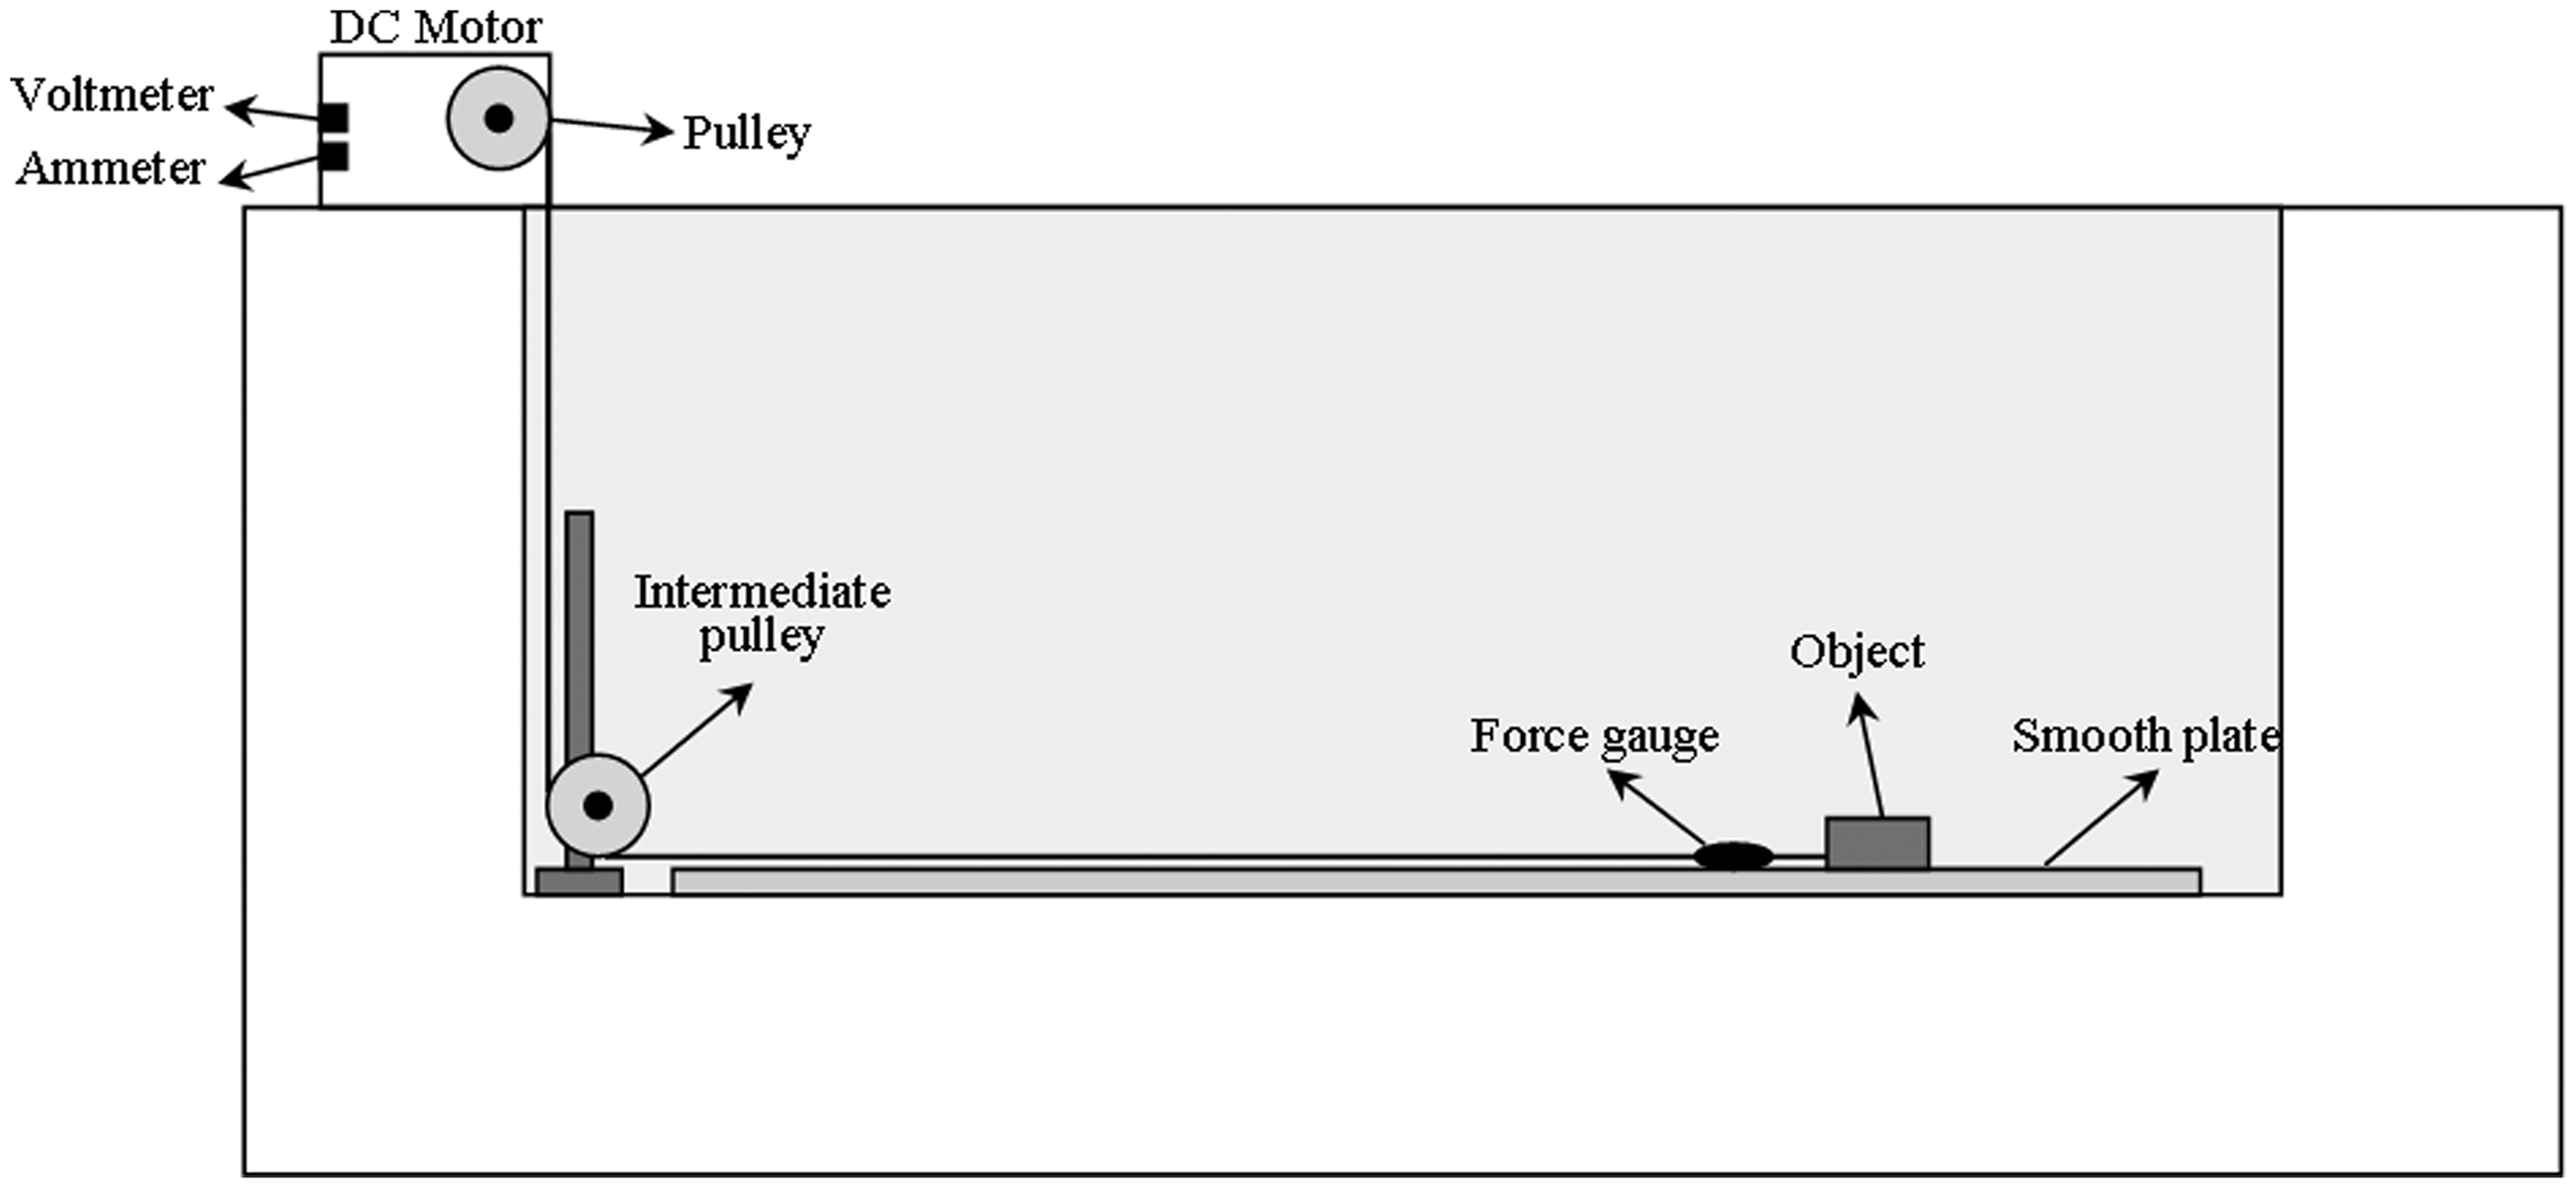
The tension of cable after passing the intermediate pulley (F2) was considered according to equation (7).
The tension of cable before (F1) and after (F2) passing the intermediate pulley.

Description of wooden manikin
The swimmer simulator was a wooden manikin that was made in two different dimensions; the smaller one had 7 cm width, 14 cm length, and 4 cm thickness, and the other one had 14 cm width, 28 cm length, and 8 cm thickness. The form of manikins was like spindle to simulate the body of swimmer as illustrated in Figures 12 and 13.
A view of small manikin. A view of large manikin.

Description of swimsuit fabrics
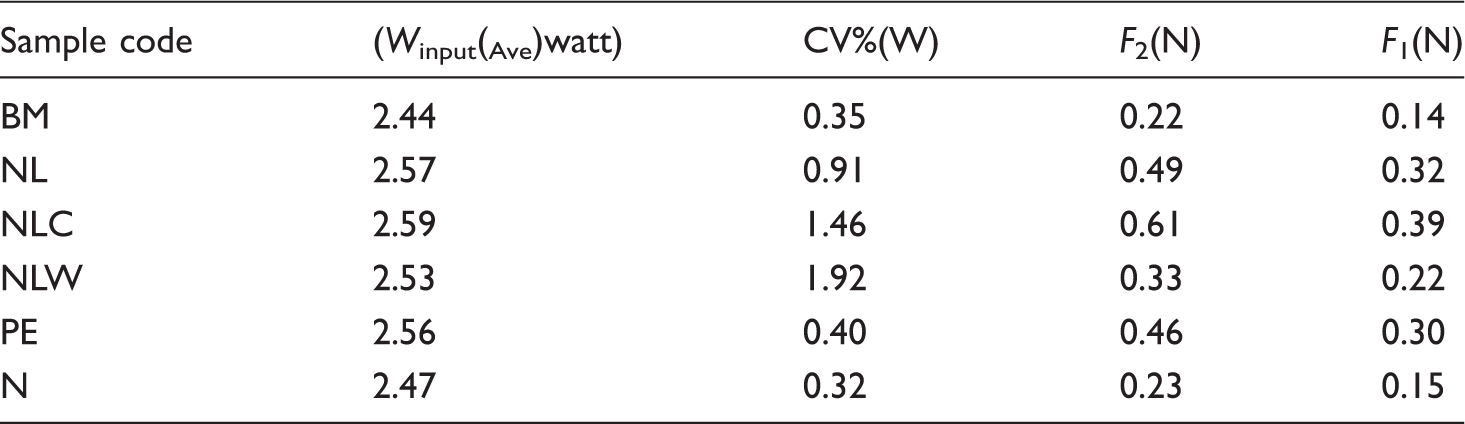
Three plain weft-knitted fabric were selected for this study as they are formally used to manufacture swimsuit. In the case of polyamide6-elastan (nylon-lycra), the elastan yarn and polyamide6 yarn were used in the first and second feeders of the knitting machine, respectively. Five samples were made with these fabrics to measure their drag force. Three simple (no creased) samples were made with these fabrics. The polyester sample and the polyamide6-elastan (nylon-lycra) sample were prepared to study the effect of fiber kind, and the polyamide6 (nylon) sample was prepared to study the effect of stitch density as shown in Figure 14. A creased sample was designed to study the effect of clothing design as shown in Figure 15. To study the effect of fabric cut direction on drag force, another sample was prepared with its fabric cut on the wale direction, see Table 1.
The samples were made to study the effect of fiber kind and fabric structure. (a) Polyamide6 (b) Polyamide6-Elastan (c) Polyester. The polyamide6–elastan sample which was creased. Properties of different samples. This sample for small manikin was prepared with back technical face and for large manikin was prepared with front technical face.


In order to compare the hydrodynamic performance of the fabrics, the bare manikin was tested. Later, the manikin was wrapped with the samples that were tested with the same test conditions as was in the case of bare manikin.
Measurement method
The drag force measuring system was used to measure the hydrodynamic properties of samples. The frame work dimensions are 3 m wide, 0.5 m deep, and 4 m long, and the manikin was streamlined and fixed 0.25 m below the water surface (see Figure 1). Also, the experiments were done in three different speeds for small manikin (0.12 m/s, 0.21 m/s, and 0.40 m/s) and two different speeds for large manikin (0.24 m/s and 0.40 m/s).
The bare manikin was tested, later the manikin was wrapped with one of the samples and experiment was done with the same condition as was in the case of bare manikin. Each experiment was repeated 15 times because the 15 times has a good accuracy and a narrow tolerance in 95% confidence level (5.08 ± 0.04 watt). The speed of movement, the input voltage, and the amount of input electric current of motor were obtained. The efficiency and the free rotation power for each speed were calculated using equations (5) and (6). The Woutput and Wmanikin and the cable tension were calculated by using equations (3), (4), and (5), respectively. The drag force calculated considering the effect of intermediate pulley by using equation (7).
For example, in order to calculate the drag force of polyester sample, the small manikin was wrapped with polyester sample and was tested. It was towed in 0.21 m/s and these amounts were obtained:
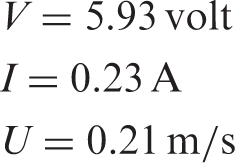
So the efficiency and the free rotation power would be calculated as:

Also the Woutput, Wmanikin, and the cable tension were calculated:

The drag force was calculated:

Results and discussion
Drag force data for small manikin in u = 0.12 m/s.

Drag force data for small manikin in u = 0.21 m/s.

Drag force data for small manikin in u = 0.40 m/s.
Drag force data for large manikin in u = 0.24 m/s.

Drag force data for large manikin in u = 0.40 m/s.

The results statically were analyzed using SPSS (ANOVA). The drag force for various samples and speeds were significantly different. The results showed the system can detect and measure the difference of drag forces. As mentioned, to study the effect of fibers kind on the drag force, three samples with different fibers were used. All the other factors in the experiments were the same.
The statistical analysis of the results showed fibers kind significantly affects the drag force. The polyester sample leads to the highest drag force. That must be due to the bubbles which appeared on the surface of polyester fabric in the water which could not be removed. Also the trapped air between the polyester fabric and the body increases the drag force [3]. The drag force of the polyamide6 (nylon) sample was less than the others, because the number of course per cm (CPC) and number of wale per cm (WPC) of this fabric were less than the others, which makes it less uneven and decreases the surface resistance. Also, the weight of polyamide6 fabric was less than the nylon-lycra (NL) and polyester (PE) and it could affect the drag force. According to the ANOVA analysis, the drag force of the polyamide6-elastan (nylon-lycra) creased sample was significantly more than the simple (no creased) one. That is because the creases lead to larger frontal area and more resistance, also small creases make an uneven surface which increases the surface resistance. Another reason is the trapped air between the creases and the manikin which increases the drag force. It shows the design of swimsuit affects the drag force acting on the swimmer. Two polyamide6-elastan (nylon-lycra) samples that were cut in wale and course directions for large manikin were prepared with the front technical face. The results showed the wale direction leads to more drag force. The polyamide6-elastan (nylon-lycra) sample which was cut in wale direction for small manikin was prepared with the back technical face; the drag force of it was less than the sample which was cut in course direction and prepared with the front technical face. Results of large manikin showed the wale direction leads to more drag force, so in this sample the drag force of the nylon-lycra wale (NLW) was less than the NL because the back technical face leads to less drag force so the technical face of fabric has a great effect on drag force. According to the results, it is concluded that the swimmers’ swimsuits must not be creased or have an uneven surface, because these factors increase the surface resistance and lead to larger swimmer frontal area. Also, the surface bubbles and air trapping between the swimsuit and the body can lead to more drag force and decreases the swimmers’ speed, that is why the polyester fabrics used in these experiments was not suitable for swimsuits. Within the fabrics used in these experiments, the drag force measured for polyamide6 and polyamide6-elastan fabrics were less than the others.
Conclusion
The following conclusions are drawn, based on the experimental work presented here:
The system can measure and detect the difference of drag forces. Kind of fiber has significant effect on drag force, for example, the drag force of polyester fabric is more than the polyamide6-elastan (nylon-lycra). The drag force of polyamide6 which has less stitch density is significantly less than the others. The drag force of the creased sample is more than the simple (no creased) one; it shows the design of swimsuit affects the drag force. The technical face of fabric has significant effect on the drag force and back technical face leads to less drag force. The direction of cutting has significant effect on the drag force and wale direction leads to more drag force.
The results show the effect of fabric surface properties and swimsuit design on swimmer’s operation, so clothing engineering and technical clothing design can play a key role in sport engineering.
Footnotes
Funding
This research received no specific grant from any funding agency in the public, commercial, or not-for-profit sectors.