
Abstract
An equation was developed to predict the morphology of aramid fibers using dissolution time (t) data of Kevlar and Nomex multifilament yarns, which were heat set at various temperatures. The degree of crystallinity of the fibers was characterized by WAXS and the dissolution time of the samples was measured. The degree of crystallinity and dissolution time of the fibers increases with both heat treatment time and heat treatment temperature. The coefficient of correlation between
Keywords
Introduction
Degree of crystallinity of fibers can be studied by density measurement, differential scanning calorimetry (DSC), and X-ray diffraction (XRD). In case of XRD, the degree of crystallinity is given by integrated intensity under the sharp peaks divided by the integrated intensity of the whole specimen. The technique is highly specialized, requiring extensive operator training and expensive instruments [1–4]. Thermal analysis measures temperature changes of a sample during a constant rate of heating or cooling. The area under the endothermic peak is measured. The degree of crystallinity of the sample is calculated based on the change in the enthalpy of the specimen filament yarn divided by the change in the enthalpy of the fully crystalline filament yarn. The instrument for thermal analysis is also quite expensive. In the case of density measurement, two liquids are mixed to make a gradient column of varying density [5]. The column is first calibrated using calibration balls. The filament yarn density is known from a graph of density and height of the calibration balls. The degree of crystallinity (χc) of the filament yarn can be calculated from the following equation:

Dissolution time (t) technique involves loading a filament loop with a weight. The loaded loop is submerged in a solvent of known concentration kept in a tube at a constant temperature. The time needed for the weight to fall to the bottom of the tube is measured in seconds, which is termed as critical t [6–19]. The solvent concentration and temperature are such that filament yarn degradation does not take place. Log t was shown to have linear relationship with density for polyethylene terephthalate filament yarn with a correlation factor of 0.98 [12]. The diffusion rate of the solvent depends on the diffusion coefficient, which could reflect the morphological structure of the fiber. Hence, t could be used to study the morphology of the filament yarns. Most of the t data have been reported for polyester and nylon 6 multifilament yarns [6–17]. Although the t technique could be used for other fibers too, till date, t technique has never been investigated for Kevlar and Nomex filament yarns. The degree of crystallinity of aramid filament yarns can be affected by heat setting. So t technique can serve as an alternative technique to study degree of crystallinity of aramid filament yarns. The study tries to assess the morphology of control and heat set aramid filament yarns based on t. So that, just by knowing the t of the sample fiber, one can evaluate the degree of crystallinity of the fiber, using a novel proposed formula in a relatively short time.
The objectives of this study were as follows: heat set the Kevlar and Nomex multifilament yarns and measure their degree of crystallinity using WAXS; measure the ts of Kevlar and Nomex multifilament yarns experimentally; correlate the t with the X-ray degree of crystallinity of the aramid filament yarns, and to deduce a novel equation to predict the degree of crystallinity of the aramid filament yarns from t. So the equation can serve as an alternative technique to predict the degree of crystallinity of the textile fibers, as the prevalent techniques such as WAXD and DSC are quite expensive and need extensive training to operate.
Materials and methods
Fibers and solvents
Aramid fibers are widely used for protective clothing; hence Kevlar and Nomex aramid multifilament yarns were used in the study. E.I. Du Pont supplied the samples of regular Kevlar and Nomex aramid multifilament yarns. Denier of regular Kevlar multifilament yarn was 1500 and Nomex multifilament yarn was 1200. Solvents used for dissolving the yarns as per AATCC Test Method 20 were as follows: 96% H2SO4 for Kevlar and Nomex aramid multifilament yarns [19]. All the solvents were purchased from Fisher Scientific.
Thermal treatment
Measurement of t
Heat set multifilament yarn samples were gripped by an automatic filament-lowering device. It eliminated loop formation during t measurement. The filaments were loaded with a weight of 6 g and then submerged in 125 ml of the solvent. Time, from the moment the yarn touches the solvent to the moment the weight falls down, was measured in seconds by a stopwatch, which can measure up to 1/100 of a second, and is termed as more simply and appositely as t.
Measurement of X-ray crystallinity
The degree of crystallinity of the samples was measured by the powder X-ray technique [1–4]. The samples were converted into a powder form and irradiated with an X-ray beam having a wavelength of 1.54 A° in vacuum using a copper anode. Electron beam was accelerated by a high voltage of 40 kV. The scattered intensity was measured between 2θ = 10° to 50°.
In the internal comparison method, it is assumed that scattering within sharp features are associated with crystalline regions, and diffused featureless background is characteristics of amorphous regions. The degree of crystallinity was determined by the formula χc = Ic/(Ic + Ia), where Ic and Ia were the total integrated intensities under all the crystalline peaks and in the diffused halo of the diffractogram, respectively. The area under the peaks was divided by the total area under the curve to get the X-ray degree of crystallinity of the sample.
Experimental design and statistical methods
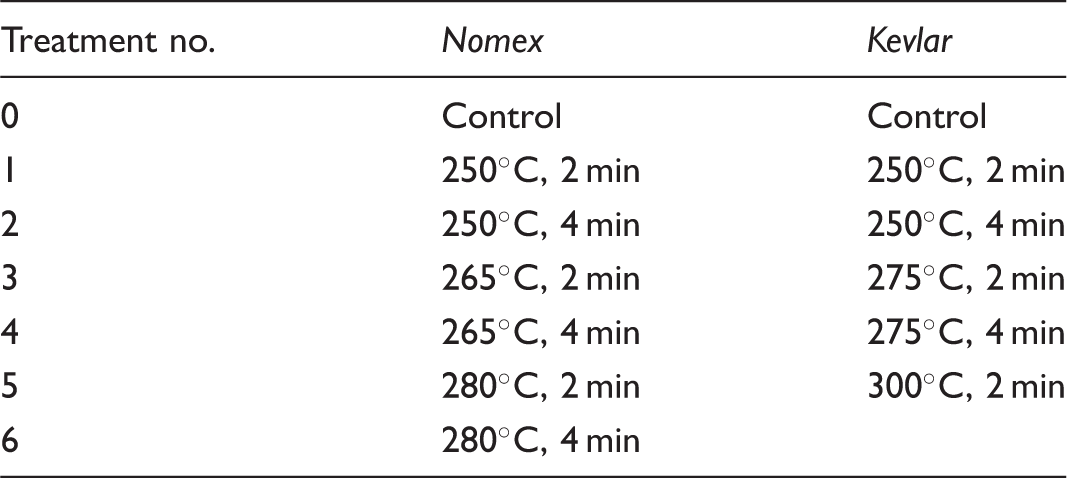
Multifilament yarns were heat-set at various temperatures, as suitable for each type of filament yarn. A factorial treatment structure, with factors time and temperature, was followed.
The experimental design was randomized complete block design. A block was a long length of multifilament yarn and that was chopped into several pieces. The experimental unit was a piece of multifilament yarn, to which a treatment is assigned. The treatments were assigned to the filament yarn pieces within a block in a completely random order. There were five blocks for each type of filament yarn. Experiments were conducted separately on the two types of filament yarn.
Measured responses were t and X-ray degree of crystallinity (χc) of control and heat set samples. There were 10 measurements of t for each experimental unit and one measurement of X-ray degree of crystallinity for each treatment. The relationship between t and X-ray degree of crystallinity was modeled using simple linear regression and correlation techniques [22]. Mean of the 10 t measurements on each experimental unit was considered as the response variable and X-ray degree of crystallinity as the explanatory variable for regression analysis. Plots of the t means against X-ray degree of crystallinity were constructed, and various transformations of the variables were considered to improve the linearity of the relationship. Finally, inverse regression techniques were used to develop 95% prediction intervals for predicting X-ray degree of crystallinity at various values of t means [22].
Results and discussion
Effect of thermal treatment
The X-ray degree of crystallinity for Nomex.

The X-ray degree of crystallinity for Kevlar.

As the temperature was increased from 250℃ to 300℃ keeping the heat treatment time 2 min, the X-ray crystallinity of Kevlar multifilament yarn increased by up to 57% over the degree of crystallinity value of control samples. Morphological structure of the heat set fiber changes through crystallization, so as to have lower potential energy. The development of the crystallinity was much more significant in case of Kevlar multifilament yarn than for Nomex multifilament yarn. It might be that Kevlar is a more symmetric polymer and crystallizes to a greater extent during heat setting than Nomex. For a particular heat treatment temperature, with the increase in the heat treatment time from 2 min to 4 min, there was a rise in the degree of crystallinity of up to 5% over the degree of crystallinity value at 2 min.
Degree of crystallinity has been shown to increase with heat treatment temperature and heat treatment time for polyethylene terephthalate filament yarn [12,23,24]. The degree of crystallinity reached a maximum value at the highest heat treatment temperature, and the highest heat treatment time for both the aramid multifilament yarns, with in the range of heat setting temperatures, and heat setting times.
Average of 50 dissolution time (t) values for Nomex.
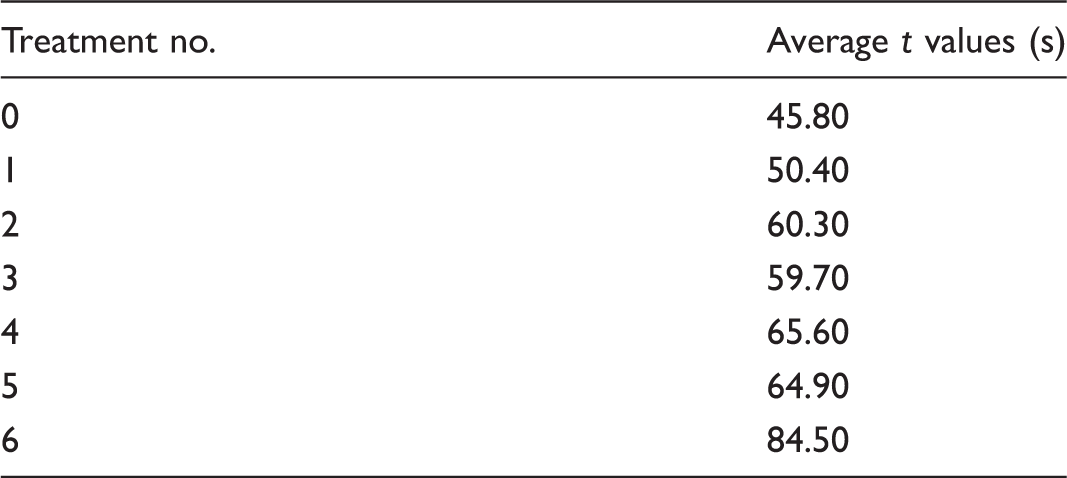
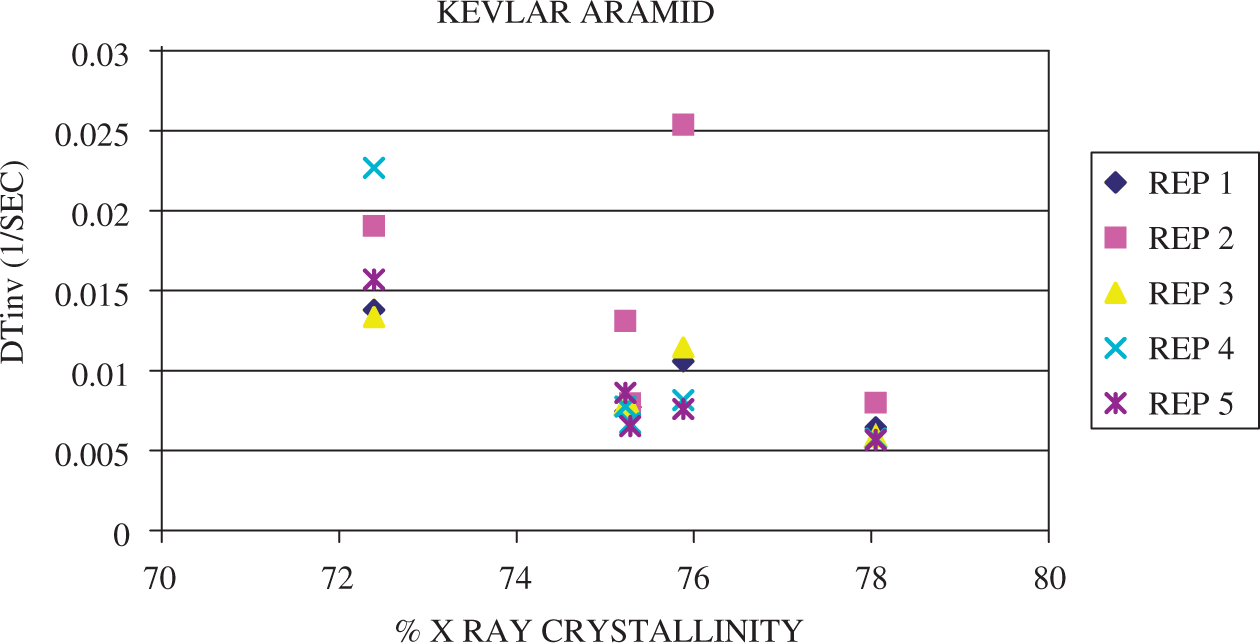
Average of 50 dissolution time (t) values for Kevlar.

Relation between t and degree of crystallinity
Dissolution phenomenon can be analyzed by the diffusion model [25]. Diffusion is caused by random molecular motion that leads to complete mixing. Fick’s law of diffusion states that diffusion into a homogeneous cylinder as a function of radius r and time t can be defined as

In the t experiments, fixed length heat set multifilament yarns of same denier are loaded with a constant weight and then dipped in a specific solvent of known concentration at a fixed temperature. Considering that only little quantity of the polymer dissolves in large quantity of solvent, the bulk concentration (C) of the solvent remains the same. As per our working hypothesis, as we hypothesize that the amorphous morphology in all the fiber samples is assumed to be the same, the concentration of the solvent with radius (∂C/∂r) is constant. So, the t of the filaments would be inversely proportional to only the diffusion coefficient of the filaments.
In a semi-crystalline fiber, crystalline regions are impermeable to solvents during diffusion [8,26]. The resulting decrease in diffusion coefficient of a fluid can be related to the amount of crystallinity [8],

As for a particular polymer, if the experiments are performed at constant temperature, the degree of crystallinity of the fiber is inversely proportional to the effective diffusion coefficient, which is inversely proportional to the t of the filaments. Hence, the t is of any fiber sample would be directly proportional to the degree of crystallinity of the semi-crystalline fiber.

As per dissolution model, t depends upon diffusion coefficient, which in turn depends upon fraction degree of crystallinity. So if t inverse of a specimen fiber (

After determining that the block and the block × treatment interaction effects were insignificant, three models were tried for the regression analysis relating the means of the 10 dissolution time measurements on each experimental to the percent degree of crystallinity (χc). The three models are given as follows;
t = [β0 + (β1 χc)] + ɛi t = [β0 + (β1) (1/χc)] + ɛi
where t was the response variable in the ith trial. It was mean of the 10 dissolution time measurements (t). χc was the percent degree of crystallinity in the ith trial. The parameter β0 was the y intercept of the regression line and β1 was the slope of the regression line. ɛi was the random error. It was normally distributed with mean zero and variance σ2. It was the difference between the dependent response variable and the unknown true regression line. The error terms were independent in all the trials. The difference between the dependent response variable and the fitted value on the estimated regression line was called the residual, ei.
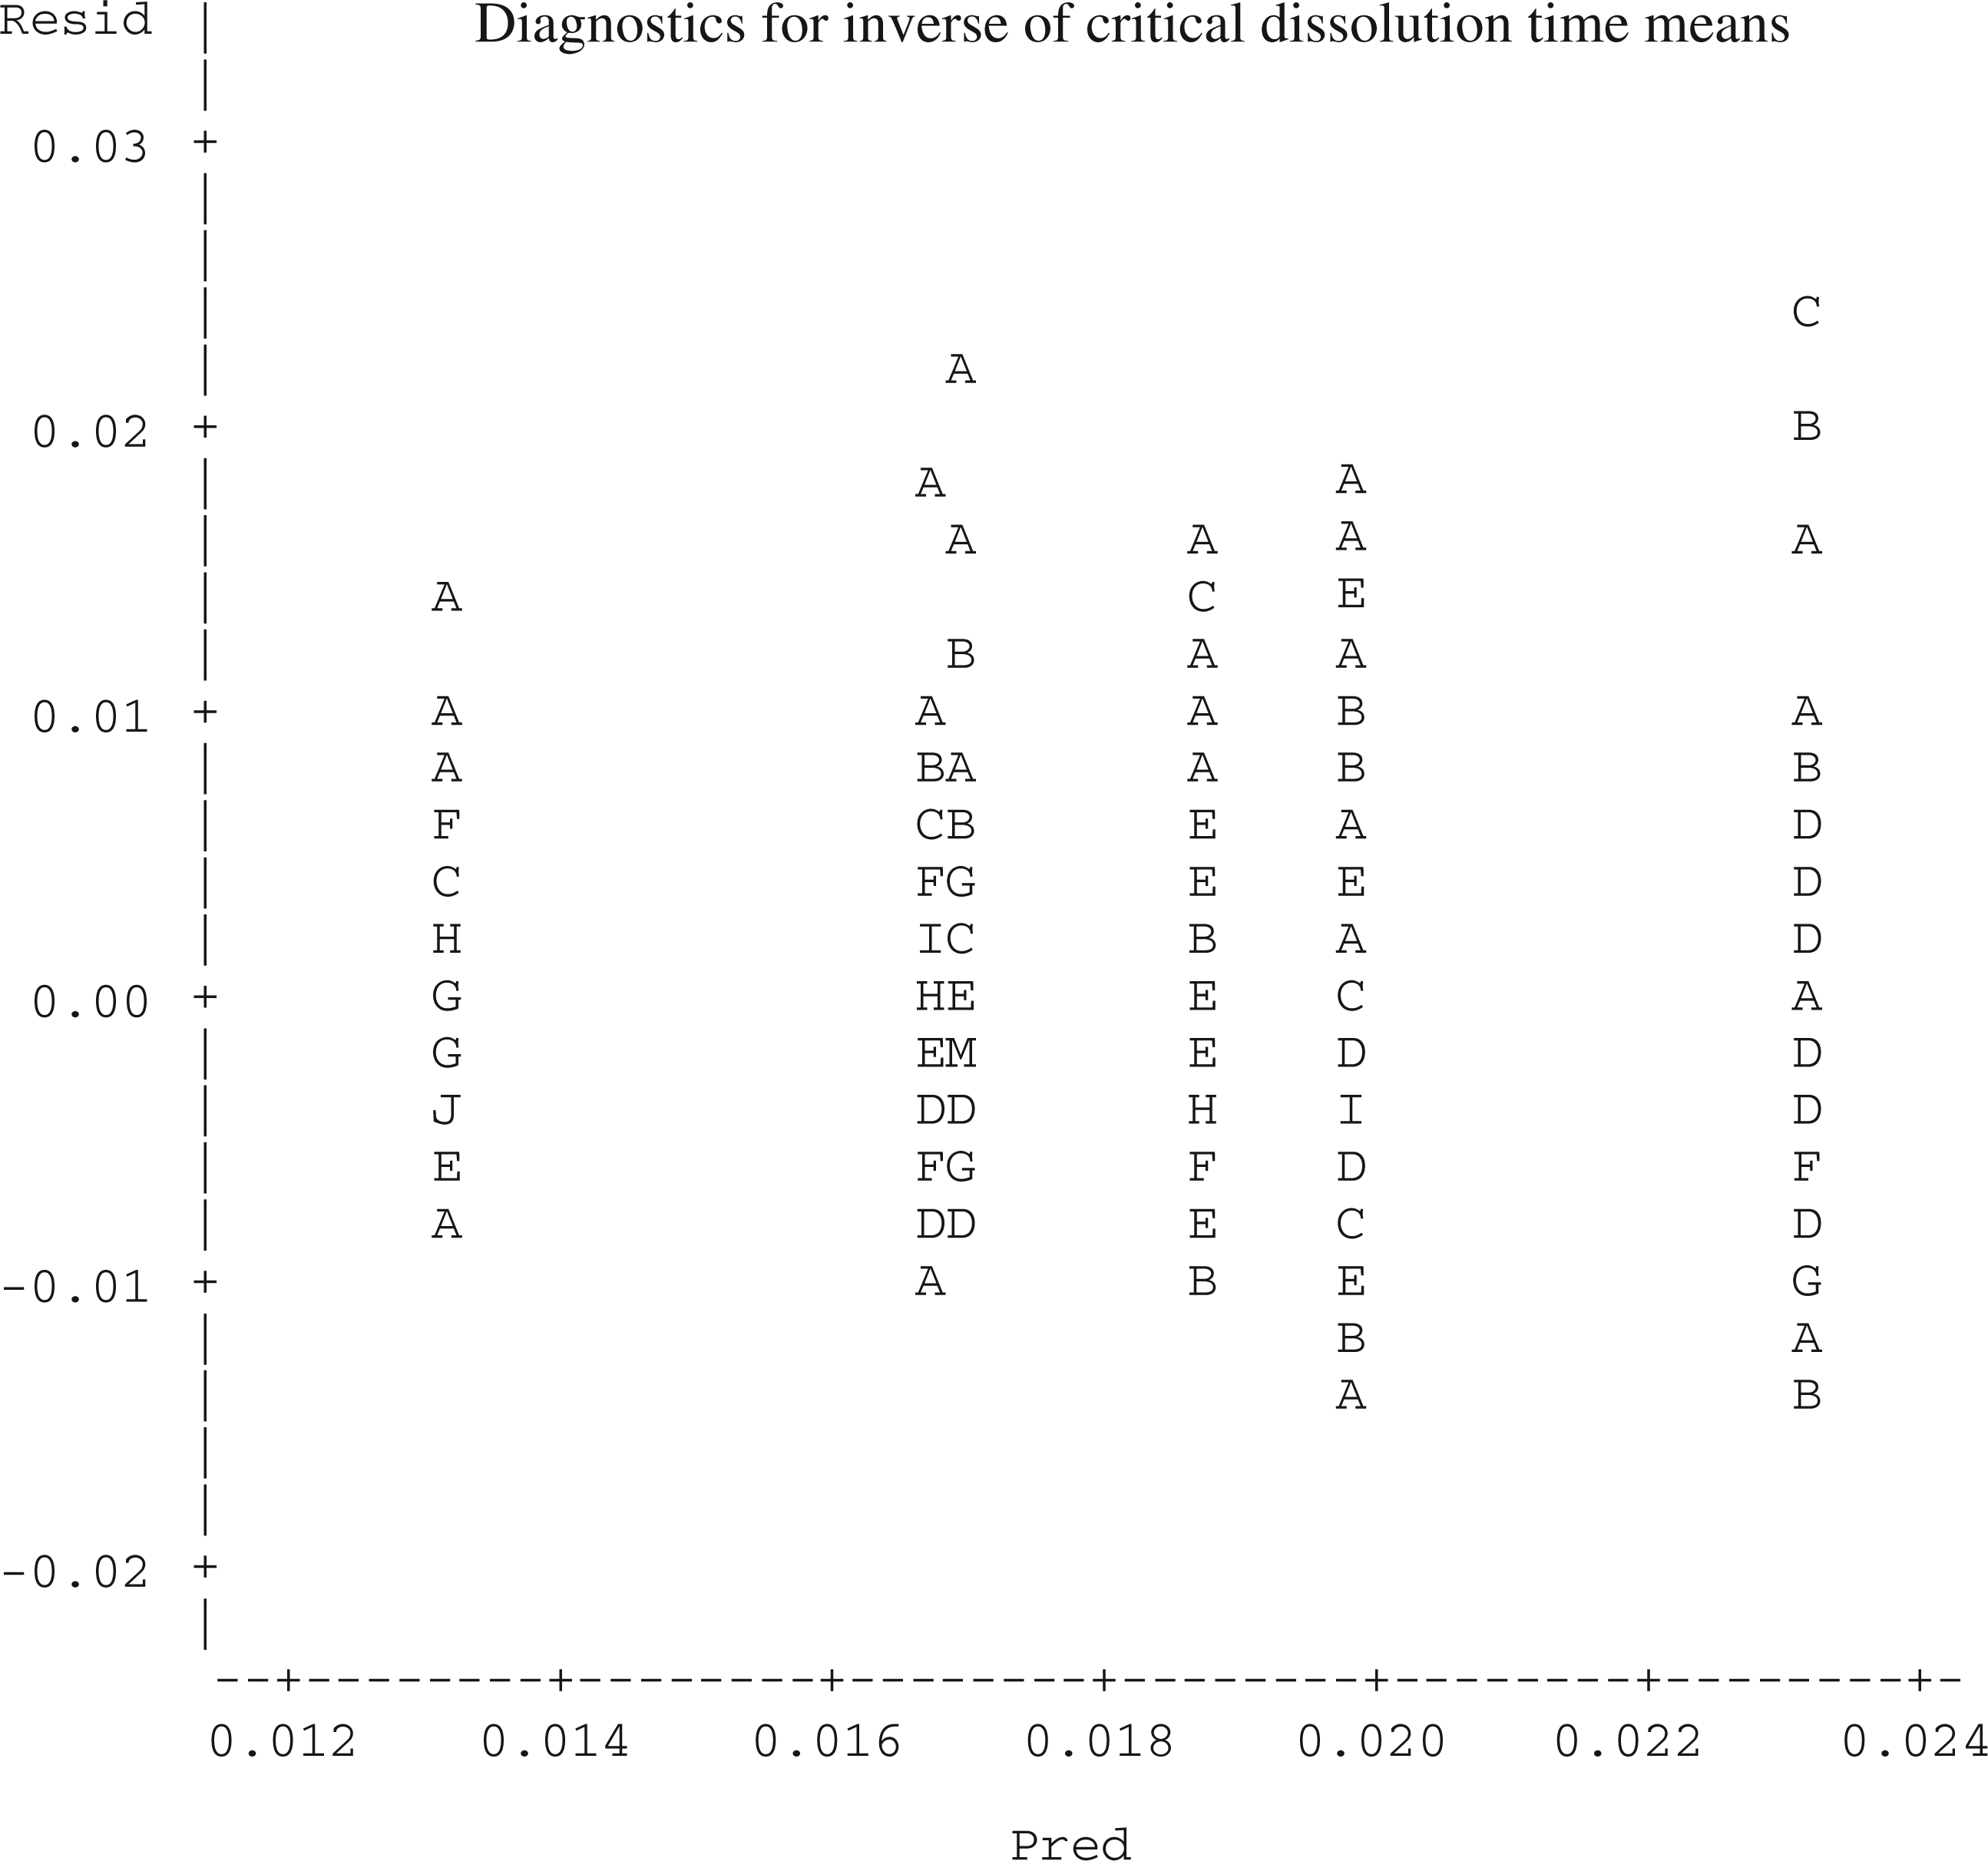
As per Lack of fit test values and Levene’s Test for Equality of variances, The first assumption was that whether a linear regression function was appropriate for the data. The assumption can be checked by a Lack of Fit test for linear regression (Table 6) and was found that the linear regression model was good for all the three filament yarns at 95% confidence level. The regression model requires that the residuals were independent. As number of observations were much greater than number of regression coefficients, the assumption of independence of the residuals was satisfied. The outliers were checked by the values of leverage and the externally studentized residuals. A studentized residual is the quotient resulting from the division of a residual by an estimate of its standard deviation. The influence of any data point that appeared to be outlier was checked and found to be not so large as to cause a large influence on the parameter estimates. The residuals have constant variance. It can be checked by a plot of residuals versus predicted values. Plot of residuals versus predicted values for Nomex aramid multifilament yarns shows a band of points, with intercept equal to zero and slope equal to zero and it implies that the assumption of the homoscedasticity was not violated (Figure 1). Homoscedasticity indicates homogeneity of variance for all random variables. It was also checked by Levene’s test for homogeneity of variances and was found to be acceptable for Nomex aramid multifilament filament yarns. For Kevlar aramid multifilament filament yarns, Levene’s test for homogeneity of variances was rejected, and the plot of residuals versus predicted values shows unequal variances (Figure 2). High variance in the values of t measurements is inherent in the technique. Nevertheless, as the tests are having some robustness against non-constant variance; despite inequality of variances in case of Kevlar aramid multifilament filament yarns, the regression analysis was applied for all the three filament yarns. The residuals in the regression model should be normally distributed. This assumption can be checked by Shapiro-Wilk test and by a normal probability plot. Both tests check whether the samples are drawn from a normally distributed population. The Shapiro-Wilk values and the normal probability plot of the aramid yarns show that the null hypothesis is true and the sample is taken from a normally distributed population. Pearson correlation coefficient values for Nomex and Kevlar. Plot of residuals versus predicted values for Nomex multifilament yarns. Plot of residuals versus predicted values for Kevlar multifilament yarns.


In order to know whether there was a linear relationship between
For Nomex aramid, the regression equation is:

χc = Percent degree of crystallinity of a filament yarn.

As |t| was greater than t0.025, 28, so null hypothesis was rejected at 95% confidence level and β1 ≠ 0. Hence, there was a linear relationship between 
For Kevlar aramid, the regression equation is

χc = Percent degree of crystallinity of a filament yarn.

As |t| was greater than t0.025, 23, so null hypothesis was rejected at 95% confidence level and β1 ≠ 0. Hence, there was a linear relationship between 
It was observed that as per the hypothesis tests for the two aramid filament yarns, there was a linear relationship between t inverse or DTinv (
So, applying the equation of a straight line to the t experiment;

χc = percent degree of crystallinity of a filament yarn.
The slope of the line is also given as (y2 − y1)/(x2 − x1). As the plot was between 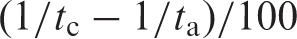
Substituting the value of the slope in equation (8),

Rearranging the equation in terms of χc:

So if t inverse of a specimen filament yarn is subtracted from t inverse of an amorphous filament yarn, and divided by the difference of t inverse of an amorphous filament yarn and t inverse of a perfect crystalline filament yarn, provided the amount of solvent and the temperature of solvent is constant, would give an idea of percent degree of crystallinity. Hence, a novel and simple method to assess degree of crystallinity was proposed.
χc = (t inverse of an amorphous filament yarn − dissolution time inverse of a sample filament yarn)/(t inverse of an amorphous filament yarn − dissolution time inverse of a perfect crystalline filament yarn).

The difference between dissolution time inverse of an amorphous filament yarn (
The mean value of inverse of 50 observations of t, that is, Percent X-ray degree of crystallinity versus Percent X-ray degree of crystallinity versus 
For Nomex aramid, the equation is


The 95% prediction intervals were much tighter in case of Kevlar aramid multifilament yarns than for Nomex aramid multifilament yarns because the value of (c2)[c2 = [t(α/2, n − 2)]2/TS] in the equation of prediction interval [
A remarkable thing about the technique was an increase of 40.7% degree of crystallinity in Nomex causes an increase of 84% in t. Similarly, an increase of 57% degree of crystallinity in Kevlar causes an increase of 240% in t. Hence, the technique can be used to characterize even very little changes in degree of crystallinity. The degree of crystallinity could not be increased further, and consequently the data range could not be expanded because of lack of a hot drawing machine in the department.
Conclusions
The morphological structure of any fiber influences the mechanical, thermal, sorption, and other properties of semi-crystalline textile fibers such as polyesters, nylons, aramid, and poly-olefins. Hence, the study of fiber crystallinity is essential to understand and interpret the fiber properties. Dissolution time technique can serve as an alternative technique to predict the degree of crystallinity of the textile fibers. An equation was developed to predict the degree of crystallinity of aramid fibers using t data of Kevlar and Nomex multifilament yarns, which were heat set at various temperatures. The degree of crystallinity of the fibers was also characterized by the powder X-ray technique. The Pearson correlation coefficient between dissolution time inverse based on the mean of 50 dissolution time measurements, and the X-ray degree of crystallinity was found to be −0.88 for Nomex and −0.95 for Kevlar multifilament yarns.
New equations were proposed to predict the degree of crystallinity of Kevlar and Nomex multifilament yarns. For Nomex aramid, the equation is


If one can measure t of a specimen Kevlar or Nomex aramid multifilament yarns and use
It was hypothesized that the equation can be used for other filament yarns too, provided that the linear relationship between
Footnotes
Acknowledgements
We would like to thank Dr. J. Desper for his assistance in the X-ray analysis of the samples. We are thankful to E.I. Du Pont De Nemours, and Co., Inc. for supplying the samples of Kevlar and Nomex multifilament yarns for the study. This is K State Research and Extension Manuscript number 04-254-J.
Funding
The work was financially supported by Kansas Agricultural Experiment Station.