
Abstract
In Canada, reports of nursing staff shortages, job vacancies and the use of private agency nurses, especially in hospitals, have increased since the start of the COVID-19 pandemic. Media reports suggest the pandemic exacerbated nursing shortages among other issues, and nurses are leaving their traditional positions to work at such agencies. Public spending on agency nurses has increased appreciably. Using 2011 to 2021 regulatory college data on all registered nurses (RNs) and registered practical nurses (RPNs) in the province of Ontario, Canada, we investigated trends in the count and share of nurses working for employment agencies. We also examined the rate at which previously non-agency employed nurses transition to employment in at least one agency job. We found the prevalence of RNs and RPNs reporting agency employment was relatively stable from 2011 to 2019, and decreased slightly in 2020 and 2021. However, there was a small increase in transitions from non-agency employment to working at an agency job. We also found the mean hours of practice in all jobs reported by agency and non-agency nurses increased during the pandemic. Based on these findings, an increase in hours and/or prices for agency nurses may explain the increase in public funding for agency nurses, but it was not driven by an increasing share of nurses working for employment agencies. To fully understand employment agency activity, policymakers may need to monitor hours of work and hourly costs rather than only costs. Further research is required to investigate any long-term effects the pandemic may have had on agency-employment.
Introduction
Globally, health care professionals, especially nurses, have reported that they feel higher levels of stress and severe burnout due to increased demands during the COVID-19 pandemic (e.g., Arnetz et al., 2020; Galanis et al., 2021; Martin et al., 2023; Murat et al., 2021). Ben-Ahmed and Bourgeault (2022) highlighted that thousands of nurses across Canada have been facing complex intersecting issues – such as heavy workloads, mandatory overtime, and inadequate staffing – that were exacerbated by the pandemic. Ben-Ahmed and Bourgeault (2022), and several media outlets (e.g., Mudhar, 2022; Grant, 2023) have reported that these issues, among others that pre-date the pandemic, have led nurses to leave the profession, change jobs, or turn toward employment at private staffing agencies, that provide what are usually referred to as travelling or agency nurses. We study the use of agency/travelling nurses focusing on the Canadian province of Ontario prior to, and during the first two years of the COVID-19 pandemic.
Nursing employment agencies provide short-term staffing to institutions and individuals. During the pandemic, the popular media reported many nurses were leaving their public sector jobs to work at agencies in search of better working conditions (e.g., higher pay and greater flexibility). In 2022, for example, the Toronto Star reported instances of Ontario RNs earning $50 to $100 an hour working for agencies, compared to around $35 to $45 an hour (plus benefits, pensions, and job security) working for public sector employers (Yalnizyan, 2022). Similarly, the Canadian Broadcasting Corporation (CBC) reported agency nurses in Nova Scotia are paid at least twice the hourly wage rate, and have more flexible working arrangements, compared to non-agency nurses (Luck, 2022). Besides higher wages (though not necessarily higher total remuneration) and more control over working hours (e.g., Hansen & Tuttas, 2022), a pandemic restriction that limited multiple jobholding across homes in the long-term care home (LTCH) and supportive housing sectors did not apply to agency nurses (Drost et al., 2023). Thus, some nurses previously working multiple part-time jobs in these sectors may have transitioned to agency employment to make up for any loss in hours.
Media reports on the rate of nurses leaving their positions to work at agencies are usually qualitative. However, there was solid quantitative evidence from journalists (usually provided by public sector financial records) reporting that the dollar amount spent on agency fees had increased markedly. Ontario hospitals have more than quadrupled the amount of money paid to agencies since the onset of COVID-19 (Grant, 2023). Public funds spent on agency nurses in British Columbia (BC) increased from $8.7 million in 2018–2019, to $64 million in 2021–2022 (Daflos, 2022). Nova Scotia Health reportedly spent $8.9 million on all agency nurses in the 2021–2022 fiscal year, compared to $16.3 million on agency RNs just from April to December, 2022 (Latimer, 2023). Manitoba, some Ontario long-term care homes, and a Toronto hospital network have also reportedly spent a significantly larger amount on agency nurses in 2021–2022 compared to previous years (Greenslade, 2022; Laucius, 2022; Yang & Mojtehedzadeh, 2022). However, the degree to which this is due to an increase in the number of nurses practicing in employment agencies, hours worked per agency nurse, and/or agency fees charged, is unclear. Many stakeholders have suggested private agencies have significantly increased their fees, with some agencies being accused of price gouging (Casey, 2023; Jones 2023; Laucius, 2022).
Using 2011–2021 provincial Ministry of Health data, we seek to clarify the proportion of agency nurses, the transition rate into agency employment, and hours of practice among agency and non-agency employed nurses in the Canadian province of Ontario.
Background
Under Canada's constitution, healthcare is a provincial responsibility. However, the federal government contributes funding to the provinces in return for provincial governments meeting the criteria of the Canada Health Act (Government of Canada, 2023). The result is Canada's single payer Medicare system where provinces provide hospital and physician services at no cost to permanent residents and citizens. This model implies that virtually all nurses’ remuneration is ultimately funded by the provincial governments.
Additionally, each provincial government delegates nursing regulation to a professional College, in the case of Ontario to the College of Nurses of Ontario (CNO). Simultaneously, a very high percentage of nurses are unionized and bargain collectively (Daniels et al., 2012; Sweetman, 2022). Relevant for this study, shortly before the onset of COVID-19, in June 2019, the Ontario government passed Bill 124 limiting salary increases to 1.0% per year for three-years for public sector employees, including nurses (Legislative Assembly of Ontario, 2019). Nursing unions and associations fought against Bill 124; they are concerned about nurse retention and shortages (e.g., Registered Nurses Association of Ontario [RNAO], 2021; Ontario Nurses Association [ONA], 2019). The Bill has since been deemed unconstitutional by the Ontario Superior Court, though the Ontario government is appealing (ONA, n.d.). Appendix 1 provides further institutional background.
There is little empirical research on the rate of nurse retention, job turnover, and agency employment either prior to or during the COVID-19 pandemic in Canada. However, several surveys have reported an increase in the intention to change jobs or leave the profession. For example, a poll conducted on behalf of two unions (Canadian Union of Public Employees [CUPE] and SEIU [Service Employees International Union] Health Care) found that 60% of surveyed Ontario registered practical nurses (RPNs) are considering leaving the profession (SEIU Healthcare, 2023). Similarly, the Canadian Federation of Nurses Unions (CFNU, 2022) found about 30% of surveyed Canadian nurses were considering changing their jobs, and 20% were considering leaving the profession. These surveys mainly used convenience sampling methods, and only measured the intention to leave the profession or change jobs. Drost and Sweetman (2023) examined job turnover, as distinct from occupational turnover or exits, using Ministry of Health data from Ontario and found an average annual job turnover rate of 21.3% among registered nurses (RNs) and 29.4% among RPNs from 2014 to 2019. Contrary to expectations, they observed that the job turnover rate increased only slightly, to 23.0% among RNs and 34.5% among RPNs, in 2020 when COVID-19 was most severe. Using the same data Drost (2024) found pre-pandemic (2014 to 2019) occupation attrition ranged from 6.1 to 7.2% among RNs and 6.6 to 7.5% among RPNs. The attrition rate increased modestly in 2020 and 2021 to 7.7% and 8.1% among RNs, and 8.0% and 8.6% among RPNs.
Research on the prevalence of agency nurses in Canada is limited, and often anecdotal. The only report of which we are aware containing information on Ontario agency employment is the CNO's annual Registration Renewal Statistics Report, the most recent being CNO (2023). This CNO report contains the count and share of agency nursing jobs from 2016 to 2023 (Table 6.2). The CNO found the proportion and count of agency jobs were smaller in pandemic years (2021–2023) than any other year in the data range. However, the CNO does not report transition rates into agency employment, or hours of practice among agency nurses.
Methods
Study Design and Data Sources
We use the 2011–2021 Health Professions Database (HPDB), obtained from the Ontario Ministry of Health (Hamilton Integrated Research Ethics Board Project 10947), to determine the proportion of RNs and RPNs that report agency employment each year. A key statistic is the annual agency employment transition rate; the share of nurses who transition from having no agency employment in one year to employment in at least one agency job in the next. We compare pre-COVID-19 trends (2011 to 2019) with the most recent years of COVID-19 data available (2020 to 2021) to investigate potential effects the pandemic may have on agency employment. Finally, we document individual and employment characteristics of agency and non-agency employed nurses, especially reported hours of practice.
The Health Professions Database derives from CNO registration records primarily collected in December each year. The data contain employment, education, and sociodemographic information (but no information on wages) for all nurses licensed to practice in the province (Ontario Ministry of Health and Long-term Care, 2018). Though the data are self-reported, nurses are legally obligated to register and provide this information under the Regulated Health Professions Act, 1991. Each nurse has a unique anonymized identifier, allowing us to perform a longitudinal analysis, and examine transitions into agency employment.
Variables
Our main variable of interest is agency employment. In the Health Professions Database, agency employment is reported on an individual basis, as opposed to a per-job basis; thus, our definition of agency employed nurses comprises multiple jobholding nurses with at least one agency job. While most employment information in the Health Professions Database is collected on up to three jobs per nurse, nurses are not asked whether each job is with an agency. Rather, they are asked an overarching question, “Do you work for a nurse staffing agency?” We define any nurse who answers “Yes,” as an agency nurse. Because multiple jobholders may combine agency and non-agency jobs, they are analyzed separately from single jobholders in most of the paper.
Secondary variables of interest include age, employment preference (full-time, part-time, or casual), hours of practice, employment status and category, and health care sector. We define five age categories: under 29, 30–39, 40–49, 50–59, and 60 and over. Similar to agency employment, hours of practice are not collected on a per-job basis, it is the aggregate hours across all jobs. Information on employment status (full-time, part-time, or casual), employment category (permanent, temporary, casual, or self-employed; note that the Health Professions Database uses the word “casual” in the employment “status” and “category” contexts with different definitions), and the health care sector (LTCHs, hospitals, primary care, home care, supportive housing, and an aggregate “other”) are collected on up to three jobs. We report all job-related statistics, except employment preference, separately for multiple jobholders.
Data Analysis
The sample is restricted to those with an active registration employed in at least one nursing job in Ontario. We count dual RNs and RPNs only once and they are classified as RNs. Our resulting sample includes 1,062,280 RN observations and 472,500 RPN observations over the entire period of analysis. Each year, the sample of RNs with at least one Ontario nursing job ranges from 92,570 (2011) to 100,230 (2021). For RPNs, this range is 31,970 (2011) to 51,470 (2021). Lastly, across the years of our study, 58.8% to 68.5% of agency RNs, and 61.6% to 68.2% of agency RPNs, are single jobholders. The proportion of single jobholders is slightly higher among non-agency nurses: 83.4% vs. 85.8% for RNs, and 80.6% vs.84.8% for RPNs.
The annual share of nurses (single and multiple jobholders combined) who report working in at least one agency job (as a percentage of all nurses with at least one Ontario nursing) job is reported. However, we cannot say with certainty if all agency work is in Ontario since the location of agency employment is not reported. Nonetheless, we know the share of all jobs outside Ontario, and it is quite small, ranging from about 1.9% to 5.4% among RNs and 0.8% to 1.3% among RPNs over the 2011 to 2021 period. Next, we examine the percentage of nurses working solely in non-agency positions in an initial year (year t-1) who transition to work in at least one agency job in the subsequent year (year t) as a percentage of all nurses (with at least one Ontario nursing job) in year t-1. Finally, we compare the employment and individual characteristics of agency and non-agency nurses for both single and multiple jobholders.
Results
Agency-Employed Nurses and Transition Rates to Agency Employment (2011–2021)
Figure 1A (RNs) and 1B (RPNs) display the percentage and count of Ontario nurses employed in at least one agency job from 2011 to 2021. The percentage of agency RNs (as a percentage of RNs employed in at least one Ontario job) exhibited a slow decline from 2011 to 2019, reducing from 3.4% to 2.8%. From just prior to COVID-19's onset to near the end of its first year (2019 to 2020), the percentage of agency RNs declined by 0.4 percentage points (or 360 RNs), which was the largest decline in our time series. Subsequently, in 2021, agency employment among RNs increased slightly from 2.4% to 2.6% – the only increase in our time series, representing 220 RNs. The share of agency employment in 2021 was the second lowest observed from 2011 to 2021.
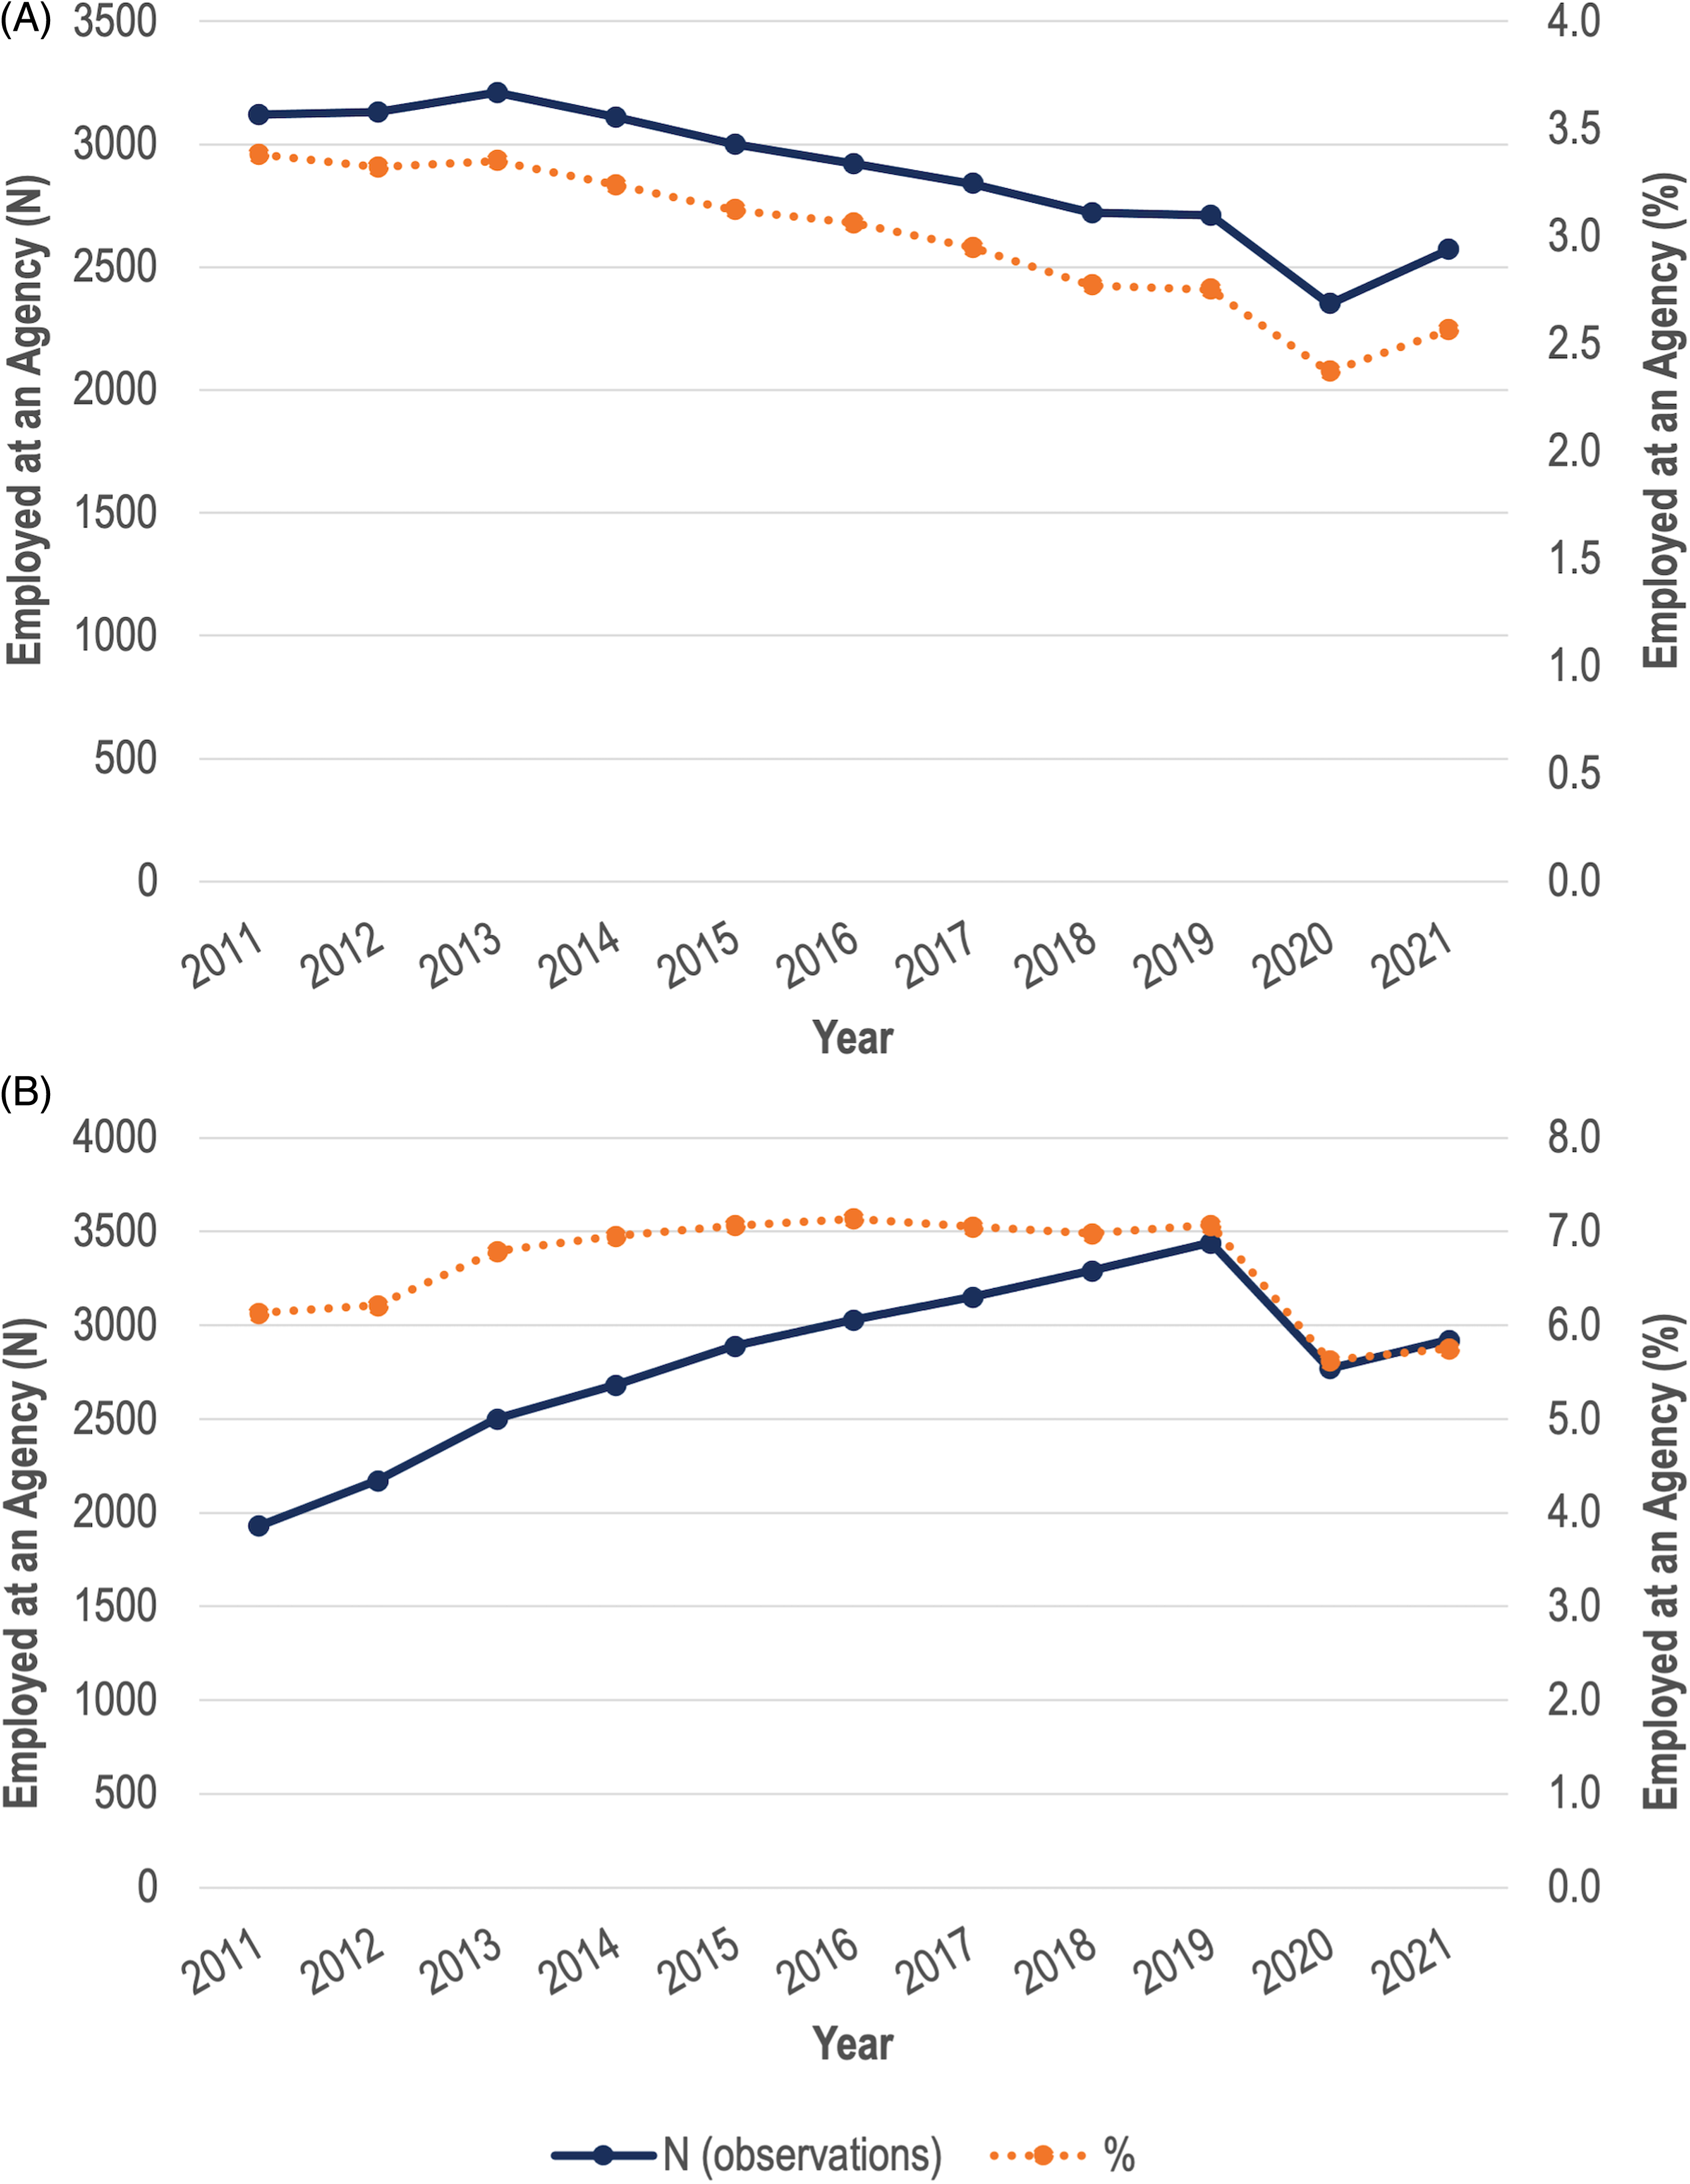
(A) Registered nurses (RNS) in Ontario with at least one job with an employment agency. (B): registered practical nurses (RPNS) in Ontario with at least one job with an employment.
Across all years, a higher percentage of RPNs than RNs are employed in at least one agency job. On average, across 2011 to 2021, 6.6% of RPNs reported working at an agency, compared to 3.0% of RNs. Moreover, the time pattern of agency employment among RPNs differs from that of RNs. As seen in Figure 1B, agency employment increased in the first two or three years of the data period, then stabilized for the six or seven years prior to COVID-19 at about 7.1%. Similar to RNs, agency employment decreased from 2019 to 2020, and increased very slightly from 2020 to 2021. However, the change from 2019 to 2020 was slightly larger in magnitude for RPNs; agency employment decreased by 1.4 percentage points (or 670 RPNs).
While we do not know the total number of agency jobs, we can calculate bounds on proportions (and, though not displayed, on the counts) of jobs with employment agencies by assuming that at most one (all) jobs of multiple jobholding nurses is (are) with an employment agency (refer to Appendix 2 Figure 1). In 2021, the upper bound of agency jobs was 3960, and the lower bound was 2570 for RNs. Similar bounds for RPNs were 2920 and 4350.
In Figures 2A (RNs) and 2B (RPNs) we display yearly transition rates to agency employment from 2012 to 2021. Among nurses who report no agency employment in an initial year (t-1), it measures the percentage who are employed in at least one agency job in the following year (t), as a percentage of all nurses employed in at least one Ontario nursing position in year t-1. For RPNs, and especially for RNs, agency transition rates are reasonably stable from 2012 to 2019. They range from 0.9% to 1.0% for RNs, and 2.0% to 2.5% for RPNs.
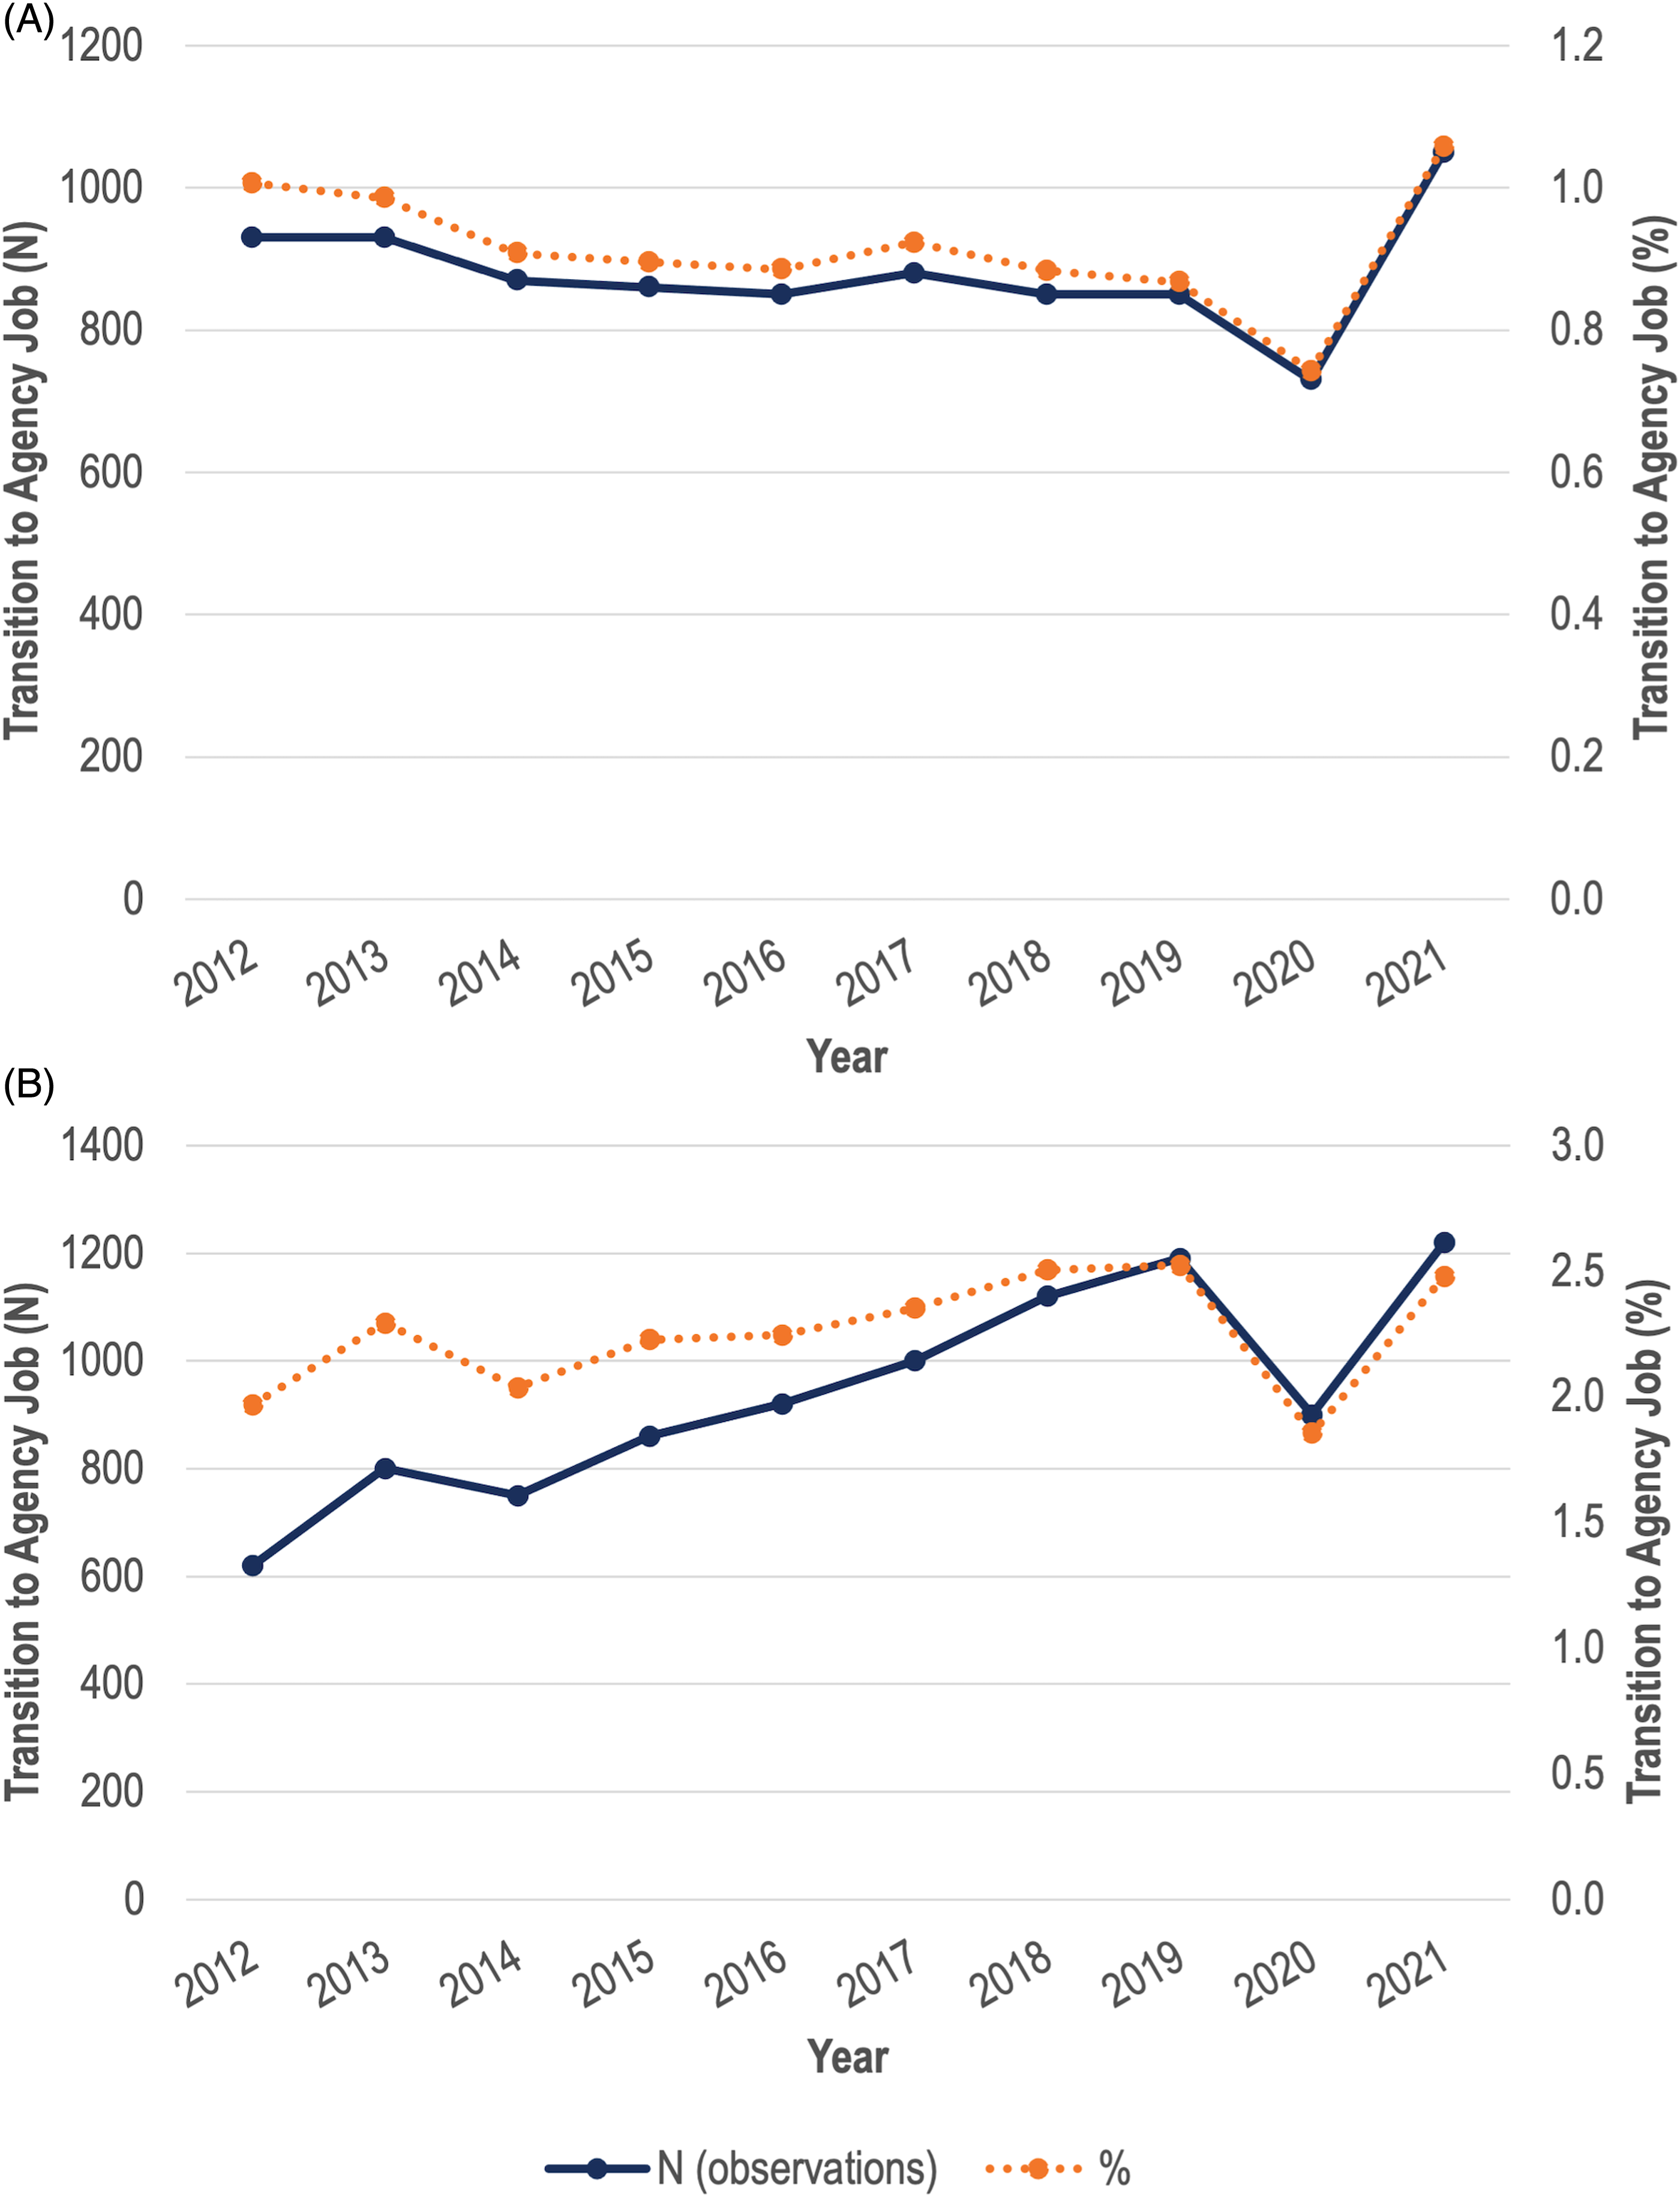
(A) Ontario registered nurses (RNs) who transition to agency employment (2011–2021). (B): Ontario registered practical nurses (RPNs) who transition to agency employment (2011–2021).
For RNs, the agency employment transition rate declined from 0.9% in 2018 to 2019, immediately pre-pandemic, to 0.7% in 2019 to 2020, the first year of the pandemic. The latter is the lowest in all the years observed. However, in t = 2021, the transition rate increased to 1.1%, 0.1 percentage points higher than the previous high in 2012. The increase from the pre-pandemic 2019's 0.9% to 2021's 1.1% represents approximately 200 RNs out of a population of 100,230 RNs in 2021. Among RPNs, fluctuations in agency transitions during the pandemic were larger, decreasing from just under 2.5% in 2018 to 2019 to 1.9% in 2019 to 2020, before increasing back to the pre-pandemic rate of just under 2.5% in 2020 to 2021. Overall, we do not find evidence of large increases in nurses transitioning to agency employment in the first two years of the pandemic compared to previous years, though there is evidence of a spike down in the first year of the pandemic. However, our measure of agency transition rates does not include new nursing registrants. We define a new registrant as a nurse who was registered in year t, but not year t-1, and report the proportion of such nurses that identify working at a nurse staffing agency in Appendix 2 Figure 2. The proportion of new registrants employed at an agency also decreased in 2020 and slightly increased in 2021.
Mean Hours of Practice Among Agency and Non-Agency Single and Multiple Jobholders
Although there is not a large change in the agency transition rate, agency nurses’ full-time status and/or hours of practice may have increased during the pandemic. Figure 3A and B (RNs), and 3C and 3D (RPNs) take an initial look at this issue by examining the share of single jobholders among agency and non-agency nurses. Clearly, agency nurses are much more likely to be multiple jobholders. Though we do not know if one or more of the jobs held by multiple jobholders are with employment agencies, it seems reasonable that many nurses hold an agency position that supplements non-agency employment. In 2020, there was a noticeable spike in single jobholding among both agency and non-agency RPN's, and a smaller spike among agency and non-agency RNs. In 2021, the percentage of single jobholders in both categories of RPN's returned to something close to the 2019 level, but there was a marked decline in single jobholding relative to the trend for RNs, especially those working for agencies.
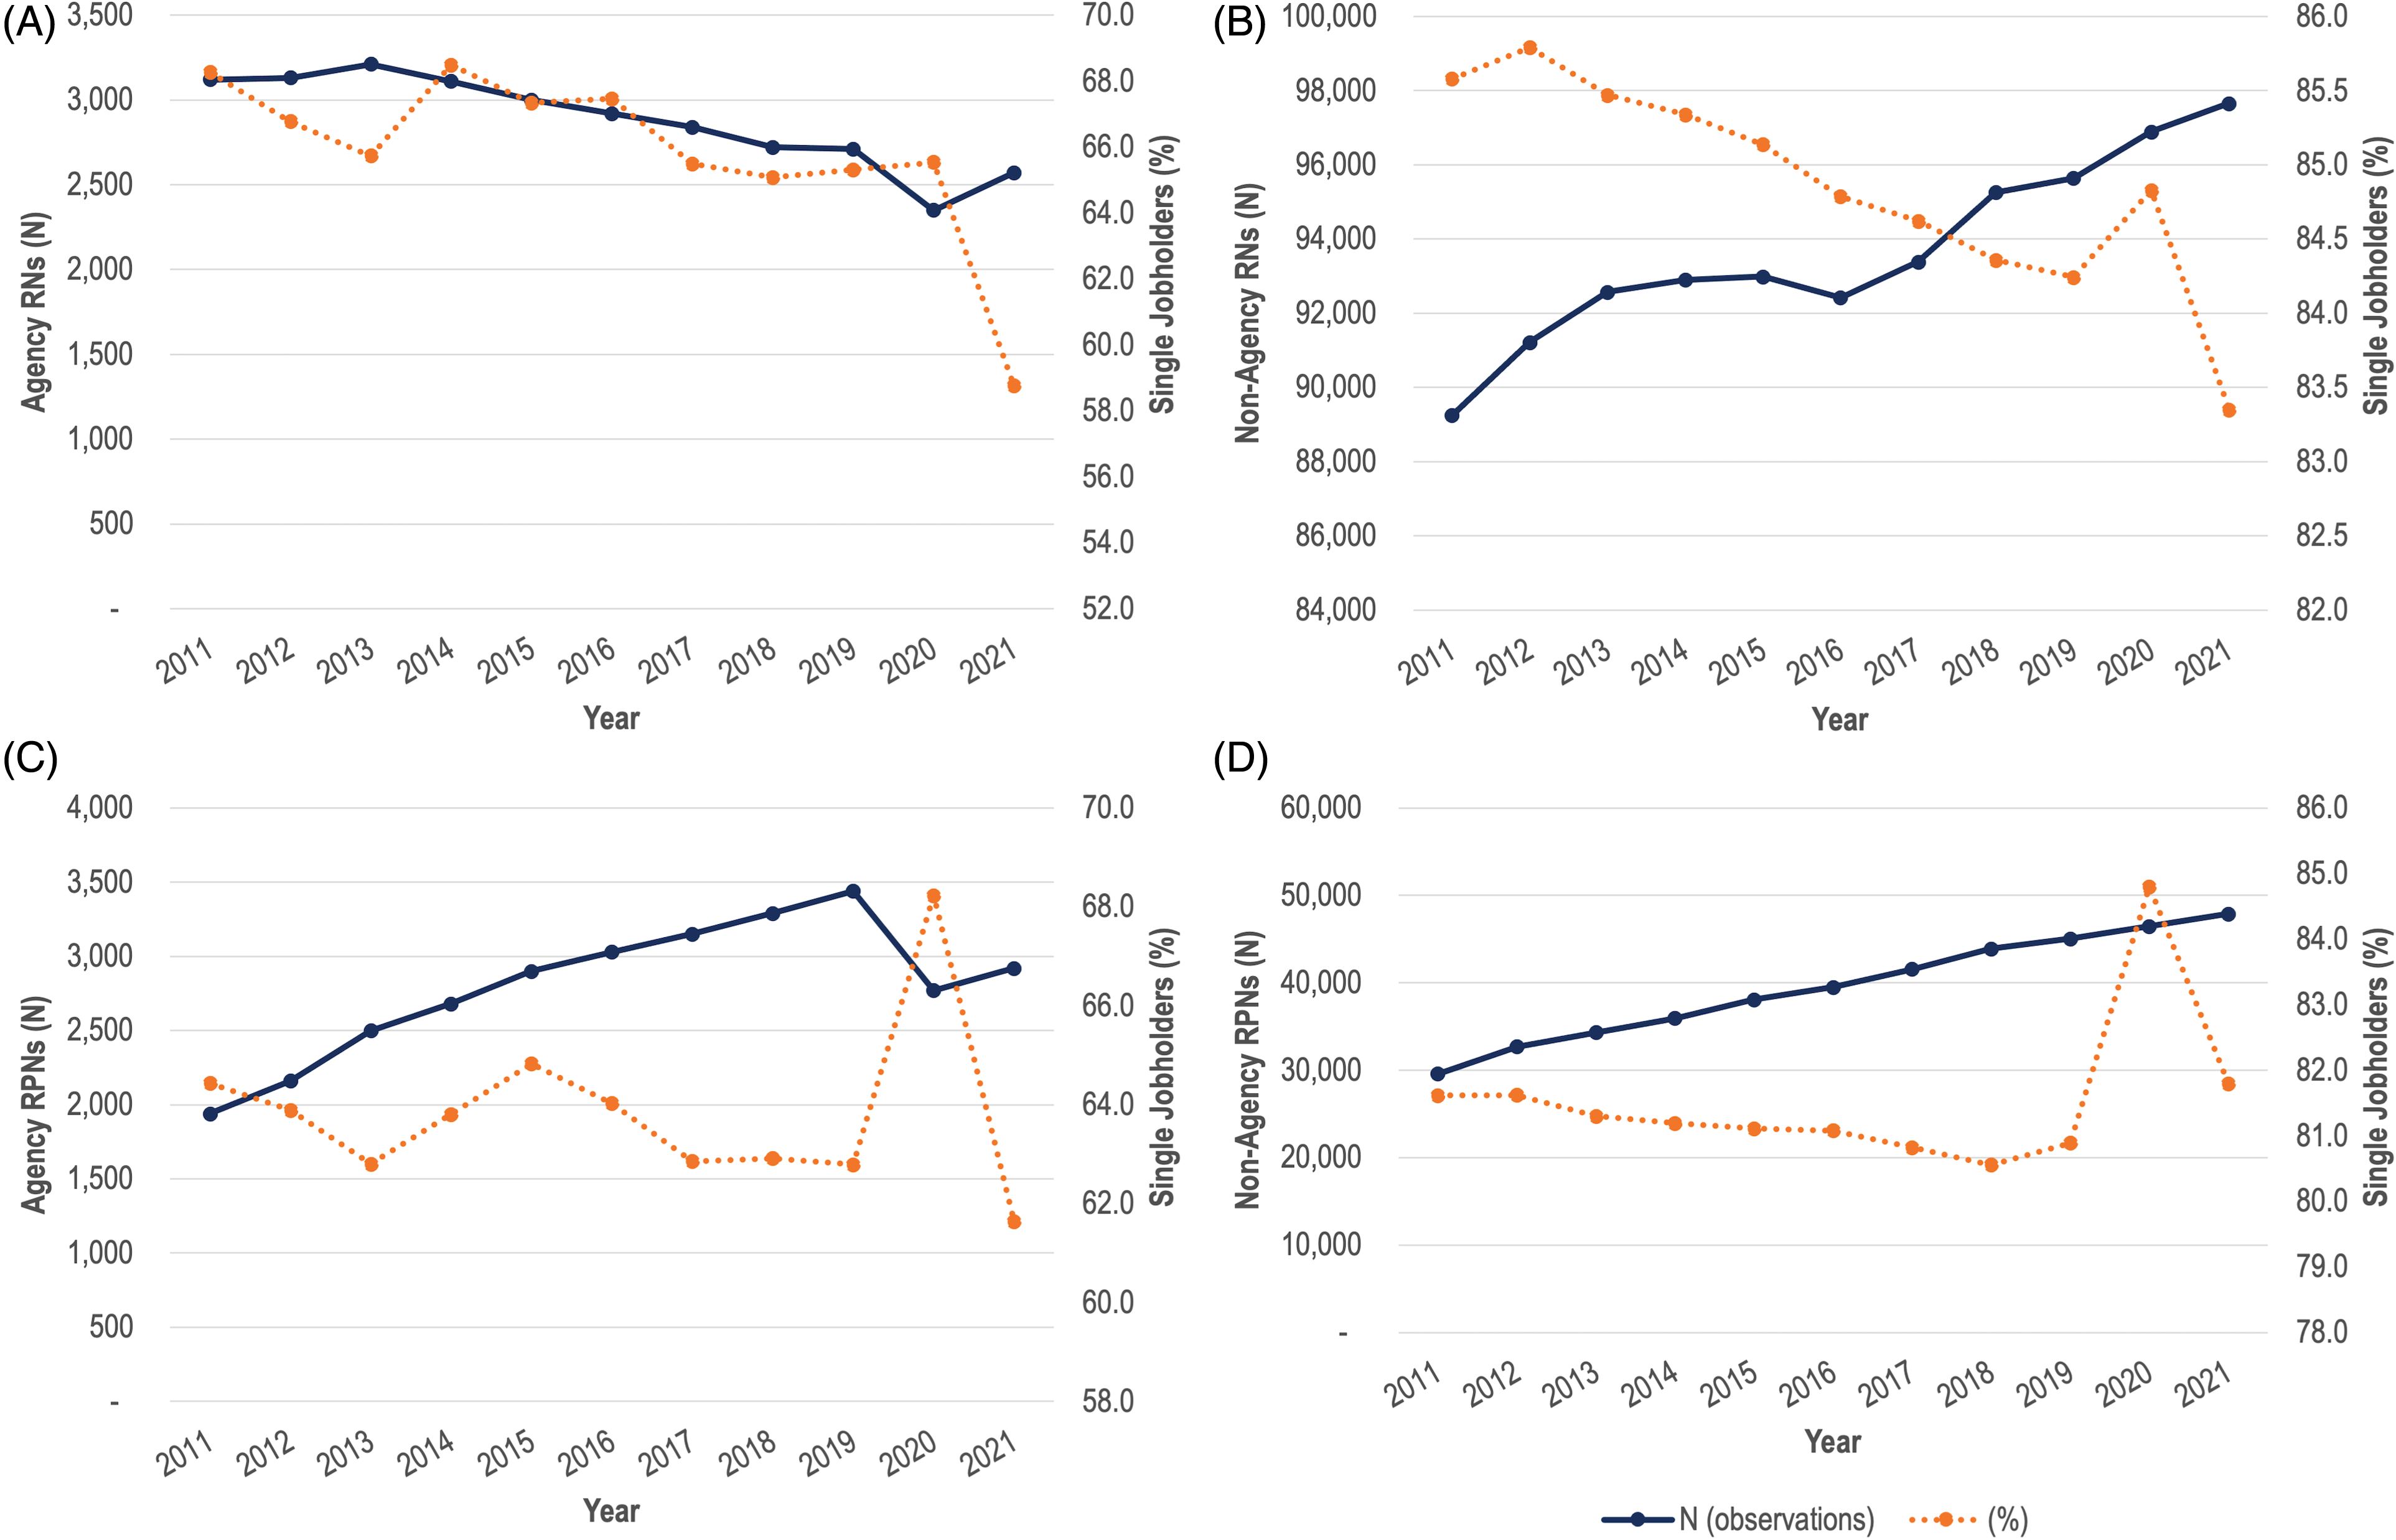
(A) Agency RNs: percent single jobholders (2011–2021). (B) Non-agency RNs: percent single jobholders (2011–2021). (C) Agency RPNs: percent single jobholders (2011–2021). (D): Non-agency RPNs: percent single jobholders (2011–2021).
To simultaneously address changes in work hours and the share of agency nurses, in Figures 4A (RNs) and 5A (RPNs) we display the sum (aggregate) of the practice hours of each of single- and multiple-jobholding nurses; we do this separately for agency and non-agency nurses. That is, trends in total weekly hours of work for all nurses in each category are presented. In contrast, Figures 4B (RNs) and 5B (RPNs) display mean weekly practice hours at the individual level. This allows us to study trends in work time, taking into account both changes in the size of each group and individual hours of work, side-by-side. In Panel A of both figures, the scale for non-agency nurses (on the left) differs from that for agency nurses (on the right).
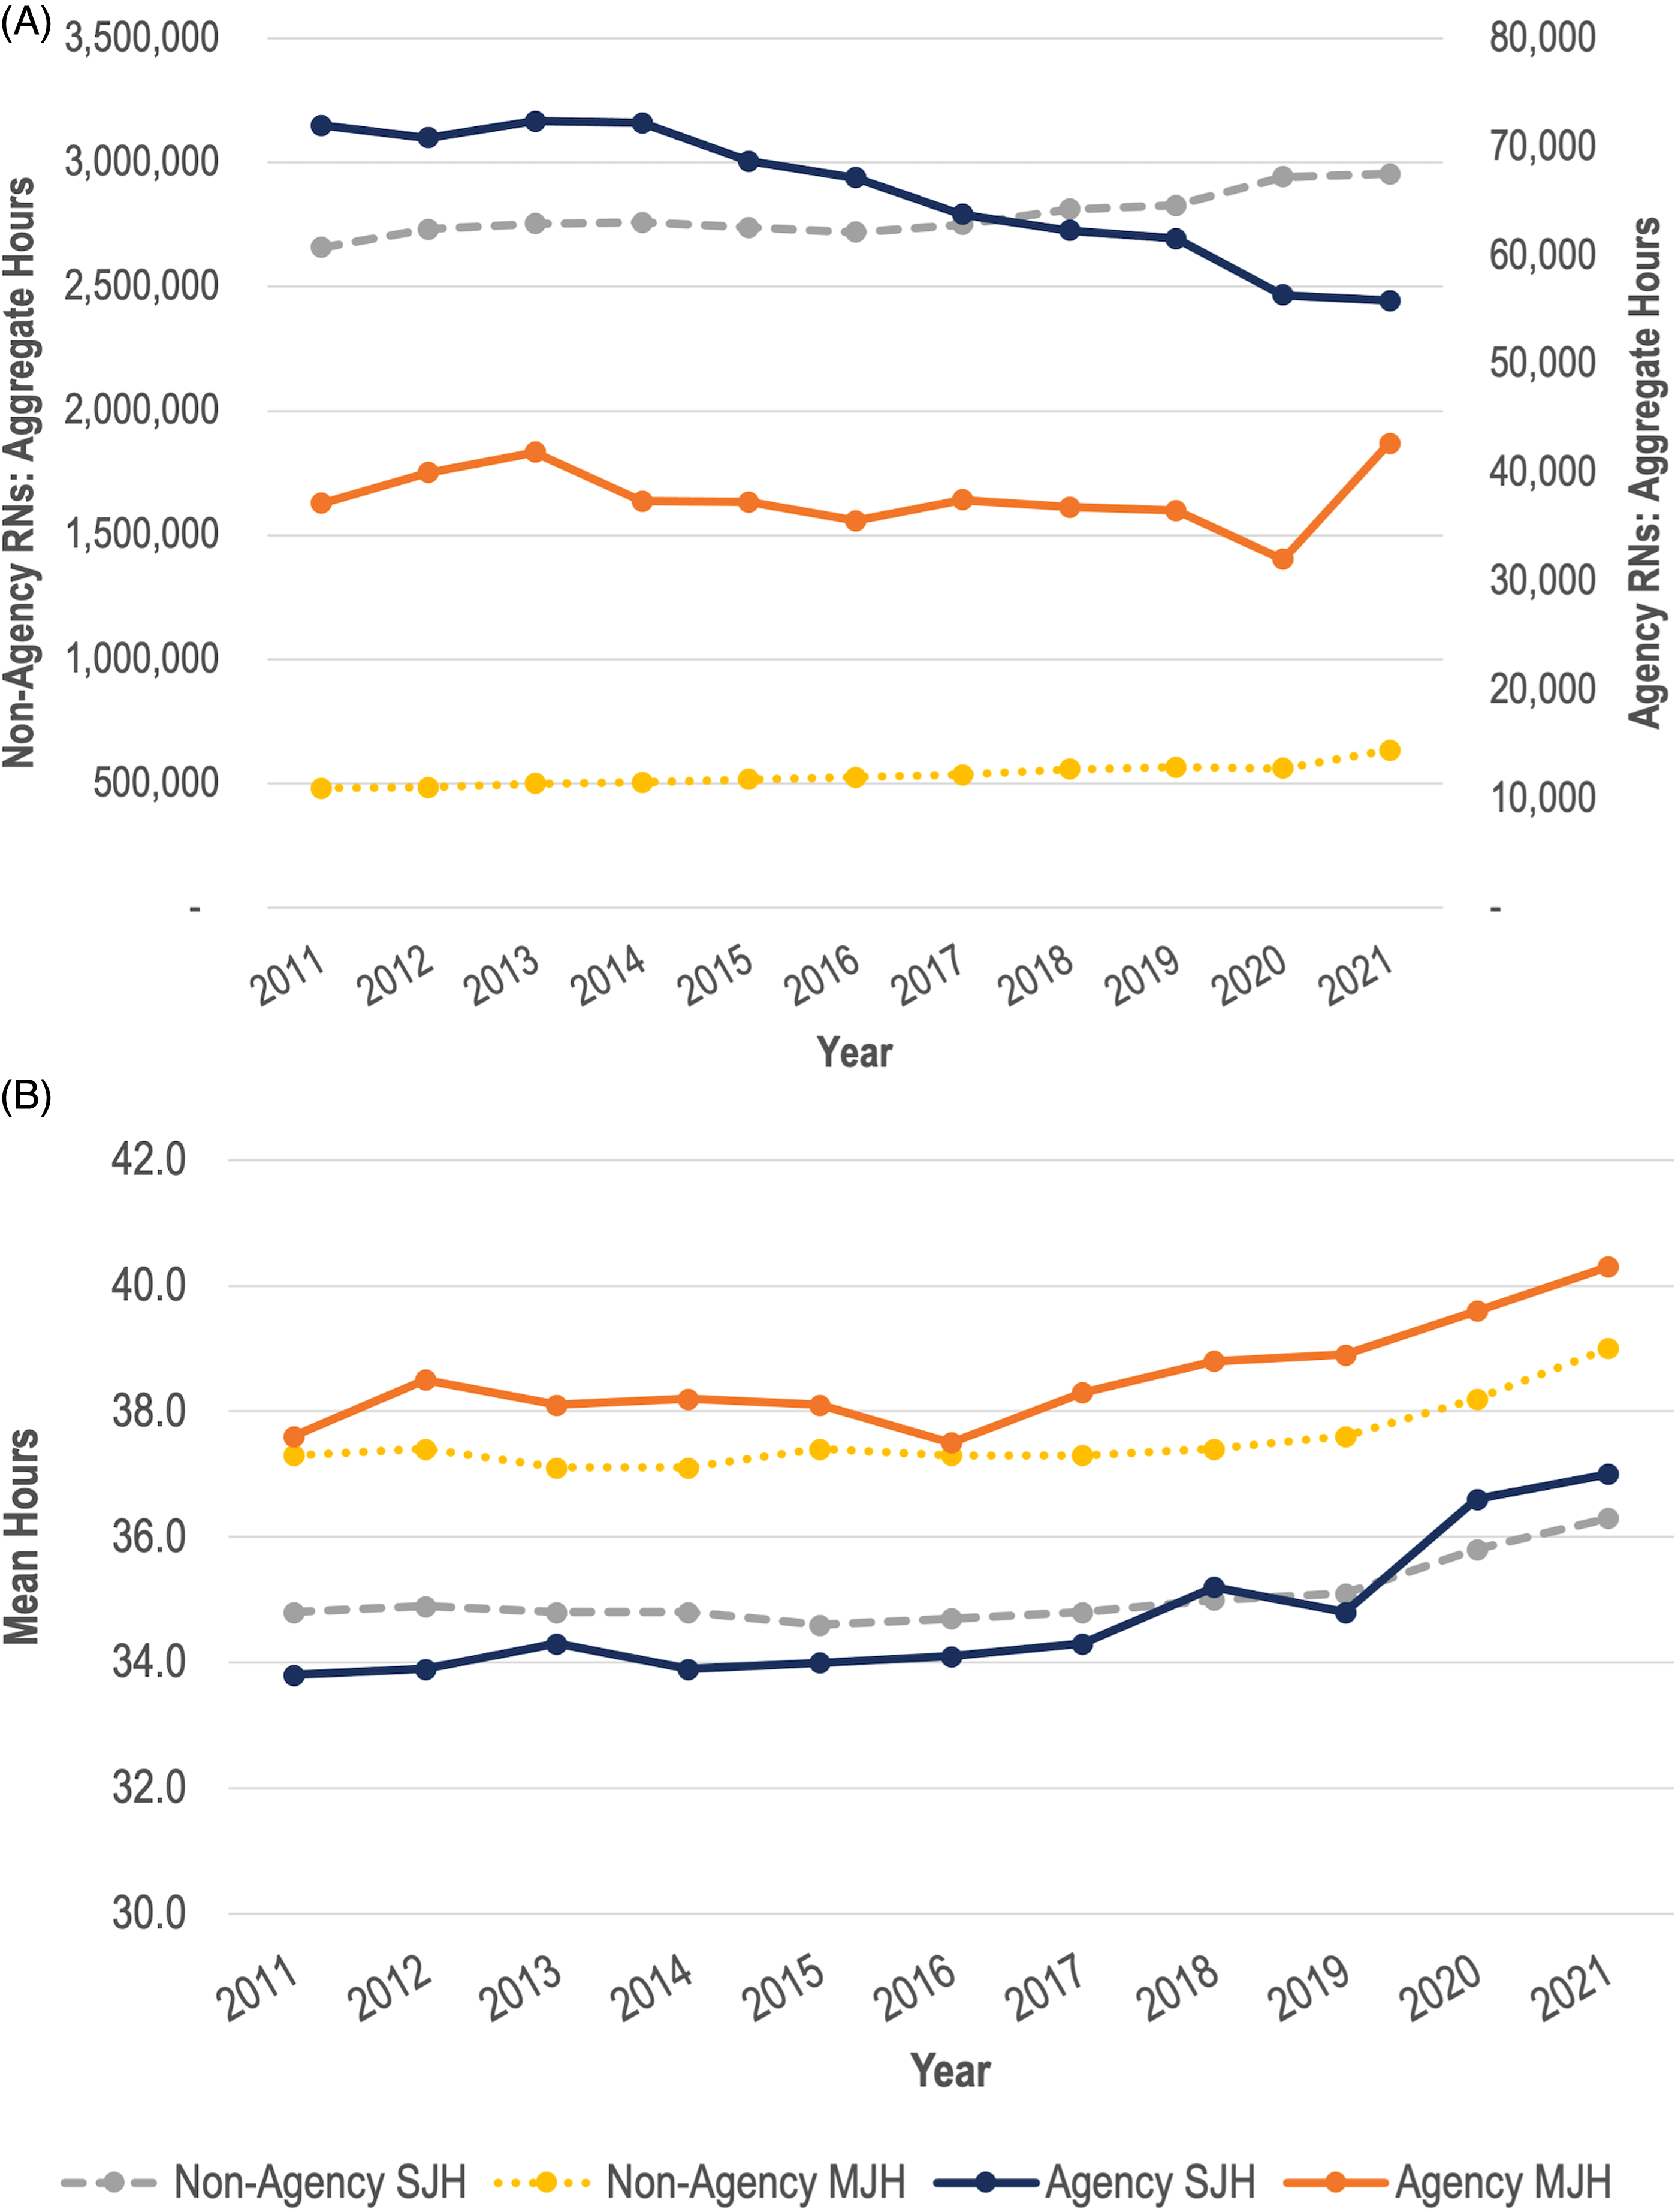
(A): Aggregate hours of agency and non-agency employed Ontario registered nurses (RNs) 2011–2021. (B): Mean hours of agency and non-agency employed Ontario RNs 2011–2021.
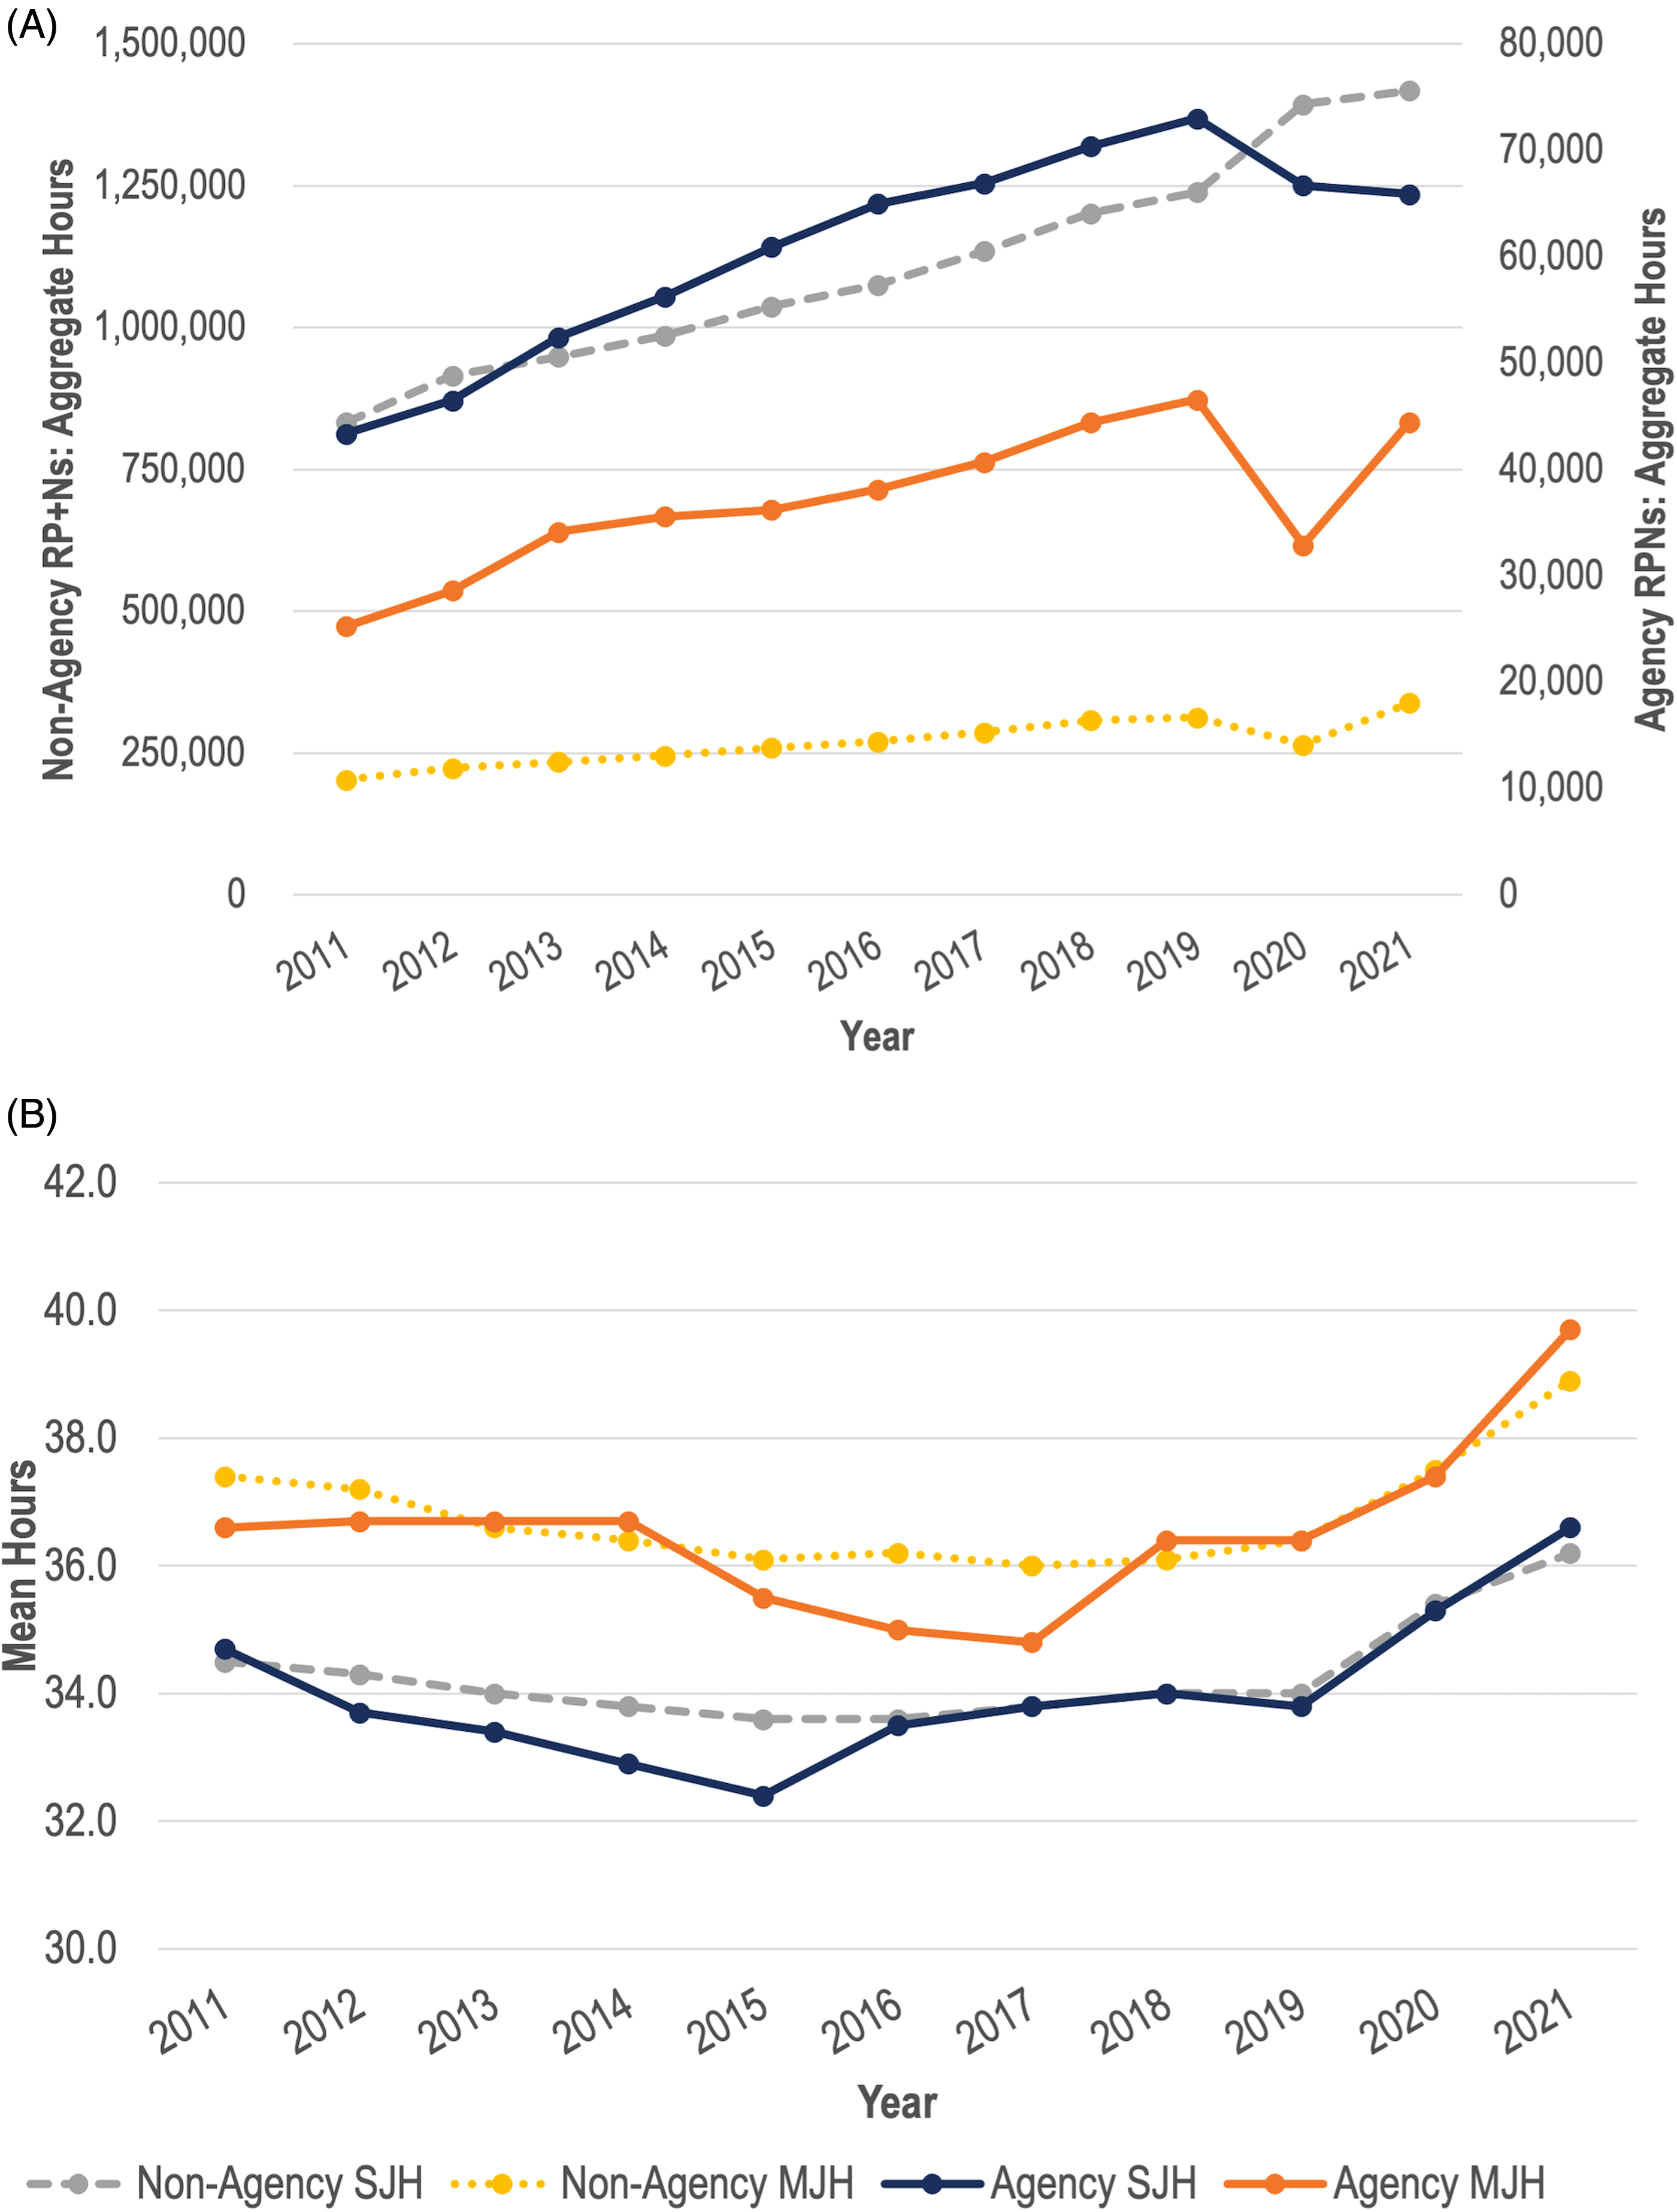
(A): Aggregate hours of agency and non-agency employed Ontario registered practical nurses (RPNs) 2011–2021. (B): Mean hours of agency and non-agency employed Ontario RPNs 2011–2021
Figure 4A shows that, for RNs with one job, aggregate weekly practice hours with agencies trended down from 2011 to 2021, with the rate of decline slightly larger in 2020 than the immediately preceding years, though the effect is small enough that one could say that there is no pandemic effect of policy significance. In contrast, while the total hours worked among multiple jobholding agency nurses dipped very slightly in 2020, it increased markedly in 2021. The aggregate increase in agency work among RNs seems to be entirely among multiple jobholders, although as seen in Figure 3A, the share of single jobholding agency RNs declined markedly in 2021 as such nurses took on multiple jobs. Figure 5A shows a similar set of results for RPNs. Aggregate hours decreased among agency RPNs with one job, while aggregate hours increased for non-agency single jobholders. Moreover, aggregate hours significantly dropped from 2019 to 2020, before returning to near pre-pandemic levels in 2021 among agency multiple jobholders.
At the individual level in Figures 4B (RNs) and 5B (RPNs), for all the nurse categories displayed, average reported hours of work increased in 2020 and, especially, 2021. Multiple jobholding agency RNs exceeded, on average, the 40 h per week threshold. For each of single and multiple jobholders, agency and non-agency nurses (as individuals) work comparable hours, with the exception of multiple jobholding agency nurses who, in most years, work about one extra hour per week than their non-agency peers. While average hours of work of individual multiple jobholding RNs and RPNs is higher than that for single jobholders, aggregate hours exhibit the opposite pattern since most nurses are single jobholders.
Our results suggest that the increase in hours among agency nurses may explain a modest share of the increase in public spending on agency nurses. While, agency transition rates did not significantly increase, across all four groups of nurses the mean individual hours of practice increased in 2020 and 2021 compared to pre-pandemic years. However, aggregate mean hours decreased among agency nurses with one job, driven by the reduction in single jobholding agency nurses in 2020 and 2021. Among agency RNs and RPNs with multiple jobs, aggregate mean hours decreased from 2019 to 2020 before increasing from 2020 to 2021, with aggregate hours in 2021 above that of pre-pandemic norms. Nurses with multiple jobs, especially those employed in both non-agency and agency positions, may be devoting more hours of work to agency jobs. However, due to data limitations, we are unable to determine if this occurred. Moreover, we do not have data on overtime hours. To perform a proper analysis, we would require information on hours of work and agency employment on a per-job basis.
Individual and Other Job Characteristics Among Agency and Non-Agency RNs and RPNs
Table 1 displays descriptive statistics (averaged over 2011 to 2021) on selected individual and job-level characteristics of agency and non-agency nurses. The first two panels of Table 1 (age group and employment preference) include both multiple and single jobholders. However, we restrict the analysis on employment status and category, and health care sector (the bottom three panels), to single jobholders as we cannot determine which job is at an agency among multiple jobholders (though difficult to interpret, see Appendix 2 Table 1 for results on multiple jobholders).
Descriptive Statistics of Agency and Non-Agency Registered Nurses (RNs) and Registered Practical Nurses (RPNs) 2011–2021
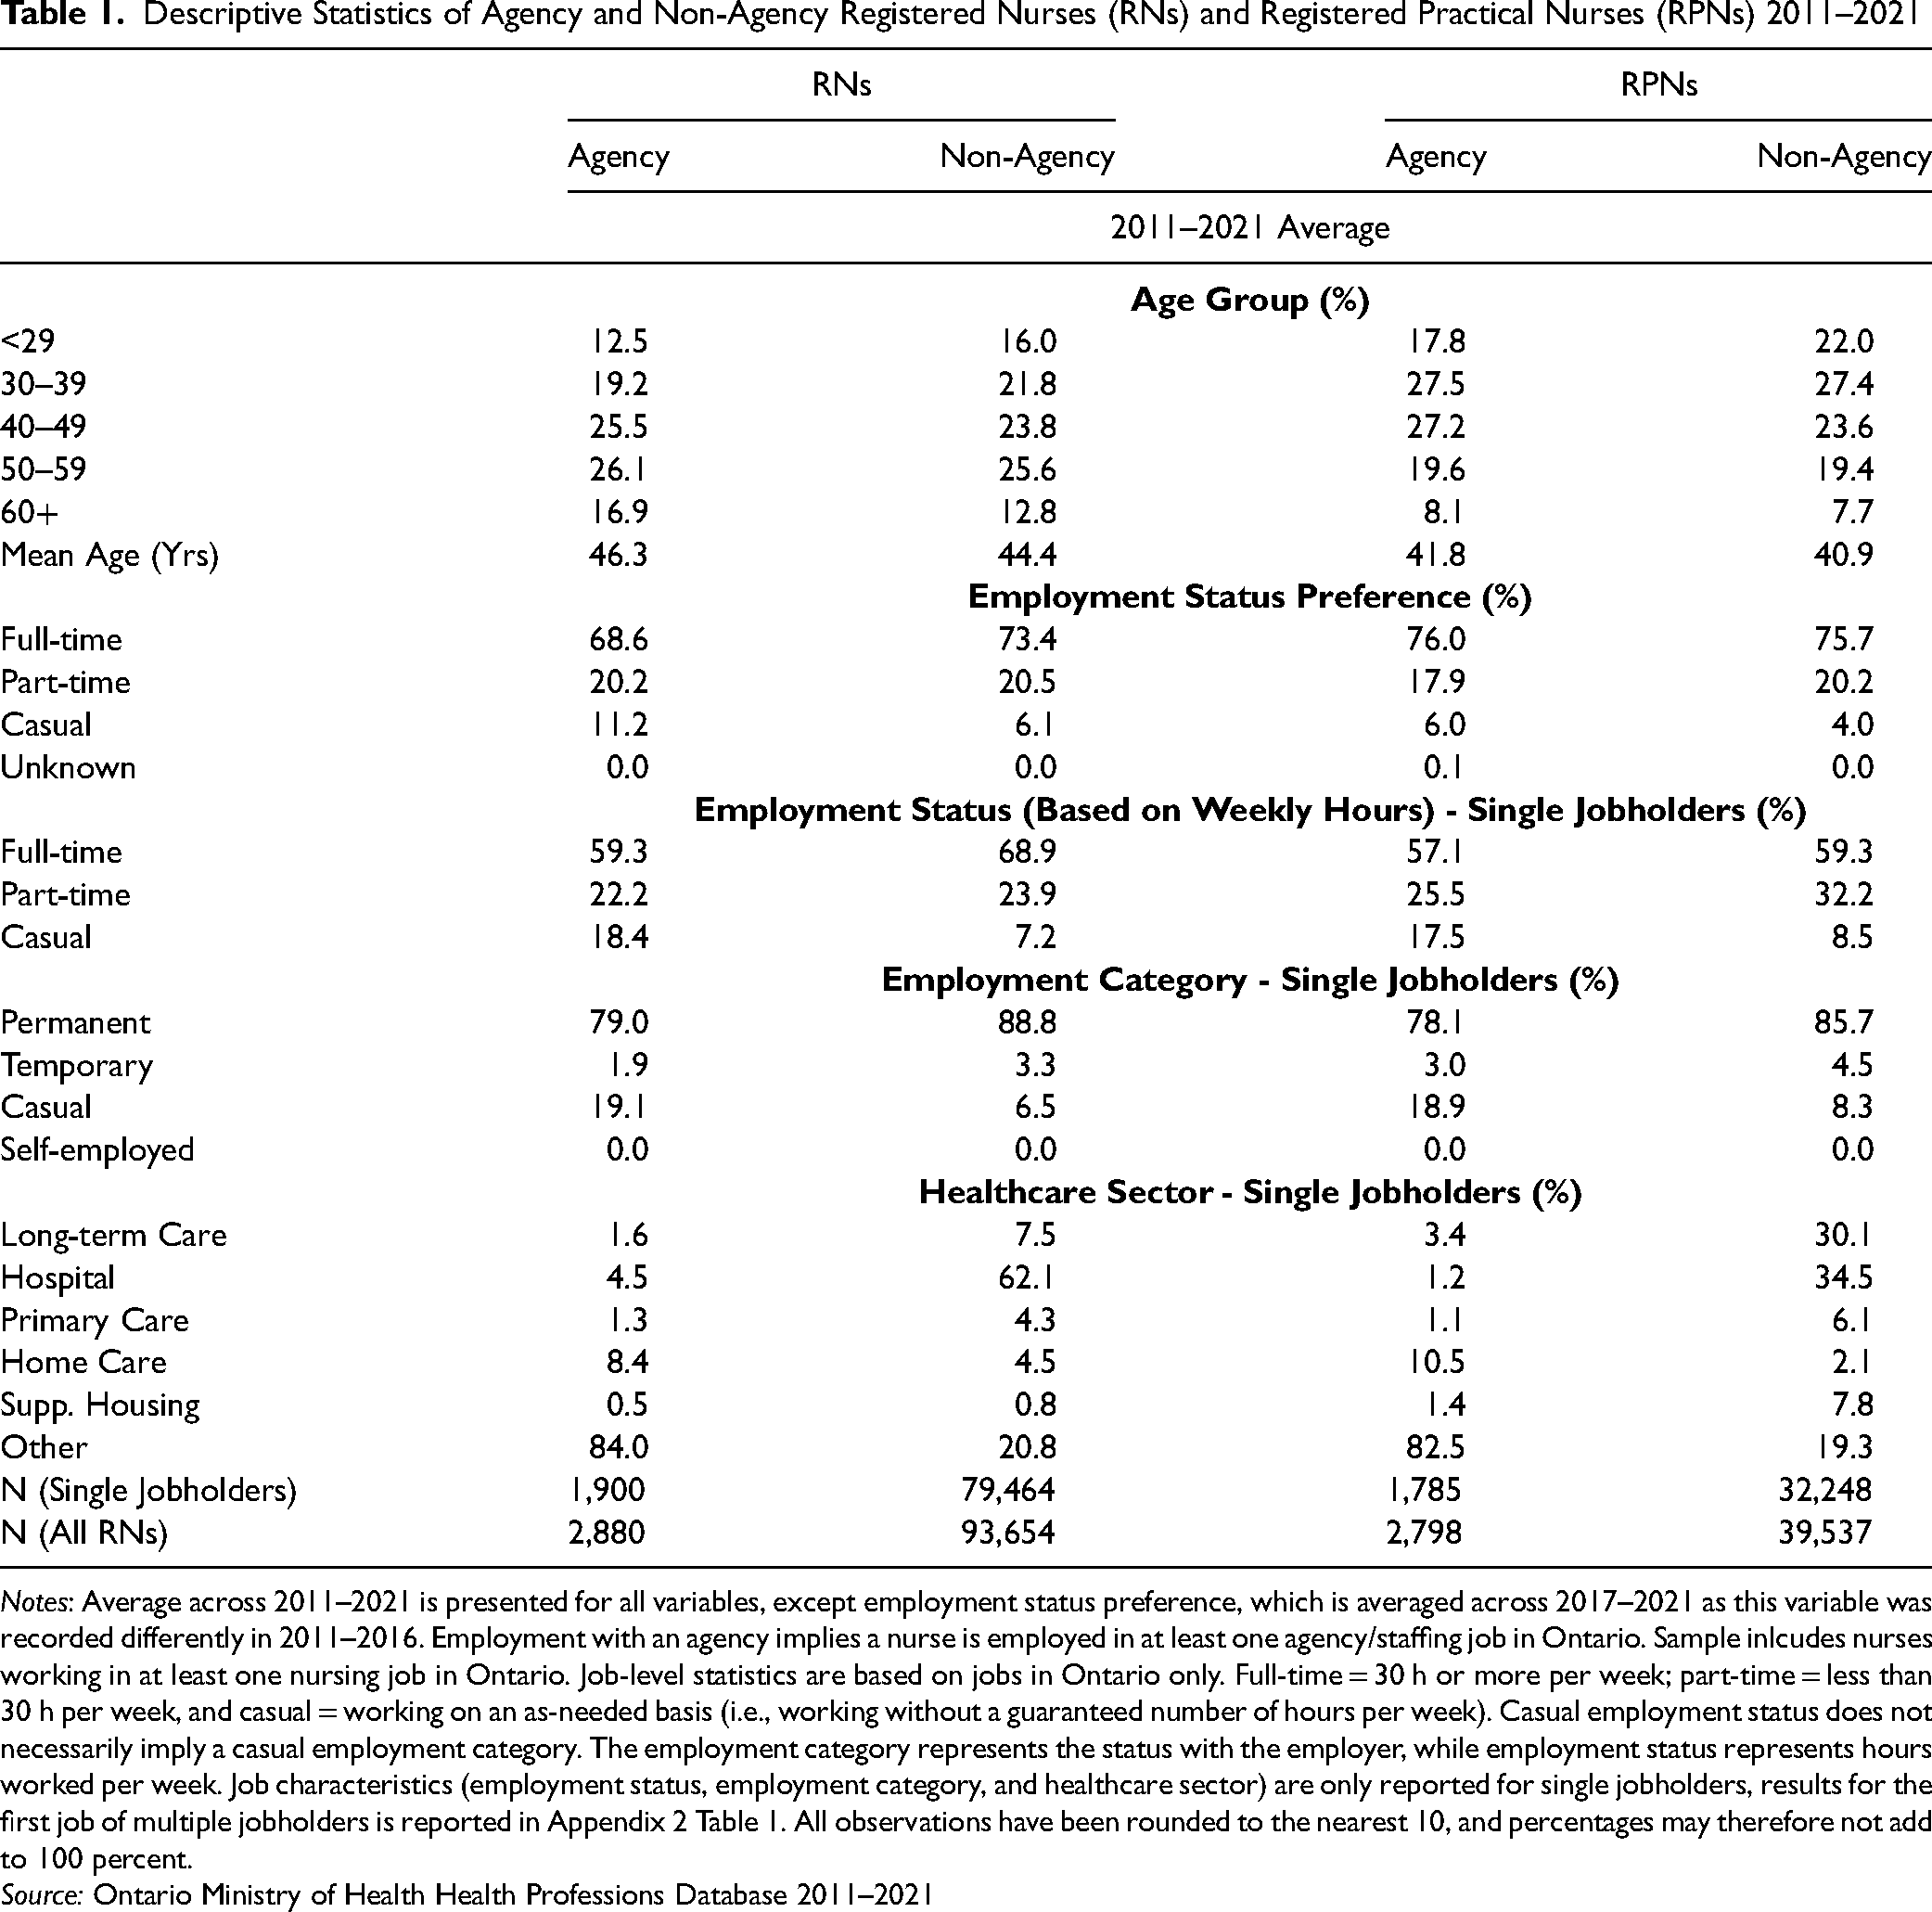
Notes: Average across 2011–2021 is presented for all variables, except employment status preference, which is averaged across 2017–2021 as this variable was recorded differently in 2011–2016. Employment with an agency implies a nurse is employed in at least one agency/staffing job in Ontario. Sample inlcudes nurses working in at least one nursing job in Ontario. Job-level statistics are based on jobs in Ontario only. Full-time = 30 h or more per week; part-time = less than 30 h per week, and casual = working on an as-needed basis (i.e., working without a guaranteed number of hours per week). Casual employment status does not necessarily imply a casual employment category. The employment category represents the status with the employer, while employment status represents hours worked per week. Job characteristics (employment status, employment category, and healthcare sector) are only reported for single jobholders, results for the first job of multiple jobholders is reported in Appendix 2 Table 1. All observations have been rounded to the nearest 10, and percentages may therefore not add to 100 percent.
Source: Ontario Ministry of Health Health Professions Database 2011–2021
In general, agency RNs (the left-hand side of Table 1) are somewhat older than non-agency RNs, with a mean age distribution of 46.3 and 44.4 years, respectively. The age-category distribution is also displayed in Table 1 and similarly indicated the agency workforce is older. This may suggest nurses with more experience choose to work in agencies compared to novice nurses. Agency RPNs, on the other hand, are only slightly older (0.9 years) than their non-agency peers with a mean age of 41.8. Next, the second panel of Table 1 displays the majority of agency and non-agency nurses prefer full-time hours. However, a larger proportion of agency RNs, 11.2%, prefer casual employment hours compared to non-agency RNs (6.1%). The same result is found for RPNs, though the difference in preferences is not as large (6.0% vs. 4.0%). The next panel shows the actual employment status (based on approximate weekly hours) among nurses with one job. For both sets of nurses, most jobs are also full-time for agency and non-agency nurses. Among agency RNs and RPNs, there is a higher share of casual hours compared to their non-agency counterparts. For example, and perhaps surprisingly for some readers, only 18.4% of agency RN positions were casual, compared to 7.2% among non-agency RNs. Agencies are traditionally thought of as being used to cover temporary staff shortages with a casual workforce. However, home care in Ontario is often provided through agencies. Agencies may also offer full-time jobs as a recruitment tool.
The fourth panel of Table 1 displays the employment category of single jobholders. Here, casual does not refer to employment hours, but the status with the employer (i.e., the employment contract). For agency RNs and RPNs there is a higher proportion of casual employment contracts. For example, 18.9% of agency RPNs were employed on a casual basis, compared to only 8.3% of non-agency RPNs. For RNs, these figures are 19.1%, and 6.5% respectively. Finally, the reported health care sector of single jobholders appears in the last panel of Table 1. Most agency RNs (84.0%) and RPNs (82.5%) report their practice setting as “other.” Home care is the second largest reported sector among agency nurses.
Discussion and Conclusions
Our research used an Ontario Ministry of Health dataset that derives from regulatory college records to study the prevalence of agency nurses, the rate at which nurses transition to agency employment, hours of practice, and individual and employment characteristics of agency and non-agency nurses. Overall, we do not find evidence of a large shift to agency employment among RNs and RPNs in Ontario from 2020 to 2021. From 2011 to 2021, 2.4% to 3.4%% of RNs, and 5.6% to 7.1% of RPNs, reported at least one agency job each year. In 2020 agency employment decreased, and then it increased slightly the following year (2021) for both sets of nurses, while continuing to trend below pre-pandemic norms (2011 to 2019). Moreover, agency employment transition rates did not change appreciably during 2020 and 2021. Among RNs, the 2021 transition rate was 1.1%, 0.1 percentage points higher than the highest rate observed. In 2021, the transition rate among RPNs increased from 1.9% to 2.5% (i.e., it reverted to the same rate observed in 2018 and 2019).
We also investigate if an increase in hours of practice among agency nurses may explain the increase in public spending on agency nurses. We split our analysis into four groups: agency and non-agency single jobholders, and agency and non-agency multiple jobholders. Aggregate hours decreased in 2020, and subsequently increased in 2021 among multiple jobholding agency nurses, though we cannot distinguish agency and non-agency hours for this group. Among single jobholding agency nurses, aggregate hours decreased in 2020, and remained similar in 2021, likely due to the reduction of single jobholding agency nurses in 2020 and 2021. This is evident as we find the individual mean hours of practice increased across all four groups of nurses among both RNs and RPNs. Thus, the increase in hours of practice may explain a small part of the increased spending on agency nurses. In addition to an increase in hours, fees charged by agencies have increased (Ha, Grant & Chambers, 2024; Office of the Auditor General of Ontario, 2023). However, our data does not include wages, thus we are unable to determine agency nurse wages prior to, and during the pandemic.
Finally, we compare individual and employment characteristics among agency and non-agency nurses. Agency RNs and RPNs tend to be slightly older, prefer casual employment hours, and be employed in positions with casual hours, compared to their non-agency counterparts. Agency nurses are also more likely to have casual employment relationships, as opposed to permanent or temporary employment contracts. Lastly, agency nurses are more likely to be employed in home care, or “other” sectors, though the latter is likely a reflection of agency nurses not identifying a particular sector as they may work in multiple settings.
Strengths and Limitations
Our data derive from CNO registration data, however, our agency nurse counts and proportions are both greater than those reported in the CNO report (CNO, 2023), although the trends are similar. Knowledge of the methodological differences is useful in comparing the two. First, we classify our data years based on the year of collection, which normally occurs in December with questions being retrospective, whereas the CNO classifies their data based on the subsequent registration year (e.g., our 2021 is classified as CNO's 2022). Second, the CNO's results include dual RNs/RPNs twice (once as an RN and once as an RPN), while we include individuals only once given our policy question. The number of dual RNs/RPNs was 510 in 2011, peaked at 810 in 2020 and declined to 780 in 2021. Next, the employment setting portion of the CNO annual overview is on a per job basis, (e.g., those with two jobs are counted twice); in contrast, our analysis is on a per nurse basis. The data available to us and to Ontario's Ministry of Health does not allow a per job analysis of agency employment.
Our understanding is that the CNO report uses supplementary information available to them which we do not have, mainly, the sector of each agency job. The CNO groups agency nurses who work exclusively in specific sectors (e.g., LTCHs) into that sector as opposed to the nurse staffing agency sector. While we have information on the sector of each job, we do not know which jobs of multiple jobholders is an agency job so we cannot allocate such jobs/workers to sectors. However, our trends over time from 2015 to 2021 look similar to that in the CNO report. Thus, we do not suspect any reporting changes or errors during the pandemic that would underestimate agency nurses compared to previous years.
Though we do not find evidence of an increase in the share of agency nurses, or the agency employment transition rate, there are some data limitations. Agency employment is reported on an individual basis as opposed to a per-job basis, and we are therefore unable to determine which jobs are at an agency among multiple jobholders. While we know the number of nurses with at least one agency job, we can only bound the total number of agency jobs. Despite this limitation, we do observe that any increase in the number of agency jobs is modest at the upper bound. Though legally mandated, our data are self-reported; it is possible that not all nurses employed at an agency answer “yes” to the agency nurse question in the Health Professions Database. Lastly, the most recent year of data available is 2021, and future analysis will be required to determine what long-term effects the pandemic may have on agency employment, although the CNO's reporting shows a decline in the count and share of agency jobs in 2022 (2023 in the report).
While the increasing cost of nursing agencies may pose challenges to the health care system, some health care organizations rely on nursing agencies to temporarily manage staffing shortages, and temporary absences such as sick leave and vacation (Aiken et al., 2013; May et al., 2006; Mudhar, 2022). However, it is important for policymakers to understand the reasons why nurses may favour agency employment over their traditional positions. For example, Ben-Ahmed & Bourgeault (2023) highlight complex intersecting issues including heavy workloads, poor work conditions, mandatory overtime, and inadequate staffing in traditional nursing jobs in Canada. Understanding these issues can aid in the development of effective long-term retention strategies in the overall nurse labour market. Moreover, if policymakers, managers, key nursing stakeholders and the public wish to monitor agency nursing and reconcile reports of increased costs in the media (e.g., Grant, 2023) with actual nursing activity to gauge, for example, value for money in a public health care system, then data on hours of work need to be reported and not only information on costs. Future research on agency employment on a per-job basis, as opposed to an individual nurse-level basis, and analysis beyond the pandemic are recommended.
Supplemental Material
sj-docx-1-ppn-10.1177_15271544241240489 - Supplemental material for The Trajectory of Agency-Employed Nurses in Ontario, Canada: A Longitudinal Analysis (2011–2021)
Supplemental material, sj-docx-1-ppn-10.1177_15271544241240489 for The Trajectory of Agency-Employed Nurses in Ontario, Canada: A Longitudinal Analysis (2011–2021) by Alyssa Drost, Houssem Eddine Ben-Ahmed and Arthur Sweetman in Policy, Politics, & Nursing Practice
Supplemental Material
sj-xlsx-2-ppn-10.1177_15271544241240489 - Supplemental material for The Trajectory of Agency-Employed Nurses in Ontario, Canada: A Longitudinal Analysis (2011–2021)
Supplemental material, sj-xlsx-2-ppn-10.1177_15271544241240489 for The Trajectory of Agency-Employed Nurses in Ontario, Canada: A Longitudinal Analysis (2011–2021) by Alyssa Drost, Houssem Eddine Ben-Ahmed and Arthur Sweetman in Policy, Politics, & Nursing Practice
Footnotes
Acknowledgement:
Hamilton Integrate Research Ethics Board 10947-C. The Health Professions Database (HPDB) was provided by the Canadian Province of Ontario's Ministry of Health. The views expressed in this paper are solely our own and do not necessarily represent the views of the provincial Government of Ontario, or McMaster University. Thanks to Ivy Bourgeault and Michael Veall for helpful comments. This research received funding from an internal McMaster University grant.
Funding
The authors disclosed receipt of the following financial support for the research, authorship, and/or publication of this article: Sweetman holds the Ontario Research Chair in Health Human Resources, endowed by the Ontario Ministry of Health. Drost was funded by an internal McMaster University grant.
Supplemental Material
Supplemental material for this article is available online.
Author Biographies
References
Supplementary Material
Please find the following supplemental material available below.
For Open Access articles published under a Creative Commons License, all supplemental material carries the same license as the article it is associated with.
For non-Open Access articles published, all supplemental material carries a non-exclusive license, and permission requests for re-use of supplemental material or any part of supplemental material shall be sent directly to the copyright owner as specified in the copyright notice associated with the article.