
Abstract
Due to a growing physician shortage, patients have difficulty accessing primary care. In an effort to expand access and support patient health, many states are reducing barriers for advanced practice registered nurses to provide primary care without physician collaboration. Maryland provides an interesting case study. We leverage Maryland's policy change to explore the effects of full practice authority (FPA), focusing on the number of professionals and health outcomes for patients. Employing a border county comparison between Maryland and Pennsylvania, we estimate the effect of FPA. Our analysis of health outcomes focuses on three county-level health outcomes: poor or fair health, poor mental health days, and preventable hospital stays. We find that FPA is associated with increases in the number of certified nurse midwives by 0.6 per 100,000 residents and nurse practitioners by 22.4 per 100,000 residents. We also find evidence of an association of FPA with reductions in the share of residents who report being in poor or fair health by 2.8 percentage points and poor mental health days per month by 0.354 days per person. Combined, our results provide suggestive evidence that moving to FPA improves access to care and leads to improved health outcomes for Maryland residents. Removing regulatory barriers that prevent certified nurse midwives and nurse practitioners from working to the full extent of their training may increase access to primary care and improve patient outcomes.
Introduction
Despite decades of focus on healthcare reform in the United States, access to care remains a serious issue confronting patients. Difficulty accessing primary care presents a particular problem for both rural patients and Medicaid beneficiaries (Xue et al., 2016). A shortage of primary care physicians (PCPs) exacerbates the difficulty of accessing care. The current shortage of PCPs is projected to continue to grow to between 17,000 and 48,000 nationally by 2034 (IHS Markit, 2020). Accessibility challenges for primary care are not just an inconvenience; regular access to healthcare providers is well-documented to positively impact health and quality of life (Bilazarian et al., 2022). Residing in a Health Professional Shortage Areas (HPSAs) is associated with poor health for residents on several outcomes, including disease severity, quality of life, and life expectancy (Allen et al., 2011; Basu et al., 2019).
While some reforms designed to increase the education, training, and retention of physicians are necessary, other healthcare professions like advanced practice registered nurses (APRNs) have the skills and training needed to help meet the demand for primary care services. However, current state laws prevent these skilled professionals from providing primary care to patients in many states without required oversight from physicians, which can constrain their ability to offer primary care or limit the places in which they can locate their practice. State-level scope of practice (SOP) laws govern APRNs, often requiring physicians to serve in a supervisory or collaborative role with APRNs. These laws define each provider's role and dictate the oversight APRNs must have to legally practice.
In this article, we focus on two roles within APRNs who provide primary care: certified nurse midwives (CNMs) and nurse practitioners (NPs). In 2015, Maryland adopted full practice authority (FPA) for CNMs and NPs (Phillips, 2016). To show the effect of moving to FPA for CNMs and NPs, we perform a difference-in-differences analysis with a focus on the geospatial component, comparing Pennsylvania and Maryland—two states that share a border more than 200 miles in length—and their border counties. The purpose of this paper is twofold. Our first aim is to estimate the effect of FPA on the supply of CNMs and NPs, two important providers of primary care. Ensuring that regulatory barriers do not restrict the supply of healthcare professionals is important to ensure that patients have access to care. However, the ultimate goal is improving patient outcomes. To measure this, we also explore the correlation of an increase in the number of CNMs and NPs with the days spent in poor or fair health, poor mental health days per month, and preventable hospital stays. Second, to explore how the change in supply, if at all, may have improved patient health outcomes.
Background
CNMs focus on sexual and reproductive care, diagnosing and treating related ailments. Unlike certified midwives, who are midwives that are recognized and licensed in a handful of states including Maryland, CNMs are trained as nurses and obtain an MSN with their specialty being midwifery. While much of the CNM's focus is around pregnancy and childbirth, they also provide primary care for female patients. NPs diagnose and treat acute and chronic illnesses, prescribe medications, and order tests and procedures. Both CNMs and NPs are a resource of skilled health professionals that can mitigate the shortage of PCPs when state regulations do not create barriers to them practicing to the full extent of their education and training. However, removing the legal barriers does not guarantee that all CNMs and NPs will immediately switch to providing primary care. Despite the ability to provide primary care services without a legal requirement for collaboration with a physician, some APRNs still continue to practice in specialty settings. Almost half of surveyed CNMs and 70% of surveyed NPs reported providing primary care services (AANP, 2022; ACNM, 2022).
States with FPA have more access to primary care, and these gains tend to be concentrated in underserved rural areas (Graves et al., 2016; McMichael, 2018; Timmons et al., 2021). FPA lowers the likelihood that a county contains a HPSA, and patients are less likely to be located more than 30 miles from a primary care provider (McMichael, 2018; Neff et al., 2018). It also increases the frequency of patient visits and improves outcomes through improved access to care (Traczynski & Udaolva, 2018). Interestingly, FPA can increase the supply of APRNs, who prefer to practice in states with FPA (Markowitz & Adams, 2022; Shakya & Plemmons, 2020). There is some evidence that states that move to FPA have a greater supply of NPs, and their growth rate is higher than states with restrictions on NPs’ practice authority (Reagan & Salsberry, 2013), as NPs prefer to practice in those legal environments. However, some recent work has called those findings into question (Kandrack et al., 2021), and other regulatory factors, like eligibility for medical staff membership in hospitals, reimbursement parity with physicians, and independent prescription authority may be more important than independent practice, especially for CNMs (Herndon & Vanderlaan, 2023).
While there is considerable evidence that FPA improves access to primary care, unless the quality of care provided by APRNs is equivalent to physicians, patients may not be better off. The concern may be based on the simple fact that APRNs undergo fewer years of education and training than physicians. However, in general, studies find that APRNs provide high-quality care, similar to physicians, and in some cases slightly higher quality care within the SOP of APRNs (Liu et al., 2020; Swan et al., 2015). APRNs can potentially lower healthcare spending, through lower reimbursement rates and earlier detection of health issues. A large body of research finds evidence that FPA for APRNs can lower healthcare spending (Poghosyan et al., 2019; Smith et al., 2020), while a portion finds that it can increase spending through greater utilization of tests (Hughes et al., 2015).
Our work updates and extends the literature by taking advantage of two highly populated states with different practice environments for APRNs. Maryland's 2015 reform, granting APRNs FPA, differs from other state laws, and ours is the first to explore the effect of Maryland's law change specifically. Furthermore, because we rely on the National Plan and Provider Enumeration System (NPPES) identifying number, we are able to include all CNMs and NPs in a state, instead of relying on a sample. It also avoids concerns about double-counting license holders. We employ a comparison of Pennsylvania and Maryland border counties, which has been used in past work to estimate the effect of state-level health policy changes. For instance, Kleiner et al. (2016) compare metropolitan statistical areas lying on state borders with different levels of practice authority for NPs. Markowitz and Adams (2020) analyze border counties for NP migration decisions based on state SOP laws. McMichael (2018) includes a border county analysis in the appendix of his estimation of the effect of the scope of practice laws on the supply of physicians and NPs. As states continue to grapple with a shortage of primary care providers and reform SOP laws, understanding the effects of policy changes is essential.
FPA laws are similar for APRNs, but because of differences inherent in the nature of the roles, some minor differences exist and are worth defining separately. We rely on the American Association of Nurse Practitioners’ (AANP) definition of SOP laws for NPs, categorizing them as FPA, reduced practice, and restricted practice. While many studies rely on McMichael and Markowitz's (2020) classification, because of the specifics of Maryland's reform, we believe the AANP classification is more appropriate for our analysis. Under FPA, NPs are treated as independent providers. NPs can order testing, prescribe medications, prescribe controlled substances, diagnose, initiate, and manage treatment. They can perform these tasks independently of any required physician supervision or collaboration. Collaboration is common among healthcare professionals of all levels but required collaboration can add unnecessary friction to care. NPs are also able to own and operate their healthcare facilities. If states do not grant FPA, NPs must have a collaborative practice agreement with physicians to provide patient care. The collaborating physician provides direction and oversight of the NP's practice and must be available for consultation or referral. In some cases, the collaborating physician must review a portion of the patients’ charts.
For CNM practice authority, we rely on classifications and data from the American College of Nurse Midwives. In a state where CNMs have FPA, they can practice with full autonomy and have the authority to write prescriptions. While CNMs are typically thought of providing prenatal, intrapartum, and postpartum care, they can provide other types of care, including sexual and reproductive, gynecologic, and, importantly for our analysis, primary care (ACNM, 2022). In the most restrictive states, CNMs are required to sign a collaborative practice agreement with a physician in order to provide care. Collaborative practice agreements can range from simply requiring a relationship with a physician to requiring direct supervision by physicians during patient care (Markowitz et al., 2017). In other states, CNMs are able to offer services without required collaboration with a physician but they must have a collaborative practice agreement to prescribe medication.
Pennsylvania does not grant NPs and CNMs FPA. In Pennsylvania, NPs are required to maintain formal collaborative practice agreements with at least two physicians. CNMs in Pennsylvania are also required to enter into collaborative practice agreements with physicians.
Maryland removed the requirement for APRNs to have a collaborative practice agreement in 2010, but they did not adopt FPA as commonly understood. CNMs and NPs were required to complete an attestation form with a physician, who would provide advice or consultation as necessary. While their day-to-day practice environment was more independent, tying reimbursement to the attesting physician still restricted the supply of CNMs and NPs (Kaplan, 2015). In 2015, Maryland removed the attestation requirement for CNMs and NPs to practice, with the intention that they practice in rural locations with fewer practicing physicians (MD HB999, 2015).
Methods
Data
For our analysis of the effect of FPA on the supply of NPs and CNMs, we use a panel of data covering the years 2016–2021 from NPPES to compare the number of NPs and CNMs in Maryland and Pennsylvania. The NPPES assigns unique identifiers to each healthcare professional and is the standard identifier for all healthcare providers. We rely on NPPES instead of other sources, like Area Health Resource File (AHRF), because the NPPES contains a unique identifier for each professional. While the AHRF has more years available, it would also double-count nurses, potentially biasing our results. NPPES contains the entire universe of providers, allowing us to identify each professional instead of relying on a survey, or those that offer care for patients relying on a specific type of insurer.
We retrieved the annual provider counts from the NPPES dataset in March, annually from 2016 to 2021. Data is not available prior to the Maryland policy change in 2015. While this removes our ability to make any causal claims, it still allows us to provide suggestive evidence. For each year, we identify the practice locations of various providers, specifically practicing states, and count the number of providers within each state. Several providers practice in multiple locations, although they are identified by a single identifier. Since they deliver services to patients in different places, providers may be recorded and counted at each active practice location (Shakya et al., 2022). The National Provider Identifier (NPI) dashboard website uses a similar strategy to measure the numbers for healthcare providers.
Next, we gather state population data from the American Community Survey of the U.S. Census Bureau. Then to generate the healthcare provider density per 100,000 residents, we take the ratio of the numbers of respective healthcare providers to the state resident population and multiply it by 100,000 for each state and each year. We use the subset of taxonomy codes for level II/III classification to identify the following primary care providers, Nurse Practitioners (NP), Obstetrics and Gynecology (OBGYN), Advanced Practice Midwives or Certified Nurse Midwives (CNM), and Primary Care Physicians (PCPs) from NPPES using the npidb.org database and the National Uniform Claim Committee. Level II provides a more specific classification for the type of provider, while level III provides the area of specialization or the services that the professional makes available.
For our analysis of health outcomes as a result of moving to FPA for CNMs and NPs, we focus on three county-level health outcomes: poor or fair health (percentage of adults reporting fair or poor health), poor mental health days per month (average number of mentally unhealthy days reported in the past 30 days), and preventable hospital stays (rate of hospital stays for ambulatory-care sensitive conditions per 100,000 Medicare enrollees). We obtained data from 2022 County Health Rankings data compiled by the University of Wisconsin Population Health Institute under the support of the Robert Wood Johnson Foundation. While these measures are less directly related to FPA laws, we expect that the reform should impact health outcomes through improved access to care. We expect that NPs will have a greater impact than CNMs on health outcomes because a greater proportion of their tasks are directly related to primary care.
Methodology
To better understand the effects of FPA in Maryland, we use Pennsylvania as a benchmark—a state that does not grant NPs and CNMs FPA. We first simply compare means of density in Maryland and Pennsylvania from 2016 to 2021. We then explore the statistical significance of any differences we observe using regression analysis. We replace the temporal dimension of standard difference-in-differences, with the geospatial component, and develop the border contiguity-based difference-in-differences (Deyo & Plemmons, 2022; Shakya & Fries, 2023; Shakya & Ruseski, 2023). We perform two statistical tests. The first compares all counties in Pennsylvania to Maryland. Our second test focuses specifically on bordering counties—counties that we might otherwise expect to be similar besides a geographic boundary. Border analyses where policy differences exist between the bordering states have been used to identify the effect of policy changes (Dube et al., 2010; Shakya & Ruseski, 2023). We perform a cross-sectional analysis using data from 2022 County Health Rankings to better understand the effects of APRN FPA on our three county-level health outcomes: poor or fair health, poor mental health days per month, and preventable hospital stays. We rely on a cross-section of data for health outcomes because the variables are slow to change, resulting in little variation between years. Furthermore, the health outcomes included in the survey regularly change between surveys, making the creation of a panel difficult.
In our regression analysis exploring the effects on APRN density we include year dummy variables (or year fixed effects) that control for changes in our dependent variable associated with annual differences. We also adjust our standard errors for clustering at the state level in both regressions. We do not include any additional covariates in our regressions to avoid the possibility of collider biases in our regression estimates (Cinelli et al., 2022).
Findings
Provider Density
We begin our analysis by simply examining the density of healthcare providers in Pennsylvania and Maryland from 2016 to 2021. Table 1 compares the density of healthcare providers (per 100,000 residents) in Maryland and Pennsylvania for each year in our sample. Since 2016, Maryland has had a greater density of NPs, CNMs, and physicians specializing in OBGYNs than Pennsylvania and a similar number of PCPs. In Maryland, NPs per 100,000 residents grew from 64.8 to 107, an increase of 65%. In Pennsylvania, the change was 59.2 to 92.5, a 56% increase. However, Pennsylvania, the more populated state, has a greater number of NPs. For instance, in 2020, there were 11,032 NPs practicing in Pennsylvania, while there were just 5,952 practicing in Maryland. The change in CNMs was smaller, in both absolute terms and percentage. They increased by around 0.6 per 100,000 residents in both states, for an increase of 17% in Maryland and 36% in Pennsylvania. There are fewer CNMs than NPs. Pennsylvania had 314 active licenses in 2020, while Maryland had 234.
Health Provider Density (per 100,000).
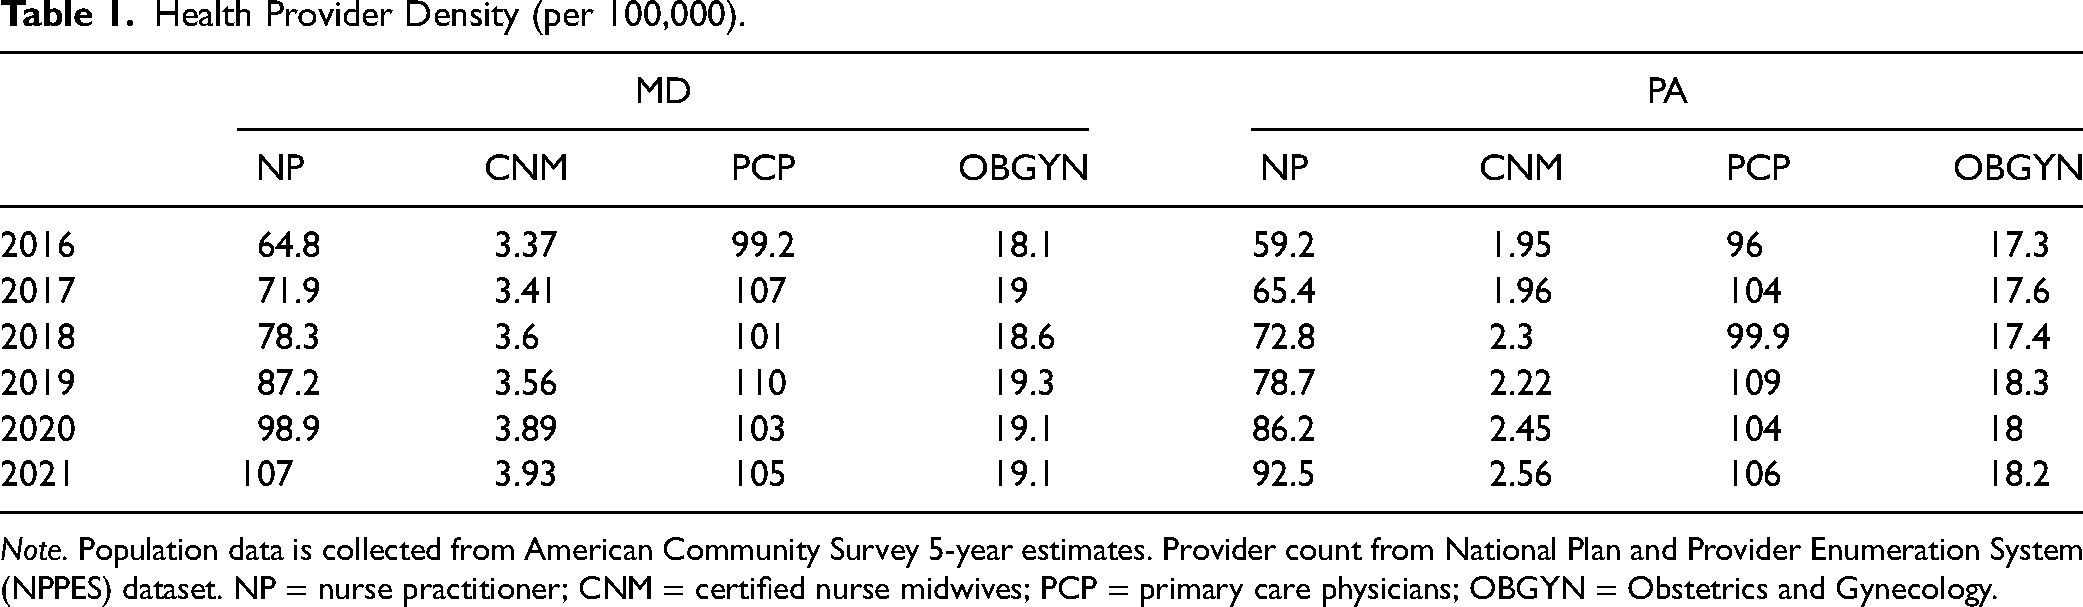
Note. Population data is collected from American Community Survey 5-year estimates. Provider count from National Plan and Provider Enumeration System (NPPES) dataset. NP = nurse practitioner; CNM = certified nurse midwives; PCP = primary care physicians; OBGYN = Obstetrics and Gynecology.
Figure 1 plots the figures in Table 1 to show NP density is growing faster in Maryland than in Pennsylvania, which might be attributable to the change in APRN SOP in Maryland in 2015. Maryland removed a requirement for NPs and CNMs submitting an attestation form with the name of a physician collaborator in 2015, which makes it easier for APRNs to both obtain positions and receive patients (McMichael & Markowitz, 2020). The density of NPs is higher in Maryland than in Pennsylvania. PCP density is very similar in both states.
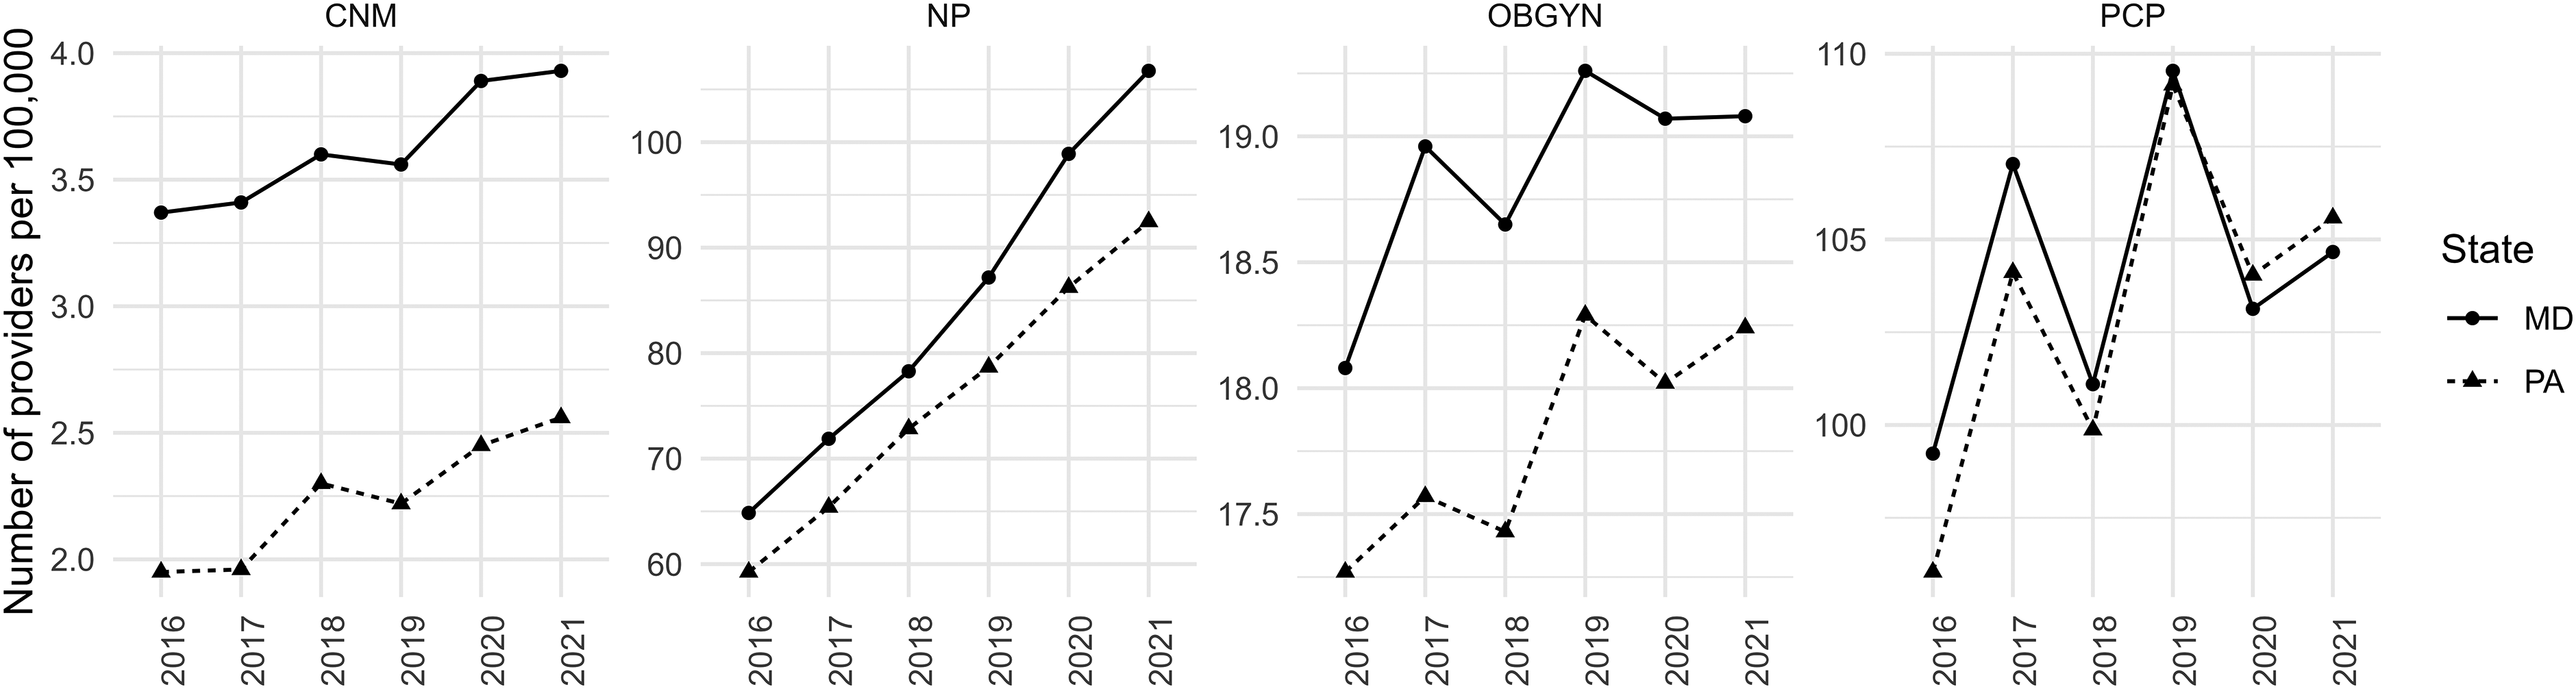
Healthcare provider density, per 100,000 residents, from 2016 to 2021.
Our analysis shows that the gap in NP provider density more than doubled (from 5.6 to 14.5) after adopting FPA in Maryland: In 2016 the provider density for NPs was 64.8 in Maryland and 59.2 in Pennsylvania, a difference of 5.6. However, by 2020 NP density per 100,000 residents was 107 in Maryland and 92.5 in Pennsylvania, a difference of 14.5. The difference in CNM density between Maryland and Pennsylvania fell during our window of analysis. It is important to note that differences in characteristics between the states may account for some or all of the differences in the number of healthcare professionals. As a result, we next turn to regression analysis.
We begin in Table 2 by comparing the density of healthcare professionals for our full sample of Pennsylvania counties to the full sample of Maryland counties. We find that, on average, Maryland counties have about 1.2 more CNMs per 100,000 residents and 21.9 more NPs per 100,000 residents. These differences are statistically significant.
Estimates of Average Differences in Health Provider Density Across Pennsylvania and Maryland Counties.
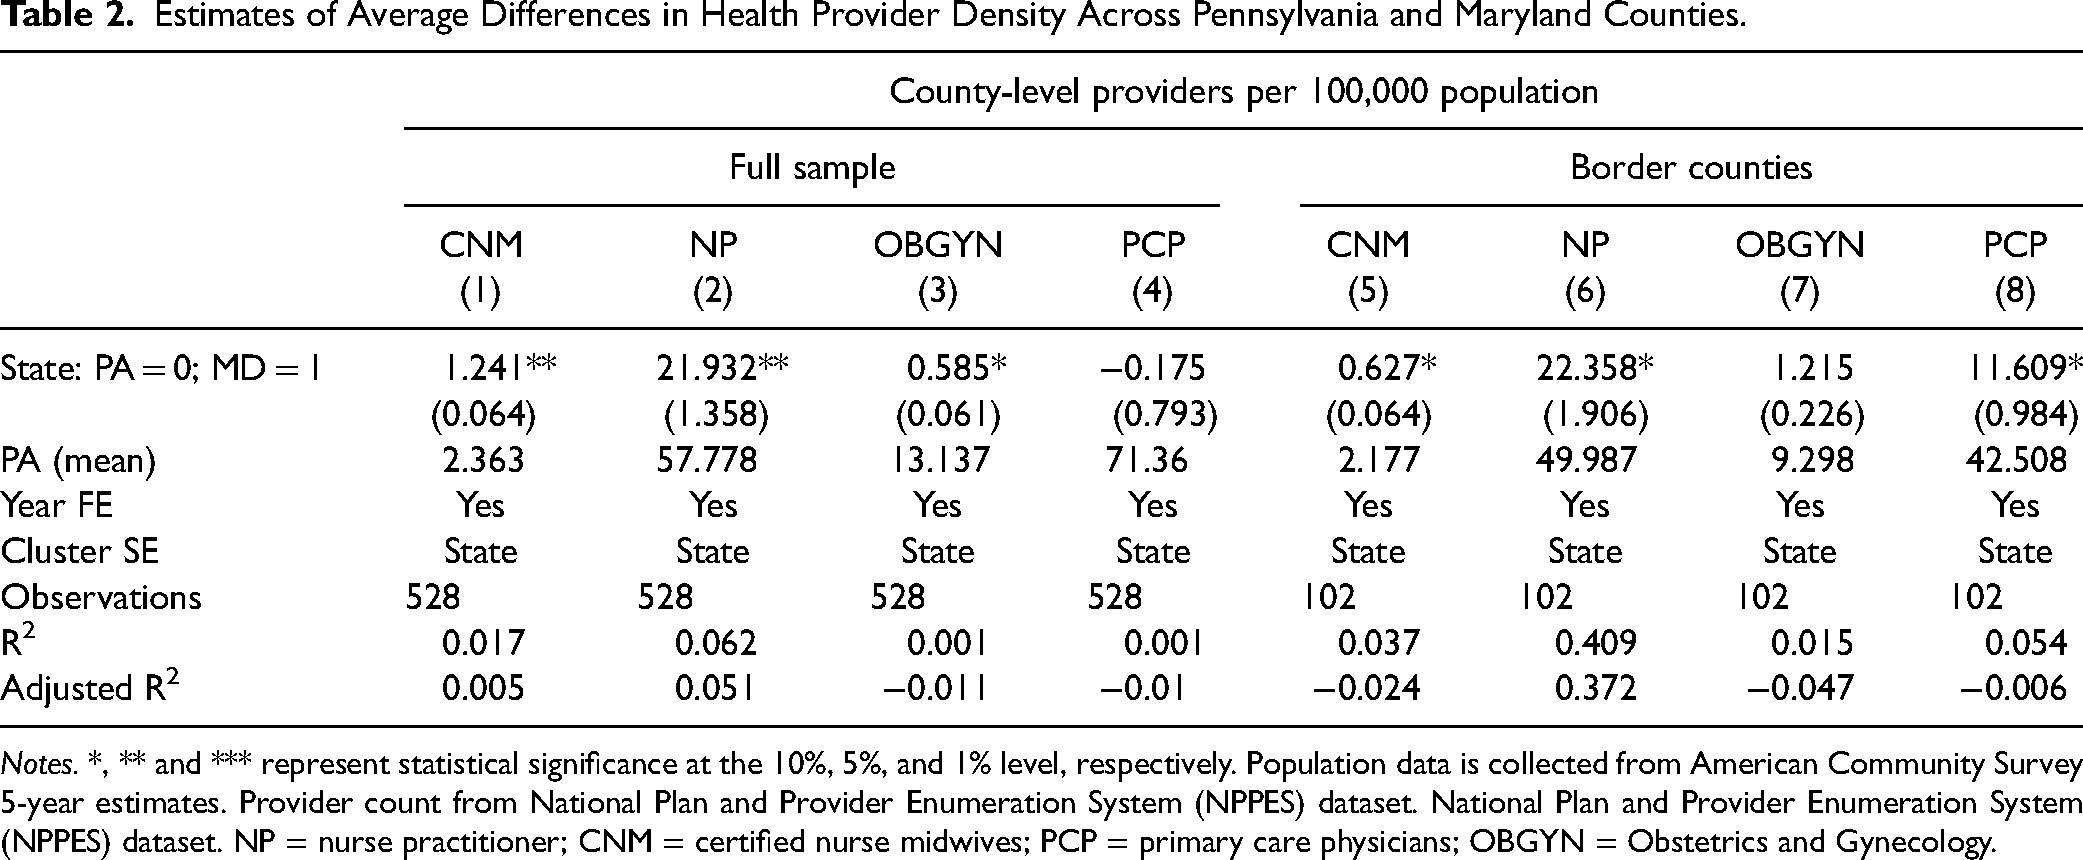
Notes. *, ** and *** represent statistical significance at the 10%, 5%, and 1% level, respectively. Population data is collected from American Community Survey 5-year estimates. Provider count from National Plan and Provider Enumeration System (NPPES) dataset. National Plan and Provider Enumeration System (NPPES) dataset. NP = nurse practitioner; CNM = certified nurse midwives; PCP = primary care physicians; OBGYN = Obstetrics and Gynecology.
For the second part of Table 2, we compare the density of healthcare professionals between Pennsylvania and Maryland border counties. Other things held equal; we would expect border counties to be similar outside of the regulations in place for the respective state. The results for CNMs and NPs are consistent with the previous model. Maryland border counties have about 0.6 more CNMs per 100,000 residents and 22.4 more NPs per 100,000 residents, and both of these gaps are statistically significant. If the differences we observed in Maryland were associated with factors unrelated to FPA, we might expect to observe differences in OBGYN and PCP density, but that is not the case. The differences observed in OBGYNs and PCPs are less consistent and not statistically significant between tests.
Health Outcomes
Table 3 shows average differences in health outcomes between Pennsylvania and Maryland. In columns (1)–(3), we compare the difference between the full sample of Pennsylvania and Maryland counties. On average, we find that the percentage of adults reporting poor or fair health is lower in Maryland counties than in Pennsylvania counties by 2.5 percentage points. People in Maryland also reported 0.443 fewer days in poor mental health per month per person than in Pennsylvania over the last month. Lastly, Maryland counties experienced nearly 490 fewer hospital stays per 100,000 Medicare enrollees.
Estimates of Average Differences in Health Outcomes Across Pennsylvania and Maryland Counties.
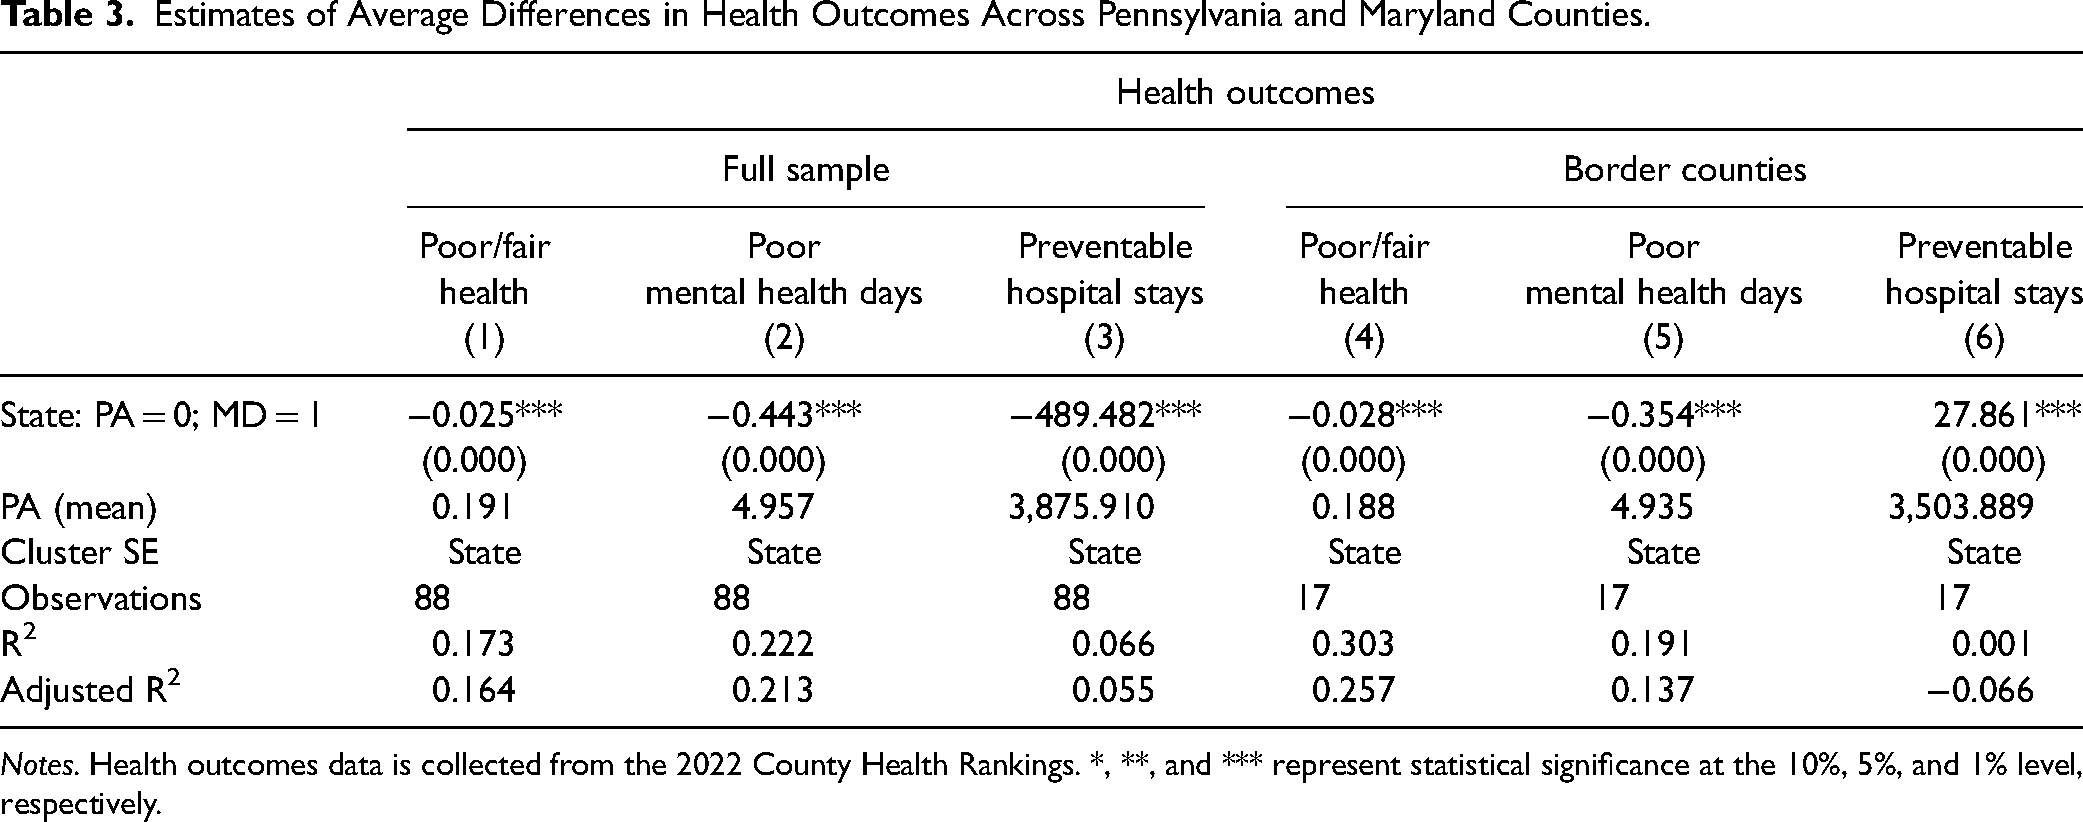
Notes. Health outcomes data is collected from the 2022 County Health Rankings. *, **, and *** represent statistical significance at the 10%, 5%, and 1% level, respectively.
In columns (4)–(6), we focus our attention on the difference between the border counties of Pennsylvania and Maryland. On average, we find that the percentage of adults reporting poor or fair health is lower in Maryland than in Pennsylvania by 2.8 percentage points (14.9%). People in Maryland also reported 0.354 (7.2%) fewer days in poor mental health per month than in Pennsylvania. For preventable hospital stays, Marylanders have, on average, a slightly higher rate than Pennsylvania, but the size of the difference is negligible.
Overall, our analysis indicates that Maryland has better health outcomes than Pennsylvania. This is consistent with the literature that tends to find that limited access to care reduces patient health outcomes. While both CNMs and NPs provide primary care, a smaller proportion of CNMs do so and their primary care is likely to be directly related to these outcome measures. As a result, these results are likely to be driven primarily by NPs.
Discussion
Our findings provide evidence of an association between FPA for CMNs and NPs and improved access to primary care. We also find evidence that this improved access yields tangible improvement in patient health outcomes. We can use this estimate of the effect of Maryland's FPA expansion to project the expected effect of the same reform in Pennsylvania. Within a few years of FPA for APRNs, Maryland experienced a growth in the supply of CNMs and NPs relative to Pennsylvania. We would expect a similar effect in Pennsylvania, where the adoption of FPA would increase the supply of CNMs and NPs. Our findings confirm past work which finds evidence that FPA increases access to care without worsening patient outcomes, and in some cases improving them.
Our study does suffer from some limitations. The NPPES data does not allow us to account for provider mobility, only allowing us to examine pre-2016 trends in NPI enumeration. Healthcare providers must enumerate or register an NPI, however, they might relocate and practice in different locations. Because we do not include pre-2016 trends, we cannot perform a traditional difference in differences estimation with a temporal dimension. Our analysis would be improved by observations from Maryland and Pennsylvania prior to treatment. Furthermore, there are differences between Maryland and Pennsylvania that we are unable to account for. Although the border county comparison should attenuate much of this variation, state characteristics or regulatory policy may still have some impact on our results. For instance, Maryland has a unique all-payer rate-setting model for healthcare spending, although Pennsylvania began a similar version for rural areas in 2019. Data limitations prevent us from exploring this, but we believe that focusing on border counties allows us to establish the Pennsylvania border counties as a “control” group and the Maryland counties as “treatment.” Nevertheless, we do not claim that our results are causal but instead are providing suggestive evidence. While a considerable proportion of CNMs and NPs provide primary care to patients, it is important to recognize that not all do so. Finally, our comparison focuses on Maryland and Pennsylvania. Our results are not generalizable to the effects of FPA for other states, or for other countries where scope of practice laws and primary care are defined differently than the in the United States.
In summary, we find evidence of higher densities of NPs and CNMs in Maryland relative to Pennsylvania. This difference persists when we focus on border counties where we would expect differences in state rules and regulations to be pronounced.
Conclusion
Our study provides the first attempt at measuring the impact of Maryland's APRN FPA on access to primary care. We also use those estimates to better understand the possible impact of Pennsylvania enacting a similar reform. Our results suggest that FPA for NPs and CNMs is associated with increases in access to primary care. The border counties of Maryland have 22.4 more NPs per 100,000 residents and 0.6 more CNMs than the border counties of Pennsylvania. Our statistical analysis finds no evidence of a difference in the number of physicians between the two states, suggesting that the difference in CNMs and NPs is more likely to be related to regulatory policy specific to these professions.
The greater access to care in Maryland appears to have a tangible impact on patients. We find evidence that Maryland residents have better health outcomes than Pennsylvania residents. The Maryland border counties have 2.8 percentage points fewer residents who report being in poor or fair health and 0.354 fewer poor mental health days per month per person. While our analysis cannot establish causality, previous work has made clear that access to care improves health outcomes, suggesting that this is a likely mechanism. Our results show that there is an association between removing regulatory barriers to CNMs and NPs working to the full extent of their training and increased access to primary care and improved patient outcomes.
Supplemental Material
sj-docx-1-ppn-10.1177_15271544231212155 - Supplemental material for Advanced Practice Registered Nurse Full Practice Authority, Provider Supply, and Health Outcomes: A Border Analysis
Supplemental material, sj-docx-1-ppn-10.1177_15271544231212155 for Advanced Practice Registered Nurse Full Practice Authority, Provider Supply, and Health Outcomes: A Border Analysis by Kihwan Bae, Conor Norris, Shishir Shakya and Edward Timmons in Policy, Politics, & Nursing Practice
Footnotes
Funding
The authors disclosed receipt of the following financial support for the research, authorship, and/or publication of this article: Funding for this article was received from The Commonwealth Foundation for a policy brief on the subject.
Supplemental Material
Supplemental material for this article is available online.
Author Biographies
References
Supplementary Material
Please find the following supplemental material available below.
For Open Access articles published under a Creative Commons License, all supplemental material carries the same license as the article it is associated with.
For non-Open Access articles published, all supplemental material carries a non-exclusive license, and permission requests for re-use of supplemental material or any part of supplemental material shall be sent directly to the copyright owner as specified in the copyright notice associated with the article.