
Abstract
A healthcare workforce representative of the race/ethnicity composition of the population it serves is central to addressing systemic health inequities. The aim of this study was to assess workforce trends of underrepresented minority (URM) nurses using the National Sample Survey of Registered Nurses years 2008 and 2018 and the American Community Survey years 2010 and 2019. We examined changes over time in URM composition (Black/African American (B/AA), Latine, American Indian/Alaskan Native (AI/AN), Native Hawaiian/Pacific Islander (NH/PI)) for registered nurses (RN), nurse practitioners (NPs), educational attainment (diploma/associate, BSN, MS(N)/PhD), job type (patient care, research, administration/supervision, teaching, other), and rural/urban location using descriptive statistics and bivariate regressions. While the proportion of the URM RN workforce grew significantly, the only URM group demonstrating proportional gains in the APRN workforce were Latine nurses. URM representation in educational attainment grew across all degree types. By 2018/2019, Latine nurses have their largest representation in the Dipl./ASN degree group and saw a proportional decline for PhD educated nurses. B/AA nurses have their largest representation at the MS(N)/PhD level. However, smaller proportions of B/AA nurses were working as APRNs compared to their non-URM colleagues. At the PhD level, few B/AA nurses were represented in research and teaching positions. A subgroup analysis of unemployed nurses seeking work revealed that B/AA and AI/AN nurses were overrepresented among unemployed nurses. While today's nursing workforce is more representative of the nation than ever before, results show unequal representation of URM and non-URM nurses across the ranks of the nursing professions that suggest unequal career and labor market opportunities.
Introduction
Note that this paper follows recent guidelines on reporting race and ethnicity in medical journals (Flanagin et al., 2021). Accordingly, we use Latine to describe all people of Spanish-speaking Latin American heritage.
Health care providers’ implicit biases can result in lower quality of care for patients of color, contributing to systemic health disparities. Evidence suggests that race concordance between providers and patients can help increase access to care, improve patient outcomes, and increase patient satisfaction (Alsan et al., 2019; LaVeist & Nuru-Jeter, 2002; Takeshita et al., 2020). Research also suggests that health care providers from underrepresented groups are more likely to serve underrepresented and vulnerable patient populations (Jetty et al., 2022). For the nursing profession, a workforce representative of the race/ethnicity profile of the U.S. population is important to the representation of cultural perspectives reflective of all Americans across all domains of nursing, including the clinical setting, education, and research (National Academy of Medicine & National Academies of Sciences, 2021).
Understanding the race/ethnicity profile of the nursing workforce has been of interest to nursing researchers for several decades. A study by Buerhaus and Auerbach in 1999 using data from the National Sample Survey of Registered Nurses and the Current Population Survey reports on the slow growth of nurses from B/AA, Latine and other mixed race backgrounds between 1977 and 1997 with B/AA nurses making up 4.2% and Latine nurses making up only 1.6% of the workforce in 1997 (Buerhaus & Auerbach, 1999). More recent research documented that the number of nurses from communities of color increased in cohorts of newly licensed RNs from 22% to 26% between 2004 and 2014, this growth was mainly driven by Latine nurses (Kovner et al., 2018). Another study using data from the American Community Survey for the years 2010–2015 reported that the number of B/AA and Latine nurses who completed graduate education grew from 8% to 16% for B/AA nurses and 11% to 13% for Latine nurses, but that the diversity of the RN workforce continued to lag behind the race/ethnicity composition of the U.S. population (Zangaro et al., 2018).
In 2010, the IOM “Future of Nursing” report recognized the need for increased diversity within the nursing profession to care for a diversifying U.S. population (Institute of Medicine, 2011), however diversity was not included as one of the goals. In 2014, when the IOM assessed progress towards the 2010 goals, diversity in the nursing workforce was highlighted as a priority (Institute of Medicine & National Academies of Sciences, 2016). Over the last decade, a growing number of grant programs aimed at diversifying the nursing workforce have become available through federal and philanthropic support, some with administrative support from the American Association of Colleges of Nursing (American Association of Colleges of Nursing, 2019). In 2021, the National Academy of Medicine (NAM) published its third report in the future of nursing series “The future of nursing 2020–2030: Charting a path to achieve health equity”, which places eliminating systemic racism and achieving health equity through removing inequities in social determinants of health at its core (National Academy of Medicine & National Academies of Sciences, 2021). The report highlights the multifaceted roles of nurses in achieving this goal, but does not examine how far the nursing profession has come towards including underrepresented minority nurses in their ranks.
The aim of this paper was to descriptively examine changes in the racial/ethnic composition of the underrepresented minority (URM) nursing workforce over the last decade, across types of nurses (registered nurses (RNs) and advance practice registered nurses (APRNs)); educational attainment; job type; and rural and urban setting, using two large nationally representative surveys that provide data on the nursing workforce. Based on demographic changes of the nursing workforce reported elsewhere (National Academy of Medicine & National Academies of Sciences, 2021), we hypothesized substantial proportional growth of URM nurses over the study period compared to non-URM nurses overall, but expected slower growth for URM nurses with graduate level education, APRNs, and job roles involving research, teaching and administration/supervision, since attaining positions of higher occupational prestige and navigating levers of organizational hierarchies and power have been associated with racial discrimination (Wingfield & Chavez, 2020).
The Association of American Medical Colleges (AAMC) defines underrepresented minorities in medicine (UIM) as “racial and ethnic populations that are underrepresented in the medical profession relative to their numbers in the general population” (Association of American Medical Colleges, 2004). We adopted this definition when identifying and referring to underrepresented minorities in nursing. To this end, we identify nurses as URM if their race/ethnicity was B/AA, Latine, AI/AN, and NH/PI. Asian, White, and multiracial nurses were considered non-URM, since their proportions in nursing are similar to or exceed that of the U.S. population (Table 1). Our paper followed STROBE reporting criteria for cohort studies.
Trends in race/ethnicity and underrepresented minority status in the nursing workforce in the National Sample Survey of Registered Nurses (2008-2018) and the American Community Survey (2010-2019) compared to the U.S. population (2010-2019).
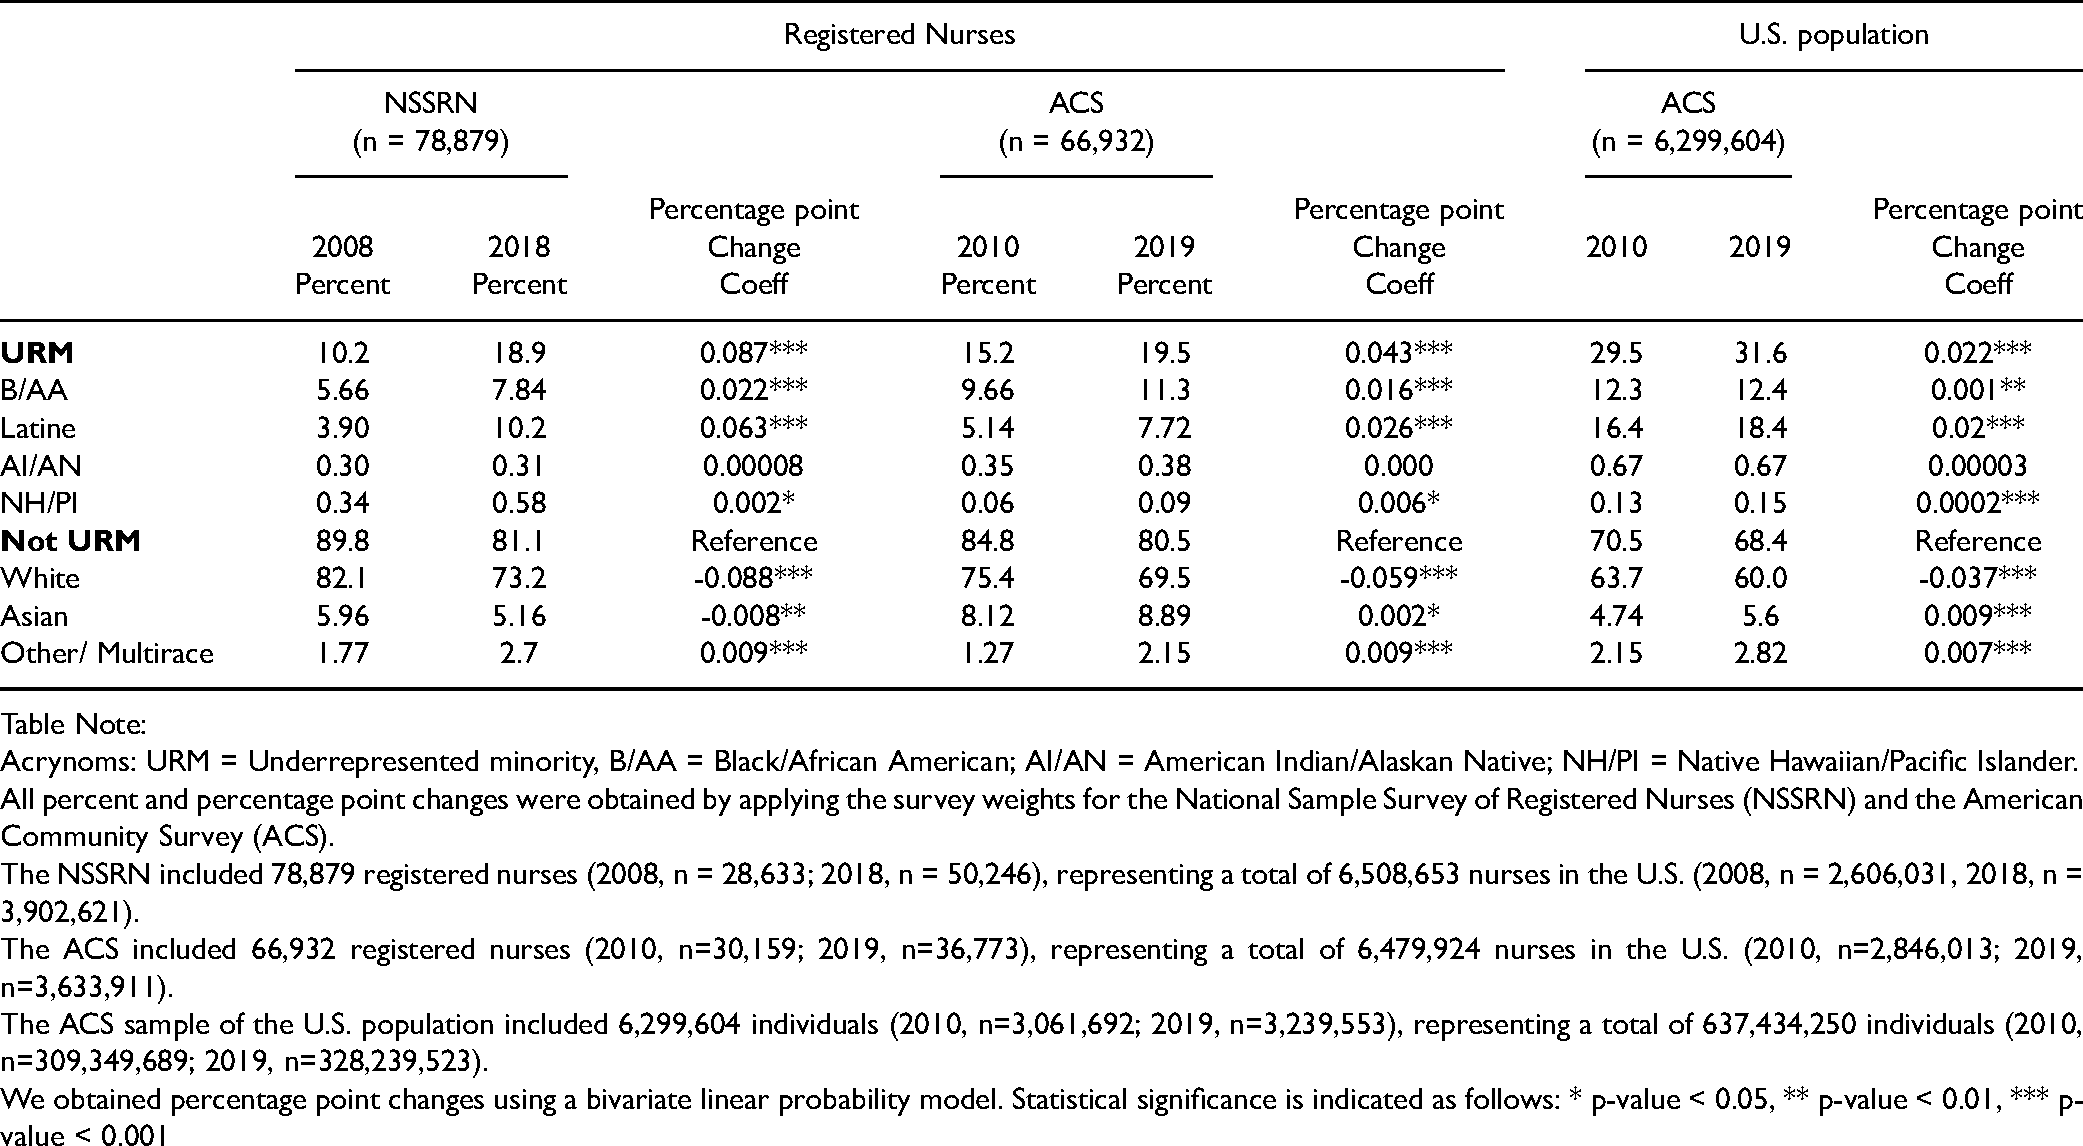
Table Note:
Acrynoms: URM = Underrepresented minority, B/AA = Black/African American; AI/AN = American Indian/Alaskan Native; NH/PI = Native Hawaiian/Pacific Islander.
All percent and percentage point changes were obtained by applying the survey weights for the National Sample Survey of Registered Nurses (NSSRN) and the American Community Survey (ACS).
The NSSRN included 78,879 registered nurses (2008, n = 28,633; 2018, n = 50,246), representing a total of 6,508,653 nurses in the U.S. (2008, n = 2,606,031, 2018, n = 3,902,621).
The ACS included 66,932 registered nurses (2010, n=30,159; 2019, n=36,773), representing a total of 6,479,924 nurses in the U.S. (2010, n=2,846,013; 2019, n=3,633,911).
The ACS sample of the U.S. population included 6,299,604 individuals (2010, n=3,061,692; 2019, n=3,239,553), representing a total of 637,434,250 individuals (2010, n=309,349,689; 2019, n=328,239,523).
We obtained percentage point changes using a bivariate linear probability model. Statistical significance is indicated as follows: * p-value < 0.05, ** p-value < 0.01, *** p-value < 0.001
Methods
Data
We used the National Sample Survey of Registered Nurses (NSSRN) years 2008 and 2018 and the American Community Survey (ACS) years 2010 and 2019. The NSSRN is administered by the Health Resources & Services Administration (HRSA) and includes RNs with active licenses. Until 2008, the survey was conducted every four years going back to 1976, yielding sample sizes of approximately 30,000 nurses in each survey year. The survey was paused after 2008 and relaunched in 2018 (the latest year available). The ACS is an annual household survey administered by the U.S. Census Bureau with response rates exceeding 90% (United States Census Bureau, 2020). The sample frame is representative of U.S. households and thus includes individuals in all occupations. While the ACS has been in the field since 2001, in 2010 occupation codes for nurse practitioners, certified nurse midwifes, and nurse anesthetists were added to the survey. Since we were interested in examining trends for URM RNs and APRNs we used the years 2010 and 2019 for the ACS.
Sample
Our sample consisted of all actively employed RNs. To select working RNs in the labor force, we included individuals who reported working at least one hour, reported an income of greater than zero dollars from their primary nursing position and were between the ages of 20–85 years. Since the ACS includes individuals from all occupations, we identified nurses (RNs and APRNs) using the Census occupation codes 3255 (RNs), 3256 (certified nurse anesthetists), 3257 (nurse practitioners), and 3258 (certified nurse midwifes).
Measures
Our outcome variables were binary variables indicating whether the nurse reported their race/ethnicity as belonging to one of four URM groups: B/AA, Latine, AI/AN, NH/PI. Asian, White, and multiracial nurses were coded as non-URM nurses. Outcome measures represent counts and proportions of the number of nurses in each race/ethnicity group. Nurses identifying as Hispanic were coded Latine regardless of their race identification. Our main independent variable was a binary measure indicating the year. For the NSSRN, year indicated 2008/2018 and for the ACS, year indicated 2010/2019. Workforce characteristics available in both the NSSRN and ACS included type of nurse (RN/APRN) and educational attainment (diploma/associate (Dipl./ASN), baccalaureate (BSN), master's MS(N)/PhD). The NSSRN distinguishes between degrees obtained in nursing, nursing related fields, and non-nursing fields. For this analysis, we used the highest nursing and non-nursing related education obtained because this variable was available in both 2008 and 2018. The education variable in the ACS is not nursing specific and thus would include nursing, nursing related degrees as well as degrees from other fields. We use MS(N) to indicate that a master’s degree was obtained in nursing or in another field. Additional work characteristics were obtained from the NSSRN, including job type (patient care, administration/supervision, research, teaching, other). Rural urban status was available in the ACS only. Two rural/urban measures are collected in the ACS, place of residency and location of workplace, indicating urban, mixed-rural/urban, and rural locality based on metropolitan area status, a measure which relies on county information. Location of the workplace may be a better measure for examining nurses’ demographic characteristics for informing nursing practice and workforce policy since it measures characteristics at the location of where care takes place. However, this measure has missing information for over a third of our sample. For this reason, we use rurality of the workplace as a sensitive analysis only.
Analysis
To begin, we assessed the number of B/AA, Latine, AI/AN, NH/PI and non-URM nurses using frequency/percent in both the NSSRN and ACS. We also obtained the race/ethnicity composition in the U.S. population from the ACS as a comparison. We conducted bivariate linear probability models to calculate the percentage point (PP) change of the number of nurses between survey years and assessed statistical significance. We stratified bivariate regressions by type of clinician (RN/APRN), level of education, job type, and rurality to obtain the PP change for each of the subgroups.
Analyses were conducted using STATA 15. We applied NSSRN and ACS survey weights using the svy command with the subpop option to obtain estimates representative of the population of nurses. Since potential overcounting of Latine nurses and undercounting of B/AA nurses has been reported with the 2018 NSSRN survey weights, we also conducted NSSRN analyses without weights and provided results either in the main paper or in the supplemental material (Appendix 1–3). A 2-tailed probability value of <.05 indicated statistical significance. Since this research did not include human subject research, we did not require an IRB.
Results
Our unweighted samples for combined survey years consisted of 78,879 nurses in the NSSRN and 66,932 nurses in the ACS, representing 6,508,653 weighted observations in the NSSRN and 6,479,924 weighted observations in the ACS. These weighted observations include the pooled observations from the 2008 and 2018 survey years, reflecting the approximately 3 million RNs in the U.S. (United States Bureau of Labor Statistics, 2021). Table 1 shows the percentages of nurses for each URM and non-URM group for the NSSRN and ACS, the PP change in the number of nurses between survey years, and the percentages and PP change for the U.S. population from the ACS as a comparison.
URM nurses saw statistically significant gains in both the NSSRN (2008–2018) and the ACS (2010–2019). The proportions of B/AA nurses increased by approximately 2 PPs to 7.8% in the NSSRN and to 11.3% in the ACS. Latine nurses saw their shares increase to 10.2% in the NSSRN and 7.7% in the ACS. Given the overestimation of Latine nurses in the 2018 NSSRN, it is likely the weighted numbers of Latine nurses in 2018 are overcounted. Unweighted 2018 numbers suggest a proportion of 3.7% (Appendix 1), which would indicate no growth occurred since 2008. Likely the proportion of Latine nurses in 2018/2019 lies between 3.7% and 10.2%, and the estimated 7.7% in the 2019 ACS supports this. NH/PI nurses saw minimal, but statistically significant growth in proportions in both surveys, ranging from 0.06 PPs in the ACS to 0.2 PPs in the NSSRN. AI/AN nurses did not see any statistically significant growth in either survey. Despite the gains observed for three of the four URM groups, we found that the overall proportions of URM nurses - 18.5% in the 2018 NSSRN and 19.5% in the 2019 ACS - lagged 12-13 PPs behind the 31.6% of URM individuals from U.S. population estimates in the ACS.
Underrepresented Minority Nurses by Clinician Type: RNs and APRNs
Table 2 shows the breakdown by clinician type (RN/APRN) and illustrates that the compositional growth of URM nurses is primarily attributable to growing numbers of URM RNs. The proportion of B/AA nurses grew between 1.7–2.2 PPs and the proportion of Latine nurses grew between 2.2–6.3 PPs. Latine APRNs were the only group of URM APRNs with significant growth (5.5 PPs NSSRN, 1.7 PPs ACS). Note that the unweighted NSSRN results show a modest increase for both Latine RNs and APRNs, about 1 PP for RNs and APRNs (see Appendix 2), which supports the results documented in the ACS. AI/AN nurses, while seeing growth in numbers, did not see a complementary growth in proportions. Their largest increase was noted for APRNs in the ACS with 0.03 PPs, and their proportions in the workforce stayed between 0.3 and 0.4% for RNs and APRNs respectively. A similar picture emerged for NH/PI. Their largest representation was reported for RNs in the 2018 NSSRN at 0.6%, and ACS estimates for RNs and APRNS were 0.1% in both years.
Trends in race/ethnicity and underrepresented minority status for RNs, APRNs and by type of education in the National Sample Survey of Registered Nurses (2008-2018) and the American Community Survey (2010-2019).
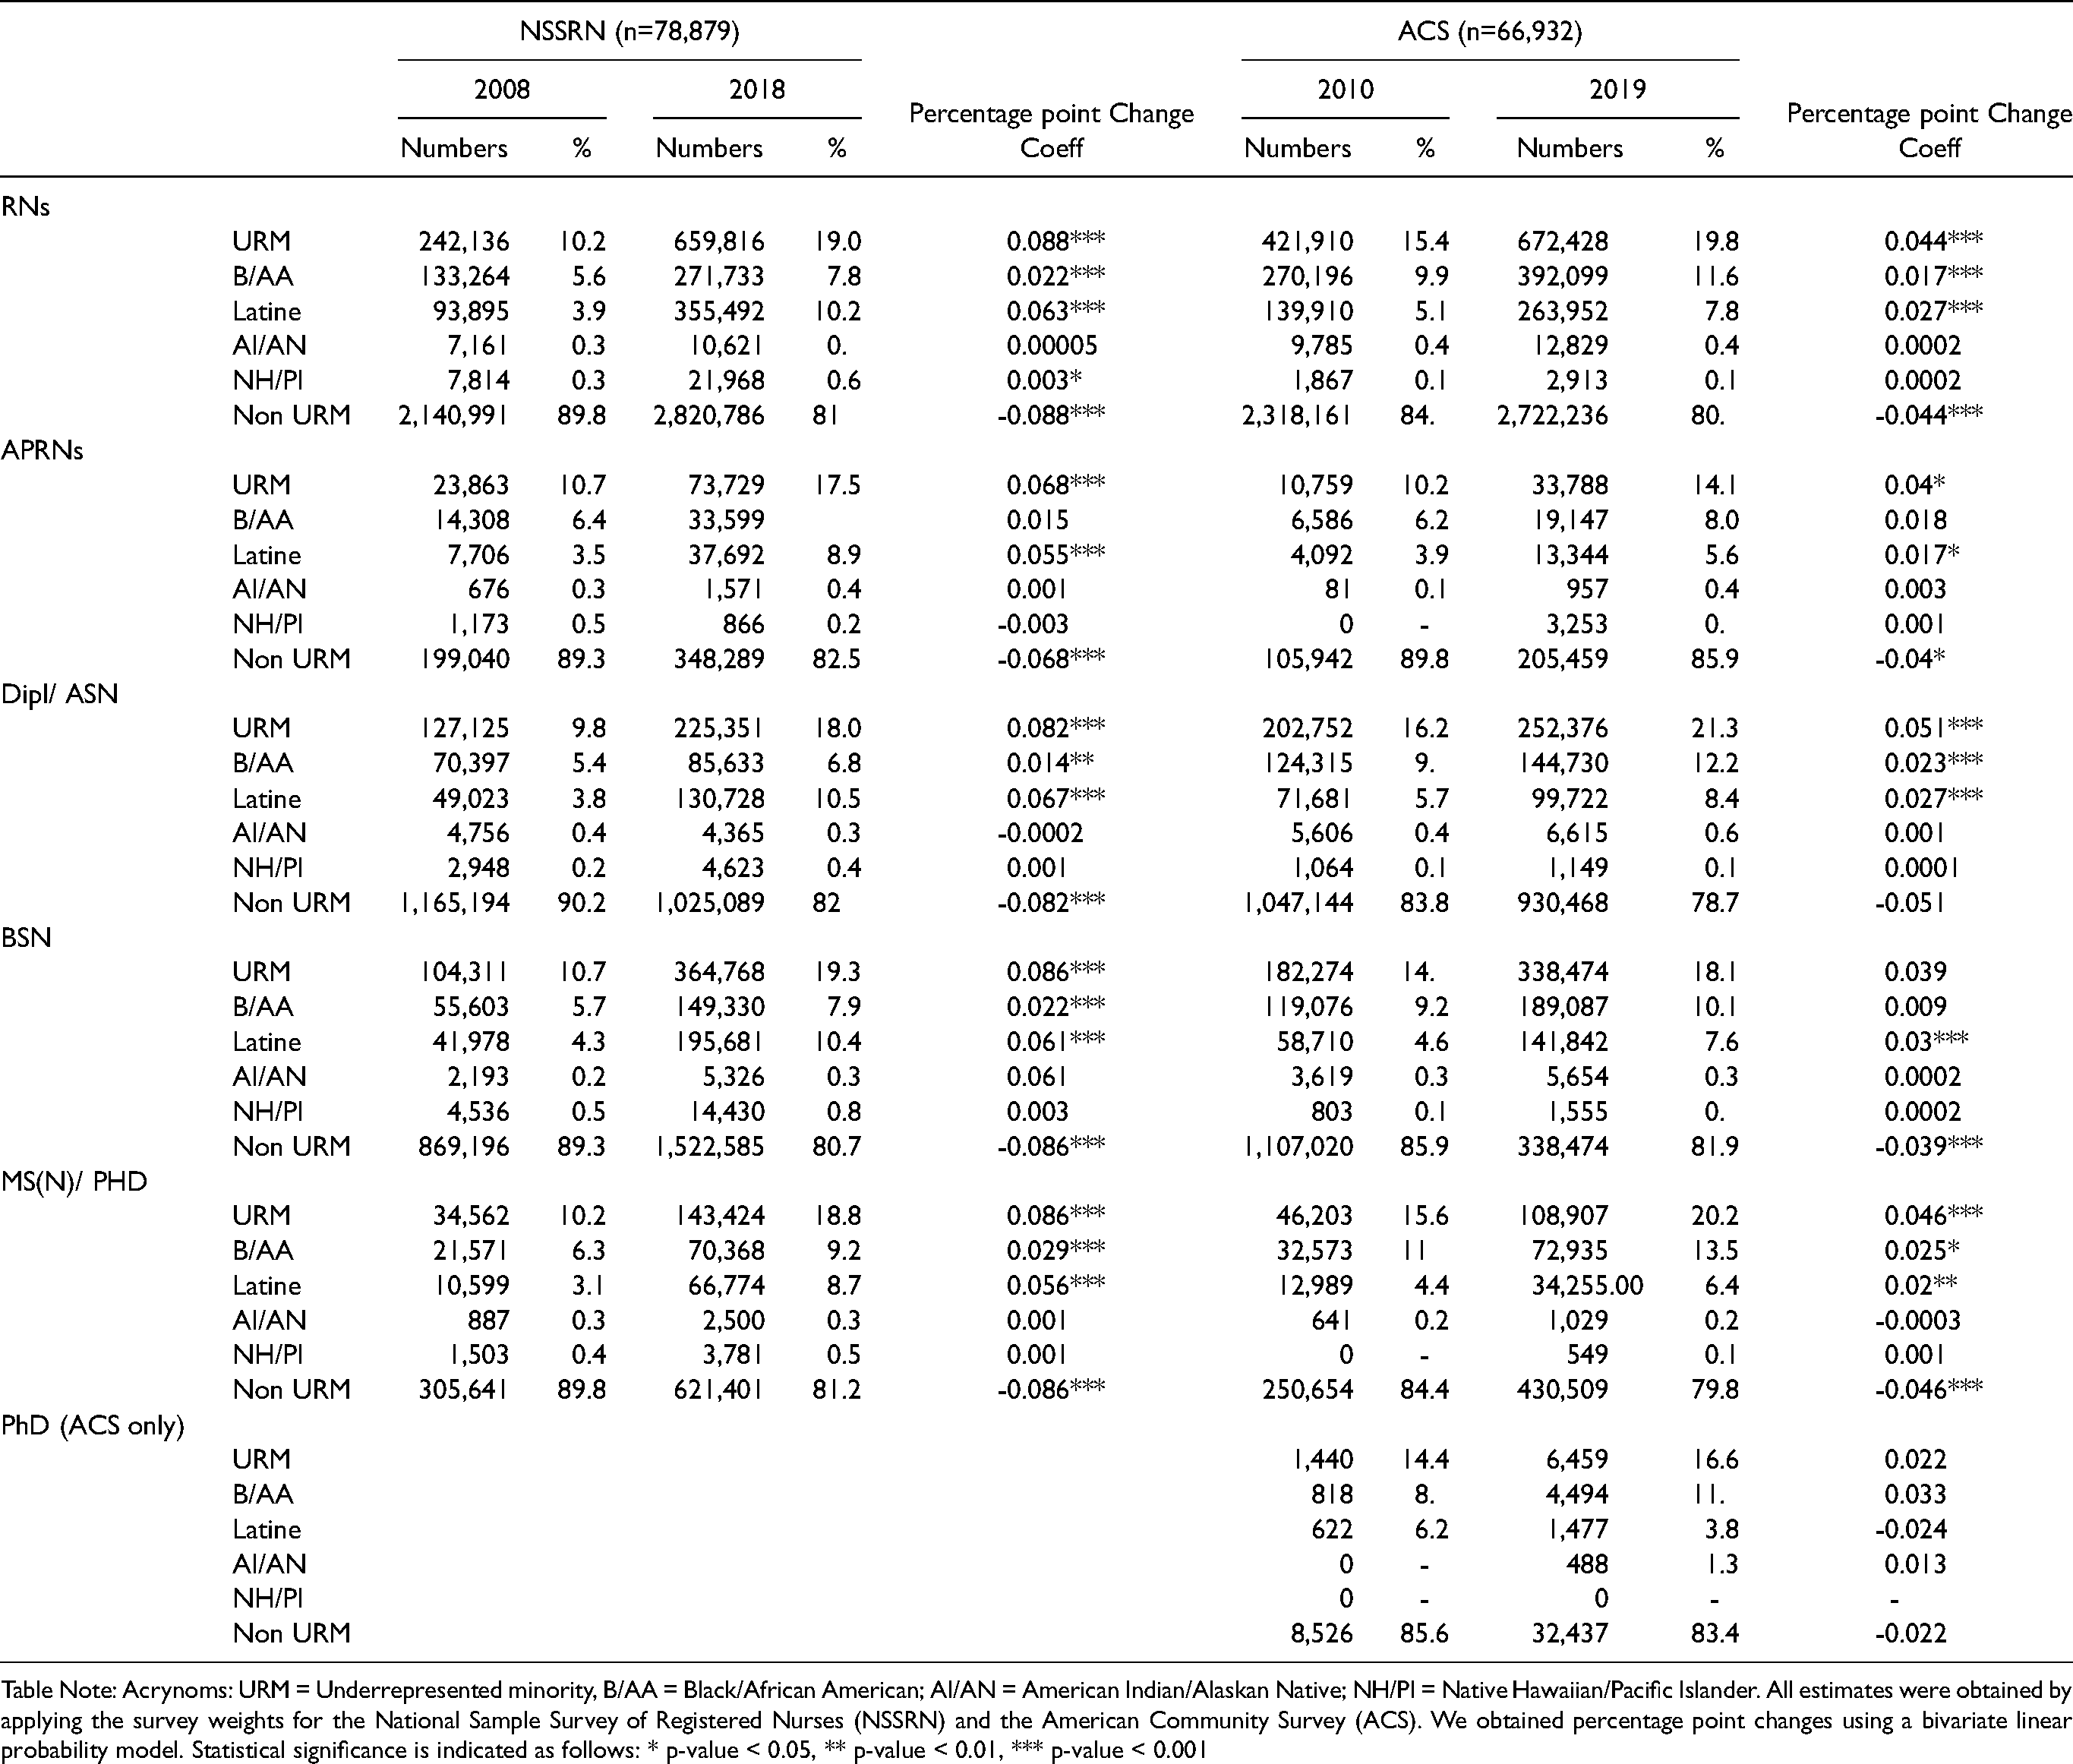
Table Note: Acrynoms: URM = Underrepresented minority, B/AA = Black/African American; AI/AN = American Indian/Alaskan Native; NH/PI = Native Hawaiian/Pacific Islander. All estimates were obtained by applying the survey weights for the National Sample Survey of Registered Nurses (NSSRN) and the American Community Survey (ACS). We obtained percentage point changes using a bivariate linear probability model. Statistical significance is indicated as follows: * p-value < 0.05, ** p-value < 0.01, *** p-value < 0.001
Underrepresented Minority Nurses by Level of Education
Data from both surveys showed the proportions of URM nurses grew across all educational levels between 4.0–8.6 PPs, representing 18%-21% of all nurses in every educational group today (Table 2). B/AA nurses saw significant increases in proportions at the Dipl./ASN and MS(N)/PhD levels. By 2018 and 2019, graduate educated B/AA nurses with MS(N)/PhDs made up 9.2% and 13.5% of the workforce in the NSSRN and ACS respectively. These proportions are larger than their proportions reported for Dipl./ASN degrees (6.5% NSSRN, 12.2% ACS) and BSNs (7.9% NSSRN, 10.1% ACS). Latine nurses also saw increases across all educational groups, but in contrast to their B/AA colleagues, their largest proportion today is in the Dipl./ASN degree group (10.5% NSSRN, 8.4% ACS) and the smallest is in the MS(N)/PhD group (8.7% NSSRN, 6.4% ACS).
For AI/AN and NH/PI nurses we found no significant proportional increases in any education group (Table 2). Estimates from the NSSRN suggest that the proportion of AI/AN nurses was approximately 0.3% in each of the education groups by 2018 education levels by 2018. Estimates from the 2019 ACS suggested AI/AN nurses had the largest representation in the Dipl./ASN degree group with 0.6%, followed by 0.3% of BSN nurses and 0.2% of MS(N)/PhD nurses. Of note, the ACS did not document any PhD level educated AI/AN nurses in 2010, but by 2019, weighted estimates suggested that 488 AI/AN nurses had obtained a PhD.
Similar to AI/AN nurses, NH/PI nurses were few in numbers. While the ACS documented NH/PI nurses to be approximately 1% for each degree type by 2019, the NSSRN estimated 4% for the Dipl./ASN, 3% for BSN, and 2% for MS(N)/PhD educated nurses. It is possible that the 2018 NSSRN weights are overestimating numbers for NH/PI nurses. For reference, unweighted estimates suggest 0.2% for Dipl./ASN, 0.4% for BSN, and 0.2% for MS(N)/PhD educated nurses (Appendix 2). According to the ACS, there were no PhD level educated NH/PI nurses in the workforce by 2019, while the 2018 NSSRN estimated 25 doctoral prepared NH/PI nurses or 0.05% (Table 3). Since the NSSRN combines DNP and PhD, it is possible that these nurses had obtained DNPs rather than PhDs.
Race/ethnicity composition of graduate URM nurses in the 2018 National Sample Survey of Nurses and 2019 American Community Survey.
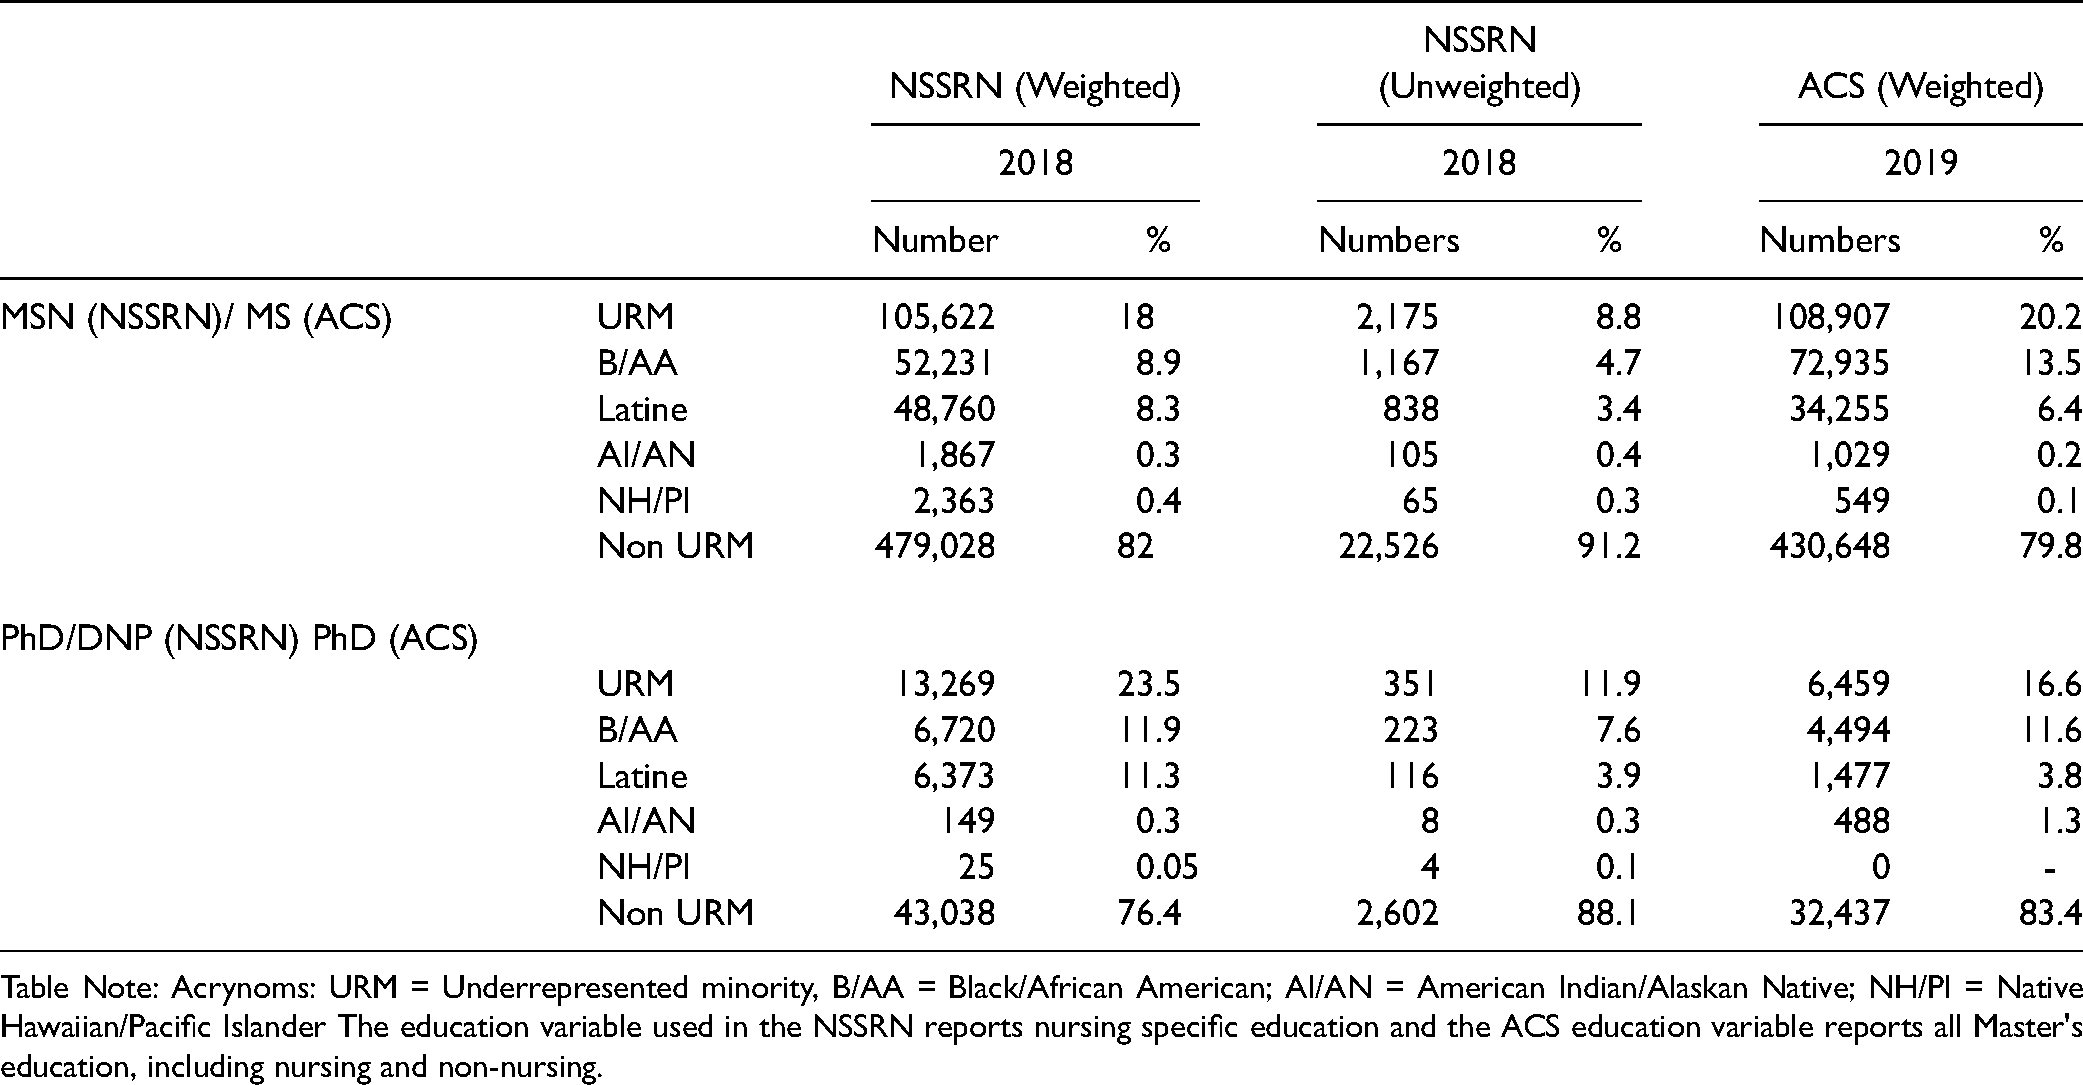
Table Note: Acrynoms: URM = Underrepresented minority, B/AA = Black/African American; AI/AN = American Indian/Alaskan Native; NH/PI = Native Hawaiian/Pacific Islander The education variable used in the NSSRN reports nursing specific education and the ACS education variable reports all Master's education, including nursing and non-nursing.
To better understand the growth pattern of URM graduate nurses, we used the ACS to examine changes from 2010–2019 at the PhD level (Table 2) (the NSSRN did not distinguish between MS(N) and PhD in 2008), and also used the 2018 NSSRN and 2019 ACS (Table 3), when both surveys provided data for MS(N) and PhD degrees. Table 3 shows that the compositional growth of B/AA nurses with graduate degrees was driven by gains at both the MS(N) (8.9% NSSRN, 13.5% ACS) and DNP/PhD levels (11.9% NSSRN, 11.6 ACS), while the growth for Latine graduate degree nurses was likely driven by increases in MS(N) degrees (8.3% NSSRN, 6.4% ACS) and not DNPs/PhDs degrees (11.3% NSSRN, 3.8% ACS). Note that the NSSRN estimated 11.3% for Latine nurses with DNPs/PhDs, but the unweighted results reported 3.9%, which is supported by ACS estimates. In fact, according to the ACS, Latine PhD educated nurses were the only group of URM nurses for whom a decrease in proportions from 6.2% in 2010 to 3.8% in 2019 was observed (Table 2).
Underrepresented Minority Nurses by Type of job (NSSRN Only)
Figure 1 shows the distribution of the workforce by race/ethnicity across different job types using the NSSRN. The overall proportion of URM nurses grew significantly in direct patient care jobs, research, administration/supervision, and other positions. URM growth in teaching positions was not statistically significant. Representation of URM nurses in direct patient care jobs nearly doubled, growing by 8.8-PPs between 2008 and 2018 and URM representation in administration/supervision increased by 7.6-PPs. When we examined each URM race/ethnicity group, the increases in proportions for URM nurses working in research positions was primarily driven by estimates from Latine nurses, though not statistically significant. The unweighted results for Latine nurses showed a 0.2-PP increase in research positions and a 2.2-PP gain in teaching (Appendix 3). Representation of Latine nurses in patient care and other job types held steady according to the unweighted results. Other significant URM gains were due to B/AA nurses growing by 2.1-PPs in patient care and 2.4-PPs in administration/supervision.
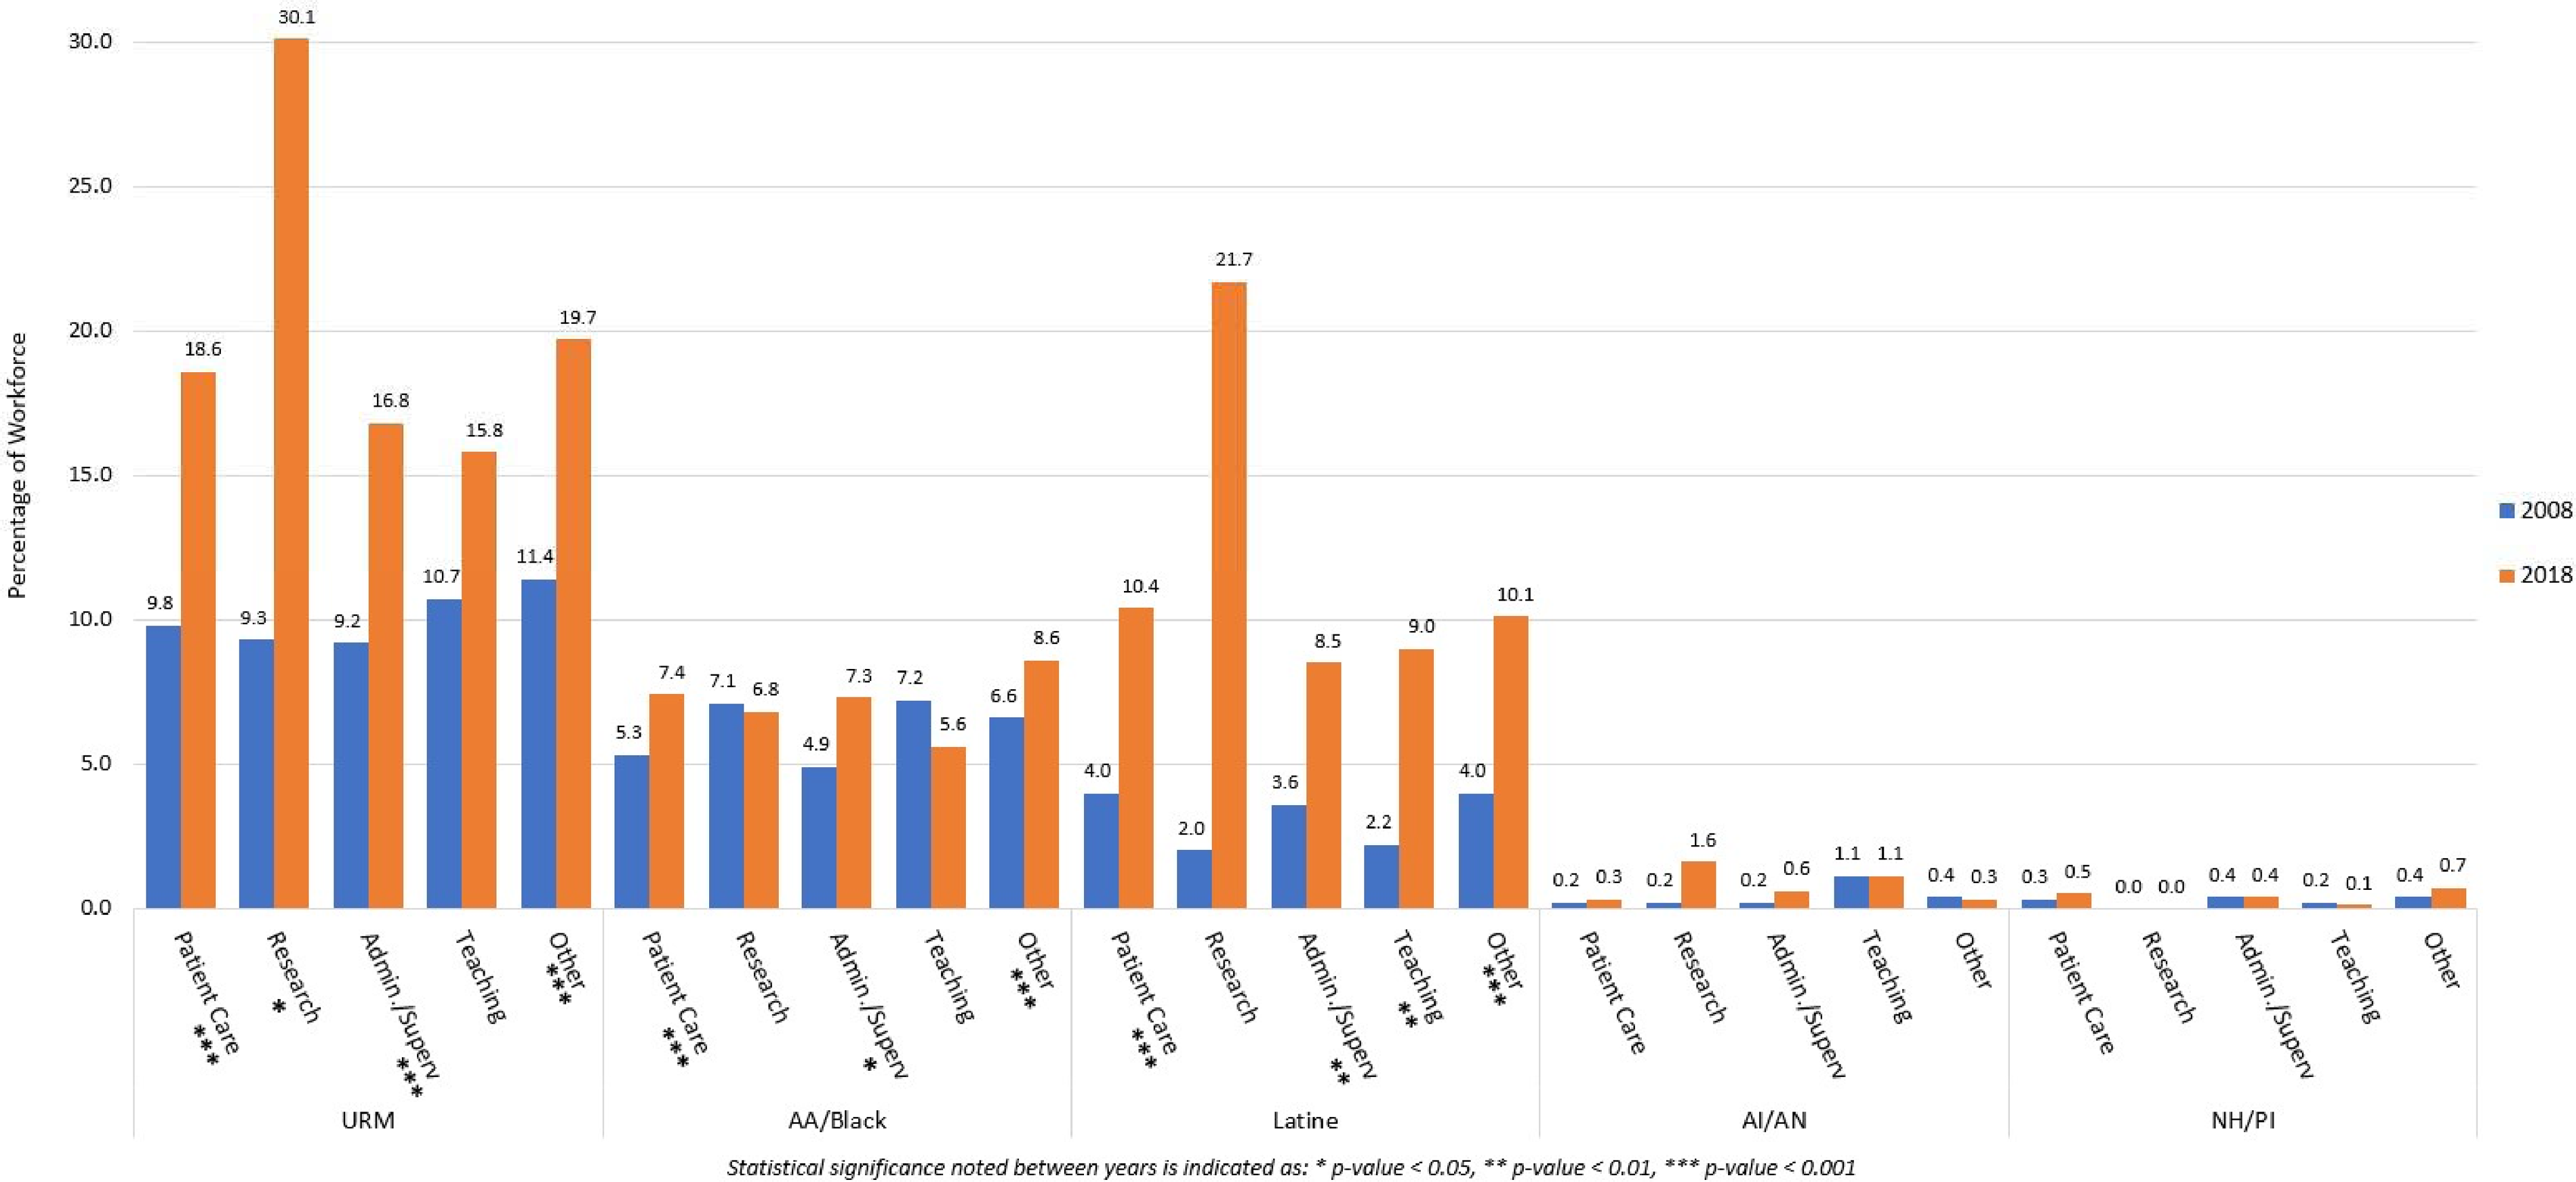
Trends in race/ethnicity for registered nurses job type in the National Sample Survey of Registered Nurses (2008-2018).
While not statistically significant, B/AA nurses saw proportional decreases in research and teaching positions. Because our earlier finding of educational attainment suggested significant growth in MS(N)/PhD educated B/AA nurses, we conducted a subgroup analysis of B/AA graduate educated nurses by clinician and job type to better understand the clinical roles and job positions held by these nurses and to shed light on the decrease of B/AA nurses for research and teaching positions. Using the 2018 educational attainment variable that included MSN and DNP/PhD, we found that 48% of B/AA nurses with MSN degrees were working as RNs and 29% of B/AA nurses with DNPs/PhDs were working as RNs. These proportions were larger for B/AA nurses than the 40% and 26% for non-URM nurses (Table 4). Examining the types of jobs for graduate degree nurses, we found similar proportions of B/AA and non-URM nurses working in administration/supervision at the MSN level (B/AA 11%; non-URM 10%). However at the DNP/PhD level, 21% of B/AA nurses compared to only 10% of non-URM nurses were working in administration/supervision. Teaching jobs by MSN nurses were held by 3% of B/AA and 5% of non-URM nurses while 10% of DNP/PhD B/AA nurses reported teaching positions compared to 12% of non-URM nurses. Research positions were held by few nurses with MSN or DNPs/PhDs, with B/AA MSN nurses reporting 1% compared to 0.3% reported by non-URM MSN nurses. B/AA DNP/PhD nurses reported 0.7% compared to 2% of non-URM DNP/PhD nurses.
Master's and DNP/PhD educated Black/African American nurses compared to non-URM nurses by type of clinician and job type, 2018 NSSRN.
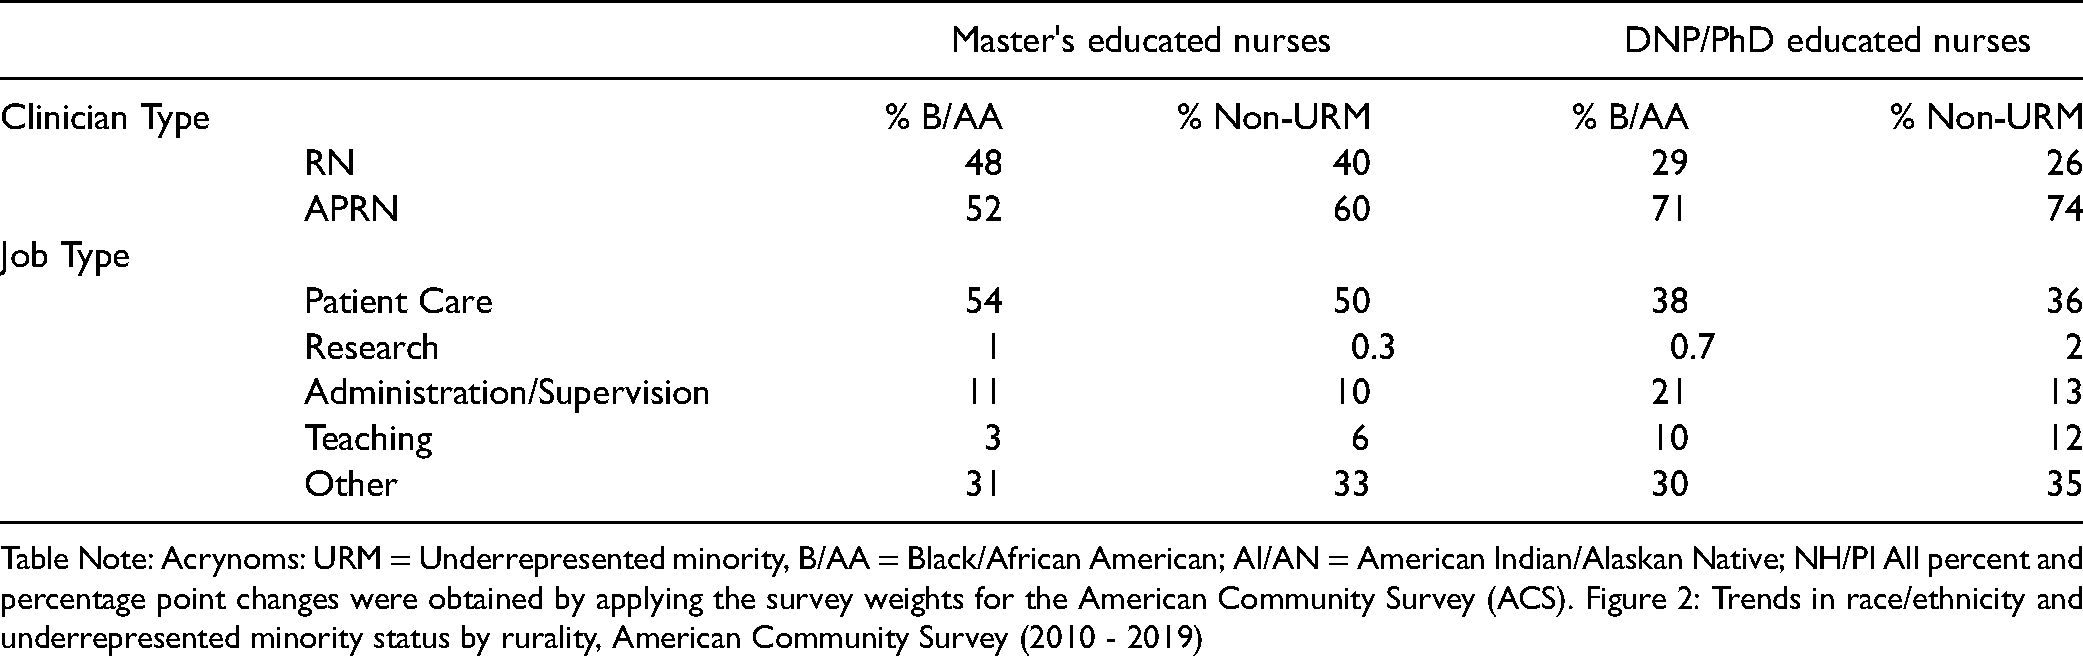
Table Note: Acrynoms: URM = Underrepresented minority, B/AA = Black/African American; AI/AN = American Indian/Alaskan Native; NH/PI All percent and percentage point changes were obtained by applying the survey weights for the American Community Survey (ACS). Figure 2: Trends in race/ethnicity and underrepresented minority status by rurality, American Community Survey (2010 - 2019)
Underrepresented Minority Nurses in Rural/Urban Areas (ACS Only)
We examined how the race/ethnicity composition of the workforce changed in rural/urban areas over the last decade using the ACS (rural/urban measures are not available in the NSSRN). Figure 2 illustrates the number of nurses and proportions of nurses living in rural and mixed rural/urban areas by race/ethnicity. The number of nurses living in rural areas declined from roughly 413,000 in 2010 to 289,000 in 2019 while the number of nurses living in mixed rural/urban areas nearly doubled from roughly 216,000 to 417,000 nurses. While the numbers of Latine, AI/AN and NH/PI nurses held relatively stable between 2010 and 2019, B/AA nurses showed a decline in numbers of roughly 8,000 nurses, or an approximately 1-PP proportional drop. When using rurality of the workplace as a sensitivity analysis, the decline in the number of nurses in rural areas was 110,000 while mixed rural/urban areas saw an increase of 289,000 nurses. The numbers of URM nurses in rural areas mirrored the trend observed for rural/urban nurse residency (results not shown).
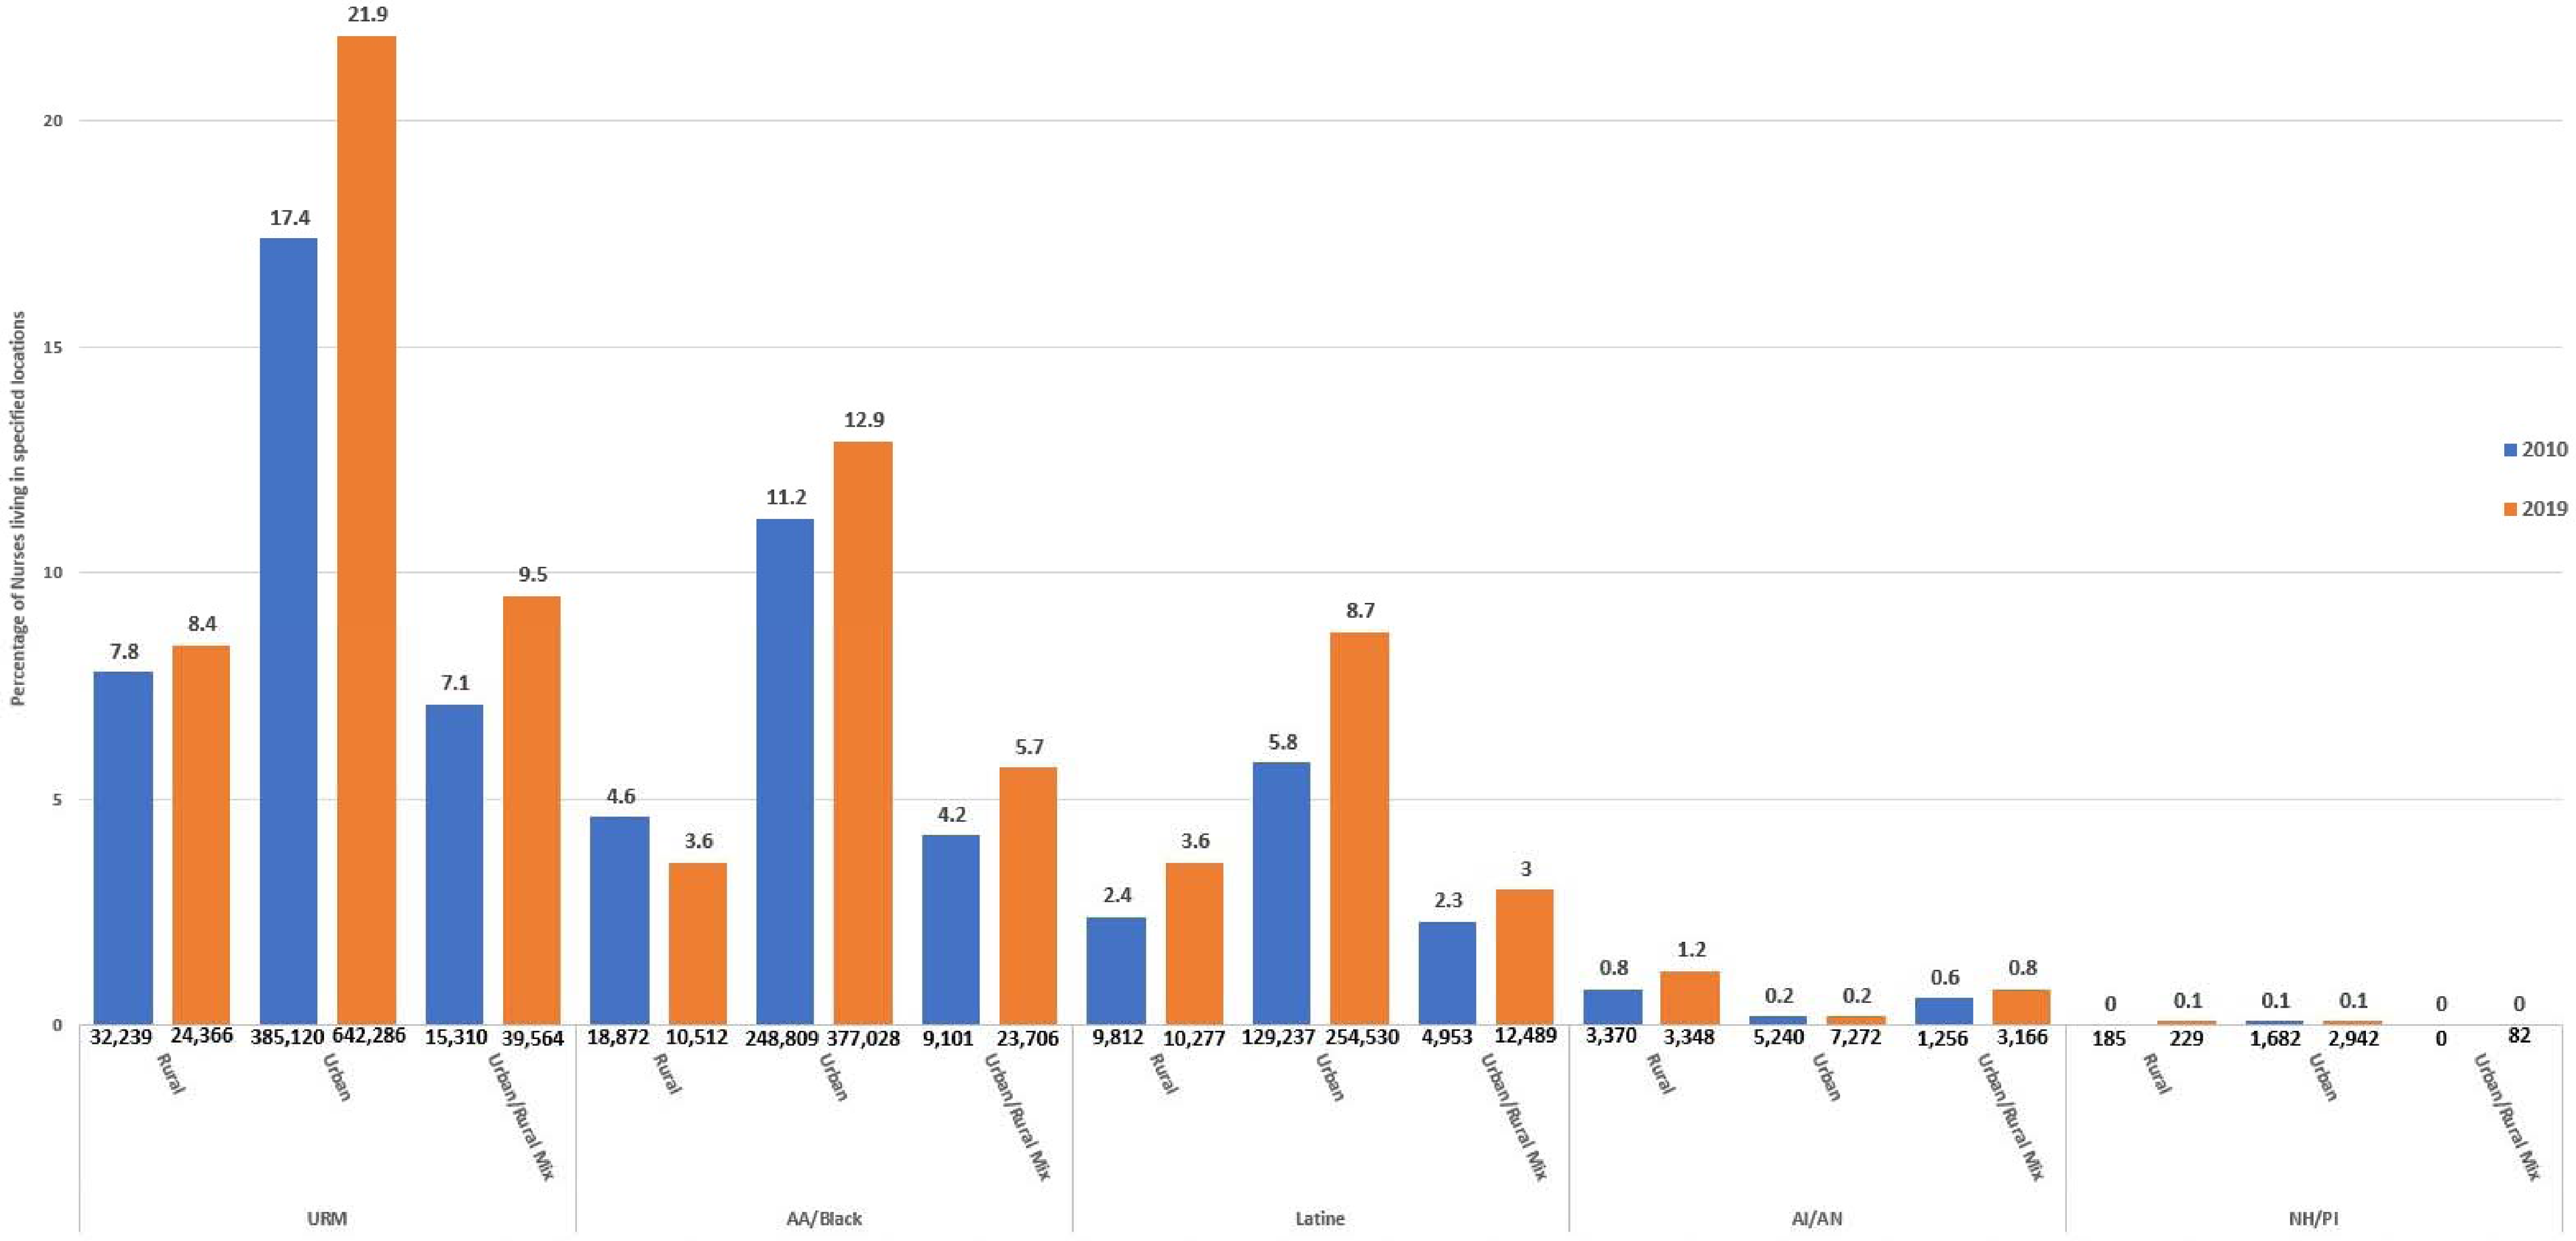
Trends in race/ethnicity and underrepresented minority status by rurality, American Community Survey (2010 – 2019).
Underrepresented Minority Nurses who are Unemployed
Finally, we examined whether URM nurses relative to non-URM nurses were more likely to be unemployed and looking for work using the ACS (data unavailable in the NSSRN). Only nurses who were unemployed and actively looking for work in 2010 and 2019 were included in this analysis (n = 52,724). In the data from both years combined, 22.5% of URM nurses were unemployed and looking for work. We tested whether this percentage was significantly different from the 17.6% URM representation in the nursing workforce using a z-test of proportions, which indicated a true difference in proportions (p < 0.001). Differences in proportions between unemployed and employed B/AA nurses (15.2% vs 10.5%; p < 0.001) and unemployed and employed AI/AN nurses (0.36% vs 0.8%, p < 0.001) were also statistically significant, indicating overrepresentation among unemployed nurses who were looking for work relative to their numbers in the labor force. Finally, while the total number of URM nurses looking for work decreased from 6,999 to 4,868, proportionally the share of URM nurses who were unemployed and looking for work increased from 21.8% in 2010 to 23.6% in 2019.
Discussion
This analysis examined the changes in the distribution of URM nurses compared to non-URM nurses for several workforce characteristics, including clinician type, educational attainment, job type, rural/urban status, and unemployment over a period of 10 years. Data from two nationally representative surveys showed that while the numbers and proportions of URM nurses significantly increased to approximately 19% by 2018/2019, the URM nursing workforce continues to be underrepresented compared to the 31.6% in the U.S. population. Not surprisingly, B/AA and Latine nurses are the two largest URM populations. By 2018/2019 B/AA nurses made up between 8–11% of the workforce, and Latine nurses made up between 8–10%, which for B/AA nurses approaches numbers in the U.S. population (12.4%) and for Latine nurses lags far behind population representation (18.4%). Little proportional growth was noted for AI/AN nurses, and with 0.32% - 0.38%, AI/AN nurses are underrepresented in the workforce relative to their numbers in the nation (0.67%). For NH/PI nurses, proportional growth between 0.2–0.6-PPs was noted in the NSSRN and ACS, respectively, increasing their representation to 0.6% in the NSSRN and 0.09% in the ACS. This exceeded U.S. population estimates (0.15%) according to the NSSRN and fell short of population estimates according to the ACS.
Progress for the URM RN Workforce, Limited Progress for URM APRNs
Our analysis by clinician type and educational attainment documented that the growth of URM nurses in the workforce is primarily attributable to a more diverse RN workforce. Specifically, B/AA and Latine RNs with Dipl./ASN and BSN degrees showed significant proportional increases over the study period. The numbers of AI/AN RNs are growing as well, but not at a pace that increases their representation in the workforce. NH/PI RNs increased their proportion by 0.3- PPs according to the NSSRN data. The URM APRN workforce saw growth too, though notably slower than the growth of the URM RN workforce. URM APRN growth was primarily driven by growth of Latine APRNs, which was documented by both the NSSRN and ACS.
Significant Gains for Black/African American Nurses with MS(N)/PhD Degrees
By 2018/2019, the URM nursing workforce was represented with approximately 18–21% within each degree type, including MS(N)/PhD graduate degrees, indicating URM workforce growth across the educational ranks. However, within each race/ethnicity group, progress was not equal. The growth in B/AA nurses with MS(N)/PhD degrees resulted in B/AA nurses with graduate degrees proportionally overtaking B/AA nurses with Dipl./ASNs and BSN degrees. In comparison, Latine and AI/AN nurses had their largest representation in the Dipl./ASN degree group and NH/PI nurses had their largest growth in the BSN group.
To examine whether the impressive growth in URM MS(N)/PhD graduates, especially for B/AA nurses, may have been driven by MS(N) rather than PhD degrees, we used the 2018 NSSRN and the 2019 ACS education variables that allowed for separation of the MS(N) and PhD categories. Our results suggest that the substantial increase in the proportion of B/AA nurses with graduate degrees was driven by growing numbers of B/AA nurses in both graduate degree types. In fact, the proportion of B/AA nurses with DNP/PhDs (11.9% NSSRN, 11.6% ACS) might be as large or larger in 2019 than their proportions with MS(N) degrees (8.9% NSSRN, 13.5% ACS). For Latine graduate level nurses, we found better representation at the MS(N) level (8.3%-3.4% weighted/unweighted NSSRN, 6.4% ACS) than the DNP/PhD level (11.3%-3.9% weighted/unweighted NSSRN, 3.8% ACS) when we interpret the NSSRN results to fall between the weighted and unweighted estimates. At the PhD level, Latine nurses were the only group for whom a possible decline from 2010 to 2019 was reported in the ACS.
Since our results did not document a substantial increase of the B/AA APRN workforce, we conducted follow-up analysis of the MSN and DNP/PhD graduate level workforce to better understand the types of jobs held by these nurses. At both the MSN and DNP/PhD level, greater numbers of B/AA nurses were working as RNs compared to their non-URM colleagues. This suggests that B/AA nurses are more likely to be working in clinical roles that may not utilize the full extent of their training. When we examined the job types of MSN and DNP/PhD nurses, different job profiles emerged for B/AA nurses and non-URM nurses, especially for DNP/PhD nurses. Over 20% of B/AA DNP/PhD nurses were working in administration/supervision compared to 13% of non-URM nurses. Further, the proportions of B/AA DNP/PhD nurses in research and teaching were slightly lower than the proportions of non-URM DNP/PhD nurses. This may suggest that the stagnation of URM numbers observed for research and teaching positions may in part be explained by B/AA nurses with graduate degrees choosing positions in administration/supervision rather than research and teaching.
With nursing faculty shortages looming (Fang & Kesten, 2017) and Universities more than ever aiming to diversify their faculty body, attracting URM faculty will likely require a concerted effort of organizational policy change (Griffin, 2020). While our results cannot speak to a cause and effect, it is possible that persisting institutional race-based inequities (Barber et al., 2020) have led some B/AA nurses with MSN and PhDs to take positions in administration/supervision rather than teaching and research. The proportional decline of Latine nurses at the PhD level as reported by the ACS might be additional evidence for a dissatisfaction with academia by URM nurses. It is also possible that URM nurses are more likely to work in higher-paying administrative/supervisory positions over lower-paying academic positions compared to non-URM nurses due to differences in economic resources that might require URM nurses to take different career paths.
Nursing schools can and must emerge as leaders in overhauling systemic race inequities with a multi-pronged approach if a potential withdrawal of the URM nursing workforce from academia is to be avoided. Investment in cluster hires to build a community for URM nursing faculty and students; investment in mentorship and research support through access to coaches, research assistants, and funding for pilot grants; and rewarding service work on diversity and inclusion in faculty promotion, such as curriculum restructuring efforts that highlight the relationship of racism in health disparities or participation in University wide equity taskforces are only some of the efforts that have been suggested for providing equal opportunities for URM faculty (Dupree & Boykin, 2021).
Fewer URM Nurses in Rural Areas
Our analysis using the ACS found a significant re-distribution of the URM and non-URM nursing workforce from rural to mixed rural/urban areas, a trend we observed for both nurses’ residency and workplace location. For the URM workforce, this trend was mostly attributable to B/AA nurses leaving rural areas and growing numbers of URM nurses in urban and mixed/urban areas. The implications of a dwindling rural nursing workforce were discussed in the Future of Nursing 2020–2030 report as a major challenge threatening access to care in rural areas (National Academy of Medicine & National Academies of Sciences, 2021). In combination with the projected numbers of physicians retiring over the next decade (AAMC, 2020), the rural nursing workforce will increasingly be called upon to respond to access problems in rural areas. To this end, restrictive state scope of practice laws should be removed so that nurses working as APRNs can provide the range of health care services commensurate with their training.
URM Nurses Overrepresented in the Unemployed Workforce
Our results indicated that while the overall numbers of unemployed nurses decreased between 2010 and 2019, the proportion of URM nurses who were unemployed and looking for work increased from 21.8% to 23.6%. Furthermore, the proportion of URM nurses among the unemployed nurses was significantly higher than their proportion in the labor force. This pattern was observed for B/AA and AI/AN nurses, indicating possible discriminatory hiring practices towards URM nurses. Nurse employers, including physicians, should carefully evaluate their hiring practices and prioritize diversity in the nursing workforce by policies and hiring, supporting, and actively advancing the careers of URM nurses.
Differences in NSSRN and ACS Results
Our analysis shows some discrepancies between NSSRN and ACS estimates, particularly for B/AA and Latine nurses. For example, the NSSRN reports Latine nurses as the largest URM group (10.2%) and the ACS reports B/AA nurses with the largest share (11.3%). As the survey documentation of the 2018 NSSRN points out, the weighting process of observations may have led to an overestimation of Latine nurses by 19% in 2018 (U.S. Department of Health and Human Services, Health Resources and Services Administration, National Center for Health Workforce Analysis., 2019). A recent report using data from the NSSRN in comparison with the ACS and other data sources illustrated that Latine nurses may be overestimated by as much as 50% (Auerbach et al., 2021). Auerbach and colleagues cautioned against using the 2018 NSSRN race/ethnicity estimates for workforce planning, calling for NSSRN weights to be re-assigned. For this study, we assessed both the weighted and unweighted estimates and where the numbers for Latine nurses substantially differed between the NSSRN and ACS, we suggest consulting the unweighted NSSRN estimates and using the ACS estimates for comparison. Comparing estimates from the NSSRN and ACS on the basis of which survey more accurately captures the “true” characteristics of the nursing workforce is, however, of limited value since the NSSRN is an occupation-based survey relying on nurse licensure data and the ACS is a U.S. population level survey relying on address and household information.
Reliable race/ethnicity measures in the nursing workforce are key for workforce researchers to provide data that accurately report the progress of the nursing profession towards becoming representative of the race/ethnicity profile of their patients, which in turn informs programs and policies aimed at increasing diversity. Our analysis shows that two of the most commonly used surveys in nursing workforce research, while producing similar results when examining overall trends of the proportion of URM nurses, have some discrepancies when examining the numbers of B/AA, Latine, AI/AN and NH/PI nurses. We concur with other workforce researchers that attempts should be made to re-assign weights in the 2018 NSSRN to increase the usefulness of the survey in informing policy and practice (Auerbach et al., 2021).
Limitations
Our analysis has several limitations. First, as discussed above, Latine nurses in the 2018 NSSRN are likely overrepresented. We provide unweighted estimates for the NSSRN for comparison and recommend readers to give greater weight to ACS results when considering the Latine workforce. Second, our education measure used the highest level of education obtained, including nursing specific and non-nursing degrees because this measure provided better comparison with the ACS. This measure did not allow an analysis of DNP nurses over time. As a sensitive analysis we examined the distribution of race/ethnicity using the nursing specific education variable in the 2008 and 2018 NSSRN (results available upon request), which included information on DNP education. Results showed some differences in the numbers of nurses at different levels of education, however the proportions for each race/ethnicity group at different levels of education were almost identical to the education results reported here. With the growth in DNP degrees, better educational data in the ACS is needed to facilitate workforce evaluation and planning. Third, this analysis did not convert the number of hours worked to full time equivalents (FTE). In the interest of examining progress made towards a more diverse nursing workforce, we chose to treat part-time and full-time nurses the same. Fourth, because the numbers of AI/AN and NH/PI nurses in the surveys are small, analyses can be underpowered to detect statistically significant trends. Fifth, our analysis provided national estimates and, thus, cannot shed light on regional variations of these workforce patterns. Representative state level data are needed to examine and respond to local trends. For example, the California Board of Registered Nursing has collected data on race/ethnicity, employment, and job satisfaction for years, allowing the state to monitor the growth and employment patterns of their URM nursing workforce (Spetz & Chu, 2020).
Key Workforce Issues to Monitor and Address
Several patterns emerged from our analysis that are critical for health workforce researchers, nurse educators, nurse recruiters, and other stakeholders to monitor for progress and to address shortfalls as required:
The URM APRN workforce is not as well represented in the nursing labor market as the URM RN workforce. The numbers of PhD educated Latine nurses are not keeping pace with the growth of the PhD educated nursing workforce, leading to a possible decline in this group of nurses. Fewer B/AA nurses with an MSN degree are taking on roles as APRNs compared to non-URM nurses with MSN degrees. Fewer B/AA nurses with PhDs pursue teaching or research positions relative to their non-URM PhD colleagues, with more B/AA nurses employed in administration/supervision compared to non-URM PhD nurses. B/AA nurses are withdrawing from rural areas at a faster pace than non-URM nurses. B/AA and AI/AN nurses are overrepresented among unemployed nurses. The proportions of NH/PI and AI/AN nurses obtaining graduate degrees lags behind that of other URM nurses.
In conclusion, our analysis of workforce trends of URM nurses found that the URM nursing workforce in 2018/2019 was still roughly 12 PPs shy of the 31% URM representation in the U.S. population. While our analysis cannot quantify the role of structural racism in the data observed, results across clinician roles, educational attainment, job types, and labor force participation showed that unequal educational and professional opportunities persisted over the last decade for many URM nurses, suggesting that racism continues to permeate through the ranks of the nursing profession.
Supplemental Material
sj-docx-1-ppn-10.1177_15271544221118319 - Supplemental material for Workforce Trends of Underrepresented Minority Nurses in the United States Over the Last Decade: Progress Towards Equal Representation?
Supplemental material, sj-docx-1-ppn-10.1177_15271544221118319 for Workforce Trends of Underrepresented Minority Nurses in the United States Over the Last Decade: Progress Towards Equal Representation? by Edward Hynson, Jason Bloomer, Zoe Samson, Kiersten Price, Daniel Tran and Ulrike Muench in Policy, Politics, & Nursing Practice
Footnotes
Declaration of Conflicting Interests
The author(s) declared no potential conflicts of interest with respect to the research, authorship, and/or publication of this article.
Funding
The author(s) received no financial support for the research, authorship, and/or publication of this article.
Supplemental material
Supplemental material for this article is available online.
References
Supplementary Material
Please find the following supplemental material available below.
For Open Access articles published under a Creative Commons License, all supplemental material carries the same license as the article it is associated with.
For non-Open Access articles published, all supplemental material carries a non-exclusive license, and permission requests for re-use of supplemental material or any part of supplemental material shall be sent directly to the copyright owner as specified in the copyright notice associated with the article.