
Abstract
Operating on granular, publicly available crime data from 2017–2022, we utilize negative binomial regressions to investigate the spatial relationship between gamedays and crime in Atlanta, comparing effects of football and soccer. Our models suggest that football increases crime near the stadium in Atlanta substantially relative to the effects of soccer. Football games are correlated with a 113% increase in crime—concentrated within 0.5 miles of the stadium and robust across models. We support our findings using a temporal analysis within gamedays, which illustrates that the distribution of crimes is centered around the hours surrounding the start of the game. Our results support the existence of a substitution effect of crime towards the stadium on game days and the existence of demographic differences between football and soccer fans in the United States. Mercedes-Benz stadium should implement additional security measures, including free lockers within the stadium, to shield their patrons from theft.
Introduction
Sporting arenas continue to attract both public and private funding, with proponents arguing that they generate “large positive economic impacts to host communities,” (Agha & Rascher, 2021, p. 1) including job creation and tourism. However, numerous academic studies suggest that these economic impacts are minimal or non-existent (Agha & Rascher, 2021; Bradbury et al., 2024; Coates, 2007). As Bradbury et al. (2023) notes, the economic benefits of new stadiums often fall short of the public subsidies required for their construction. While sports stadiums do create positive externalities, such as fostering civic pride, these benefits are difficult to quantify. Conversely, the presence of active stadia also results in significant negative externalities, including noise, light pollution, traffic congestion, and crime (Chase & Healey, 1995; Ge et al., 2021; Humphreys & Pyun, 2018; Hyun, 2022). A growing body of research has precisely measured one of these negative externalities—crime—finding significant increases in crime in areas surrounding the stadium on home game days, as well as in places where fans gather to watch the game, such as bars and restaurants (Ge et al., 2021; Kurland, 2019; Marie, 2016; Montolio & Planells-Struse, 2019). However, to our knowledge, no study has explored the differing effects on crime when both soccer and football are played in the same stadium, nor has there been an exploration of hosting Major League Soccer (MLS) games in a city with granular data. Our case study in Atlanta, GA, aims to address these gaps in the literature and contribute additional insights into the negative externalities associated with new stadiums.
Our motivation builds on key differences between National Football League (NFL) and MLS events at Mercedes-Benz Stadium, especially the much larger NFL crowds, distinct fan demographics, and practices like tailgating. Following Marie (2016), three mechanisms may link these differences to crime: (i) fan concentration, which would raise violent or disorderly incidents where fans gather; (ii) self-incapacitation, which would reduce crime while fans are inside watching; and (iii) police displacement, as officers are reallocated to stadium gates, metal detectors, crowd flow, in-stadium incidents, and traffic management. NFL games also create a much larger supply of opportunities for property crime by bringing far more vehicles and unattended belongings to the area.
These mechanisms generate clear predictions. If fan behavior or incapacitation were driving crime, we would expect increases in violent incidents (mechanism 1) or decreases in crime during the game (mechanism 2), particularly in the NFL. In contrast, a pattern in which crime rises during the game, is concentrated in property offenses, more prominent in NFL games, and is spatially narrow around the stadium, aligns with policing displacement combined with a greater stock of targets at NFL games. This interpretation implies that fans are not the perpetrators; rather, reduced patrol presence near the stadium—paired with more unattended property—creates a brief window for opportunistic theft.
By analyzing the impact of NFL games versus MLS matches on crime rates near the stadium, this research supports the latter mechanism. It utilizes the case of the Mercedes Benz Stadium in Atlanta, Georgia, which is home to the MLS Atlanta United Football Club (FC) and NFL Atlanta Falcons. 1 We examine whether crime associated with soccer differs from that linked to football. Our findings suggest that the negative externalities associated with stadium-related crime are more pronounced during football games and are primarily driven by property crimes rather than violent crimes. Additionally, analysis of crime data within defined time intervals on home game days indicates that the rise in property crimes is predominantly concentrated during the games. This contrasts with Ge et al. (2021), who reported that increases in crime on game days were primarily attributable to post-game incidents.
The weaker effect of soccer games on crime contrasts with evidence from countries where soccer is culturally dominant, such as Uruguay and Brazil (Ge et al., 2021; Munyo & Rossi, 2013). Although MLS attendance has been rising—boosted by high-profile arrivals like Lionel Messi and Gareth Bale (Lore, 2023)—our results indicate that soccer-related crime in the U.S. does not resemble the crime patterns associated with football. U.S. soccer fans tend to be younger and more diverse than football fans (Conti, 2022), and the shorter NFL season, with only eight non-playoff home games, increases the salience of each game and contributes to substantially higher attendance.
Our findings suggest that the crime increase around NFL games is not driven by fan aggression or game intensity but by a greater supply of targets generated by larger crowds—more vehicles, more tailgating activity, and more unattended property. NFL games draw bigger audiences than MLS matches, and this inflow of visitors produces a denser concentration of exposed property in the surrounding area. When combined with the reallocation of police resources toward stadium entrances and in-stadium duties, this expanded opportunity environment provides a plausible explanation for the observed spike in property crime. Our results offer useful insights for designing public policies to improve safety and community well-being during major sporting events.
Literature Review
The link between crime and sporting events is frequently highlighted in the media (Dorsey, 2026), prompting researchers to study sports-related crime. Marie (2016) applies routine activity theory to suggest that stadium crimes result from the confluence of motivated offenders, suitable targets, and insufficient guardianship (Clarke & Felson, 1993). Similarly, Ge et al. (2021) use microlevel data from soccer games in São Paulo, Brazil, to show that fans' motivation to commit crimes is influenced by game outcomes, with increased thefts and robberies around stadiums attributed to more available targets, i.e., vehicles. In contrast, Yu et al. (2016) analyze hourly crime data from Memphis, TN, finding that crime increases during basketball games, suggesting criminals may be taking advantage of fans by targeting their unattended vehicles, rather than being fans themselves as reported by Ge et al. (2021). This study also highlights an important difference between Marie's (2016) conceptual framework, in that fans are much less likely to travel to away games in the United States, compared to within London, reducing the incapacitation effect, and that game attendees in the U.S. are less likely to be potential criminals.
Billings and Depken (2011) and Kalist and Lee (2016) also investigate spatial variations in crime around stadiums in the United States. Billings and Depken (2011) analyze spatial variations in crime in Charlotte, NC, around two stadiums (NBA Bobcats and NFL Panthers). The authors find no significant impact on citywide crime on game days, but they do observe an increase in crime within a half-mile radius and from one-half to one mile around both stadiums. This research implies the existence of a spatial effect of football on the distribution of crime in a city. Kalist and Lee (2016) use crime data from 2004–2006, spanning eight cities with NFL teams, to evaluate the effect of NFL games on crimes in the host city and find a positive impact of NFL home games on crime.
The violent nature of American football has also prompted researchers to investigate the sport's relationship with intimate partner violence, as studied by Card and Dahl (2011) who seek to empirically estimate the effect of emotional cues on intrafamily violence. The authors focus on the effect of unexpected NFL losses, relative to a given reference point, on male-on-female interpersonal violence on gameday Sundays. Baseline results from these estimations include a significant increase in at-home violence by men against their wives and girlfriends after games, especially salient games, where the home team was expected to win and lose. These results emphasize the emotional significance of important games, which are magnified in the NFL, as there are so few games in general.
Pyun and Hall (2019) investigate football-related crime by analyzing the impact of an NFL team's removal on overall crime in a city. They use the Detroit Lions' move from Pontiac, MI, to Detroit, MI, as a natural experiment, analyzing crime data two years before and after the move (2000–2003) during the NFL season when crime is most likely influenced. The study finds consistent decreases in larceny on game days across all comparison groups and reductions in vandalism in most groups after the Lions' move. However, increases in auto theft and assault suggest a possible substitution effect. Despite limitations, such as potential selection bias and the unique setting of the Detroit metro area, this study provides valuable context for the current research, given that Atlanta has hosted an NFL team since 1966. It suggests that the spatial and temporal substitution effects we examine in this work could help maintain the overall level of criminal activity in Atlanta.
More directly related to our work, Kurland (2019) utilizes hourly crime data from 2007–2015 for the city of Newark, NJ, to estimate the effects of events held at the Prudential Center on crime in the hours surrounding events. This work follows the approach developed by Marie (2016) while putting the study in the context of multiple theories of crime. The author employs a negative binomial regression and finds an increase in crimes for Devils games, concerts, and Disney on Ice. These correspond to a 25%, 21%, and 32% increase in the number of robberies directly before and after, as well as during each event respectively.
The literature on crime around the stadium finds consistent increases in a variety of case studies and aggregate analyses of crime on gamedays. The progression of the literature has been to refine its methods and trend towards more behavioral explanations of variations in crime, while adding robustness to its findings through additional variety in cases. Through this study, we focus on the novel case of the MLS, and compare the league to a modern, micro-level analysis of the NFL utilizing modern spatial and temporal methods. More specifically, we control for one-half mile increments away from the stadium.
Data
Mercedes Benz Stadium is home to both the Atlanta Falcons and Atlanta United FC, an NFL and MLS team respectively. The stadium has a capacity of just over 70 thousand spectators, complemented by some parking in the form of garages and a tailgating ‘backyard.’ Atlanta United games regularly draw over 40 thousand people, occasionally filling the stadium almost completely, though this could be influenced by the honeymoon effect as the arena opened in 2017 (Clapp & Hakes, 2005). This scenario makes for an ideal natural experiment in which to compare the effects generated by football and soccer, as both sports enjoy sizeable attendance figures while sharing a stadium. Atlanta United games enjoy uniquely high attendance for the MLS, with an average attendance of nearly 35 thousand fans in our dataset (Table 1), compared to 21,988 for the whole league in 2025—and a maximum of over 72 thousand attendees, strengthening the validity of our research design (MLS, 2025). Falcons games regularly draw over 60 thousand fans to the stadium, located in downtown Atlanta on the site of the old Georgia Dome.
Summary statistics.
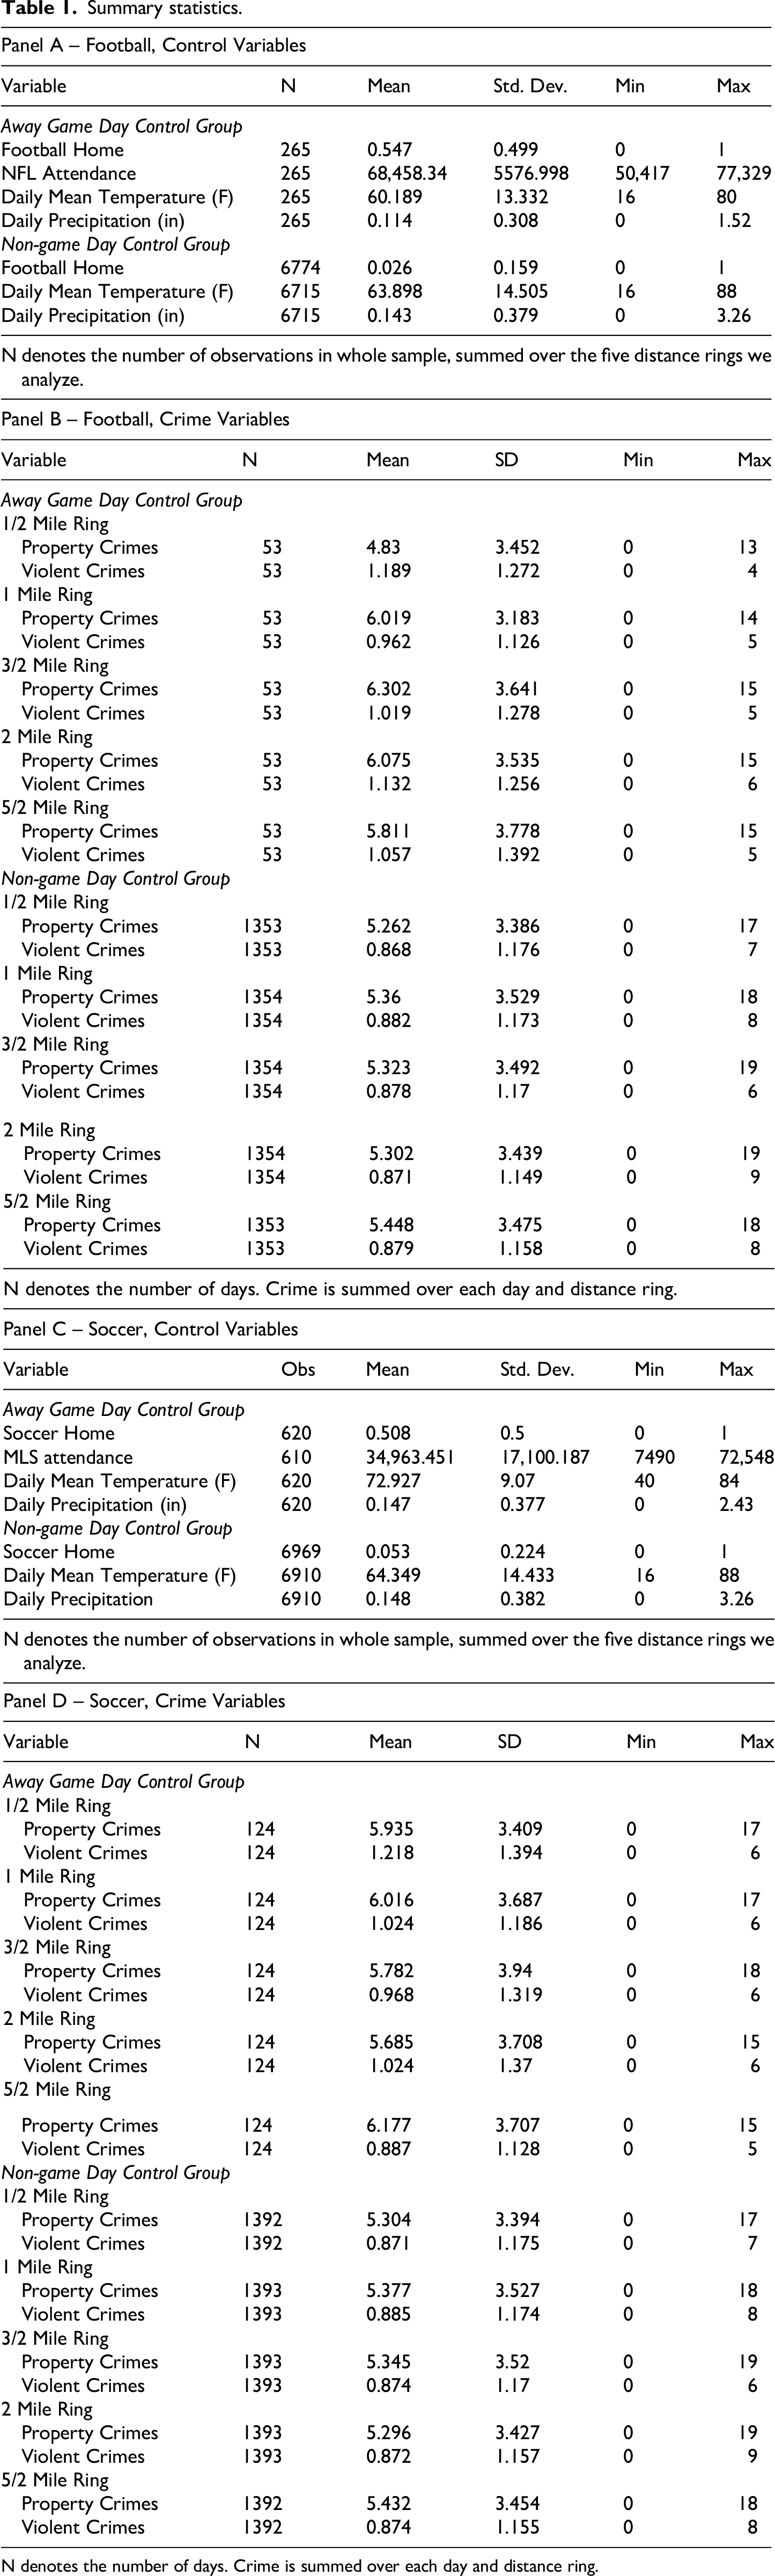
N denotes the number of days. Crime is summed over each day and distance ring.
In addition to professional sports, Mercedes Benz Stadium holds other events including concerts. Though not the central focus of this study, stadium concerts are crowded events, therefore it is necessary to control for their agglomeration effects, as well as other events held within Mercedez-Benz Stadium. Additionally, Mercedez-Benz Stadium is located within a half mile of State Farm Arena, which hosts a variety of events, including basketball games. We handle these potentially confounding effects by dropping days with basketball home games and controlling for other events at State Farm Arena as well as basketball away games. Mercedez-Benz stadium is located over a mile east of downtown Atlanta, with the college-town neighborhood located just to the southwest and Georgia Tech to the north as notable features (Figure 1). Downtown Atlanta is already a location which may attract more crime, with increased alcohol consumption via bars and a higher concentration of people exploring local attractions. College campuses may serve to insulate crime from our dataset, as infractions occurring there might not be reported to Atlanta Police department by campus safety. Notably, Bobby Dodd Stadium, where Georgia Tech hosts their football games, is about 1.26 miles from Mercedez-Benz Stadium.
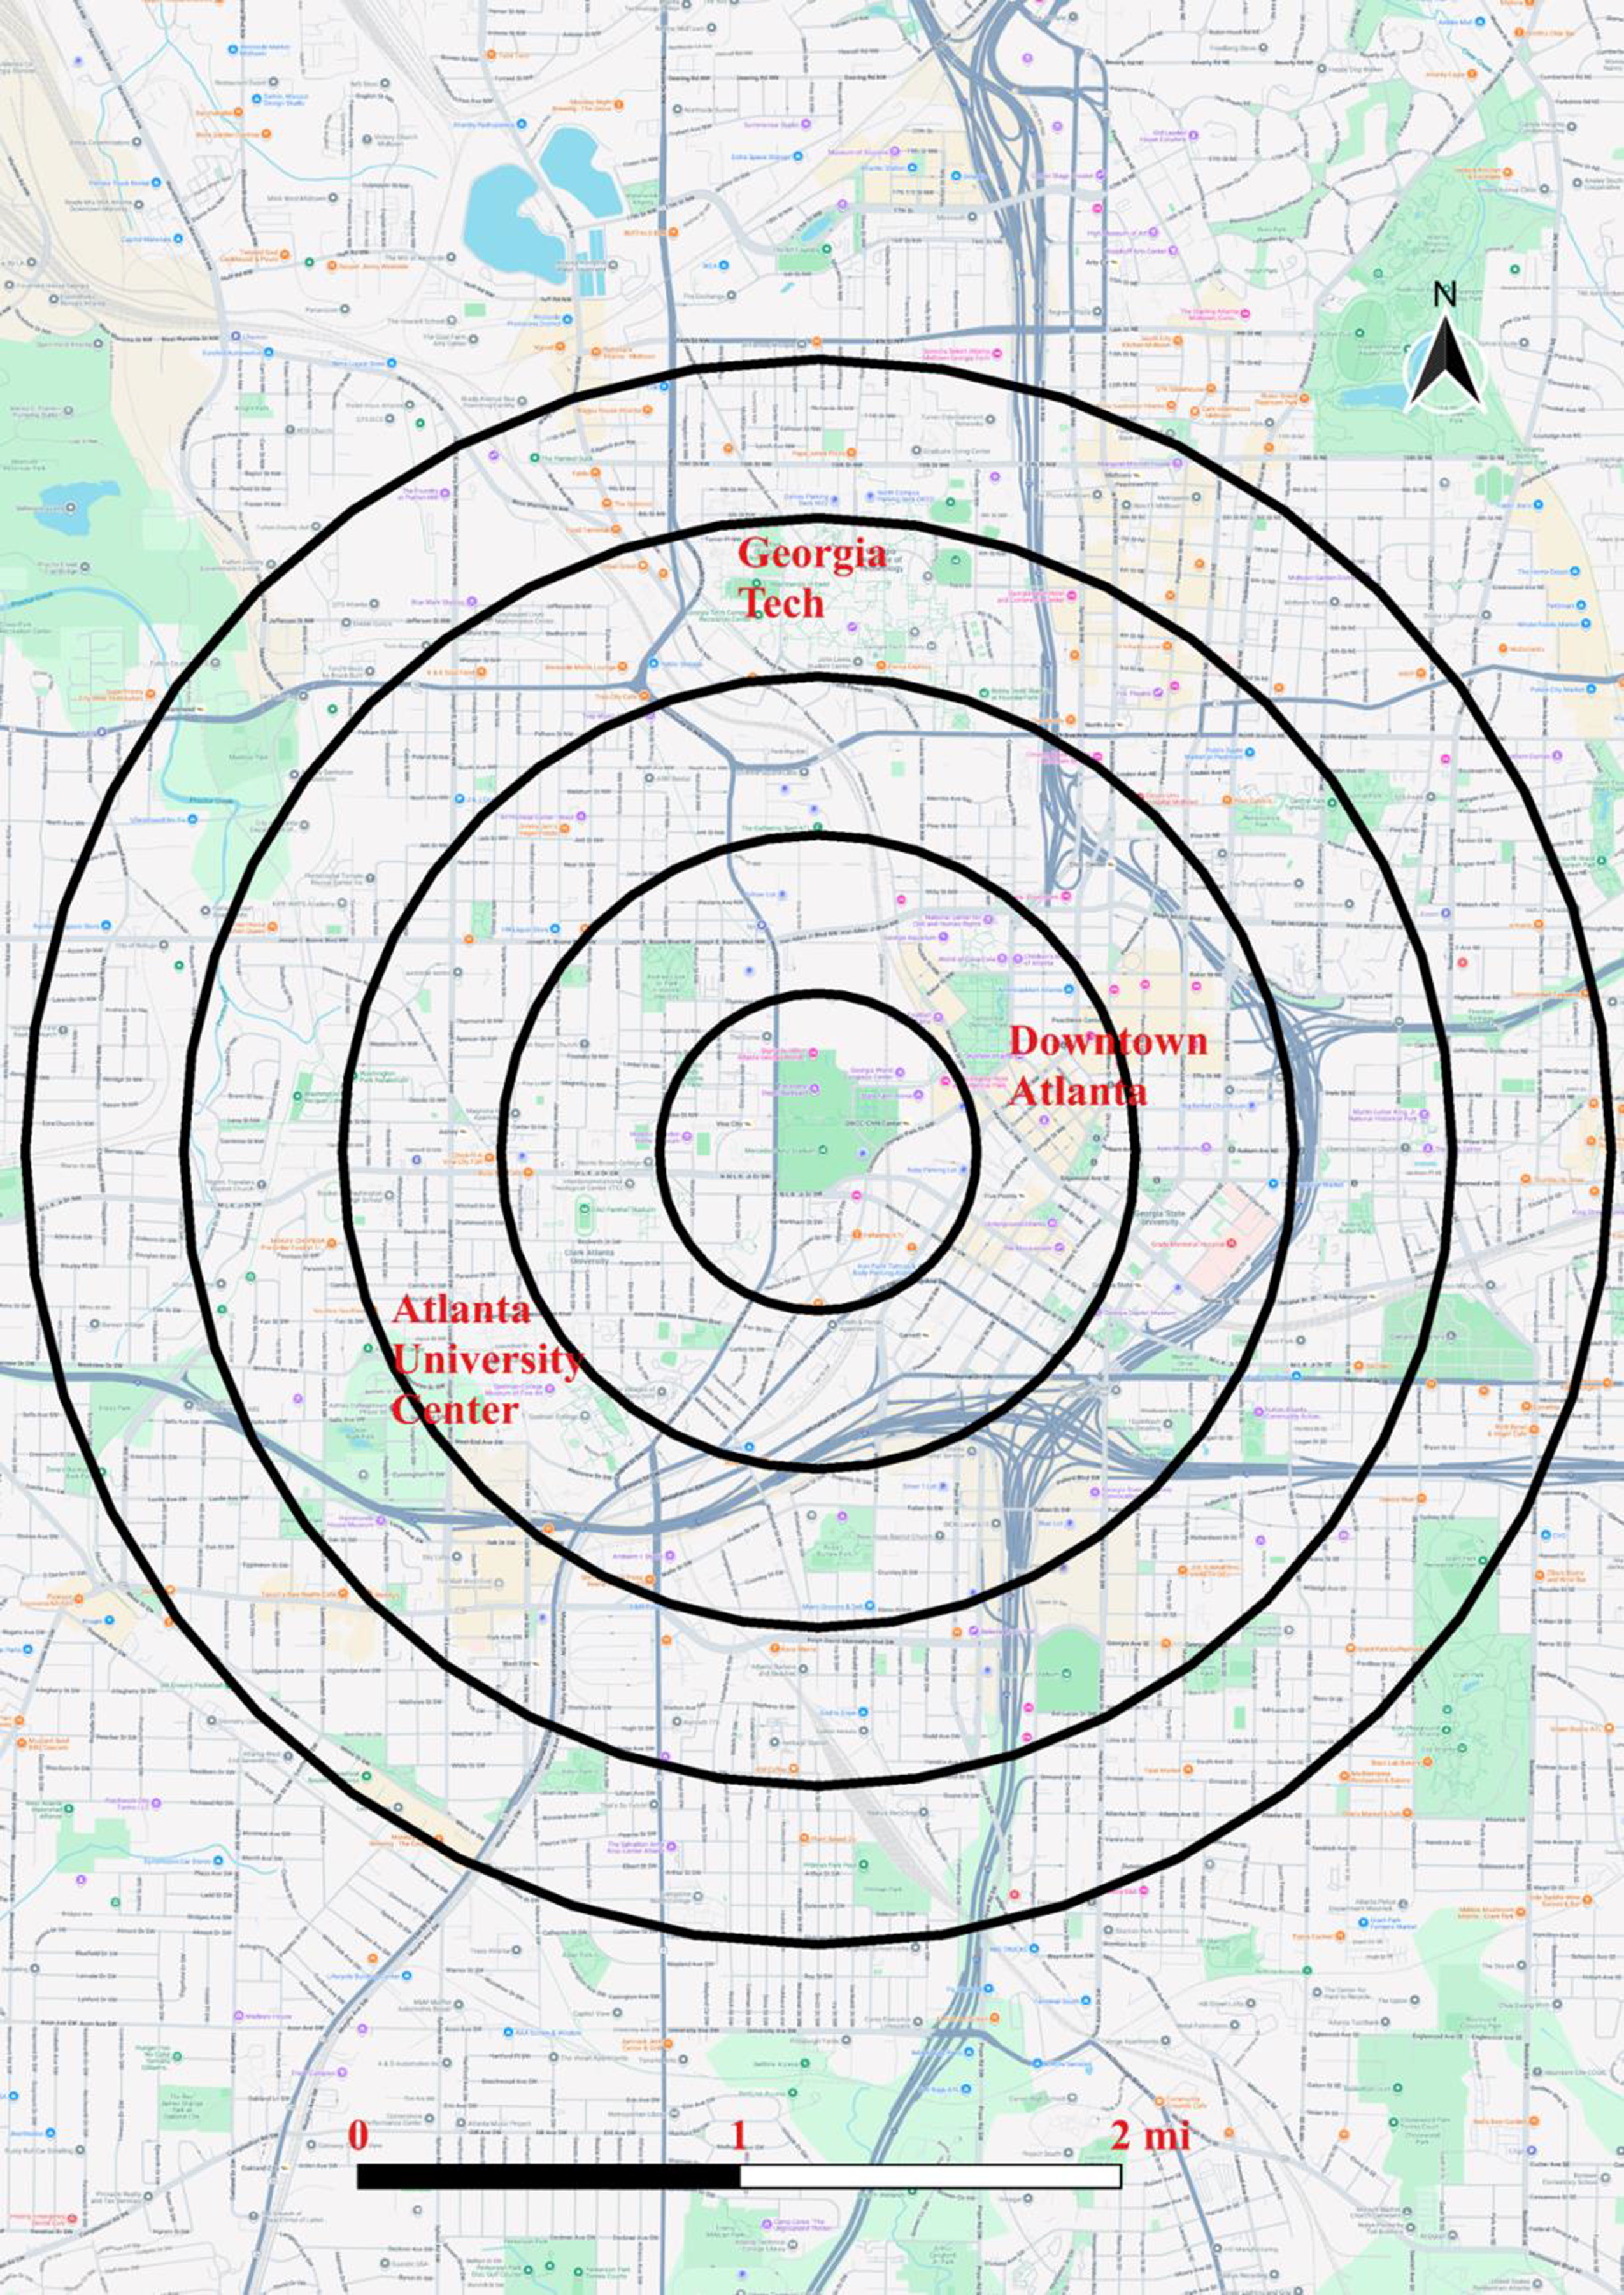
Mercedes-Benz Stadium with rings. Each ring increases in radius by 0.5 mile compared to the last, starting at the stadium in the center. Crimes are binned according to these rings. Note the locations of Georgia Tech, Downtown Atlanta, and University City, located to the north, east, and southwest respectively.
The baseline criminal geography of Atlanta is also of interest in this study as context for interpreting variations of crime about sporting events. First, Atlanta's overall crime rates are nearly double that of the United States average, though that includes rural America. Comparing metropolitan areas, Atlanta has a higher crime rate than Jacksonville, FL and a lower rate than Indianapolis, IN (Weinstein, 2022). Overall, Atlanta appears to have more crime than other U.S. cities (Weinstein, 2022). The Mercedes-Benz Stadium is in the downtown neighborhood of Atlanta, slightly east of Vine City, south of Georgia Tech, west of Old Fourth Ward and Sweet Auburn, and north of Mechanicsville and Summer Hill. While Georgia Tech is considered relatively safe, the other neighborhoods surrounding the stadium are not. The Atlanta Police department is aware of the increases in crime surrounding sporting events, with media outlets reporting that the police department is taking extra measures surrounding the Superbowl and the hosting of a premier league scrimmage (Diggs, 2023). The local government also warns fans to take care of their belongings and keep valuables out of sight in parked vehicles when attending games via an image warning those taking public transport (MARTA, 2018). Unfortunately, we do not observe the specific strategies utilized by police regarding standard weekend NFL or LS games as they are not publicly available.
Our sample includes 92 home games from the 2017 to 2022 seasons, excluding the year 2020 due to low attendance during the COVID-19 restrictions. 2 The Mercedes-Benz Stadium opened in late August 2017, so games before September 2017 are excluded from our sample. Our dataset covers 63 Atlanta United FC and 29 Atlanta Falcons home games, with data on game start time, date, attendance, opponent, and score sourced from sports-reference.com. Weather data from NOAA, including hourly details on precipitation, humidity, visibility, wind speed, and pressure, is used to control for weather-related crime rate influences. 3 We also gather the dates of concerts and other events taking place at the Mercedez-Benz and State Farm during our sample period. 4 We include crime data for Atlanta from 2017 to 2022, 5 categorizing offenses and calculating their distance to Mercedes-Benz Stadium using QGIS. We group crimes into half-mile distance bins up to 2.5 miles, and create a panel dataset, repeating crime counts for each ring. The main method of public transportation to the stadium is the city's bus system, whose stations closest to the stadium fall within one-half miles, along with associated parking garages.
In constructing our dataset, we create dummy variables for days where home and away games occur for soccer, football, and basketball using our gameday data. We use these to drop days when basketball games occur. We use the occur date variables in the police data to construct variables for the date and time of each crime. In classifying crime types, we construct property and violent crime indicator variables using both the provided ‘NIBRS_Offense’ and ‘Crime_Against’ variables in the police data. For dates beginning in 2021, Atlanta PD provides a ‘Crime_Against’ variable which sorts offenses as crimes against property, persons, or society. Thus, we designate crimes against persons as violent crimes and crimes against property as property crimes. Before 2021, Atlanta PD does not provide a crime against variable, so we bin crimes by ‘NIBRS_Offense’ following how these types are designated by Atlanta PD post 2020. This classification designates all types of assault and homicide as violent crimes, and burglary, larceny, robbery, and auto theft as property crimes. We use the provided longitude and latitude variables to identify each crimes’ location. NOAA data are prepared for analysis by destringing the relevant dry bulb weather variables. We use our concert and other events data to create indicator variables for days when these events occur.
Table 1 provides a detailed summary of the control and dependent variables (crimes) for NFL and MLS games, as we run separate regressions for each sport. We divide the sample into five half-mile distance bins, causing control variables (in Panels A and C) to repeat five times per date. To ensure robustness, we use two models: one comparing home game days to non-game days, assuming the game schedule is exogenous (Lindo et al., 2018), and another comparing home game days to away game days (Fone, 2023). In non-game day samples, home game days for the other sport are excluded, and we control for away games in all sports. For example, when studying soccer with a non-game control, we drop football home games and control for all away games. Basketball home games are dropped to avoid confounding. For away game controls, non-game days and games from other sports are excluded to ensure comparability. Panels A and C show that for football and soccer, the home game dummy equals one about 50% of the time for the away game days control group but drops to 2.6% and 5.3% for the non-game days control group. Panels B and D indicate an average of 7 crimes per day, mostly property-related, across each distance ring, showing that our baseline is relatively small, which can explain the large magnitude of the results reported in our empirical analysis.
A vast majority of football games are played on weekends, as well as many soccer games in our sample. To account for this pattern in the data, we control explicitly for the day of the week by month, and run separate analyses for only weekends, presented in the Appendix.
Methods & Estimates
In examining the distribution of crimes around the Mercedes-Benz stadium, we analyze the spatial distribution of crimes on home game days compared to non-game days and away game days. We run separate regressions for each sport we analyze. We also add a complementary analysis within home game days, where we examine the distribution of crimes leading up to and directly after each game has begun. We estimate our model separately for each crime type, restricting the dependent variable to include only property crimes and only violent crimes. We note that the variation in crime variables, as well as game dummies, is larger than the mean. To account for this pattern, we run all models with a negative binomial specification. We aggregate crime data to the daily and distance ring level (Table 1) and estimate Equation (1) using a fixed effects model and robust standard errors. We choose robust standard errors to account for potential heteroscedasticity and because our data does not contain enough clusters to warrant using clustered standard errors (Cameron & Miller, 2015).
The sign of the one-half mile ring interaction term (ϕd=1) is an open question, as the agglomeration of people near the stadium by bus stations and parking garages could result in an increase in crime near the stadium, but additional police presence could substitute crime farther from the stadium. Thus, the one-half to 1 mile ring (ϕd=2), is also an open question. If crime does increase close to the stadium, we expect to observe a tapering off effect of crime, illustrated by positive but decreasing coefficients for the interaction terms on each ring d.
From Table 2, Panel A, we observe a significant increase in crime within a half-mile radius of NFL games. Specifically, Atlanta Falcons home games are associated with a 245% increase in property crime within this area compared to the 2–2.5-mile ring, relative to the same location on away game days. 6 When using non-game days as the control group, the results are similar but smaller, showing a 140.85% increase in property crime. Beyond half a mile from the stadium, no effects are observed for football games, except for a 27% increase in property crime in the 1–1.5-mile ring in both control groups analyzed (Table 2, Panel A, columns 1 and 3). 7 , 8 While the magnitude of these results is large, they align with Ge et al. (2021), who found crime increases of 57.6% within a 0–1-mile ring on home game days, rising to 160% on derby game days. Similarly, due to the small baseline (see Table 1, Panels B and D) in our context, these relatively large percentage changes in crime were anticipated. From Table 2, Panel B, however, we find weaker and less statistically significant effects of soccer games on crime. We observe, nonetheless, a 12% increase in property crime in the one-half to one mile ring for the non-game days control group (Table 2, Panel B, column 3), showing suggestive evidence that NFL games bring more negative externalities related to crime in Atlanta, GA than MLS games. Taken together, our results, which indicate an increase in crime around the stadium on home game days—driven primarily by property crimes rather than violent crimes—align with Ge et al. (2021)'s suggestion that this rise in crime is mainly due to the greater availability of potential targets, such as vehicles near the event.
Main results.
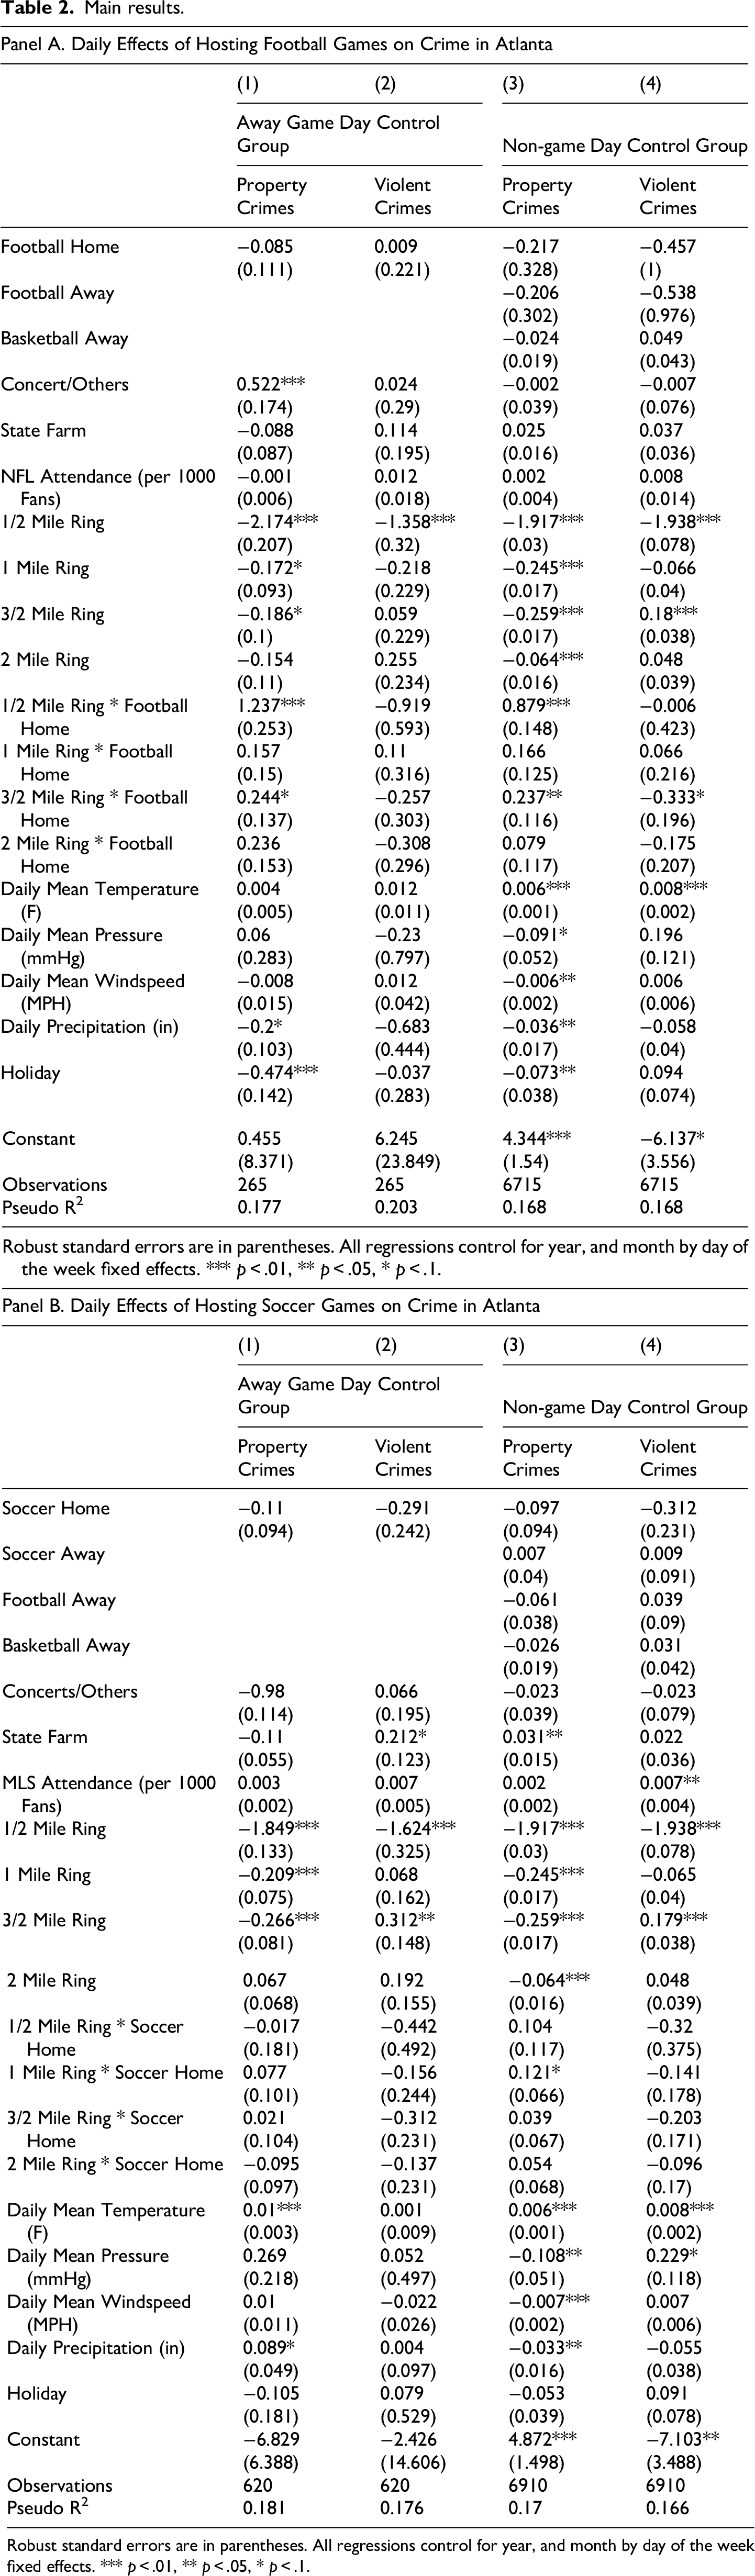
Robust standard errors are in parentheses. All regressions control for year, and month by day of the week fixed effects. *** p < .01, ** p < .05, * p < .1.
Note that the parameter estimates on 1/2 mile ring, 1 mile ring, 3/2 mile ring, and 2 mile ring in columns (3) and (4) in Table 2, Panels A and B are identical. This result provides strong evidence that the areas surrounding the stadium are safer than the comparison group. The fact that non-game days far outnumber game days suggests that excluding only home football or soccer game days from the sample does not alter these estimates. Together, these findings enhance the reliability of our results, demonstrating that crime negatively impacts areas surrounding the stadium on football game days. Moreover, the consistency of our estimates when using only away game days as the control group in columns (1) and (2)—despite the substantial reduction in sample size—indicates that the results are not driven by an overabundance of control group observations in the model.
These results are visualized in Figure 2, Panels A and B, where the coefficients for each sport are plotted. Panel A focuses on NFL games and highlights a significant spike in property crime within a half-mile of the stadium for both control groups. This effect is particularly pronounced when compared to the coefficients for the other rings, which are smaller in magnitude and not significantly different from zero. In contrast, Panel B, which examines MLS games, shows much smaller estimated coefficients for all distance rings, none of which are significantly different from zero, with 95% confidence. All the findings reported in this section are shown to be robust across various model specifications, as detailed in the appendix. These include using OLS and Poisson models with fixed effects (Table A1) and limiting our original sample to weekend days only (Table A2).
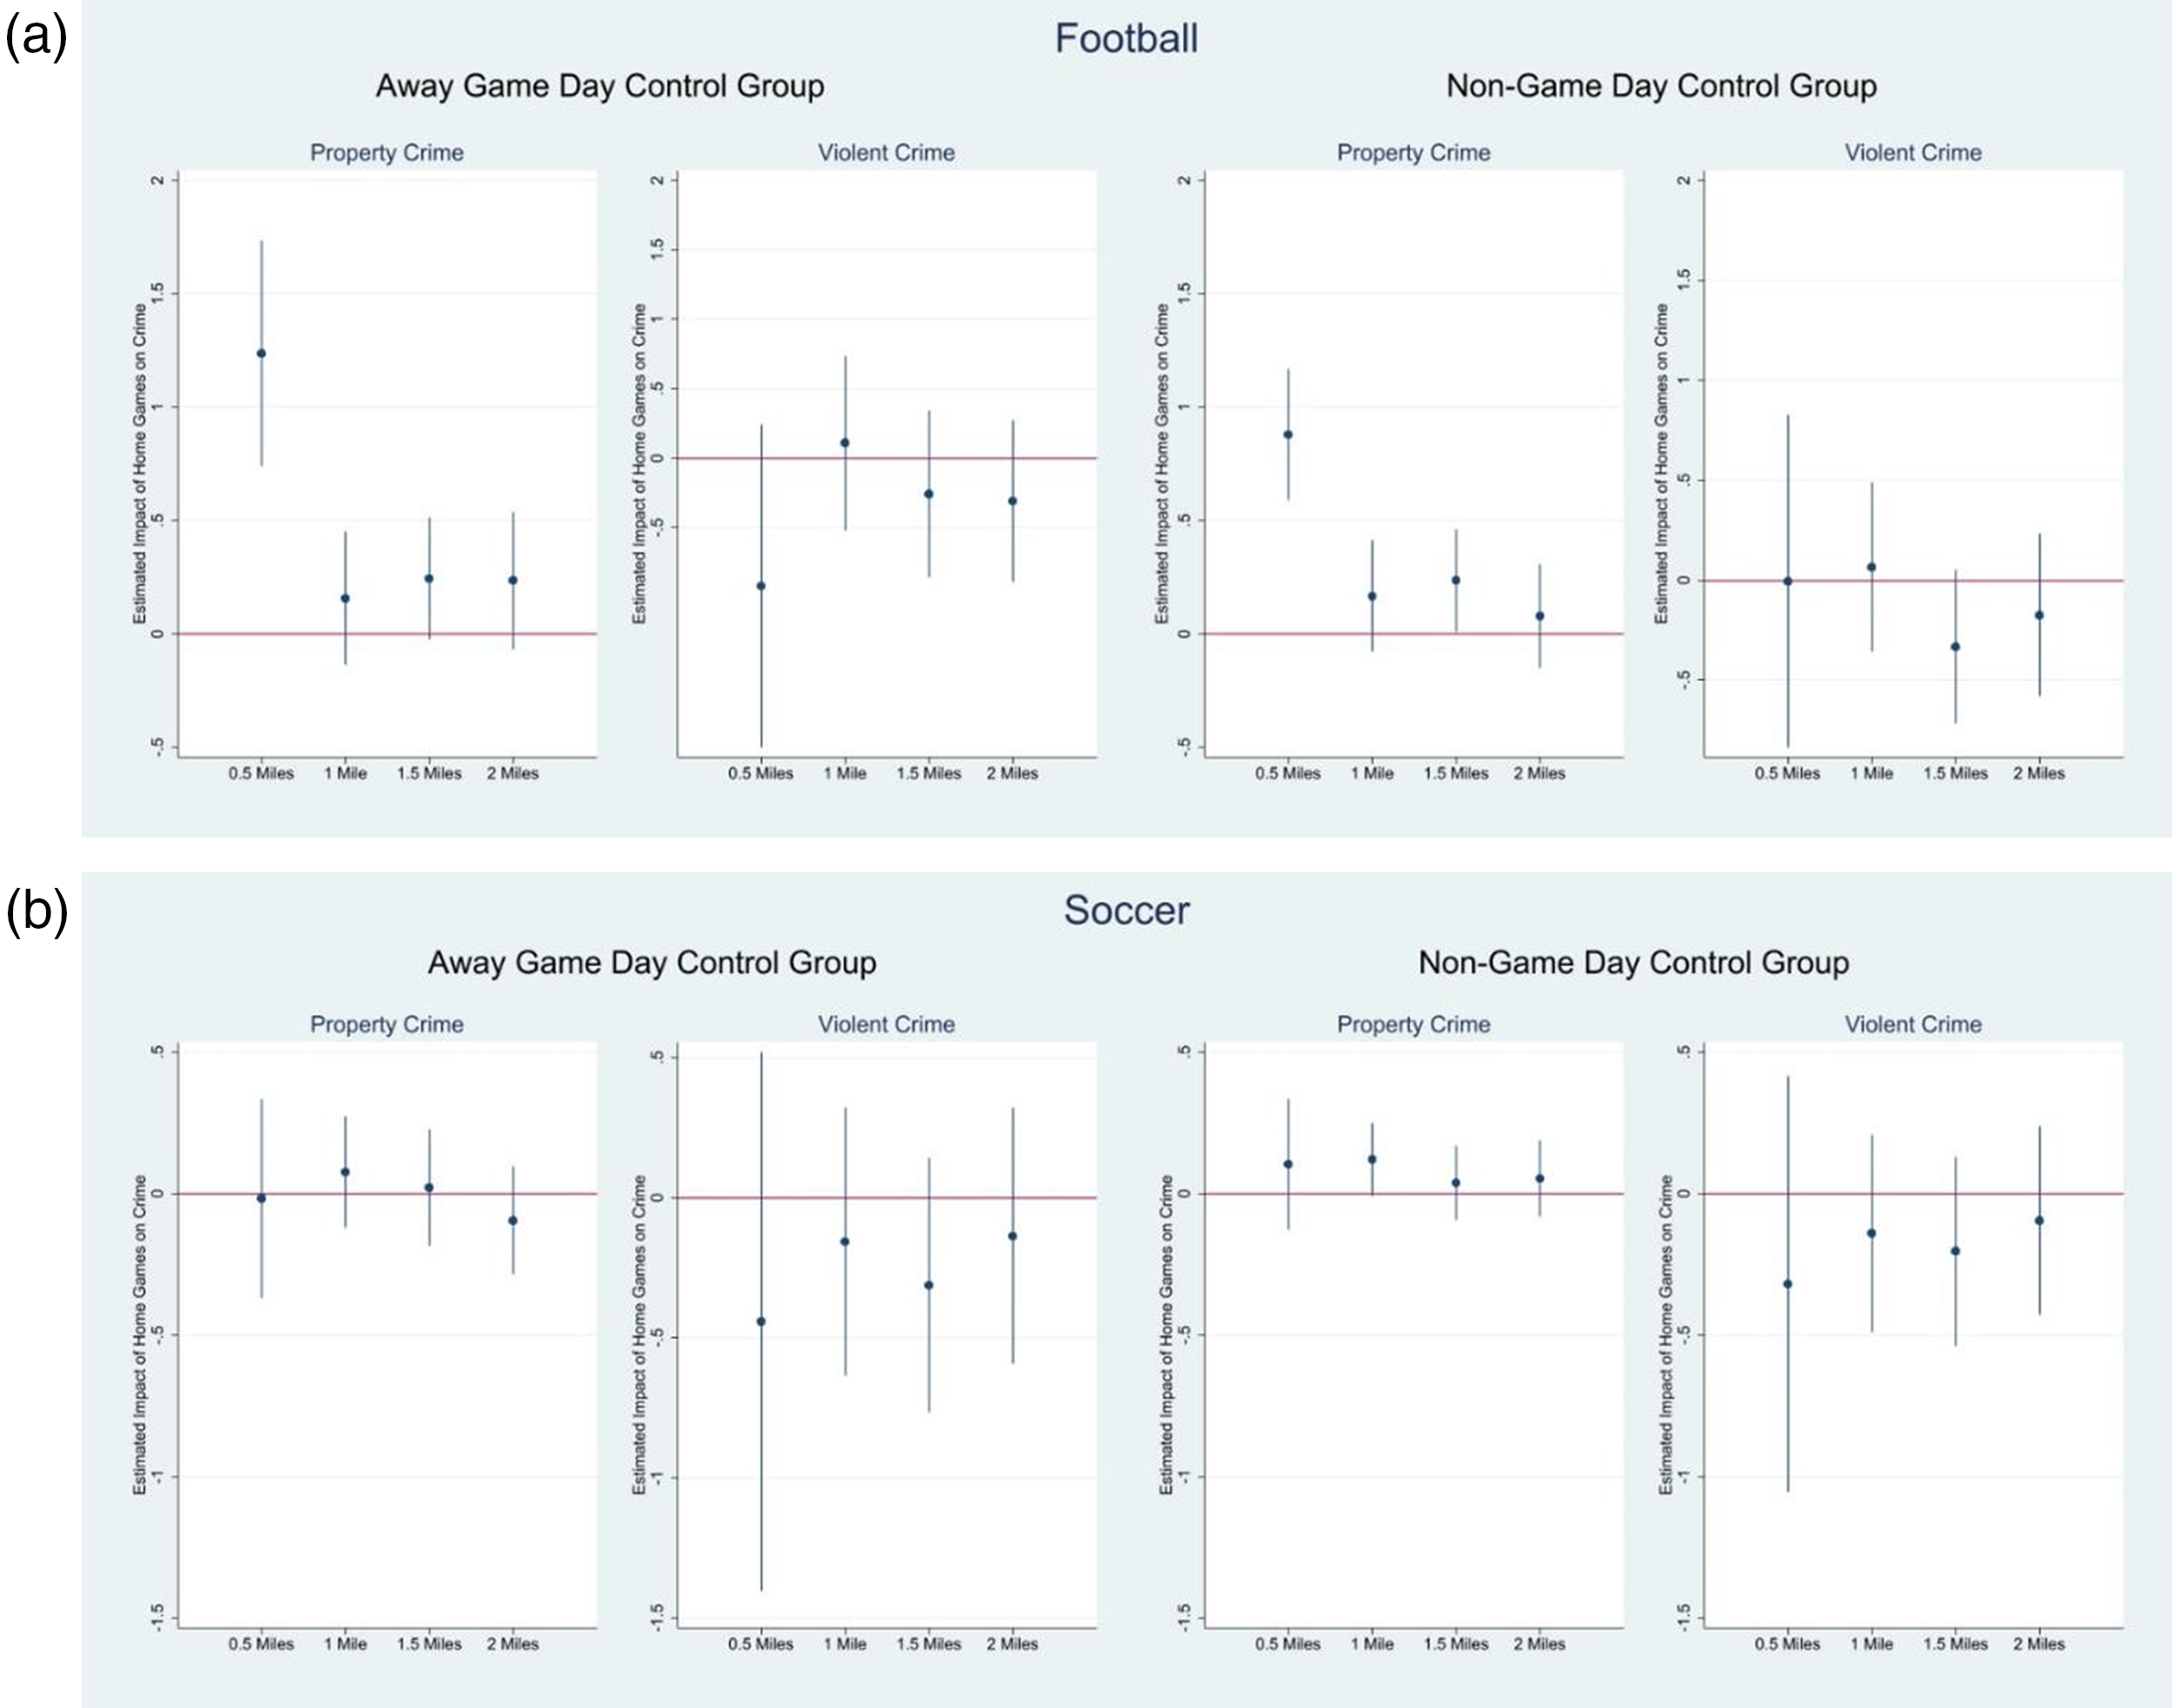
(Panel A) Plotting the coefficients of ring variables interacted with football home for both control groups. The bars represent 95% confidence intervals. (Panel B) Plotting the coefficients of ring variables interacted with soccer home for both control groups. The bars represent 95% confidence intervals.
Robustness Check and Mechanism
As an additional exercise to add robustness to our findings, we develop a temporal analysis where we solely focus on MLS and NFL game days in Atlanta and take advantage of hourly information of crimes’ occurrences. In Figure 3, we show that the distribution of crimes is concentrated in the hours surrounding the start of the game. To construct this graph, we create intervals of one hour spanning ten hours before and after the start of each game and aggregate all the crimes that took place within each 1-h interval. The dashed black vertical line at time zero considers all crimes that happen between the start of the game and the first hour after the game started. Most crimes happen between one hour before the game starts and three hours after the game starts. The results are especially salient for crimes happening at the first ring (i.e., 0–0.5 mile radius) around the stadium. This result mitigates concerns with other potential events unrelated to the games that could be driving our results as crimes do not only vary across game dates and closeness to the stadium, but they also change across time within the sub-sample that isolates game days in our analysis.
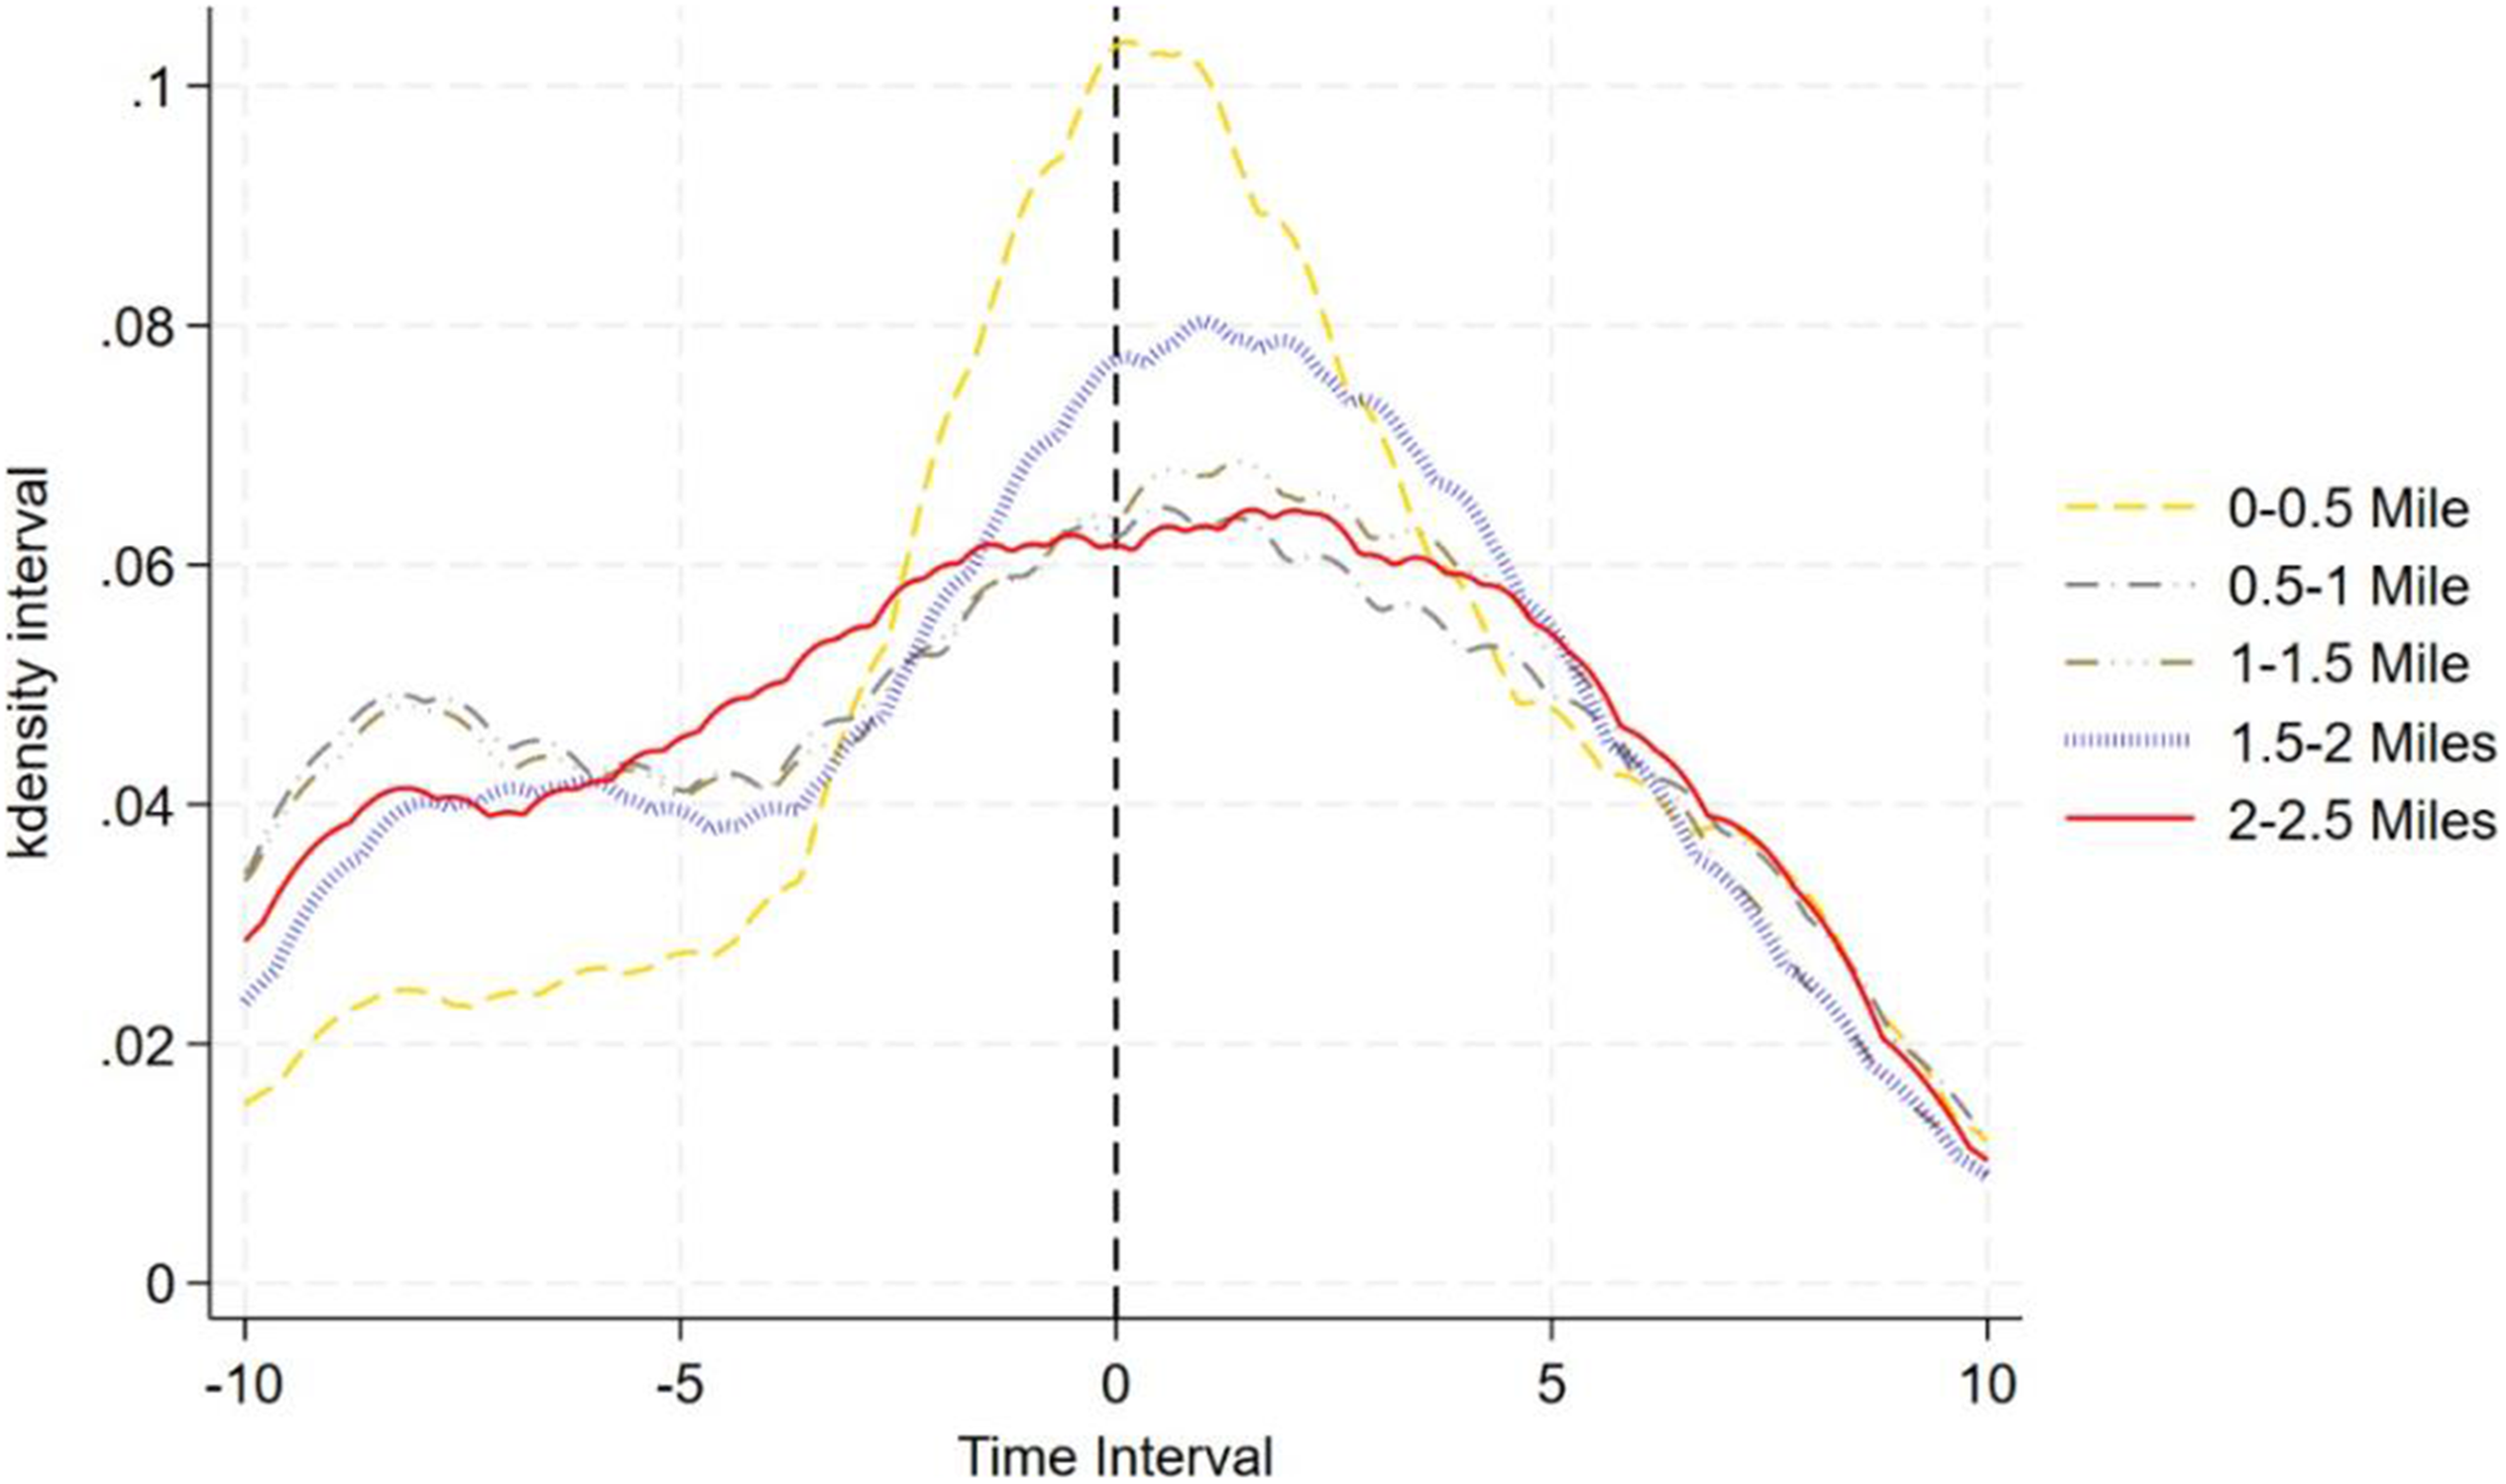
The figure plots the kernel density distribution of the police report time of crime incidents by distance to stadium, focusing on 10 hours before and after the game start.
We then performed an event study analysis using the 2–2.5-mile ring from the stadium as the reference group, with the other four rings as the treated groups. We aggregated all crimes within one-hour intervals over an 8-h time interval: 4 h before the game and 4 h after it begins. Next, we ran two separate models: one for home games and another using away games as the control group. To establish a temporal reference, we compared our results to the time bin four to three hours before the game's start. Figure 4 presents the event study estimated coefficients on a unified set of axes, showing how the effect changes across both distance and time.
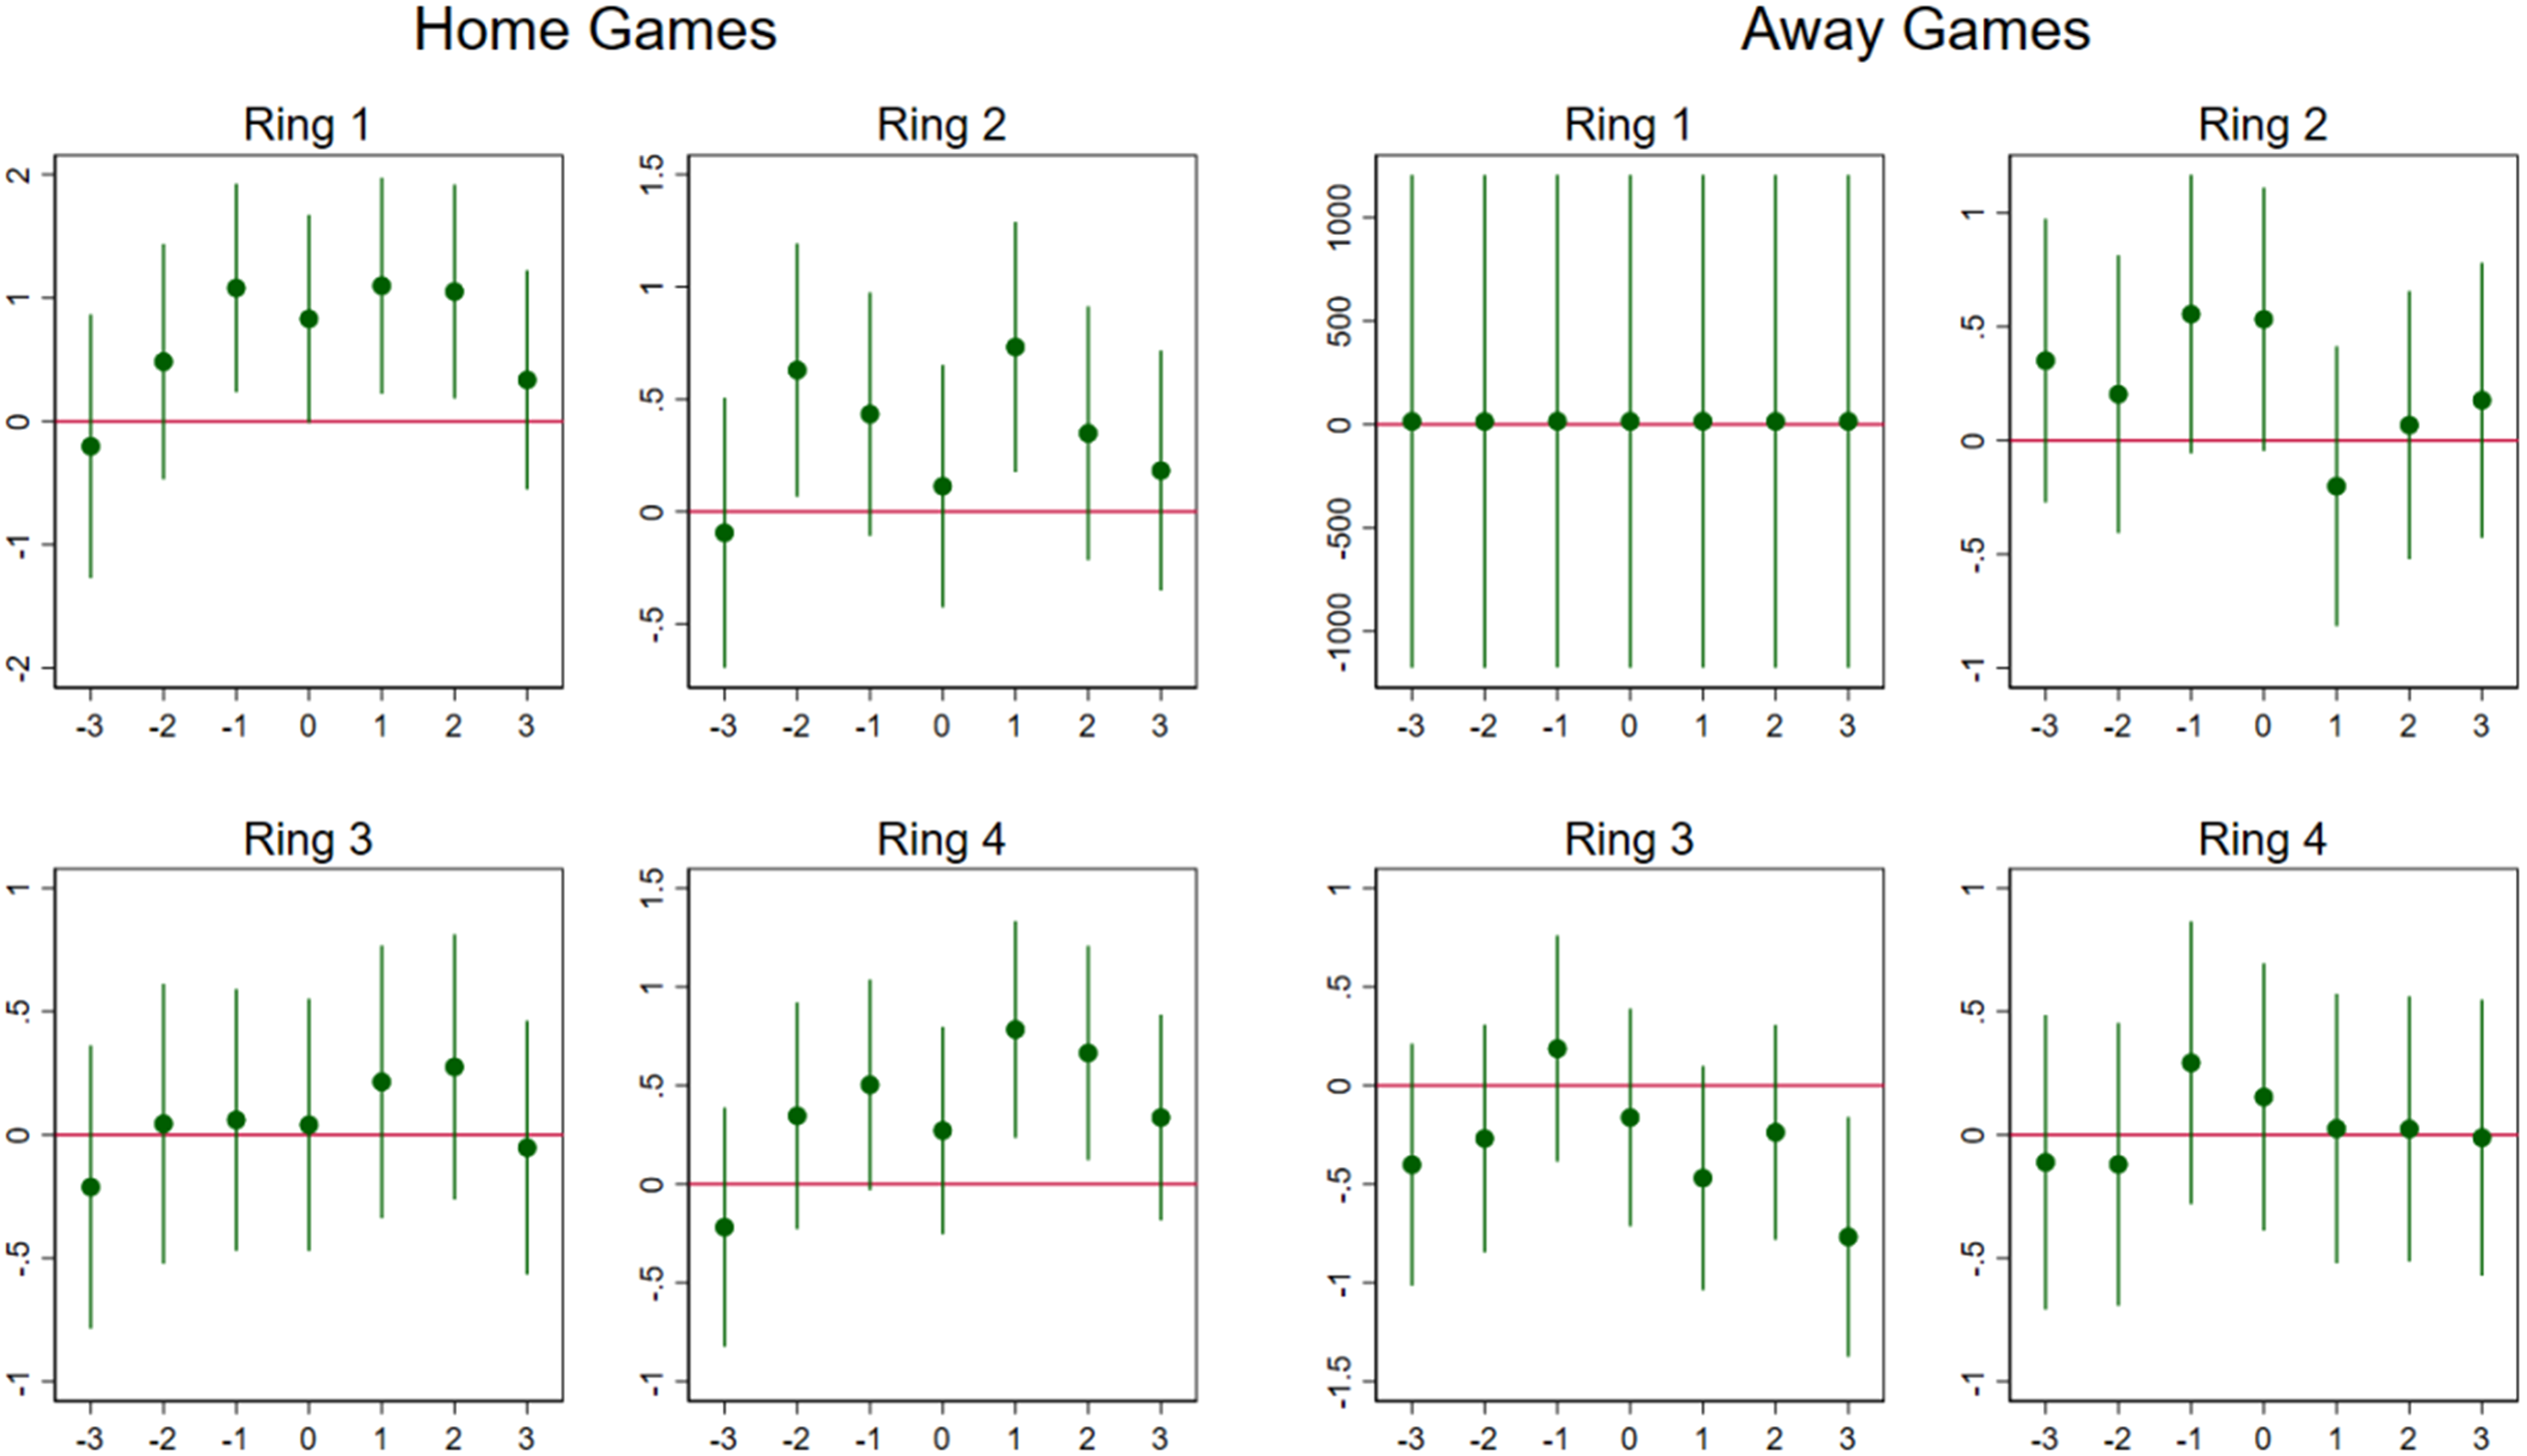
We modeled crime counts using a negative binomial distribution over an 8-hour time interval: 4 hours before the game and 4 hours after it begins. Each time interval captures the crime occurring within 1-hour intervals starting from the reference time. For example, the time interval −1 includes crime from one hour before the game's start until the game begins. Solid vertical lines in the graph represent the 90% confidence intervals.
Our findings support the hypothesis that home games (left-hand side of Figure 4) impact crime rates, with variations observed depending on the timing and distance from the game's start. Consistent with Yu et al. (2016), we find that during home games crime increases, likely because perpetrators take advantage of unattended vehicles. Evidence of this result is apparent as all analyzed distance rings, except for the third ring (1–1.5 miles), show an increase in crime during interval 1, which corresponds to the period one to two hours after the game's start. Additionally, in line with our previous estimates, the positive effect of home games on crime is most pronounced in the first ring (0–0.5-mile radius from the stadium). Also, by focusing on the first ring, we find suggestive evidence that tailgating may play a significant role in influencing crime patterns. Specifically, there is a noticeable peak in crime within the hour leading up to the game's start, during interval −1, which encompasses the period from one hour before the game begins until the game officially starts. Lastly, we do not observe significant effects for the control group, i.e., away games (right-hand side of Figure 4), which validates our findings.
Discussion and Conclusion
The spatial distribution of property crimes around the Mercedes-Benz Stadium on football and soccer home game days suggests that there exists a substitution effect on crime, pushing crimes towards the stadium when the team, and tens of thousands of fans, are present. This effect provides evidence for the hypothesis put forth by Pyun and Hall (2019), that the overall level of crime in Atlanta may be elevated by the presence of the Falcons, and this extra level of crime is sustained by the opportunities presented from the agglomeration of fans and their cars during games.
Our event study indicates that crime levels close to the stadium are elevated from one hour before the start of the game to two hours after the start. Crime increases return to levels not significantly different from zero three hours after the game's start, likely when games are ending. This result provides additional support for our interpretation, as these are the times when fans are likely to be most distracted by the game—from finding their seats and purchasing refreshments until they leave the stadium. Our results provide insight into the spatial and temporal distribution of crimes associated with home games, the existence of which has already been argued in the literature (Kalist & Lee, 2016; Pyun & Hall, 2019). The graphical intuition provided by our temporal analysis can also indicate the importance of tailgating as crimes, especially within a half-mile from the stadium, reach their peak before the game starts. The effects of home games on crime appear to overcome present security measures close to the stadium. To internalize this externality, Mercedes-Benz stadium should offer lockers where fans can secure their belongings during the game and take measures to secure parking lots, as many of the crimes in our dataset are from-vehicle larcenies. Police should be aware of the differences in crime distribution on home game days, and position officers accordingly.
Since we do not observe the position of police over time, we cannot know if different policing strategies already exist for different sports. It is possible that police are aware of either higher attendance at NFL games or higher crime rates and employ different countermeasures accordingly. Additionally, the NFL, a richer company, may plausibly hire more security personnel given the existence of the NFL security department (SI Staff, 2014). If either party does already increase their security efforts around football games, this would suggest a powerful increase in crime resulting from football games which overcomes countermeasures. Our results and conclusions should be taken in the context of these caveats.
The stronger impact of home game days on crime during football events compared to soccer events supports the existence of demographic differences between football and soccer fans in the United States, as well as differences between the American and international soccer fan, since much more crime is observed outside of the U.S. (Ge et al., 2021; Montolio & Planells-Struse, 2019). Soccer's increased popularity outside of the U.S. is also likely responsible for this difference. Football games have a higher attendance, on average, than soccer games, so there may be more opportunities for the confluence of a motivated offender and suitable target during football games, supporting routine activity theory (Table 1; Clarke & Felson, 1993). The NFL is the most popular sport in the U.S, while soccer lags behind at number six (Richter, 2022).
Our findings differ from several studies documenting increases in violent during major sporting events, particularly in contexts where rivalry intensity, alcohol consumption, or match stakes are high (Card & Dahl, 2011; Ge et al., 2021). This discrepancy highlights the importance of contextual heterogeneity in the relationship between sports and crime. The crime effects we detect arise almost exclusively from property offenses during the game itself, consistent with the opportunity-based mechanism identified by Yu et al. (2016). This pattern aligns more closely with a framework centered on target availability and police reallocation (Marie, 2016) than with fan-driven aggression, and it contrasts with settings such as Uruguay, Brazil, or high-stakes European matches where dense outdoor congregations, intense rivalries, and different policing strategies have been shown to elevate violent behavior (Ge et al., 2021; Munyo & Rossi, 2013). Differences in fan demographics, the more family-oriented nature of MLS audiences (Conti, 2022), and the relatively controlled in-stadium environment of NFL and MLS games at Mercedes-Benz Stadium likely further attenuate the violent-crime channel.
By documenting a case in which sporting events elevate nearby property crime without affecting violent crime, our study complements the existing literature and underscores that the criminogenic effects of sports events depend critically on the type of sport, local fan culture, and the structure of policing around the venue. Future research should investigate if the most popular sport is associated with the most crime both domestically and abroad. Future studies should also study the relationship between the demographics associated with sports fans and crime and attempt to relate sports crime to the position and level of security present at events.
Footnotes
Funding
The authors received no financial support for the research, authorship, and/or publication of this article.
Declaration of Conflicting Interests
The authors declared no potential conflicts of interest with respect to the research, authorship, and/or publication of this article.
Notes
Author Biographies
Appendix: Additional Specifications
In the appendix section, we demonstrate that our main analysis in Table 2 remains robust when subjected to alternative model specifications. In Table A1, Panel A, we estimate the effects of football home games on crime, using away games as the control group and employing OLS and Poisson models with fixed effects. In Panel B, we also analyze football home games using OLS and Poisson fixed effects models, but we change the control group to non-game days. Similarly, in Table A1, Panel C, we estimate the effects of soccer home games on crime, using away games as the control group, with OLS and Poisson models with fixed effects. Finally, in Panel D, we analyze soccer home games using OLS and Poisson fixed effects models, with non-game days as the control group. In Table A2, we account for the fact that crime patterns differ on weekends and that most games are played during this time by restricting our models to weekend days only. Panels A and B specifically analyze football and soccer home games, respectively. Across all six tables, our results are consistent with those in Table 2—only football home games have a positive impact on crimes around the stadium, with the effect being more pronounced within the zero to one-half mile radius and primarily driven by property crimes.
Note again that the parameter estimates on 1/2 mile ring, 1 mile ring, 3/2 mile ring, and 2 mile ring in columns (1) and (2) in Table A1, Panels B and D are exactly same, which is not unexpected as the number of non-game days vastly outnumbers game days in our sample, so the average change in crime in each ring relative to the control ring need not be different when studying soccer games versus football games.
When running our models using OLS, we observe that the coefficients on the 1/2 mile ring indicate no change in crime relative to the control ring. This outcome is expected because, first, the stadium in Atlanta is generally a safe location, and second, on away game days, there is less incentive for people to park their cars near the stadium mitigating the opportunities for property crime. However, this result only appears when using OLS, and the sample is known to be over-dispersed, suggesting that this result is not robust.