
Abstract
By merging fine-grained association football (soccer) ticket data with detailed weather information, we present a novel setting to test projection bias in the field. Since football fans must verify their identity for both ticket purchase and stadium entry, we are able to explore the effect of interest at the individual level. Overall, our findings suggest that intertemporal decision-making by sports consumers is indeed systematically biased. Moreover, we offer some initial evidence in line with the literature on hedonic consumption, since decision-making by women seems to be stronger affected by weather compared to men.
Introduction
Intertemporal decisions constitute a fundamental aspect of daily life. The consequences of such decisions unfold over short-, mid- and long-term periods. Examples include enrollment in retirement investment plans, the purchase of durable goods, such as cars and clothing, as well as the purchase of perishable goods, such as outdoor movie cinema tickets or tickets for watching sporting events live.
In theory, a rational individual facing an intertemporal choice problem, maximizes the expected future utility given the distribution of benefits and costs over time. In reality, however, individuals are prone to psychological biases causing their intertemporal decisions to deviate from fully rational behavior. A prominent example is projection bias introduced by Loewenstein et al. (2003), according to which individuals tend to overestimate how similar their future tastes will be to their current ones. More formally, assuming that expected utility from consumption of a given good is the linear combination of true, future utility and the utility that the individual could achieve if she was in her current state, a person with projection bias unconsciously conditions her future expected utility on her current state.
Broadly speaking, projection bias is one of the sources of error in affective forecasting (Wilson & Gilbert, 2003). Affective forecasts can concern four dimensions: valence (positive vs. negative affect), specific emotions (e.g., joy, anger), intensity (strength of the emotion), and duration (persistence of the emotion). Correction of projection bias requires awareness, motivation to adjust, and the ability to implement (Wilson & Gilbert, 2003). Gilbert et al. (2002) argue that a lack of motivation is, most likely, the critical constraint in such correction process. Individuals first imagine an event without temporal context, then evaluate their immediate hedonic response as a proxy for future affect, and only afterwards attempt to adjust for time. Because this final adjustment is cognitively demanding, it is often insufficient, leaving judgments biased toward present conditions.
Several studies exist which have tested for projection bias in the field. For instance, DellaVigna and Malmendier (2006), Acland and Levy (2015), or Garon et al. (2015) reveal that people systematically overestimate their future gym attendance. Similarly, Humphreys et al. (2015) show implications of projection bias in a general leisure time physical activity setting. Moreover, Gilbert et al. (2002) experimentally confirmed the validity of a common advice “don’t go shopping when you are hungry” – they showed that grocery shoppers indeed base their purchases on current hunger.
A particularly prevalent context in exploring projection bias is decision-making related to weather. For instance, Simonsohn (2010) shows that weather-related projection bias can affect college choice, as prospective students are more likely to choose an institution visited during gloomy weather. Conlin et al. (2007) find increased numbers of returns of cold-weather specific clothing and equipment purchased during winter conditions. Busse et al. (2015) find that convertibles purchased at particularly good weather and 4-wheelers purchased at particularly bad weather were more likely to be returned. Liao (2020) demonstrates that short-term weather fluctuations can influence decisions to install solar panels. Finally, Buchheim and Kolaska (2017) provide evidence that projection bias may explain the high rate of outdoor cinema ticket expirations among customers who purchased tickets under particularly favorable weather conditions for an outdoor screening.
We contribute to this line of research by exploring weather-related projection bias in Polish association football (soccer) ticket purchases with data that consist of precise measures at the individual level. The ticket purchase decision is inherently forward-looking: attendance or non-attendance is realized only at a later date. Consumers must therefore form expectations about future utility. Research shows that incidental affect at the time of judgment (possibly influenced by weather), can bias such expectations (Clore & Huntsinger, 2007). As such, forgoing attendance may reveal that they mistakenly estimated ex ante enjoyment of the event – which would indeed be consistent with projection bias.
In general, exploring weather effects in professional sports seems promising, because weather was found to influence attendance (see, for instance, Böheim et al., 2019; Ge et al., 2020; Serra-Burriel et al., 2024) and is inherently immune to any factors under control of leagues, clubs, or fans. Our setting appears to be particularly promising as the data we use allow – in contrast to any other study before – to precisely track each individual in the data, i.e., football fans in our setting have to verify their identity for both ticket purchase and stadium entry. In other words, this is the first study where the following desirable conditions to identify the effect of interest are jointly met. First, given some specific legal regulations, an ex- post decision (stadium entry) can be clearly attributed to the person making the initial decision (ticket purchase). Second, the exact timing of decisions in both periods can be precisely identified. Third, there are no additional costs for deciding ex post that the initial decision was a mistake. 1 Importantly, we observe these decisions multiple times for a comparably large portion of individuals. Moreover, detailed personal characteristics of individuals are known.
We integrate these detailed, individual-level purchase and attendance records with weather data, focusing on model-based atypical temperature, precipitation, and sunshine duration as exogenous factors eventually affecting decision-making. More precisely, we empirically test the influence of atypical weather conditions on transaction day on the decision to attend (or not) on match day.
Overall, our findings suggest that intertemporal decision-making by sports consumers is indeed systematically biased, i.e., warmer weather at the time of purchase decreases the likelihood of attendance, while greater precipitation and longer sunshine duration both increase it. Moreover, we offer some first evidence for gender-related heterogeneity since decision-making by women seems to be stronger affected by weather compared to men – which is in line with the more recent literature on hedonic consumption (e.g., Govind et al., 2020).
Data and Sample Selection
Data
The available data include information on ticket sales for matches of a top-tier football club in Poland, playing at the highest level of competition (Ekstraklasa). The dataset covers 34 home games played during the 2022/23 and 2023/24 seasons. During this observation window, the league consisted of 18 teams, each playing two matches against every other team (home and away) in a classical double round-robin format. The competition began in mid-July and concluded in late May. The winter break in the first season lasted from mid-November 2022 to late January 2023, and in the second season from mid-December 2023 to mid-February 2024. No pandemic-related restrictions on stadium capacity were in effect.
Our observations are at the level of individual ticket purchase transactions. While tickets were also available for purchase at the stadium, the majority of tickets were purchased online (at least 85% for each game), upon registration. Each transaction is linked to a unique ID corresponding to a ticket holder, consistent across the dataset. Each observation contains information on the transaction time, ticket characteristics (seating, seating area, discounts, ticket type, etc.), and ticket price. Additionally, for each observation we track the customer's age at the time of purchase, as well as gender, ZIP code, and possible affiliation with special groups. 2
Importantly, we obtain precise information about personal identification of fans purchasing the tickets and attending the games. In Poland, football clubs are legally required to uniquely identify buyers and attendees. Verification of identity is performed by presenting a government-issued document, such as a passport or a personal identity card. 3 Additionally, an indicator of attendance at the stadium is stored at the exact time of entry through the gates. Upon entering the stadium, both the ticket and an identity document must be presented. The accuracy and consistency of the data are verified by employees managing the entry gates. An additional security measure is the Closed-Circuit Television (CCTV) system, which allows tracking the movement of spectators within the stadium and identifying them in case of any unlawful activities. This system also enables the identification of the employee responsible for verifying the spectator's identity, thus adding some (psychological) pressure on the employees to properly verify the identity of those entering the stadium. As a result, it is virtually impossible for anyone other than the named ticket holder, presenting her identity document, to pass through the gates. Such clear identification of individuals as well as the precise timing of their actions allows us to overcome one of the most severe limitations present in previous studies.
Our individual-level data are merged with data on daily temperature, precipitation, and sunshine duration, which is sourced from the website of the Polish Institute of Meteorology and Water Management. Temperature is measured as the daily maximum temperature in degrees Celsius. Precipitation is recorded as the total daily precipitation (without distinguishing between types) and is measured in millimeters per square meter. Sunshine duration (suntime in the following) is measured as the percentage share of sunshine in minutes divided by total daylight in minutes on a given day. This approach allows for a direct comparison across days with varying daylight durations.
Moreover, information on game days and times as well as the start of ticket sales is obtained from the club's official website. Likewise, the probabilities of a home team win, draw, and loss, (expressed as betting odds) are sourced from OddsPortal.com (2024). 4 Finally, data on the outcome of the most recent match for both the home team and the away team are obtained from the official league website Ekstraklasa.org (Ekstraklasa, 2024).
Sample Selection
To facilitate the identification of the effect of interest, we impose several restrictions on the data regarding location, ticket type, individual characteristics, and games.
Consequently, our sample consists of 33 game-days (home games played across two seasons against 20 unique opponents), 460 sales-days (days when tickets were available for purchase), and 19,413 individual purchase and attendance decisions. In contrast to Buchheim and Kolaska (2017), the number of tickets sold in our setting does not decrease as the number of days before the game increases. Instead, sales tend to slightly increase both close to the game, and right after the sales period opens while a fair amount of tickets is sold between those two periods as well (see Figure 1).
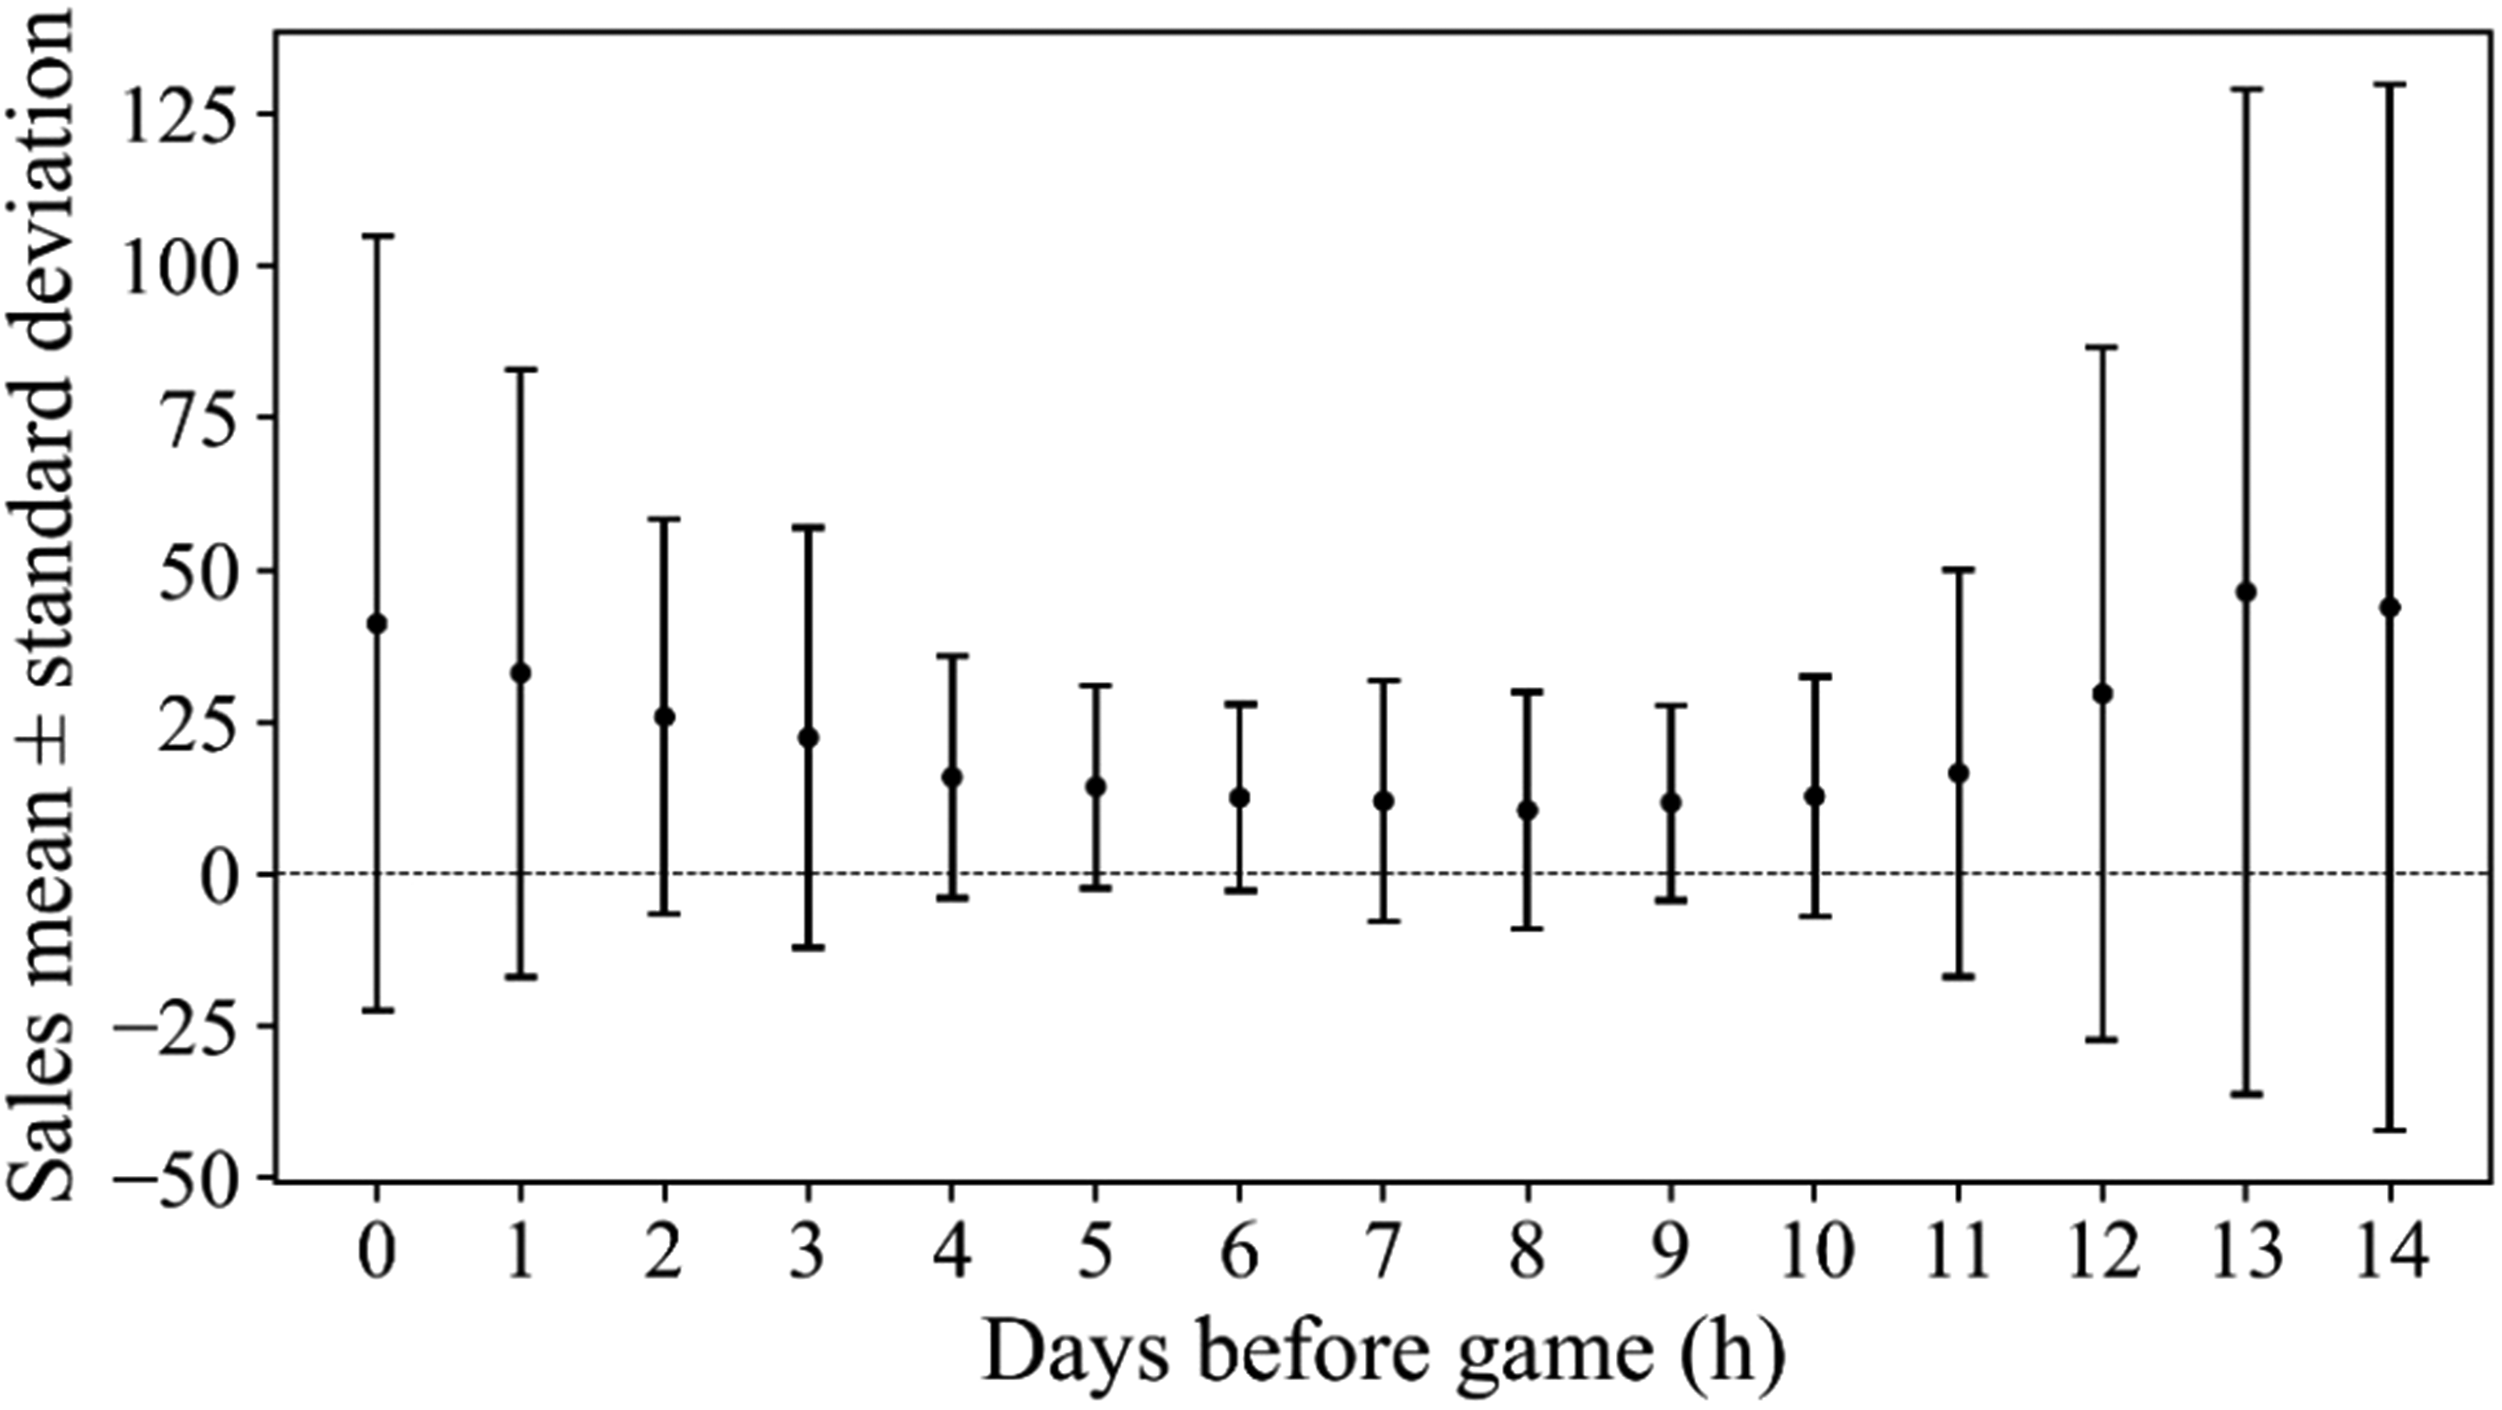
Number of days before game and tickets sold.
Methods
In this paper, we intend to explore the impact of weather during purchase on attendance decisions of individual fans. In the following we discuss how this effect may unfold via expectations by fans about anticipated weather-related game enjoyability, (traveling) comfort or opportunity costs, for instance.
One of the most important factors that distinguish our setting from the setting in Buchheim and Kolaska (2017), i.e., outdoor cinema, is that seats in the football stadium are covered by a roof in order to protect spectators from precipitation. While one might be inclined to argue that precipitation consequently should not influence attendance, Kalist (2010), Agha and Rhoads (2018) (in Ge et al., 2020), Schreyer and Däuper (2018), Valenti et al. (2024), and Serra-Burriel et al. (2024) demonstrate that this is not the case. Precipitation actually reduces attendance – most likely because of difficulties/discomfort when traveling to the stadium. Therefore, we argue that people expect less comfort while traveling to the stadium and watching a game on days with precipitation compared to dry days. The roof, however, only marginally affects how pleasant the game and transportation would be in terms of thermal comfort. As such, we expect that – at least up to some arbitrary level – temperature is positively related to attendance (Besters et al., 2019; Schreyer and Däuper, 2018; Valenti et al., 2020), as people anticipate more comfort while traveling to the stadium and watching the game in warm weather compared to cold weather. Sunshine duration, however, is expected to differ from temperature and precipitation since sunlight does not directly influence the comfort of traveling to or watching the game. As such, we argue that its effect is primarily manifested in the opportunity cost of attendance. As the sun shines, the number of opportunities for outdoor activities that are more enjoyable under clear skies than cloudy ones increases. In other words, we assume that with more suntime, people perceive a higher opportunity cost of attending the game, which is a stronger consideration than comfort in this case.
In summary, if projection bias does exist in our setting, we expect that attendance (1) decreases with unexpected warmer temperature on the purchase day, (2) increases with unexpected (more) precipitation on the purchase day, and (3) increases with unexpected (more) sunshine hours on the purchase day. It is important to note that the interpretation of purchase day weather effects, which proxy for (mis-)predicted utility of attending a game, is different from game day weather effects, which refers to the effects that actual weather has on attendance.
Atypical Weather
Climate in Poland (and the city in question) is characterized as humid continental (Beck et al., 2023). Mostly warm summers, mild winters (average temperature close to 0°C), stable precipitation over the year, without extremes, and rather cloudy skies outside of summer months are prevalent in Poland (IMGW, 2024a, 2024b), as shown in Figure2. below.
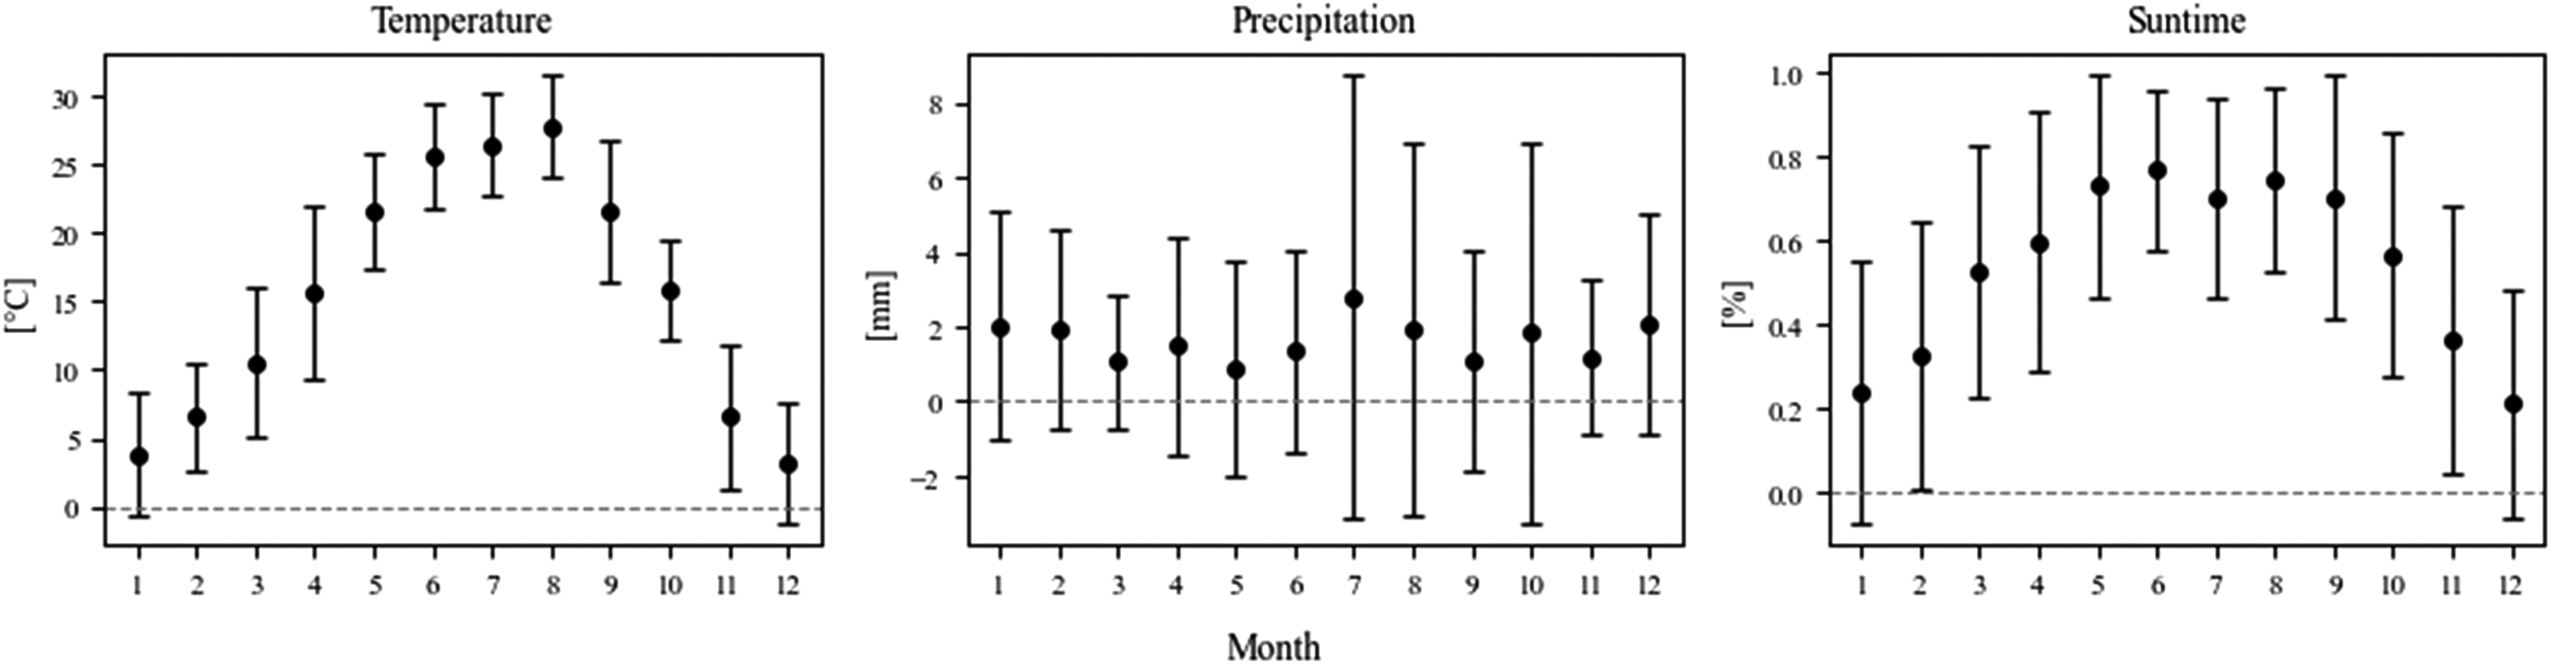
Average monthly weather in Poland.
For any analysis of weather-related behavior, we must consider that evaluations of weather are subject to the influence of reference points (Ge & Ho, 2019; Schkade & Kahneman, 1998). As noted by Wilson and Gilbert (2003), traveling to a sunny, warm destination from a gloomy and rainy place is likely to be pleasurable. However, after spending some time in the sunnier location, as the reference point shifts, even moderately worse weather may be perceived negatively. To relate weather on a given day to past conditions, we follow the approach of Buchheim and Kolaska (2017), defining atypical weather as the deviation from the game- and transaction-day horizon-specific mean for all purchases up to 21 days prior to the game day. 5
Below, we describe the data-generating process of the atypical weather variables. Let indices t represent a transaction date, g represent a game date, and h represent the difference in days between g and t. Let Dh,g be a dummy for the time difference h in days between t and g, and αg be the fixed effects for match date g. Finally, let pure weathert be the subsequent “pure” weather variables as defined in Section 2, i.e., temperature, precipitation, and daily share of suntime on day t. Then, atypical weather is represented by the residuals ɛt of the following model:

We use these residuals for further analyses to address two concerns that would arise if we were to use the “pure” weather variables instead. First, weather is seasonal. As such, weather conditions during different seasons should be treated differently. Residuals are deseasonalized. Second, due to the nature of the effect we are testing, the weather variables of interest need to be interpretable as atypically positive (more than expected) or atypically negative (less than expected). Weather residuals, by definition, fulfill this role: positive residuals from such regressions indicate higher than expected temperature, more than expected precipitation, or more than expected suntime, while negative residuals indicate lower than expected temperature, less precipitation, or less suntime.
Summary statistics of the residuals as well as the underlying “pure” weather variables are presented in Table 1. Positive outliers are evident for precipitation – indicating days marked by particularly heavy rainfall. Likewise, the distribution of suntime residuals is slightly left-skewed.
Summary Statistics for Weather.
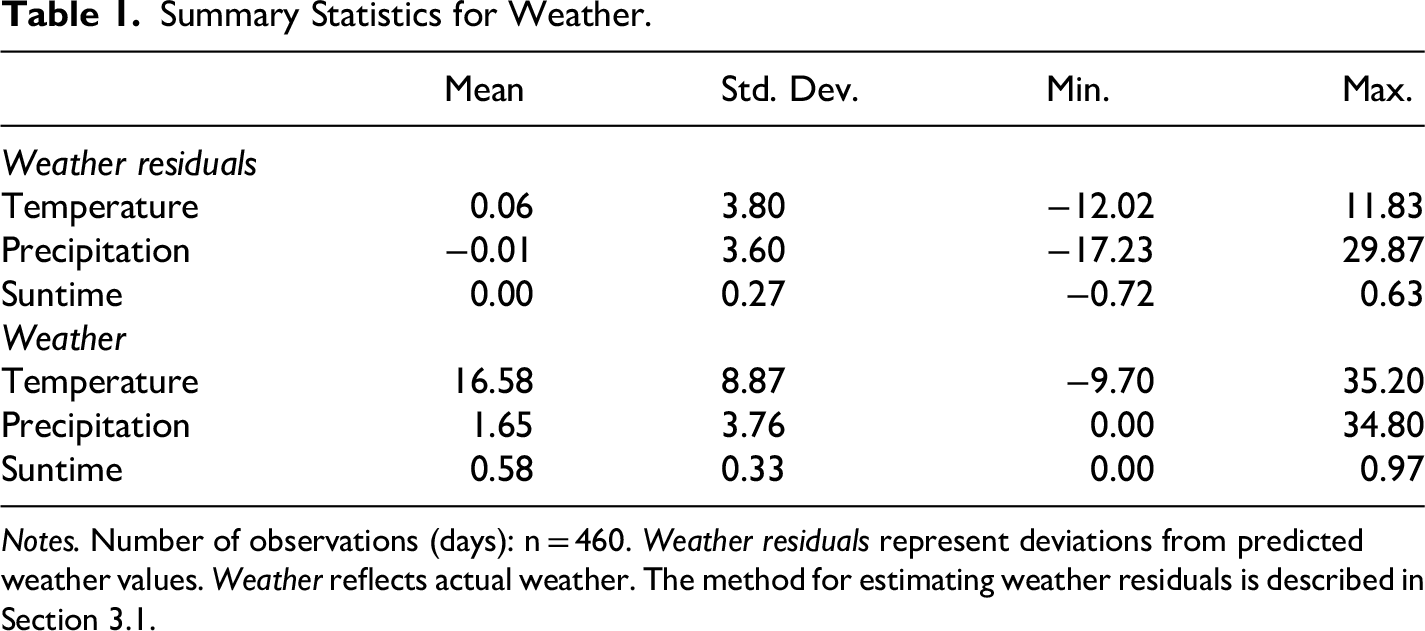
Notes. Number of observations (days): n = 460. Weather residuals represent deviations from predicted weather values. Weather reflects actual weather. The method for estimating weather residuals is described in Section 3.1.
Empirical Model
To isolate the effect of weather on transaction day t on the corresponding game g attendance decision we estimate the following model: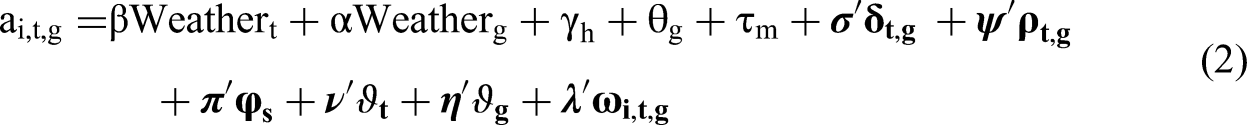
Weatherg controls for weather conditions on game day g and is constructed similarly to Weathert. Moreover, γh controls for purchase horizon fixed effects, specifically the time difference in days h between t and g, while θg and τm control for opponent and season fixed effects. In addition,
Empirical Findings
We estimate the linear probability model, as specified in Equation (2), using ordinary least squares (OLS). In the following, we begin with presenting our baseline results before discussing several robustness checks. We then present some auxiliary evidence supporting the plausibility of the assumed mechanisms before closing this section with an exploration of effect heterogeneity regarding gender.
Baseline Results
Results of our baseline specification using a sample of all transactions up to fourteen days before matchday are presented in column (1) of Table 2. Overall, our results are consistent with the predictions made in Section 3 and align with what would be anticipated by fans who exhibit projection bias. However, in contrast to Buchheim and Kolaska (2017), we find that it is temperature and precipitation rather than suntime at transaction day, that matter the most regarding the decision to attend a football game as a ticket holder. This is reflected in both the relative effect size and the precision of the estimate.
For those who purchased at the time of atypically higher temperature, we observe a lower probability of attending (and vice versa), supporting the assumed mechanism of utility overestimation due to good weather. One standard deviation increase in temperature residuals decreases the probability of attending a game by −0.35%. For those who purchased at the time of atypically more precipitation, we observe a higher probability of attending (and vice versa), supporting the assumed mechanism of utility underestimation due to bad weather. One standard deviation increase in precipitation residuals increases the probability of attending a game by 0.44%. For those who purchased at the time of atypically more suntime, we observe a higher probability of attending (and vice versa), supporting the assumed mechanism of higher opportunity cost due to sunny weather. One standard deviation increase in suntime residuals increases the probability of attending a game by 0.32%.
Weather on Transaction day and Attendance Decisions.
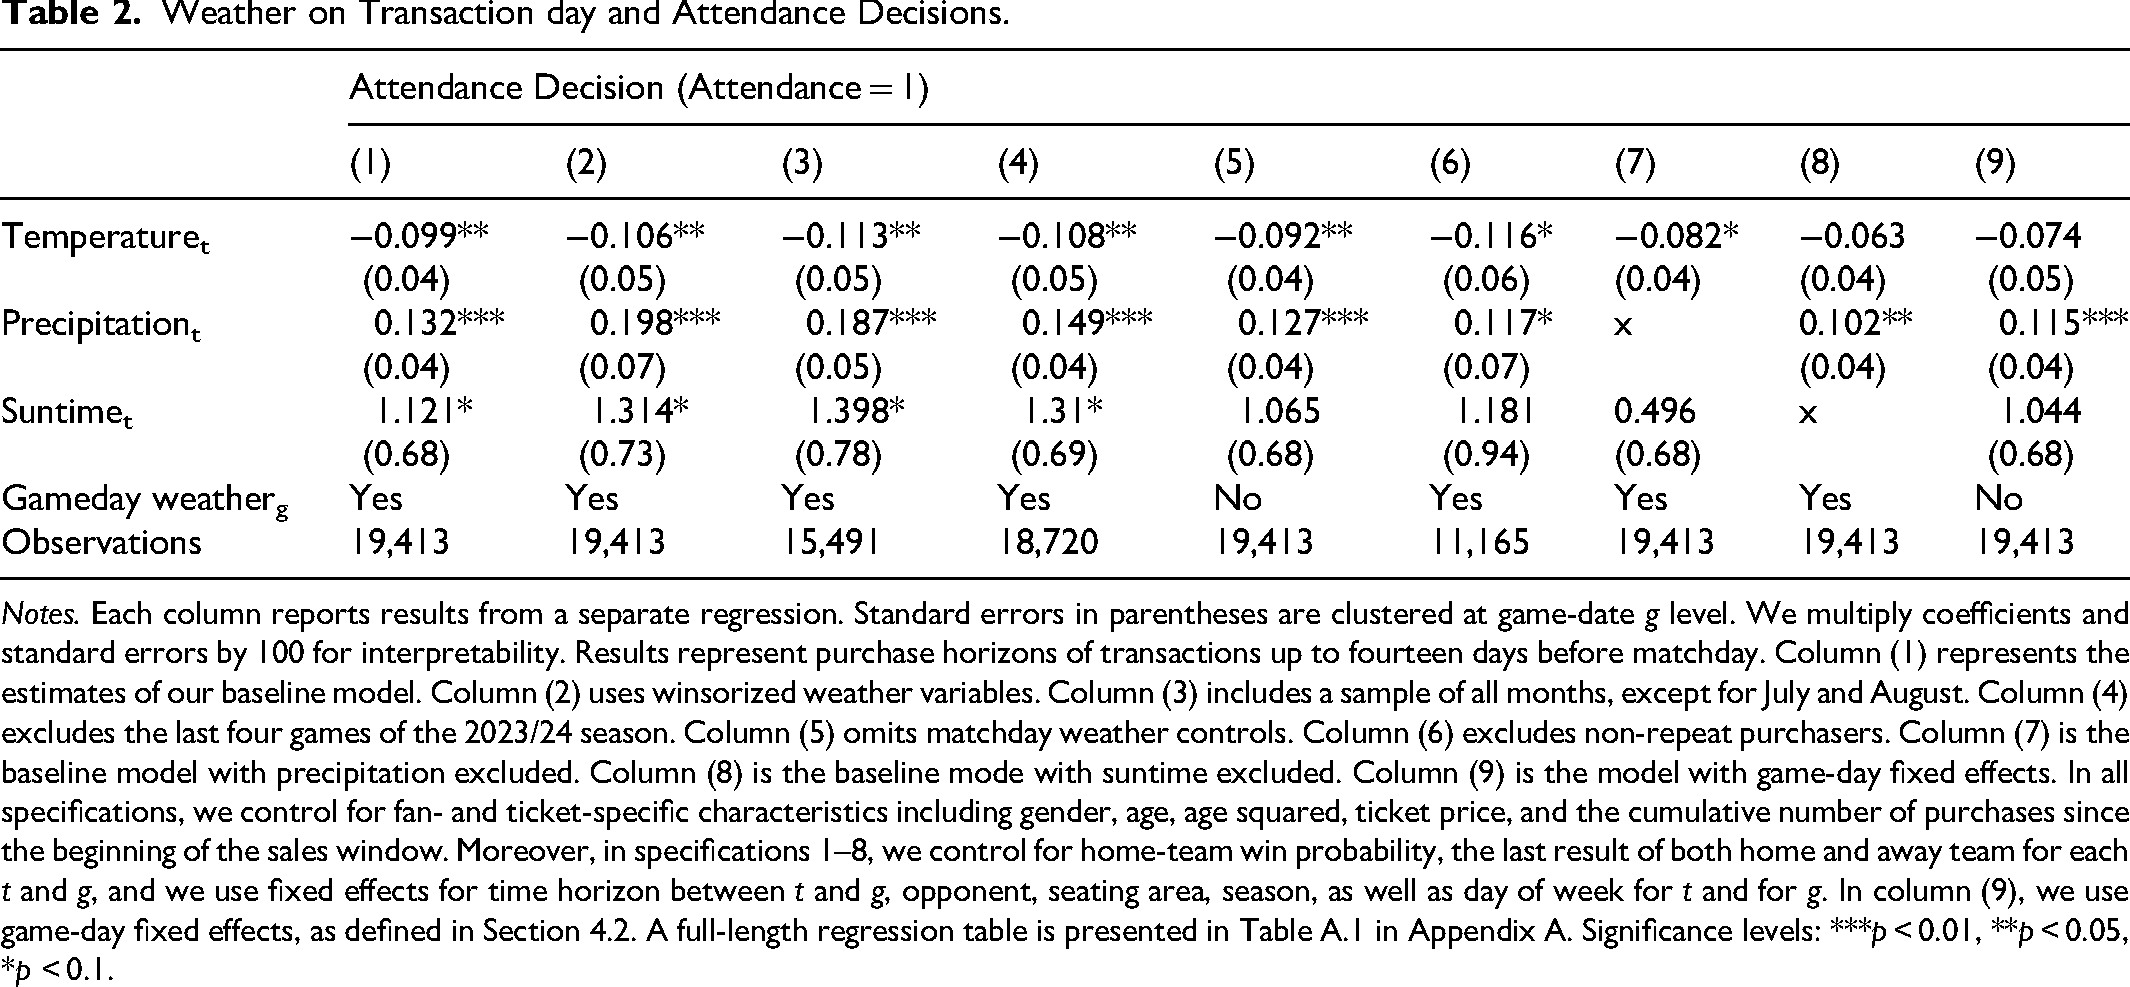
Notes. Each column reports results from a separate regression. Standard errors in parentheses are clustered at game-date g level. We multiply coefficients and standard errors by 100 for interpretability. Results represent purchase horizons of transactions up to fourteen days before matchday. Column (1) represents the estimates of our baseline model. Column (2) uses winsorized weather variables. Column (3) includes a sample of all months, except for July and August. Column (4) excludes the last four games of the 2023/24 season. Column (5) omits matchday weather controls. Column (6) excludes non-repeat purchasers. Column (7) is the baseline model with precipitation excluded. Column (8) is the baseline mode with suntime excluded. Column (9) is the model with game-day fixed effects. In all specifications, we control for fan- and ticket-specific characteristics including gender, age, age squared, ticket price, and the cumulative number of purchases since the beginning of the sales window. Moreover, in specifications 1–8, we control for home-team win probability, the last result of both home and away team for each t and g, and we use fixed effects for time horizon between t and g, opponent, seating area, season, as well as day of week for t and for g. In column (9), we use game-day fixed effects, as defined in Section 4.2. A full-length regression table is presented in Table A.1 in Appendix A. Significance levels: ***p < 0.01, **p < 0.05, *p < 0.1.
Figure 3 provides a visual representation for estimates of the model from Equation (2). Each bar displays the coefficients and confidence intervals of weather variables for estimations in which the purchase horizon γh is limited to h, ranging subsequently from maximum 4 to 14. The effects for h ≤ 14 correspond to the coefficients in column (1) in Table 2. Overall, we find that both the size and precision of the effects increase with the increasing purchase horizon h. While we cannot relate this observation to any temporal dynamics here – due to sample size issues for smaller purchase horizons – it is notable that the effects we find seem to converge when considering h ≥ 8 for precipitation and h ≥ 10 for temperature and suntime.
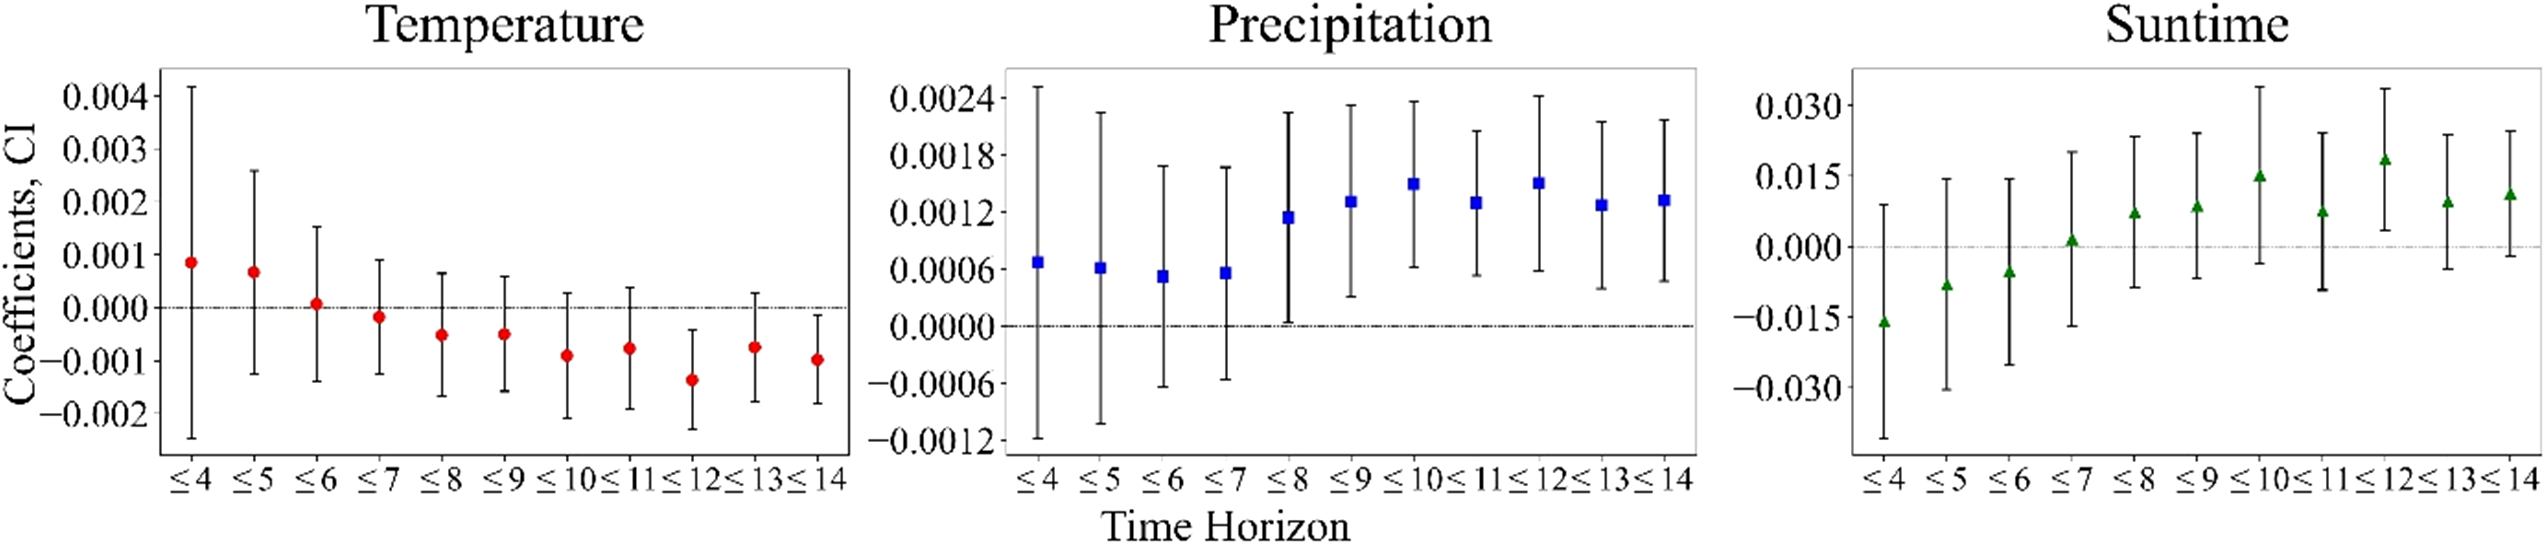
Visual representation for estimations with different purchase horizons.
Robustness Checks
There are plenty of reasons that may prevent a ticket holder from attending the game including, for instance, sickness, a broken car, or else. While it is virtually impossible to control for all these issues, they are not of particular concern for our analysis. First, by using purchase horizon fixed effects, we account for the fact that the likelihood of such events increases with increasing time between transaction day t and game day g. Second and more importantly, weather residuals are independent of such incidents.
Still, however, other concerns may arise that could threaten our general findings from the baseline model. In the following we address the issues of outliers, summer break, high demand games, temporal spillovers, a lack of experience, and correlation between precipitation and suntime.
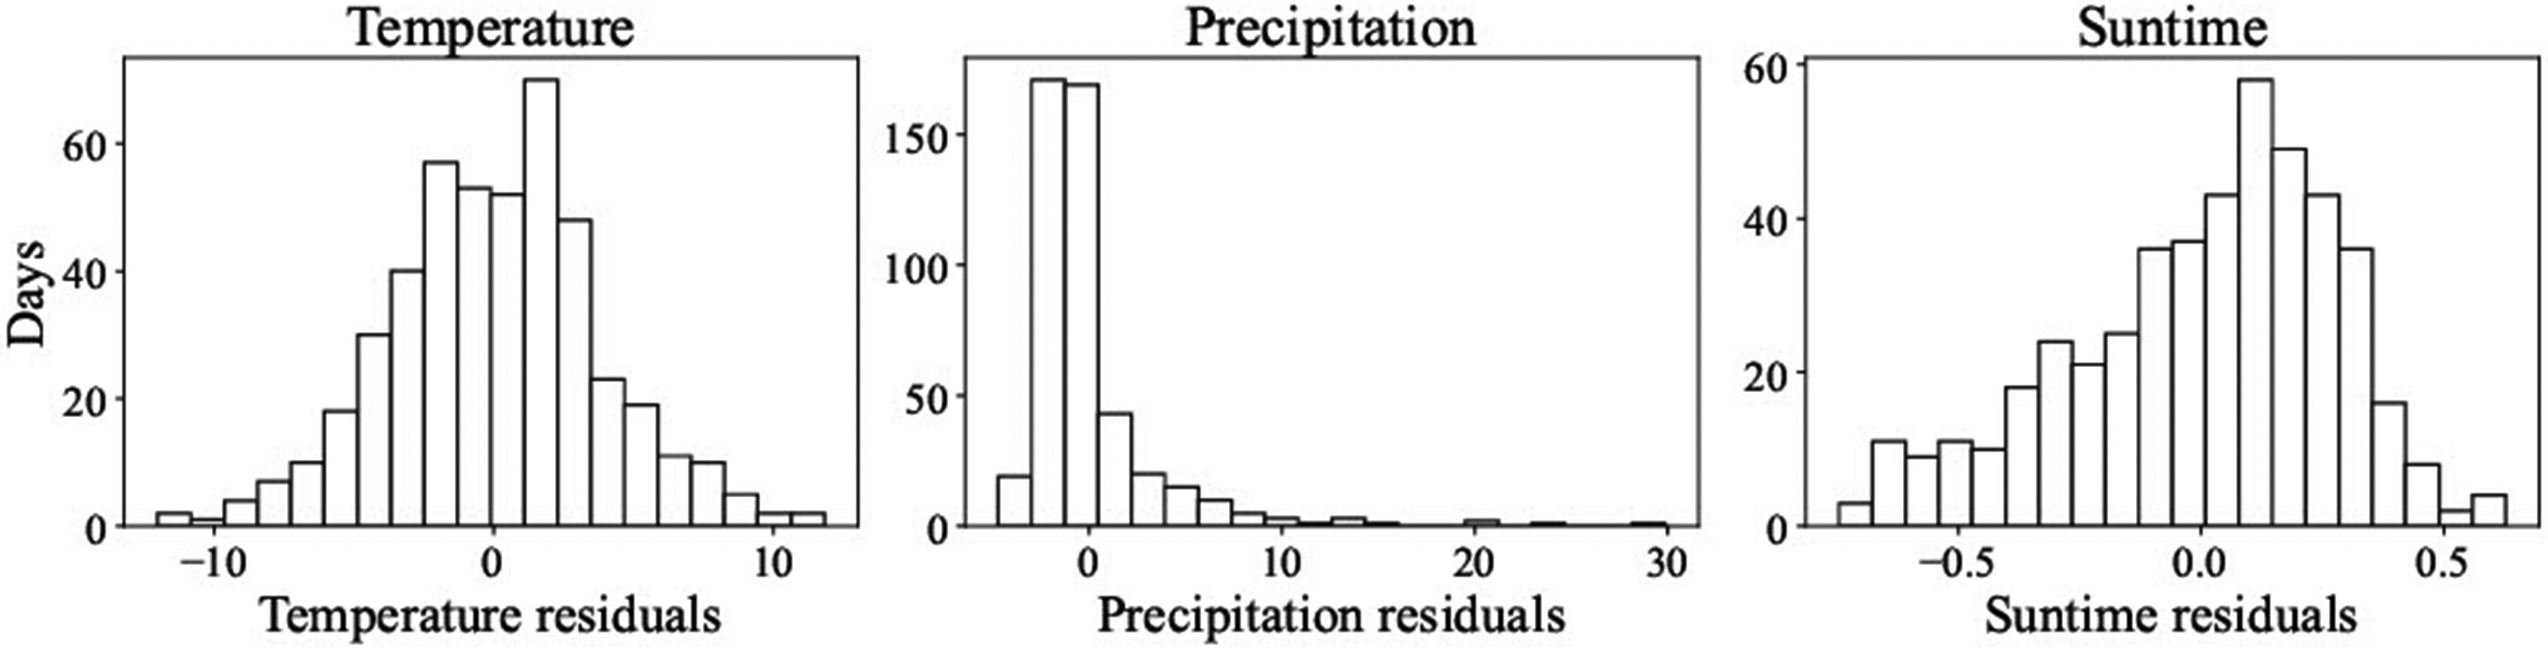
Weather residuals.

By definition, the closer Δwt,g is to zero, the more similar is atypical weather on a given pair of days t and g. As can be seen in Figure 5, there exists a significant number of such pairs of days, for which atypical weather is similar (though not necessarily identical), raising question about the role of serial correlation in driving the effects of interest. To address this concern, we re-estimate the model without match-day weather variables (the results are presented in column (5) in Table 2). Overall, our main findings hold, suggesting that they are not driven by pairs of days with similar weather conditions.
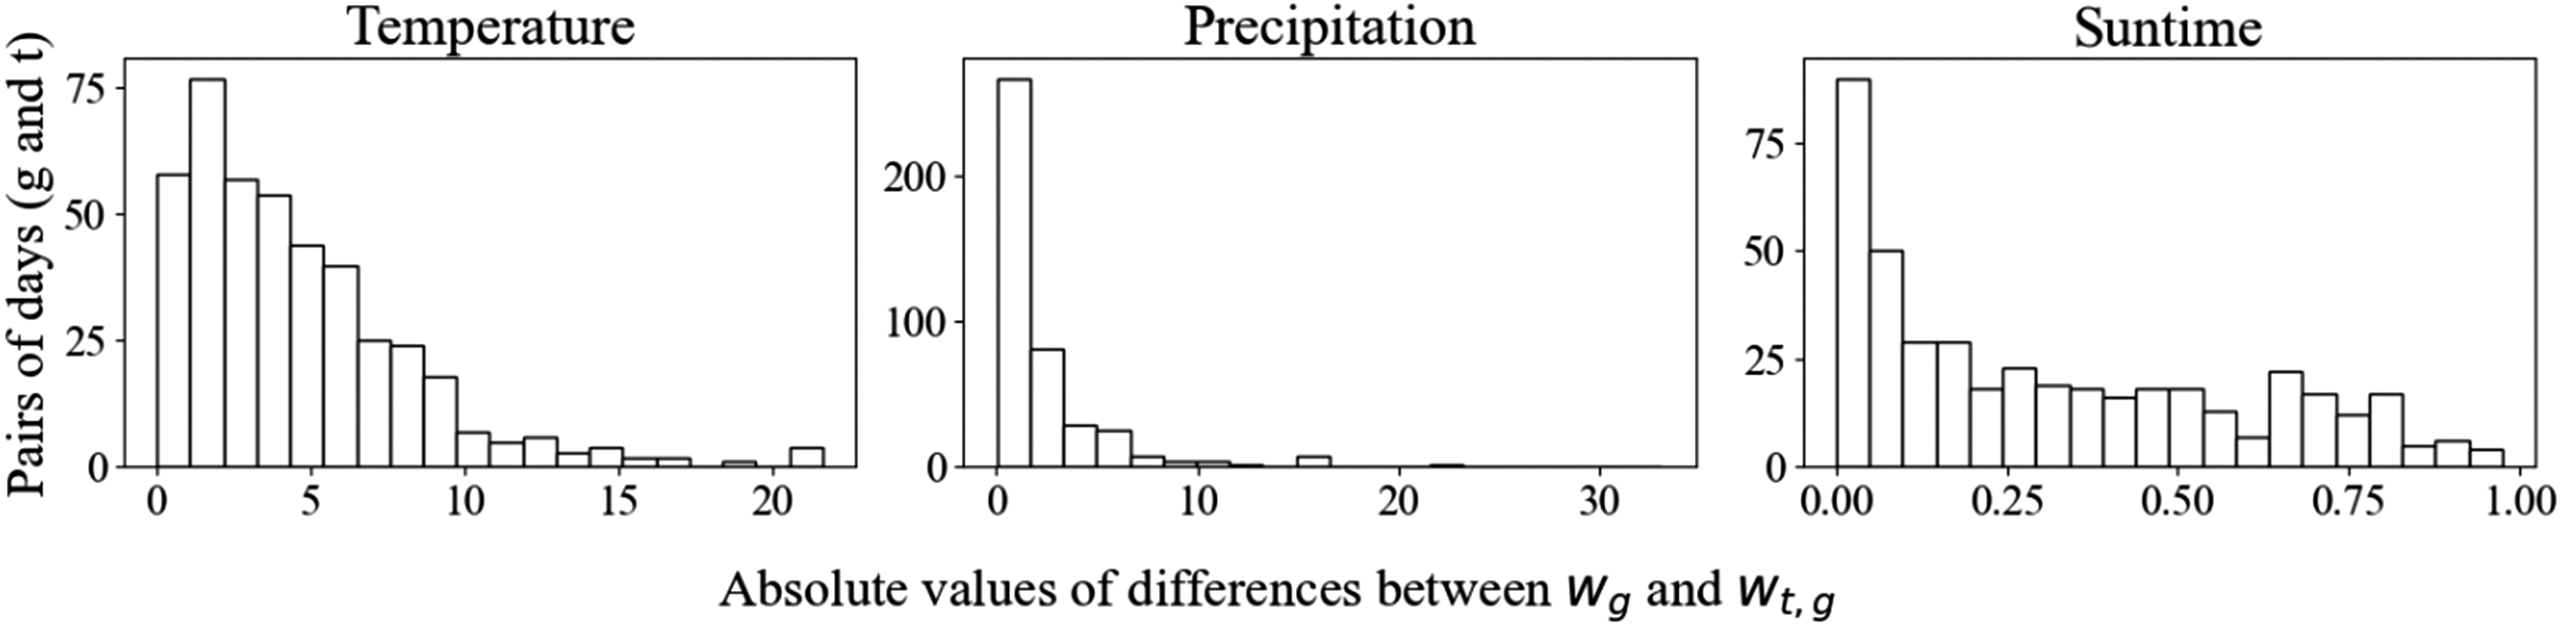
Weather similarity.
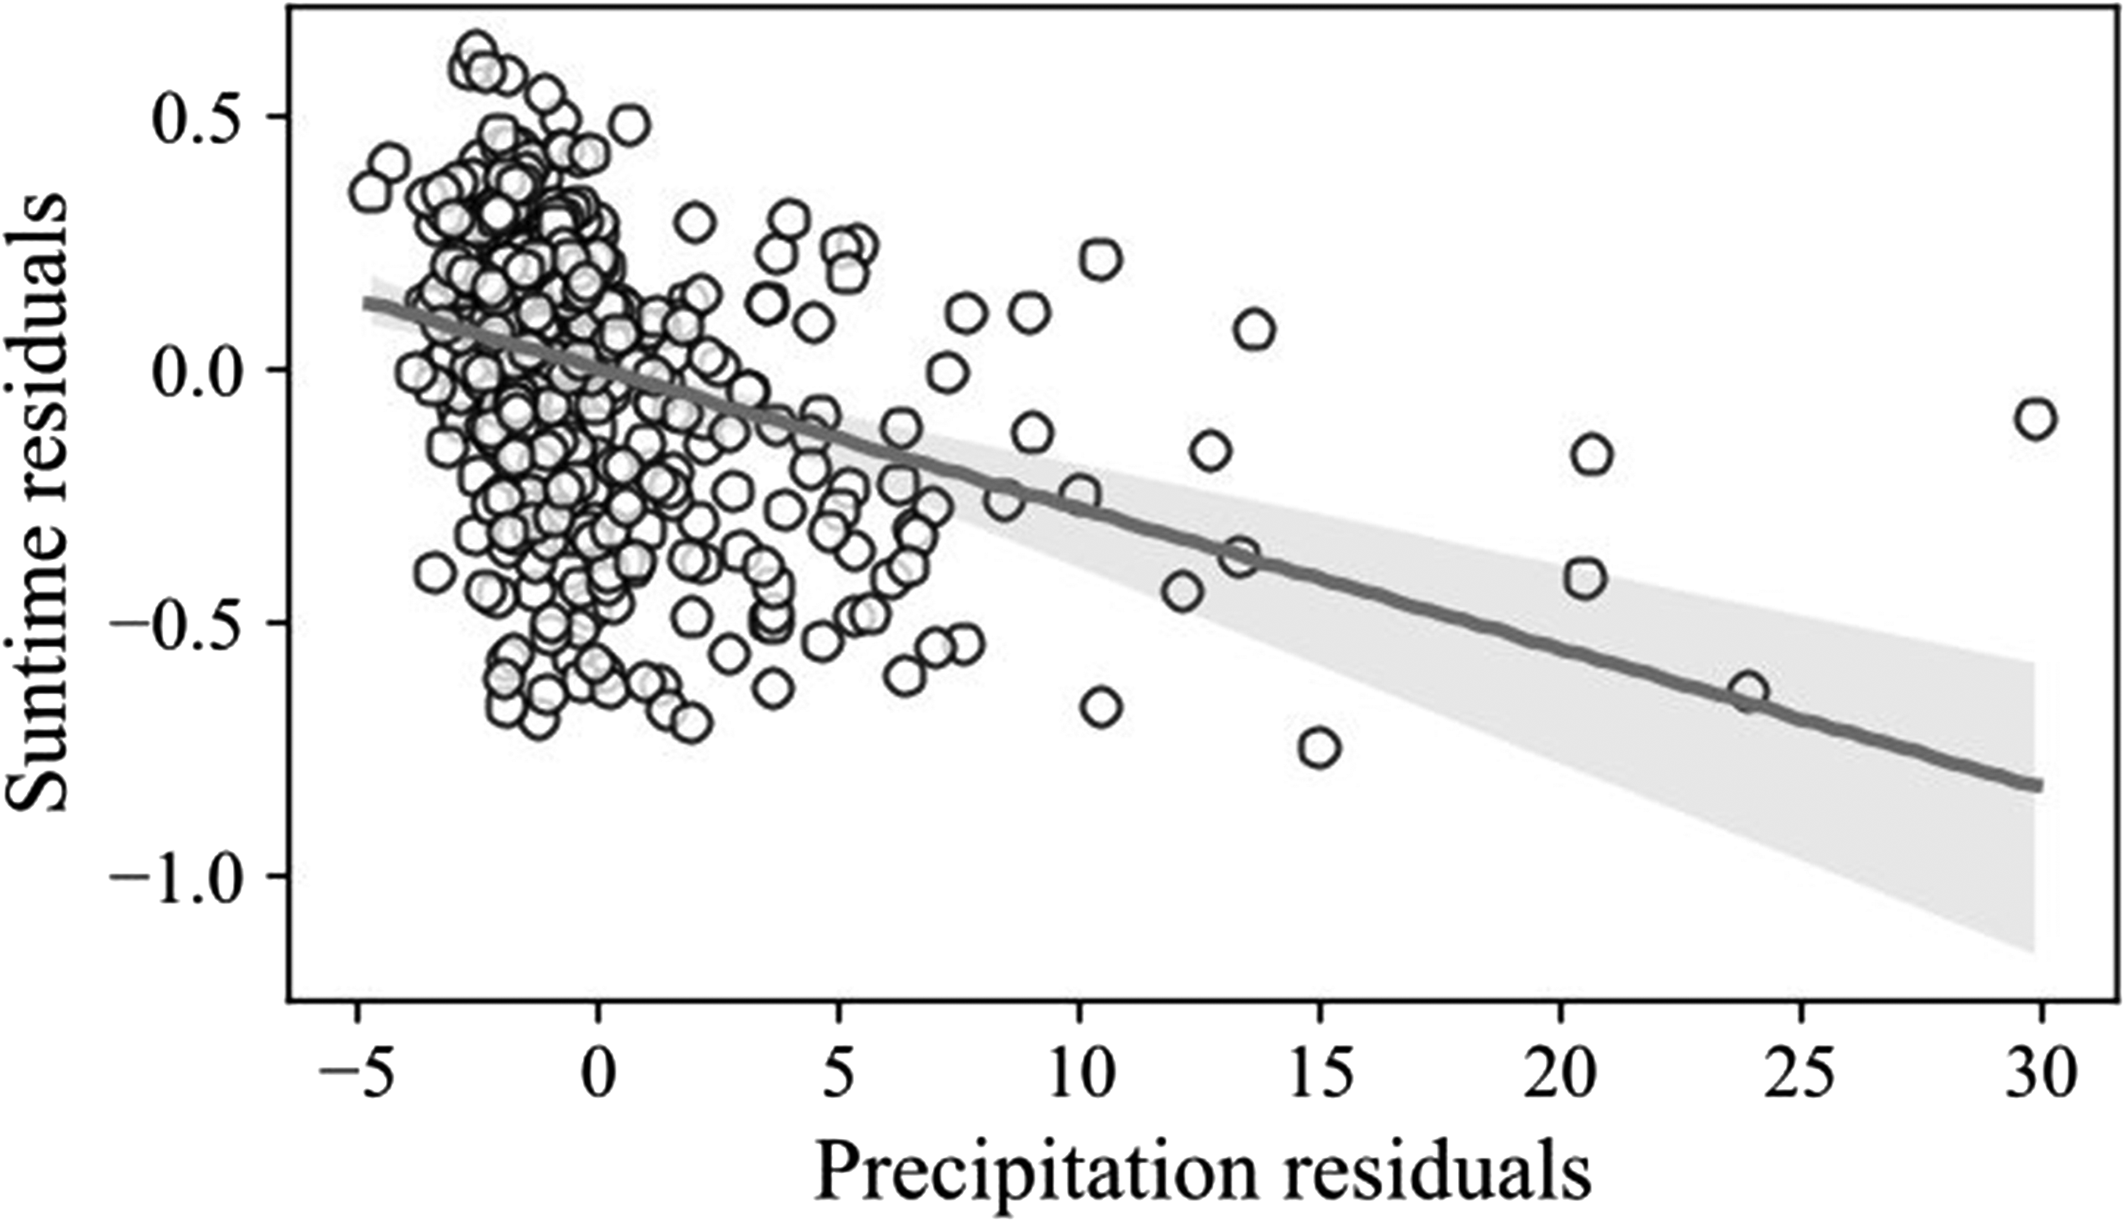
Correlation of suntime and precipitation residuals.
Nevertheless, we re-estimate our model excluding residuals of precipitation or suntime. Overall, we observe similar results compared to our baseline model for temperature and precipitation (see column (8) in Table 2), but the effect for suntime is much reduced and less precise (see column (7) in Table 2).
Is Projection Bias a Plausible Mechanism?
Despite the theoretical arguments provided before, a particular concern might be that our classification of “comfort” (temperature, precipitation) versus “opportunity cost” (suntime) mechanisms is arbitrary. In order to further support this classification, we provide some auxiliary empirical evidence in the following. For any ticket holder who decides to go to the stadium, the utility of attending is higher than the potential disutility from traveling to and sitting in the stadium during possibly unfavorable weather. We assume that if fans decide to attend a game, they decide well in advance and arrive at the stadium at a time they feel is appropriate to avoid being late for the kick-off. Since the time needed to queue, find a seat, and perhaps purchase some food or drinks is independent of the weather, we do not expect any clear relation between arrival time and any of the comfort-related variables on game day g. Suntime, however, is expected to make spending time outside the stadium before a game starts “more precious”, thus supporting the opportunity cost argument regarding the suntime mechanism. In other words, during sunny weather, fans may decide to spend time outside the stadium premises before the game, which could result in arriving comparatively late at the stadium.
Figure 7 displays the relationships between arrival time at the stadium for game g and weather variables. Overall, arrival time patterns in relation to weather seem to confirm the classification made before. For both temperature and precipitation, we do not observe any distinct patterns in stadium entry timing. For suntime, however, we see a clear pattern: as the weather becomes sunnier, fans arrive at the stadium closer to game time. While the validity of this simple test is certainly limited, as (amongst others) it lacks additional controls, it further supports the classification of our weather variables.
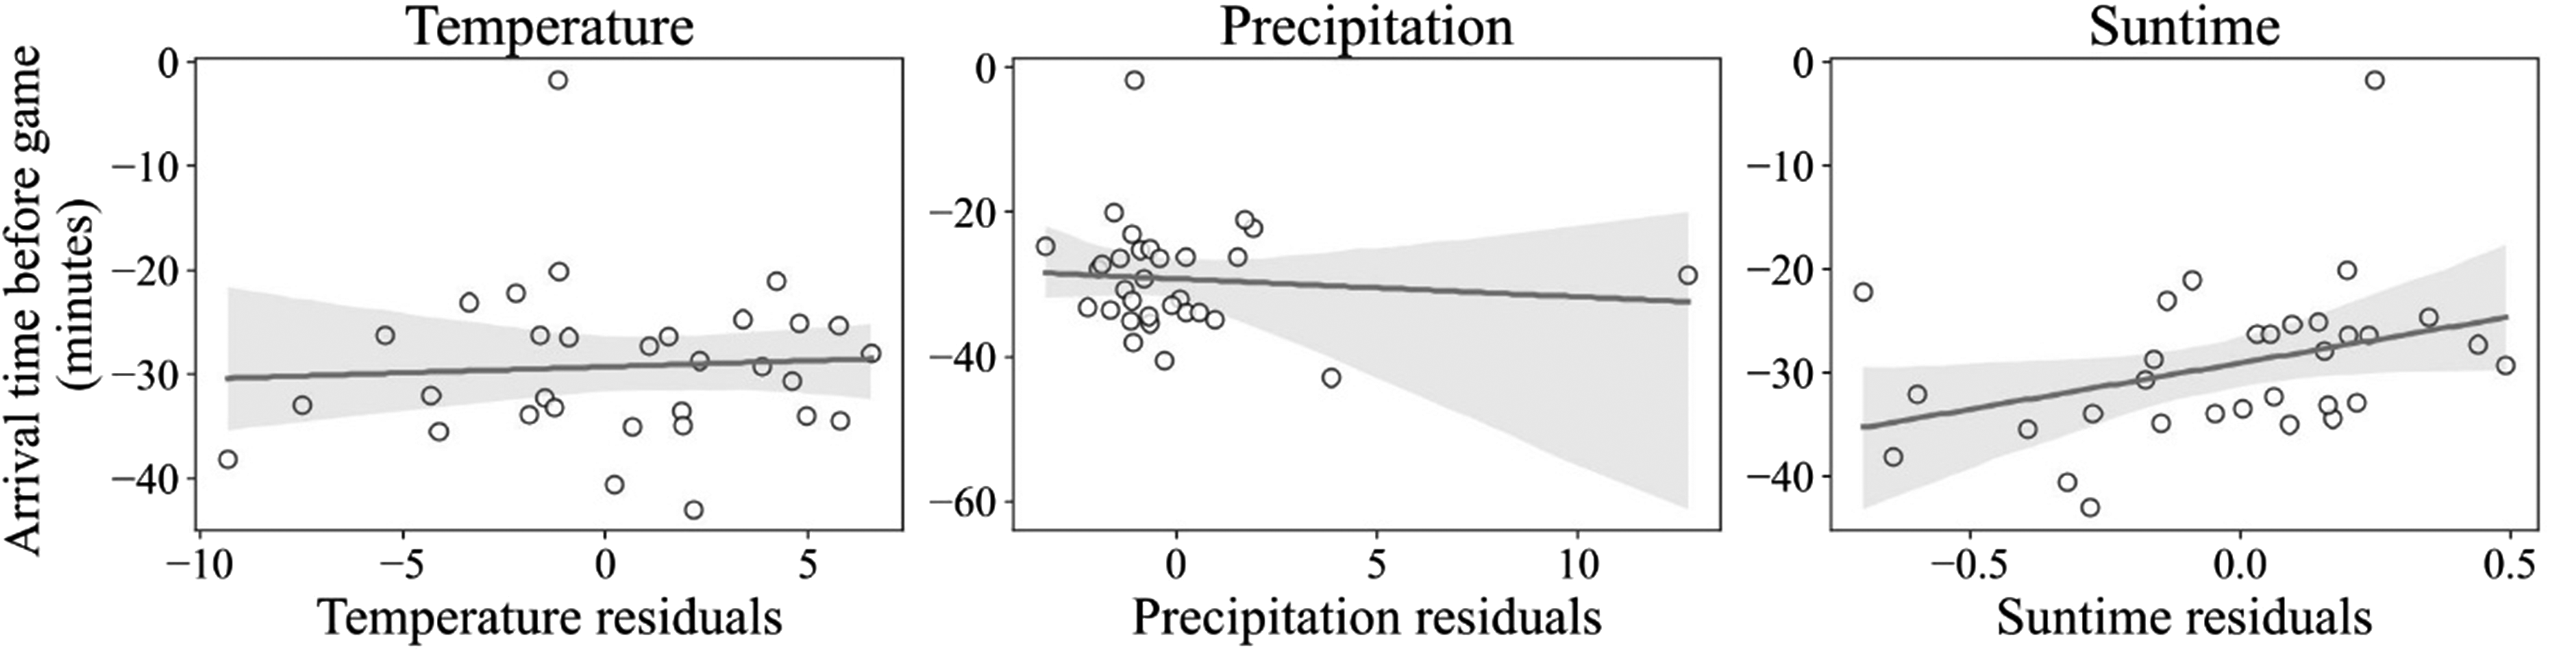
Arrival time at the stadium by weather residuals.
A further, more direct test is to explore if weather on transaction day t influences ticket purchases on that day. The intuition behind this test is that if extraordinary good/bad weather on transaction day t influences attendance in the stadium on day g, we should observe already in t comparably higher/lower numbers in ticket sales. More precisely, we would expect higher sales numbers when the purchase takes place on a day with atypically higher temperature, atypically less precipitation, and/or atypically less suntime. Unfortunately, for this test we cannot exploit the data at the individual level because we only observe an indicator of purchase for fan i on day t. As such, we simply define yt,g,s as a variable encoding total purchases of tickets on transaction day t, for a game on game-day g made for a section (seating area) in a stadium s and estimate the following model:
8

Results for the baseline specification are presented in column (1) in Table 3. Overall, the direction of our estimates aligns with our expectations, indicating that customers generally prefer watching games when it is warm, dry, and cloudy. Alternative specifications yield similar results. First, winsorizing weather variables at the 5th and 95th percentiles does not change the direction of effects but improves precision for temperature and increases effect size of precipitation (see column (2)). Second, excluding observations from July and August reduces effect size and precision (see column (3)). Third, excluding the last four games of the 2023/24 season (see column (4)) or all the days in which no tickets were sold (see column (5)) increases precision for temperature, reinforcing its positive effect on sales, while other variables remain largely unaffected. Finally, excluding residuals of precipitation (see column (6)) or suntime (see column (7)) does not change the results compared to the baseline specification. In summary, while the signs of weather effects on sales are generally in line with our variable classifications, their magnitude and precision are sensitive to sample composition and specific exclusions.
Weather on Transaction day and Ticket Purchases.
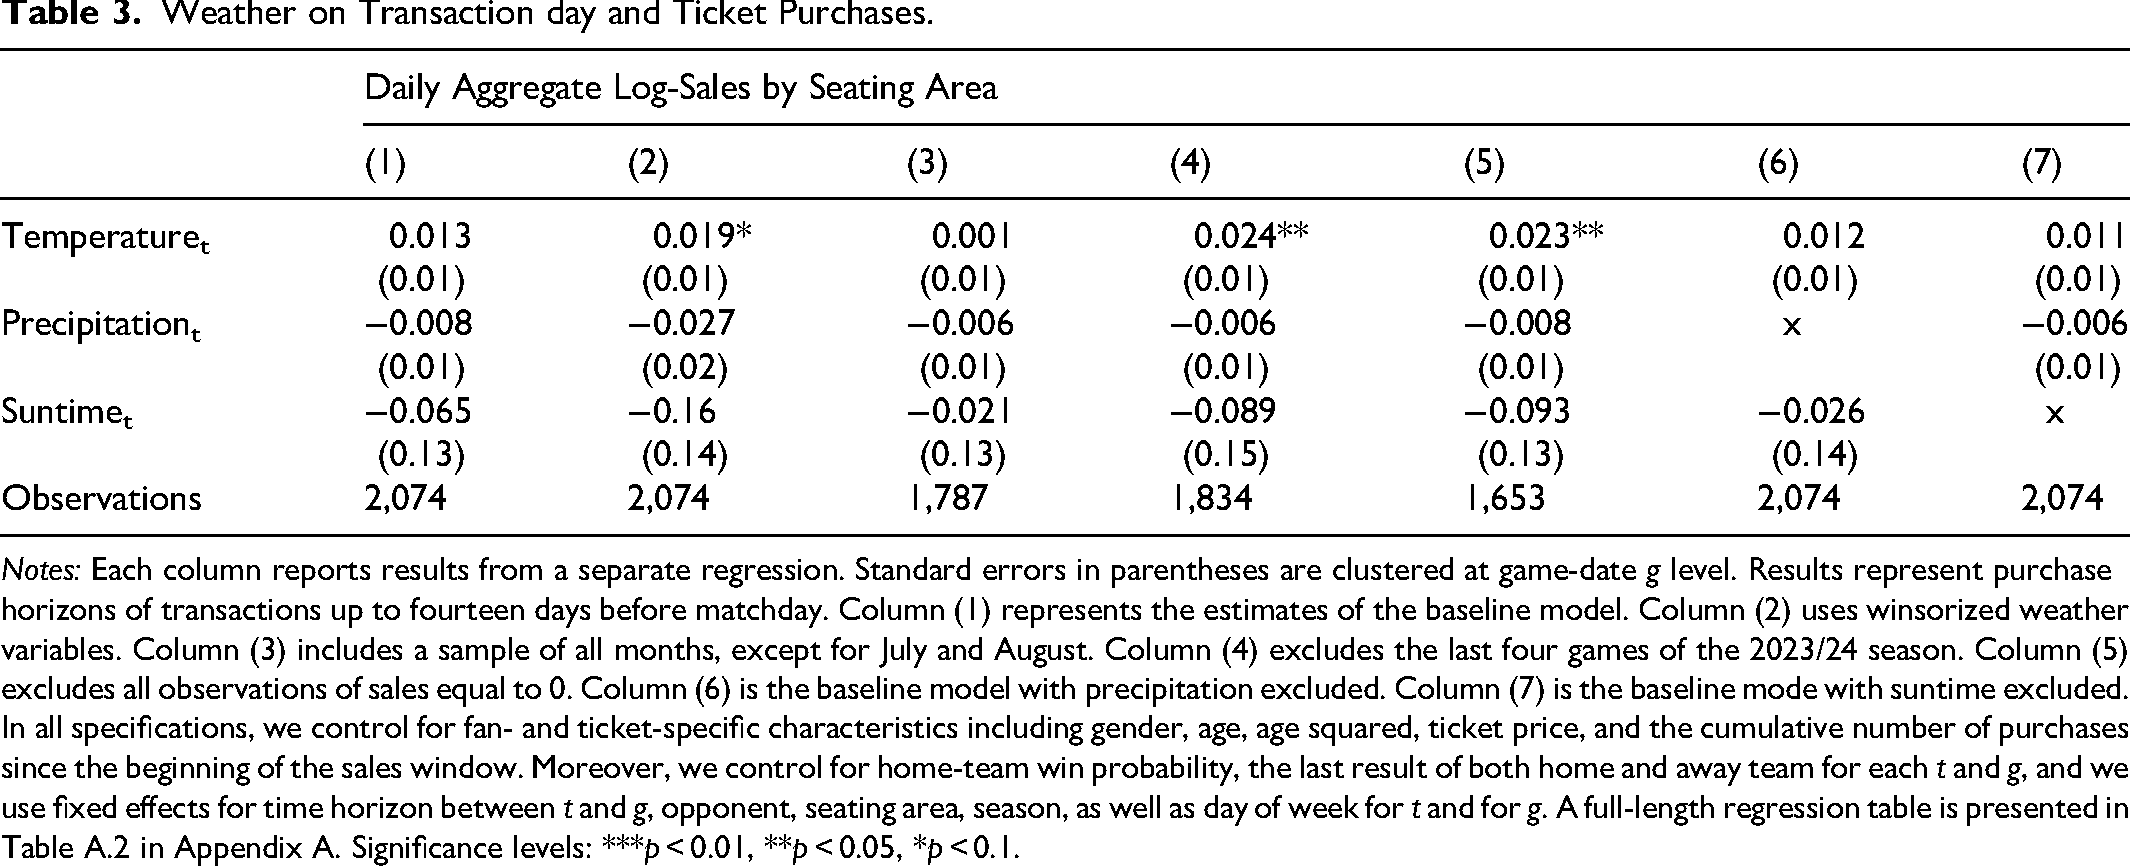
Notes: Each column reports results from a separate regression. Standard errors in parentheses are clustered at game-date g level. Results represent purchase horizons of transactions up to fourteen days before matchday. Column (1) represents the estimates of the baseline model. Column (2) uses winsorized weather variables. Column (3) includes a sample of all months, except for July and August. Column (4) excludes the last four games of the 2023/24 season. Column (5) excludes all observations of sales equal to 0. Column (6) is the baseline model with precipitation excluded. Column (7) is the baseline mode with suntime excluded. In all specifications, we control for fan- and ticket-specific characteristics including gender, age, age squared, ticket price, and the cumulative number of purchases since the beginning of the sales window. Moreover, we control for home-team win probability, the last result of both home and away team for each t and g, and we use fixed effects for time horizon between t and g, opponent, seating area, season, as well as day of week for t and for g. A full-length regression table is presented in Table A.2 in Appendix A. Significance levels: ***p < 0.01, **p < 0.05, *p < 0.1.
Finally, affect is known to mediate the relationship between weather and hedonic consumption (Govind et al., 2020), as well as between weather and consumer spending (Murray et al., 2010). Similarly, Li et al. (2017) show that people respond more favorably to promotions in good weather and propose mood as potential mediator. As such, some people may simply have a higher probability of purchasing a ticket if they are in a good mood due to favorable weather. Theoretically, such a direct weather-induced mood effect on the purchase decision differs from projection bias. While the former concerns only the current emotional state, the latter involves both the current state and expectations about the future.
In our setting, such a direct weather-induced mood effect would be in line with more (less) purchases on atypically warm and sunny (rainy) days. Likewise, the probability of attending would be higher (lower) when purchase took place on atypically rainy (warm and sunny) days. In fact, the effects we find for both precipitation and temperature are in line with this interpretation. In contrast, however, the effects we find for suntime indicate the opposite.
Exploring Effect Heterogeneity Regarding Gender
In order to explore effect heterogeneity regarding gender, we estimate Equation (2) using subsamples of males and females. Gender is decoded from the Polish personal identity number (PESEL), which currently provides two encoding options. As such there's no risk of misreporting by customers. The results are reported in Table 4. Overall, we observe effects that are consistent with the baseline model. Looking at effects sizes, a women's decision-making seems to be driven by weather much stronger compared to men. This observation is in line with findings of Govind et al. (2020), who find that women's (hedonic) consumption is affected by weather more than men's. Importantly, however, due to a considerably smaller sample size, results for women are much less precise than for men. As a consequence, we can only reasonably assume that gender effects seem to differ regarding precipitation.
Weather on Transaction day and Attendance Decisions by Gender.
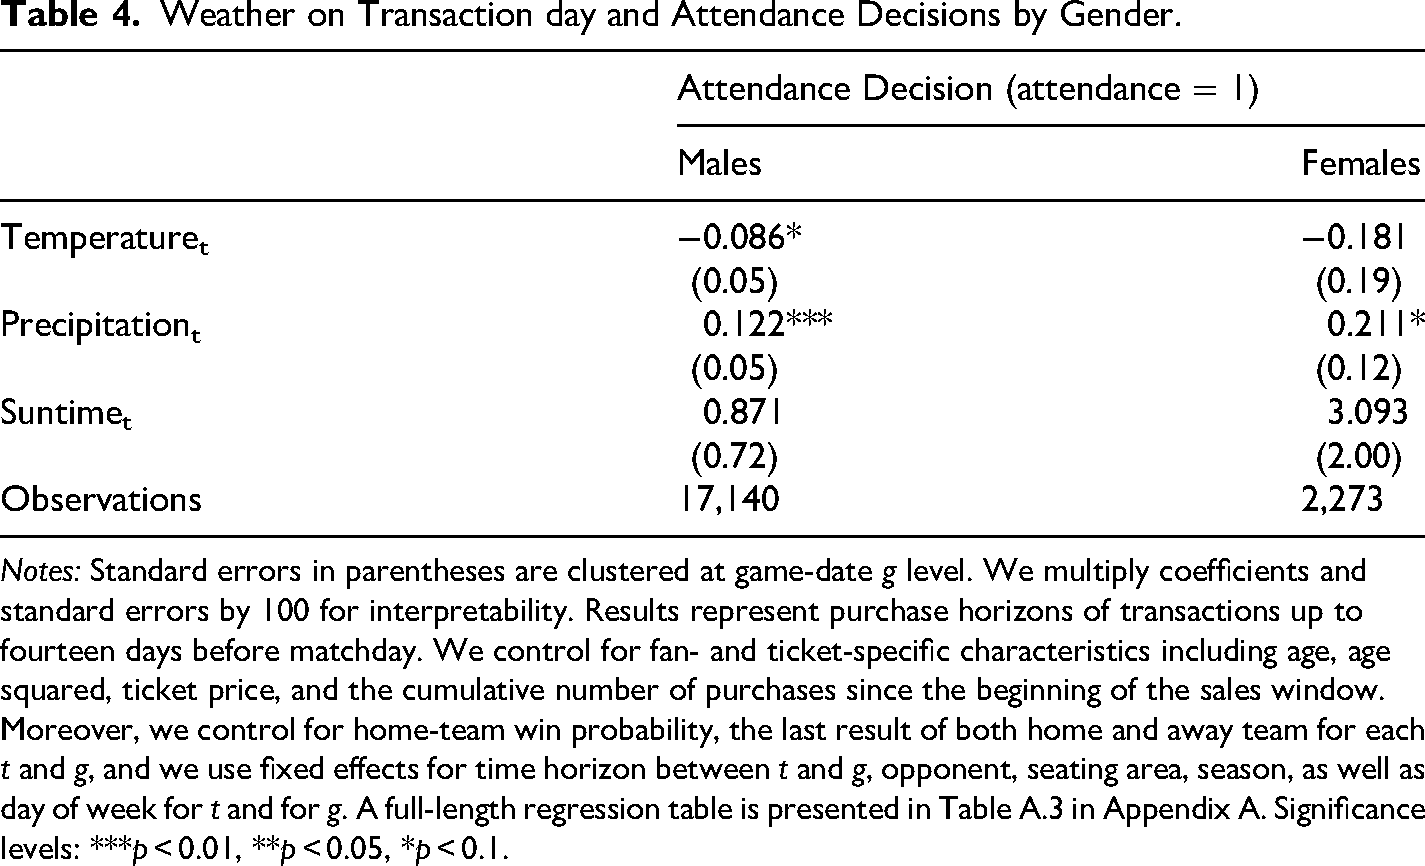
Notes: Standard errors in parentheses are clustered at game-date g level. We multiply coefficients and standard errors by 100 for interpretability. Results represent purchase horizons of transactions up to fourteen days before matchday. We control for fan- and ticket-specific characteristics including age, age squared, ticket price, and the cumulative number of purchases since the beginning of the sales window. Moreover, we control for home-team win probability, the last result of both home and away team for each t and g, and we use fixed effects for time horizon between t and g, opponent, seating area, season, as well as day of week for t and for g. A full-length regression table is presented in Table A.3 in Appendix A. Significance levels: ***p < 0.01, **p < 0.05, *p < 0.1.
Conclusion
In this study, we explored weather-induced projection bias in the context of football tickets purchases and game attendance, focusing on how atypical weather at the time of ticket purchase affects subsequent attendance decisions. We build on previous literature and use a very unique setting that enables us to clearly identify decisions in both periods for all the individuals in the dataset. Overall, our findings suggest that fans systematically mispredict the future utility of attending a game. Particularly regarding atypical temperature and atypical precipitation sport consumer behavior seems to be in line with projection bias. While we are unable – like previous studies on this topic – to fully disentangle projection bias from direct weather-induced mood effects for all measures, we provide some first evidence in the literature, that woman may be more affected by weather than man. This is in line with the more recent literature on hedonic consumption (e.g., Govind et al., 2020).
Next to this more general contribution to the literature exploring behavioral biases in intertemporal decision-making, these insights could be valuable for managers in sport clubs and other event organizers in designing ticketing strategies that mitigate (or exploit) customers’ projection bias. While this study focused on weather as a factor that can cause fans to err in their forecasts, future research could explore other factors influencing such behavior. Likewise, exploring settings where direct weather-induced mood effects can be better disentangled from projection bias seems promising.
Footnotes
Acknowledgments
A previous version of the paper was presented at the Sports Economics Research Seminar in Tübingen (2023 and 2024), the European Sport Economics Association Conference in Rotterdam (2024) as well as the Football & Finance Conference in Duisburg (2025). We thank participants as well as Alex Krumer and Mario Lackner for their helpful comments and suggestions. Moreover, we thank the editor, Dennis Coates, as well as two anonymous reviewers for their guidance and help in improving the manuscript. AIbased tools (ChatGPT, Open AI; Claude, Anthropic) were used to support code development. The authors take full responsibility for the final code and analysis. The authors do not have a financial interest in the topic of this paper and there are no conflicts of interest. All errors are our own.
Funding
The authors received no financial support for the research, authorship, and/or publication of this article.
Declaration of Conflicting Interests
The authors declared no potential conflicts of interest with respect to the research, authorship, and/or publication of this article.