
Abstract
The announcement of South Africa as the 2010 host of the FIFA World Cup in 2004 was a triumphant moment for the country and the African continent. It marked the first time in FIFA's history that the World Cup would be hosted by an African country. We use synthetic control method to create counterfactual South Africa without the World Cup and compare it with actual South Africa to analyse the impact of this tournament. Our results show that although hosting the world cup games in 2010 had no positive effects on GDP it significantly increased tourism inflows. We however find evidence that GDP did increase during the period after announcing that South Africa would host the tournament to a year before the tournament. This suggests that the analysis of these events should focus on both the year the event is held as well as the period immediately after host announcement.
Introduction
In 2004, the International Federation of Association Football (FIFA) selected South Africa to host the 2010 Soccer World Cup. It was the first time this mega sporting event was held in Africa since its inauguration in 1930. This achievement followed the country's successful hosting of the 1995 Rugby World Cup and the 1996 Africa Cup of Nations, events which were both won by South African teams. It also came after the country co-hosted, with Zimbabwe and Kenya, the 2003 International Cricket Council (ICC) Cricket World Cup. The country's experience in hosting big sporting events also partly contributed to South Africa winning the vote to host the biggest sporting event in the world. The FIFA World Cup has a huge global reach with a membership coming from 211 countries and territories across six continents 1 (FIFA, 2025), with immense viewership thus providing unparalleled global visibility.
Winning the bid to host the FIFA World Cup did not come cheap for South Africa. It required the country to invest in new infrastructure, upgrade old infrastructure, strengthen security, and improve the logistics systems. FIFA requires the host country to have at least 12 modern stadiums dispersed in several host cities. The main stadium needs to have a seating capacity of 80,000 people while the rest are required to be capable of hosting 40,000 spectators (FIFA, 2011). To meet this requirement, South Africa, refurbished five existing stadiums and constructed five new stadiums scattered in nine host cities in the country (Humprey & Fraser, 2016). In addition to many road upgrades across the country, the Gautrain rapid rail system was also built with the first phase opened in 2010, the same year as the new King Shaka International airport, located in KwaZulu Natal province.
The 2010 FIFA World Cup is estimated to have cost South Africa about $3.9 billion in expenses with at least $1.3 billion allocated to stadium construction (Baade & Matheson, 2012; Saunders, 2011; Voigt, 2010). Additional government expenditure included upgrades to telecommunications, transportation, and energy infrastructure. However, the overall infrastructural costs of hosting this event
Despite these huge costs, South Africa like many other host countries was motivated by pecuniary and non-pecuniary rewards associated with hosting the tournament. Thus, while these expenditures may seem staggering, they are often justified by the anticipated long-term benefits, such as increased tourism from the influx of international visitors, global visibility, and the positive impact on local businesses (HLB, 2025).
These rewards can stimulate national and regional economies, creating employment opportunities, boosting small businesses, and potentially generating government revenue to offset the public funds invested for the tournament. Exposure from hosting such a high-profile event can support sustained tourism growth, benefiting local economies long after the final whistle. New transportation systems, sports venues, and urban development can revitalize underdeveloped areas and attract new businesses—provided the host country capitalizes on the momentum generated. (Improved flow and clarity)
These rewards can stimulate national and regional economies, creating employment and boosting small business activities and opportunities, and can potentially generate government revenues to recoup the public funds invested for the tournament. Exposure from hosting such high-profile events can support sustained tourism growth, benefiting local economies long after the final whistle. New transportation systems, sports venues, and urban development can revitalise neglected areas and attract new businesses - provided the host country capitalizes on and leverages the momentum from the event. Global visibility through widespread media coverage during the Soccer World Cup can enhance a country's global profile, attracting foreign investment and new tourists long after the event (Bond & Cottle, 2011; Grant Thornton, 2003; Rose & Spiegel, 2011).
An
An ex-ante simulation conducted by the consulting firm Grant Thornton estimated that the World Cup would generate R21.3 billion for the South African economy, including R12.7 billion in direct expenditure and approximately 159 000 new employment opportunities. They predicted that 235 000 additional foreign visitors would visit the country during the World Cup year (Maennig, 2017). In 2008, the company revised its estimates to a GDP boost of US$6.0 billion, an increase of 381,000 jobs, and US$2.1 billion in additional tax revenue. Grant Thornton estimated that at least 480,000 World Cup tourists would visit South Africa (Maennig, 2017). The intangible benefits identified by the firm included increased global visibility, tourism and foreign direct investment, and a sense of national pride among South Africans (Bond & Cottle, 2011).
The increases in GDP do not appear to have translated into increases in employment, as 44% of the population aged 15 and older were employed in 2009 compared to 41% in 2010. Between 2010 and 2020, employment levels generally remained lower than pre-World Cup figures, averaging 42% of the working-age population.
Statistics from World Bank's World Development Indicators (2025) show that GDP grew by 3% in 2010 compared to −1.5% in 2009. Although growth has slowed down since 2011, it has remained positive territory. The increases in GDP do not appear to have translated into increases in employment, as 44% of the population aged 15 and older were employed in 2009 compared to 41% in 2010. Between 2010 and 2020,
A key driver of GDP growth in 2010 appears to have been exports, which rose by 7.7% - the highest annual increase recorded to date. This growth was partly driven by increased tourism receipts. International tourist arrivals increased by 19% in 2010, significantly more than in any other year, leading to higher tourism revenues. Even though tourism receipts as a percentage of total exports fell from 10.4% in 2009 to 9.5% in 2010, in current US$ absolute value terms, these receipts increased from −5% in 2009 to 19% in 2010, with the growth remaining positive until 2012. Final consumption expenditure also grew by 4.2% in 2010 compared to −1.5% in 2009 whilst gross fixed capital formation grew from −6.7% in 2009 to −4% in 2010.
This snapshot of South Africa's 2010 macroeconomic performance portrays a positive association between the staging of the 2010 World Cup and the discussed key macroeconomic indicators, supporting a prima facie case for the tournament's positive impact. Given that correlation does not mean causality, the objective of this study is to investigate the causal impact of the 2010 World Cup tournament on South Africa, identifying the main contributing factors as well as the distributional effects of the impact. To conclude that the 2010 FIFA World Cup had a positive (or negative) impact on South Africa means that South Africa, had it not hosted the World Cup, would have performed worse (or better) than it actually did. We need to compare actual South Africa with a pseudo or artificial (synthetic) South Africa that did not host the World Cup. We attempt to do this by using a Synthetic Control Method, developed by Abadie and Gardeazabal in 2003, which helps us contsruct “Synthetic South Africa” as a weighted average of control or donor countries and compare its economic trajectory with that of actual South Africa. Analysing post-World Cup GDP trends is misleading, as it does not provide any causal interpretation. It also does not rely on a counterfactual scenario showing how GDP growth and other variables of interest of treated countries would have behaved had they not hosted the World Cup (Mello, 2024). Mello goes on to argue that this lack of evidence is somehow surprising, considering that hosting the World Cup is by and large an unpredictable event influenced by factors that are unrelated to recent GDP growth. As a result, the identification of the economic consequences of hosting the World Cup should be less prone to the endogeneity issues that typically complicate efforts to estimate the causal treatment effects.
In our analysis we depart from using dummies because they have a confounding effect and might capture other non-World Cup related changes in the South African economy, resulting in interpretation problems. Since the World Cup is a one-time event in a country, using a dummy will require a cross sectional analysis to improve the level of variation. However, 18 countries have been FIFA World Cup hosts in the competition's 22 tournaments since inauguration in 1930 and this may limit the ability of the dummy to detect significant effects. 2 This is why we decided to use a Synthetic Control Method (SCM) and create a synthetic South Africa made up of countries that did not host the World Cup but share relevant economic features of South Africa before the 2010 World Cup (Abadie & Gardeazabal, 2003). The subsequent economic changes of this synthetic South Africa without World Cup and other major distortionary changes is compared to the actual experience of the South African economy during and after the World Cup (Abadie & Gardeazabal, 2003). The SCM estimator also accounts for time-changing unobservable factors, unlike the difference-in-difference approach used by Mello (2024) which only accounts for time-invariant factors (Mawejje & McSharry, 2021).
There are numerous ex-ante and ex-post studies conducted on the effect of the 2010 FIFA World Cup in South Africa, but the majority of the ex-post studies are either qualitative or use quantitative techniques, such as regression analysis, that do not adequately isolate the causal impact of the tournament. 3 This study seeks to improve upon the techniques that have been previously applied in this area, contributing to the ongoing debate on the benefits of hosting these costly mega sporting events. It also aims to provide lessons to future FIFA World Cup hosts, including Morocco - the second African country selected to co-host the 2030 edition of the tournament, alongside Spain and Portugal. Using a Synthetic Control Method, results show that the actual hosting of the FIFA World Cup games in 2010 did not have a positive impact on GDP, but it significantly boosted tourism inflows. The positive impact on GDP was however felt during the period following South Africa's announcement as the host in 2004, up until before the actual games in 2010.
This study is organized as follows: Section 2, which covers both theoretical and empirical review of the literature, is followed by section 3 which presents the methodology and data issues related to the study. Sections 4 and 5 discuss the study results, and its conclusions and recommendations, respectively.
Literature Review
The hosting of sports events like the World Cup is regarded as part of a broader tourism strategy of improving visibility and enhancing the international perception of the host country. Convenient transportation and other infrastructure systems, impressive security, and beautiful scenery highlighted by the media can improve the host country's attractiveness to tourists (Maennig & Porsche, 2008; Matheson, 2009). This global visibility not only promotes the country as a good tourism destination but also positions it as an attractive location for foreign direct investment, with positive spillovers on local private investors, economic growth, and employment creation. These tangible or pecuniary benefits are the motivation behind hosting such mega events, even though ex-post studies show them to be small, with ex-ante simulations predicting significant positive impacts touted as a public relations exercise and in some cases based on misleading assumptions (Feddersen et al., 2009; Hagn & Maennig, 2007; Liu, 2013; Matheson, 2012; Wolfgang, 2017).
Beyond the economic contributions, soccer has a significant social impact. The sport is a powerful tool for community building and social cohesion, transcending cultural, social, and economic barriers (Brennan et al., 2025). These non-pecuniary benefits include the novelty and ‘feel-good’ effects (Ahlfeldt & Maennig, 2010; Allmers & Maennig, 2009; Atkinson et al., 2008; Feddersen et al., 2006; Kavetsos & Szymanski, 2010; Maennig, 2007), and are often considered to outweigh the pecuniary benefits (Groothuis & Rotthoff, 2014; Kavetsos & Szymanski, 2010; Walton et al., 2008). The novelty effect is derived from the iconic architecture of newly built stadiums, enhancing the image of host cities, attracting investment and tourism. Maennig (2007) argues that due to the novelty effect, the average number of tourists and spectators after the World Cup is up to 60% higher than before the Cup especially in developed countries. In developing countries, there is poor attendance at soccer matches post-World Cup, which affects the long-term viability of businesses located in stadium precincts (Hendricks et al., 2012).
The “feel-good” effect, on the other hand, is from the free, relaxed, and jovial atmosphere during the World Cup, which improve national wellbeing, making citizens happier and prouder than they might otherwise be, and thus more willing to consume (Allmers & Maennig, 2009). Wolfgang (2017) argues that positive “feel-good” effects should be accompanied by positive economic effects since goods have a positive price. The impact of World Cup tournament can in theory be discussed in the context of a simple Keynesian model, whereby changes in components of aggregate demand have a direct effect on aggregate output. The business cycle theory further shows that the impact of the event depends on timing and the country's business cycle phase (IMF, 2014). If a country is in a recession or depression, increasing expenditure will stimulate the economy and possibly shorten the downturn, whilst in recovery and expansion phases, growth may rise above normal levels (IMF, 2014).
This discussion about pecuniary and non-pecuniary benefits explains why Kuper and Szymanski (2014) in their book Soccernomics, argued that “hosting doesn’t make you rich, but it does make you happy”, and whether you think the World Cup is worth the cost depends on whether your heart rules over your head (World Economic Forum, 2018).
Empirical studies on the multifaceted impact of soccer or sporting events are either ex-ante or ex-post and can be further grouped into those that find positive significant impact and those that do not. Some studies use qualitative analysis, while others use quantitative techniques. Generally, the economic impact of World Cup tournaments is mixed and inconclusive, but understanding the short- and long-term effects of such mega events is valuable (Ferris et al., 2023 and Matheson, 2009).
An ex-post qualitative analysis by Baade and Matheson (2004) of the 1994 Soccer World Cup in the US concluded that while the event was a huge success for the organisers, the economic success for host cities varied widely. Nine of the host cities experienced income losses and only four experienced income gains. The net losses amounted to $9.2 billion, compared to a projected $4 billion gain.
The 2002 Soccer World Cup, co-hosted by Japan and South Korea, provided mixed, if not heterogeneous, results. Horne and Manzenreiter (2004) show that, though Japan's GDP growth slowed from 0.4% in 2001 to 0.3% in 2002 and tourist numbers increased by only 30 000, South Korea's GDP growth doubled from 3.1% in 2001 (the pre-vent year) to a massive 6.3% in 2002, despite insignificant changes in tourist arrivals. Lee and Taylor (2003) estimate that the economic stimulus brought by World Cup tourist in South Korea was around $713 million of added value. Kim et al. (2006) though agreeing that the event was a success in South Korea, also claim that the benefits were lower than expected, partly because football has not traditionally been a major sport in Asia. Substitution and crowding-out effects were used to explain the expenditure and tourism patterns in both countries. In Japan, government construction expenditure replaced other forms of government expenditures, while in South Korea, non-soccer-related tourism fell or was diverted to other destinations (Baade & Matheson, 2004; Horne & Manzenreiter, 2004).
Gratton et al. (2006) argues that the hosting of sporting events should be evaluated not only based on immediate impact, but also on potential long-term benefits. Mello (2024) conducts a “during and after” impact analysis, testing whether winning the men's FIFA World Cup boosts GDP growth, as claimed by analysts and media outlets. Using both event-study and synthetic difference-in-difference methods, results show that winning the World Cup leads to a statistically significant 0.48 percentage point increase in year-on-year GDP growth in the two subsequent quarters. Mello however notes that the economic boost after a World Cup win is often short-lived, as GDP growth tends to generally contract in the year following the victory - a phenomenon that Forbes (2014) and Brückner and Pappa (2015) called the ‘World Cup GDP Curse”. Kurscheidt et al. (2008) provides corroborating evidence. They used substitution adjusted consumer expenditure and find a negligible impact of 0.14% on German GDP. 4 Symanski's (2002), after studying the world's largest economies over the past 30 years which have hosted either FIFA World Cup or Olympic Games, also argues that the growth of these countries was significantly lower during the years of FIFA World Cup.
When it comes to tourism, Brenke and Wagner, (2007) found a negligible effect of the 2006 German World Cup on tourism expenditures and tourism in general. However, Fourie and Santana-Gallego (2011), using meta-analysis and results from 60 studies, show that hosting the World Cup and Euro tournaments increased international tourist arrivals by an average of 8% during the event year. The effect however varied depending on location, economic development, and promotional strategies. These results are consistent with Baumann and Mathesons (2018), whose study on the 2014 Brazil World Cup showed that the number of international visitors increased by one million, or 30.6%.
In the case of employment, Giraud (2014), using a difference-in-differences approach, demonstrates that the 1998 FIFA World cup in France had a significant positive effect on employment in the host regions. Conversely, Florian and Wolfgang (2007a) show that the 1974 World Cup in Germany did not lead to any significant medium- to long-term employment. 5 Just like Florian and Wolfgang (2007b), Hagn and Maennig (2009) also found no short-term employment effects from the 2006 FIFA World Cup. Feddersen and Maennig (2012), using sector level data, found that the hospitality sector was the only sector that enjoyed an employment increase of approximately 4.2%, which translates to 2 600 extra jobs, far below the five digit employment increases predicted prior to the tournament..
Maennig and Zimbalist (2012) also argue that in addition to national branding, sporting events like the World Cup stimulate foreign direct direct investment inflows in the long run. Rose and Spiegel (2011) adds that mega-events serve as a signal to investors that a country is ready to welcome foreign investment. This effect aligns with Fourie and Santana-Gallego's (2011) findings, which show a significant increase in FDI inflows into host countries after organizing a mega-sporting event. Ferris et al. (2023) analysed the effect on the equity market, finding that hosting the Olympic Games had a significant positive announcement effect, whilst the FIFA World Cup had an insignificant announcement effect in the host country's equity market.
South Africa was the first African country to host the FIFA World Cup in 2010, and several researchers have carried out several ex-post and ex-ante effects of the tournament (Bolsmann & Brewster, 2009; Cornelissen, 2009; Cronjé et al., 2010; Fett, 2020a; Gruber, 2014; Maharaj, 2011). South Africa's bid for the 2006 World Cup was based, in part, on the promise that it would bolster the economy by approximately $6 billion and create as many as 129,000 new jobs (Khoza, 2000). However, Baade and Matheson (2004), Vigor et al. (2004) and Allmers and Maennig (2009) concur that comparisons of pre-event estimates of the World Cup economic impacts with the actual impacts have differed substantially. Ex-ante studies by Saayman and Rossouw (2008) as well as Bohlmann and van Heerden (2005) using computable general equilibrium approach predicted that the 2010 Soccer World Cup would likely produce positive GDP growth and employment effects, with possible negative effects coming from higher inflation and net export losses. DuPlessis and Venter (2010), using high frequency monthly data, estimated that the impact on South African's GDP would be around 0.1%.
Ex-post studies suggest that the impact of the 2010 World Cup was either below predicted levels or negative. For example, Peeters et al. (2014), using panel regression analysis and monthly country-by-country arrival data to assess the impact of the 2010 World Cup on tourism, found that South Africa attracted around 220,000 extra arrivals from non-Southern African Development Community (SADC) countries and 300,000 total extra visitors over the entire year. These figures fell short of the pre-event predictions 6 made by the organisers and imply that the total cost per extra non-SADC visitor amounted to $13,000. Du Plessis and Maennig (2011) found no significant evidence of a net increase in World Cup related overseas tourism, beyond approximately 90,000 to 118,000 persons, which equates to a short-term impact of 0.1% of GDP. Humprey and Fraser (2016), when analysing stadium usage using utilisation rate and usage index, found a significant decline in stadium use following the 2010 FIFA World Cup.
Therefore, whether hosting mega sporting events produces a significant positive effect remains inconclusive and continues to be debated. As Ferris et al. (2023) puts it, a better understanding of the short- and long-term effects of hosting mega sporting events is essential.
Bades and Matheson (2004) provides reasons why there is lack of consensus in the empirical literature on the effects of mega sporting events. First, gross measures of spending are often used instead of net spending measures, which excludes local resident spending. Second, spending on mega events may displace spending that would have occurred otherwise – this is called the “substitution effect” in the literature. In addition, calculations of tourism increases often fail to account for a decline in regular tourism from populations uninterested in the sport, resulting in an overall fall in the number of regular tourists.
A sports event that attracts one million sports visitors while displacing an equal number of regular visitors may appear impressive on gross terms, even though the net impact of the event is negligible, possibly due to what is called the “crowding out effect”. This was seen in South Korea during the 2022 World Cup where net tourists inflow were negligible (Golovnina, 2002). Another reason for mixed findings is that the multipliers used are often exaggerated as they do not account for increases in worker productivity when analysing employment effects. An increase in expenditure may not translate into increase in employment if firms increase marginal productivity of workers instead of costly hiring (Crompton, 1995). This is a common limitation of ex-ante studies.
Methodology and Data
The Synthetic Control Method
To assess whether the end of the 2010 World Cup had meaningful effects on economic outcomes, we use the synthetic control method (SCM). The SCM, introduced by Abadie and Gardeazabal (2003) and further demonstrated in Abadie et al. (2010, 2015), has been extensively used in the literature by authors investigating the impact of “big” events. 7 See, for example, Acemoglu et al. (2000), Billmeier and Nannicini (2013), Cunningham and Shah (2018), and Matta et al. (2019), among others. The SCM seeks to compare the outcomes of an affected unit and its synthetic counterpart (Cunningham, 2021). Similar to propensity score matching, difference-in-difference (DID), and regression discontinuity estimators, the SCM estimator helps solve the missing data problem created by the fact that, at any one point in time, one cannot simultaneously observe an outcome for a country with and without exposure to the big event or intervention. Besides nicely bridging the gap between qualitative and quantitative research approaches, the SCM approach also provides several other important advantages (Cunningham, 2021).
First, the weights generated by the SCM estimator make it explicit what each unit is contributing to the counterfactual (Abadie et al., 2010; Abadie & Gardeazabal, 2003; Cunningham, 2021; Mawejje & McSharry, 2021). 8 This implies that the SCM provides a transparent means of selecting countries to be used to generate synthetic South Africa (Mawejje & McSharry, 2021). Second, it precludes extrapolation and uses interpolation (Cunningham, 2021). Third, the SCM estimator also accounts for time-changing unobservable factors, unlike the difference-in-difference approach which only accounts for time-invariant factors (Mawejje & McSharry, 2021).
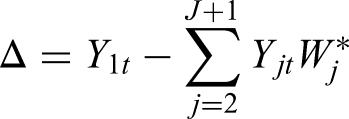
In this section we briefly discuss the SCM approach in the context of South Africa, for given its hosting of the World Cup in 2010.
9
We use data covering the period 1994 (after attainment of independence) to 2019 before the covid pandemic. Let t stand for time (in years) and assume that the sample period ranges from period 1 to T. That is,
Although the SCM can generated a credible counterfactual it has some weaknesses. First, the SCM can fail to consider the effect of some idiosyncratic shocks that may affect the treated country differently compared to countries in the donor pool (Matta et al., 2019). Second, to reduce omitted variable bias, the pre-treatment period must be long enough even though no specific time length is suggested in the literature. In some cases, the pre-treatment period may not be long enough for all sample countries, as a balanced panel is ideal for the SCM to work optimally. Third, some country features required for generating a good match between the actual and the synthetic may be difficult to measure. For example, it may be difficult to quantify or measure the relationship between the government and the private sector, the “feel-good” or novelty effects of hosting the World Cup (Matta et al., 2019).
Data and Sources
We started with a sample of all African countries (to capture African characteristics in terms of culture natural resources abundance and other socio economic aspects) as well as all upper middle income countries since South Africa is a middle income African country. Several of these countries were however dropped due to missing data points, as the SCM well when using a balanced panel, and the dependent variable must not have missing observations. 11 This resulted in the sample dropping to 45 countries, including South Africa (the treated country). The study used a panel covering the period 1994–2019. Given that 2010 is the treatment year, the data's pre-treatment period was long enough. We standardise outcome variables of interest by expressing them in per capita terms to reduce the impact of a country's economic size in creating synthetic South Africa. We use data spanning 1994 to 2019, so that we capture South Africa post-independence but before the start of the Covid 19 pandemic.
The data used for the study was sourced from the World Development Indicators (WDI) database and the Penn World Tables. See Table 9 in the appendix for more details on the variables and their definitions. Real GDP (USD millions, 2017 prices) for all countries in the sample was obtained from the WDI database. Other variables sourced from the WDI include FDI, industry and value added, services value added, FDI, tourism inflows and tourism receipts with other South Africa specific variables sourced from Quantec EasyData. From the Penn World Tables, we sourced the following variables: household consumption, employment, population, and capital stock. These predictors have been commonly used in the literature – see, for example, Matta et al. (2019) and Mawejje and McSharry (2021).
Results Presentation and Analysis
A prima facie analysis of the statistics on South Africa show that the country's GDP growth rate was higher in 2010 than it was in 2009 with 2011 recording an even higher growth rate of 3.3% (see Table 1), suggesting that the World Cup probably had lingering effects. This GDP growth is partly explained by the large increase in inbound tourism which went up by about 42 percentage points to 15.1% in 2010 with the relatively lower growth levels post 2010 suggesting that most of these visitors were soccer fans. Concomitantly, increases in inbound tourism translated into significant increases in tourism receipts which went up (by 24 percentage points) to 18.7% from a negative growth level of 5.4% in 2019. The decrease in the share of tourism receipts in total exports from 2010 to 2019, compared to the average of the past 10 years till 2009, can be attributed to poor tourism inflows and expenditure as well as increased demand for South African goods in the international market.
Percentage Changes in Selected Macroeconomic Variables in South Africa.
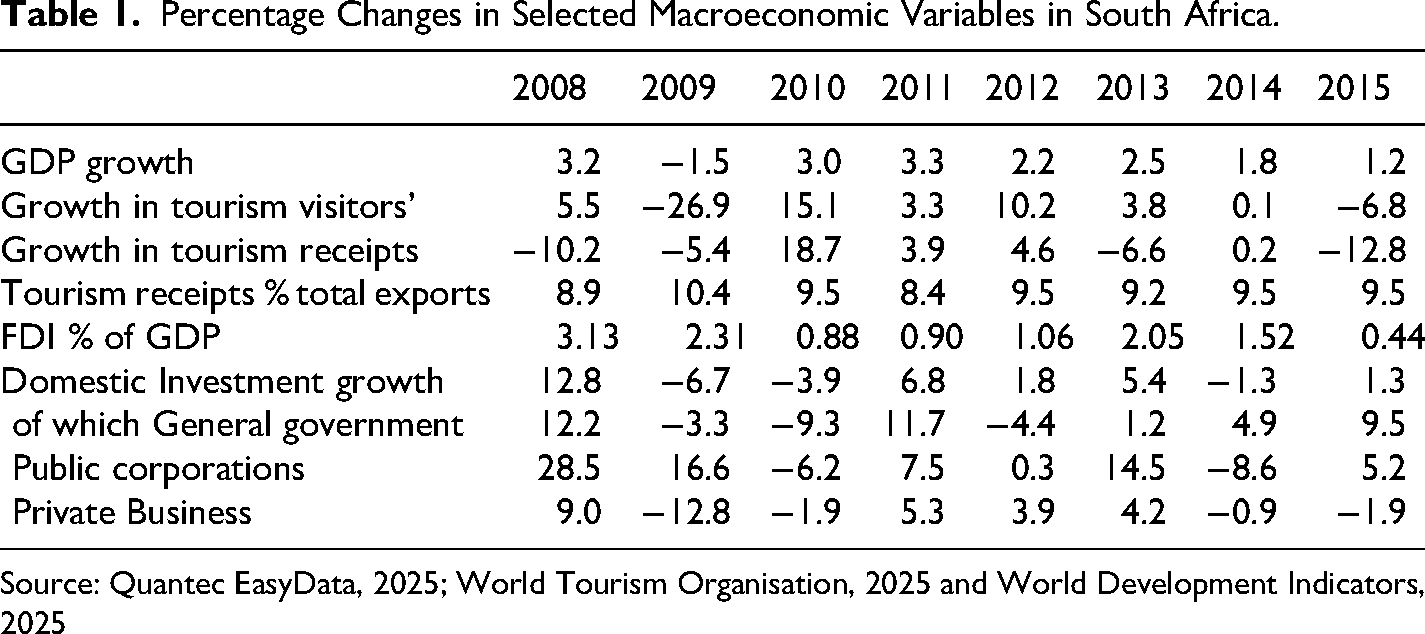
Tourism statistics from UNWTO (2025) show that the year on year increase of 15% in inbound tourism was driven by visitors from the Americas, East Asia and the Pacific as well as other areas not classified (see Table 7 appendix). There was a huge increase in visitors who came for business and professional reasons in 2010 compared to other years, possibly due to their link to the FIFA World Cup event.
These descriptive statistics provide a surface impression of the impact of the 2010 FIFA World Cup on South Africa. However, this is not scientific proof because we do not know how South Africa would have performed without the soccer World Cup. Comparing South Africa with its synthetic counterpart (South Africa without the World Cup) will help us credibly conclude whether the above results indicate a causal impact of the event. We do this counterfactual comparison using the Synthetic Control Method developed by Abadie and Gardeazabal (2003).
Synthetic Control Results
The 2010 FIFA World Cup in South Africa was played by 32 teams during the months of June and July, with the final being played on the 11th of July 2010. We analyse how hosting this mega event affected the country's GDP and tourism inflows by comparing the trajectories for actual South Africa and synthetic South Africa. To create synthetic South Africa, we use donor countries and the covariates that influence GDP performance. With 11 covariates (see Table 9 appendix), optimal covariate weights were calculated using 10 of the 11 covariates with optimal unit/country weights coming from eight countries out of 44 (see Tables 2 and 3 below). About 87% of the optimal country weights were contributed by four countries namely Brazil (31.7%), Morocco (21.3%), Botswana (15.5%) and Algeria (18.1%). Using 11 covariates and 44 control units generated an R-squared of 99.7%. Covariate bias was also good with synthetic bias smaller than that of the averages of the controls calculated using equal weighting (see appendix Figure 16).
Country Weights in Synthetic South Africa.
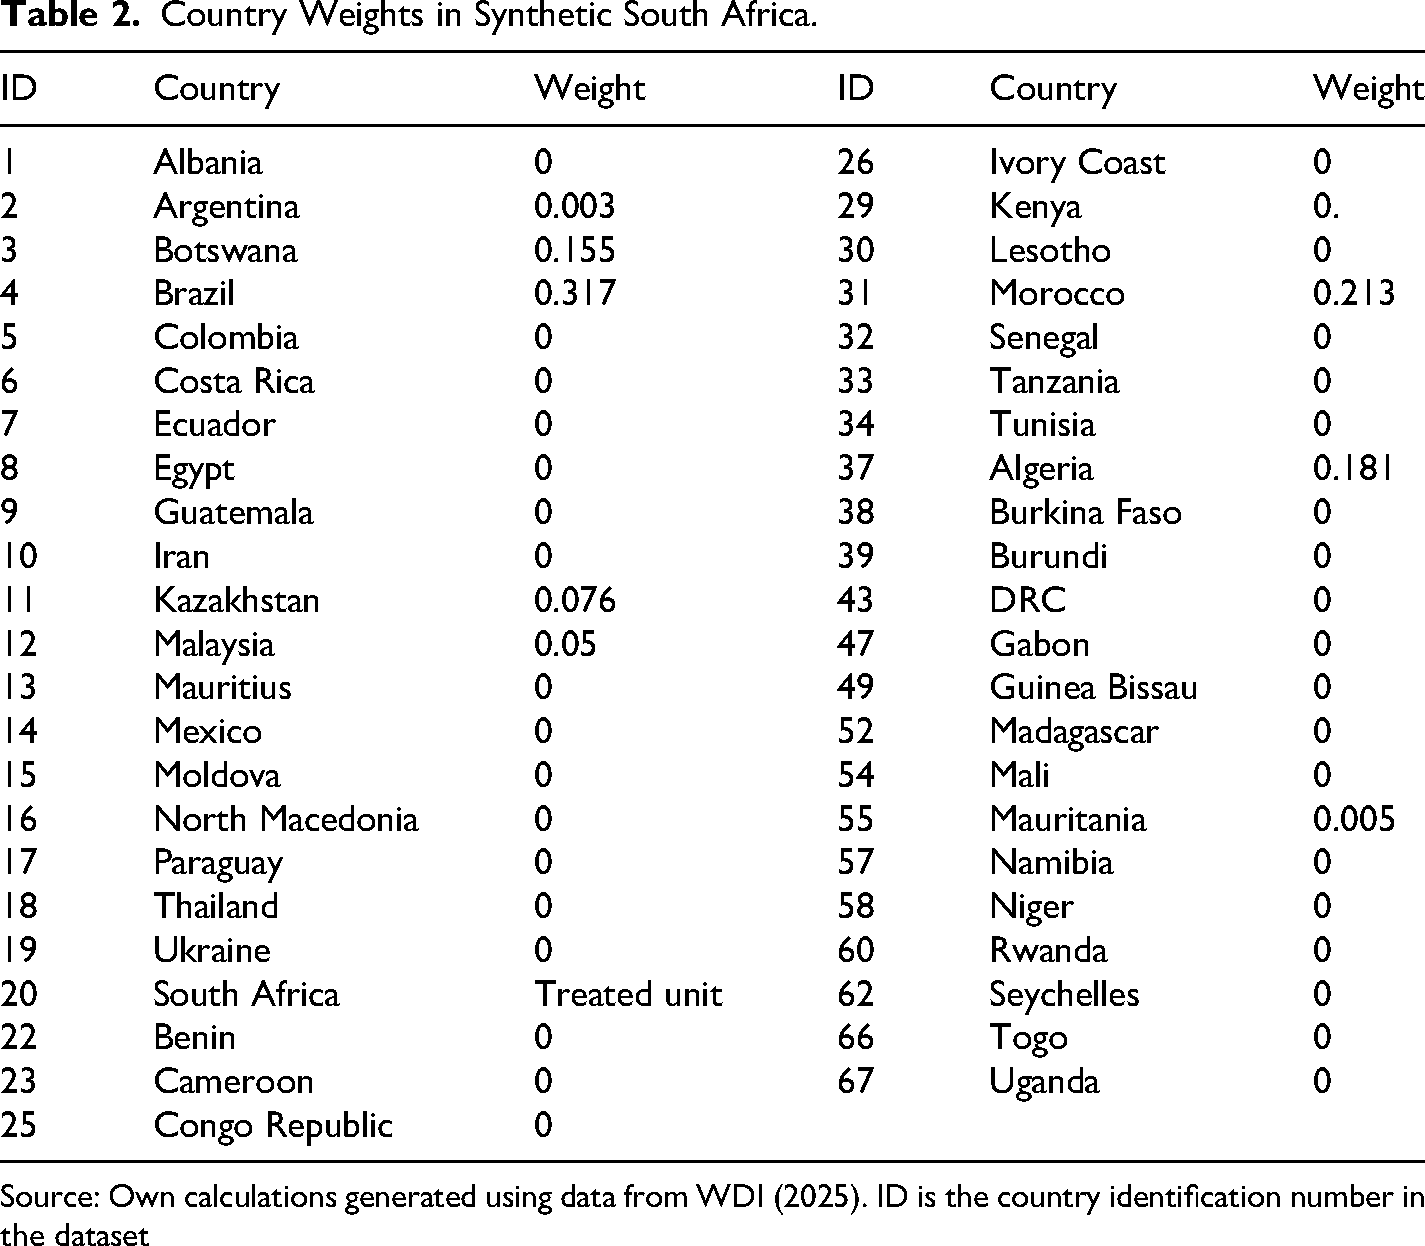
Source: Own calculations generated using data from WDI (2025). ID is the country identification number in the dataset
In-Space Placebo Test Results Using Fake Treatment Units and 2010 as Treatment Year.
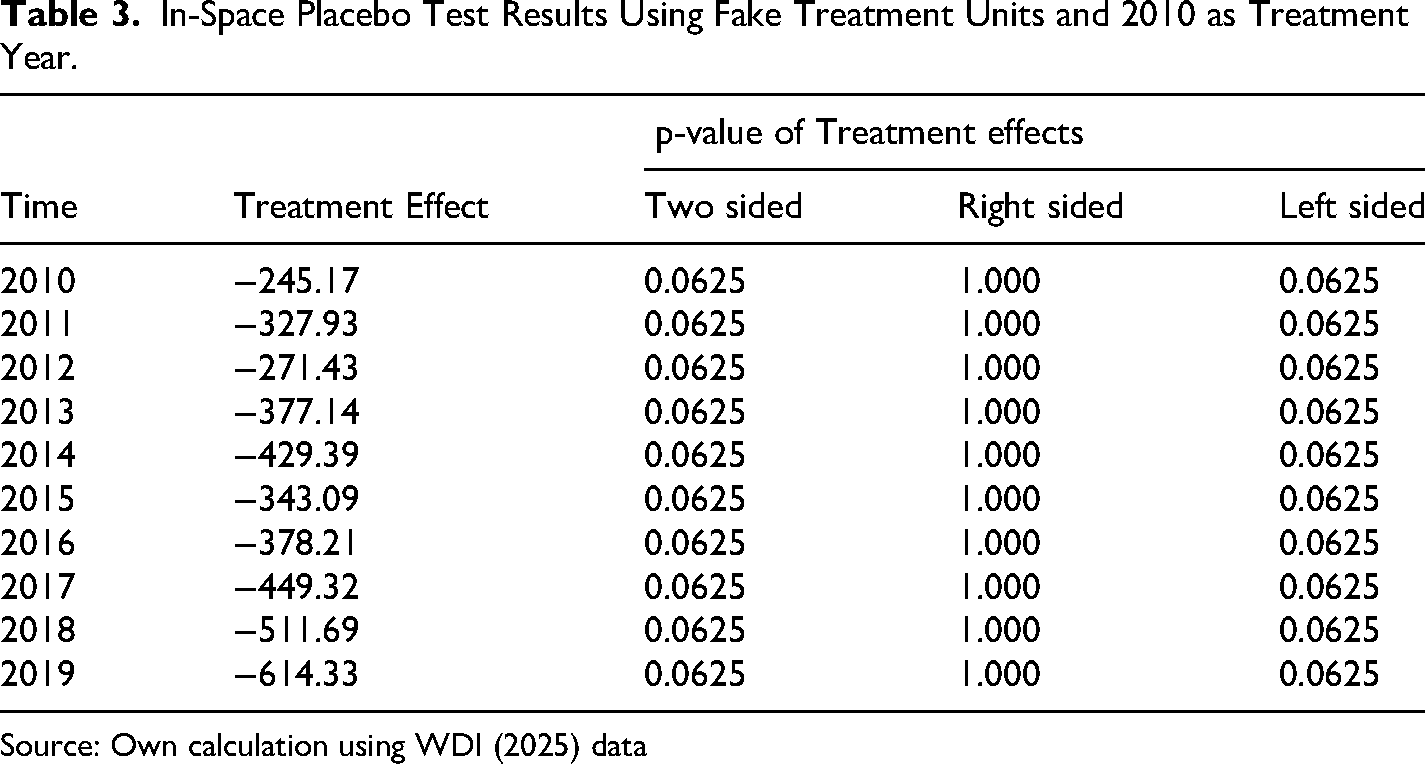
Source: Own calculation using WDI (2025) data
The eight countries selected to come up with synthetic South Africa (see Table 2), represent different characteristic of the treated country. Brazil and Argentina are well known soccer loving countries that also happen to have hosted the FIFA World Cup, with the former having hosted in both 1950 and 2014 whilst the later did so in 1978 and winning the cup on home soil (FIFA 2025). These countries also play rugby just like South Africa with Brazil 12 and Argentina belonging to the same regional grouping such as G20 countries. Morocco, Algeria, Botswana, and Mauritania are all African countries representing the cultural, political and socio economic and other geographical characteristics of the African continent, the home of South Africa. These countries are plentifully endowed with different natural resources (phosphate, minerals, natural gas, oil etc) and are mainly coastal (except for Botswana) with beautiful flora and fauna just like South Africa. Kazakhstan and Malaysia are upper middle income countries from the Asian regions with the same level of industrialisation given the shares of manufacturing and industry as a percentage of GDP although Malaysia performs better. 13 Table 10 in the appendix shows that in terms of economic structure, GDP per capita and employment, these countries are not very different from each other.
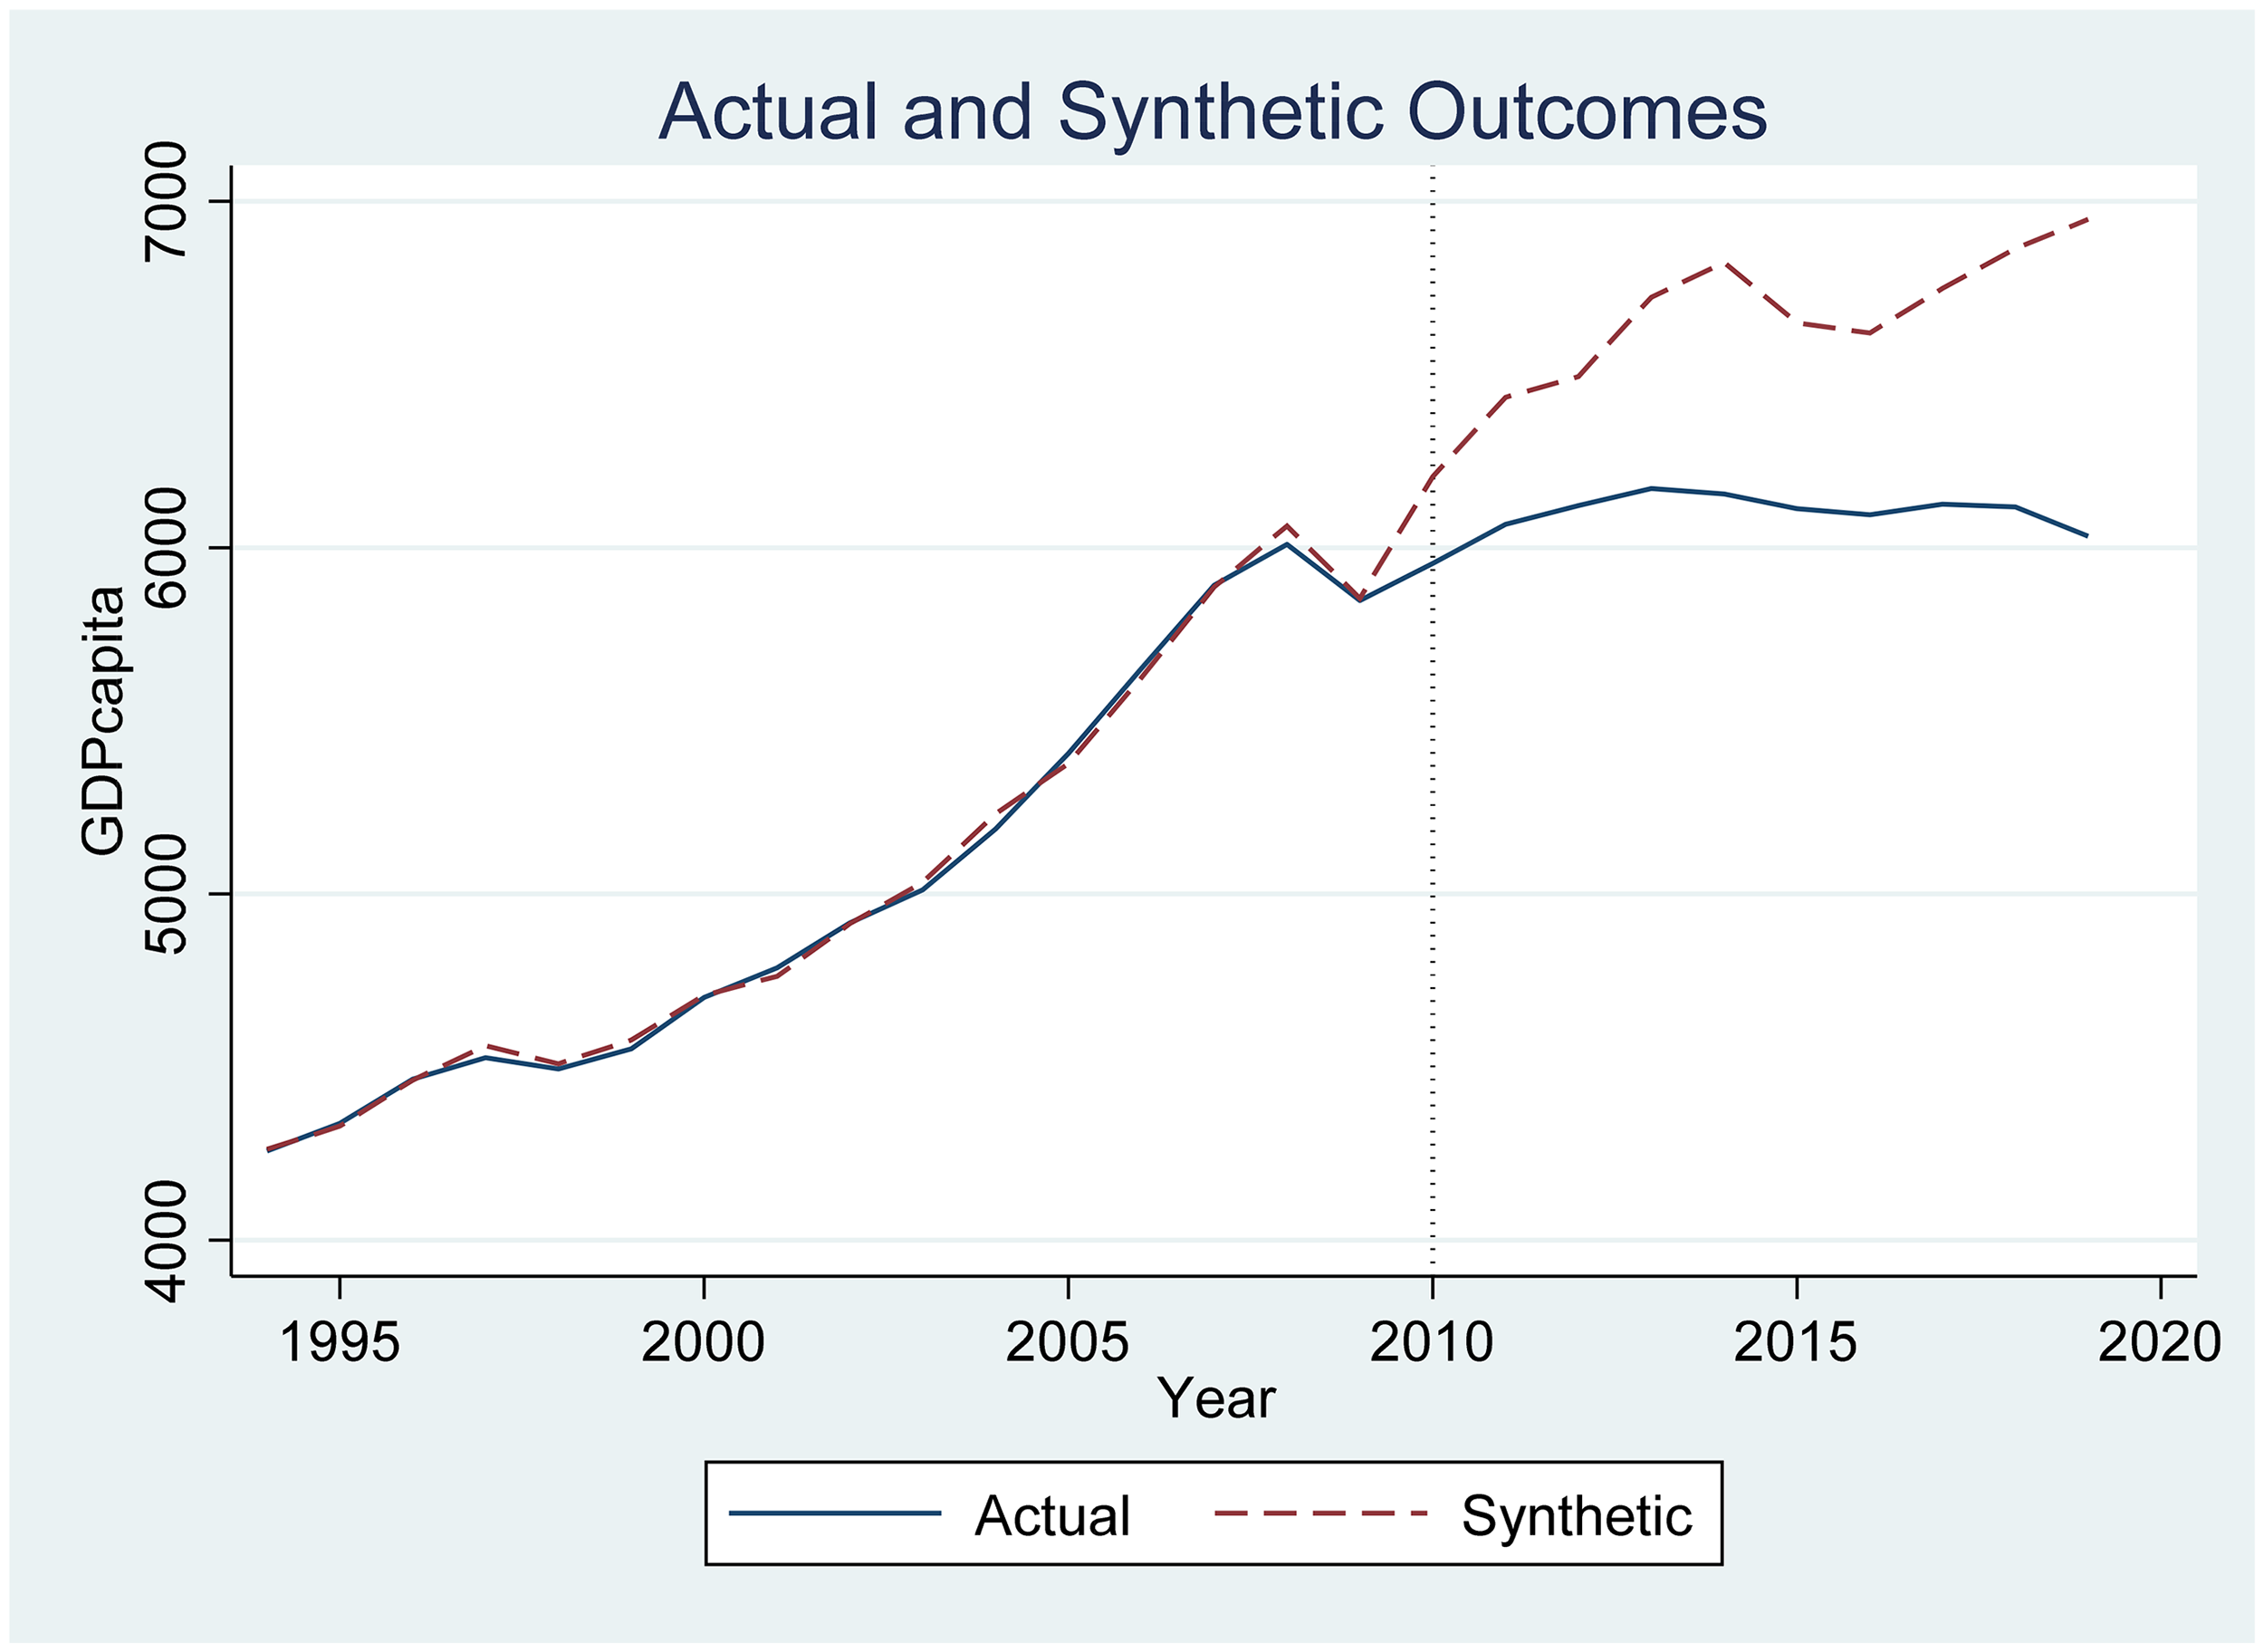
The results of our SCM analysis are shown in Figure 1 below, where the dotted line represent synthetic South Africa, and the solid line shows actual South Africa. The important thing when using SCM is to ensure that synthetic South Africa mimic as much as possible actual South Africa before the treatment year, which is 2010 in this case. This ensures that the effect of the treatment is not driven by differences that existed before the treatment. Using GDP per capita as an outcome variable, the effect of the FIFA World Cup in 2010 was negative, suggesting that South Africa without the World Cup would have performed better than actual South Africa (see Figure 1). This means the FIFA World Cup games played in 2010 did not necessarily stimulate South Africa's economic performance. These results support findings by Szymanski (2002) and Horne and Manzenreiter (2004) who analyzed the World Cup played in Japan.
Real GDP per Capita gap Between South Africa and its Synthetic. Source: Own Calculation Using WDI (2025) Data.
Figure 1 shows that synthetic South Africa matched actual South Africa very well before the treatment year of 2010 suggesting that the weighted average of the eight countries in Table 2 provided a good counterfactual. Thus, had South Africa not hosted the World Cup, its growth trajectory would have followed the dotted line.
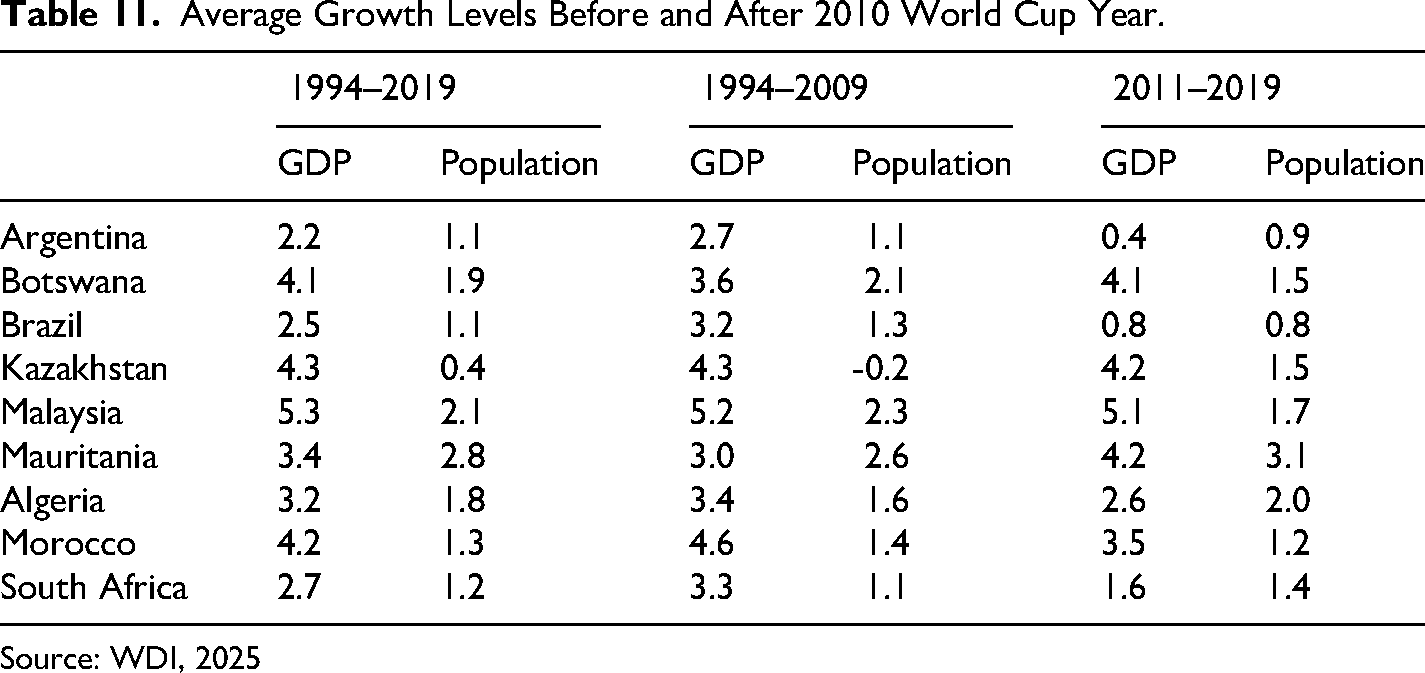
The gap between actual South Africa and Synthetic South Africa is shown in Figure 2. The downward trajectory appears to have started just before 2010 probably around 2009. It is important to understand the factors driving this explosive gap. To do this we first look at changes in population and GDP variables of South Africa and its synthetic countries. Table 11 appendix shows that annual population growth during the period 1994 to 2009 was not significantly different to that of period 2011–2019 in these countries except for Kazakhstan. Actual South African population did not increase relatively more than that of synthetic countries to drive per capita GDP down. GDP growth changes were also generally lower post 2010 compared to the period 1994 to 2009. This suggest that it is not faster growth in the synthetic countries that drives this negative gap between actual South Africa and synthetic South Africa. We went further and decided to disaggregate GDP data into sectors, focusing on industry and services sectors due to data availability. The industry sector is made up of construction, manufacturing, and utilities. The patterns of change in the services sector mimicked that of GDP per capita shown in Figure 1, suggesting that it could be the sector behind the changes (see Figures 17a and 17b). In the case of industry, it appears that synthetic South Africa performed slightly better than actual South Africa, and the gap was relatively smaller (see Figures 18a and 18b). Thus, the impact coming from the services sector in 2010 appear to have been larger than that coming from the industry sector.
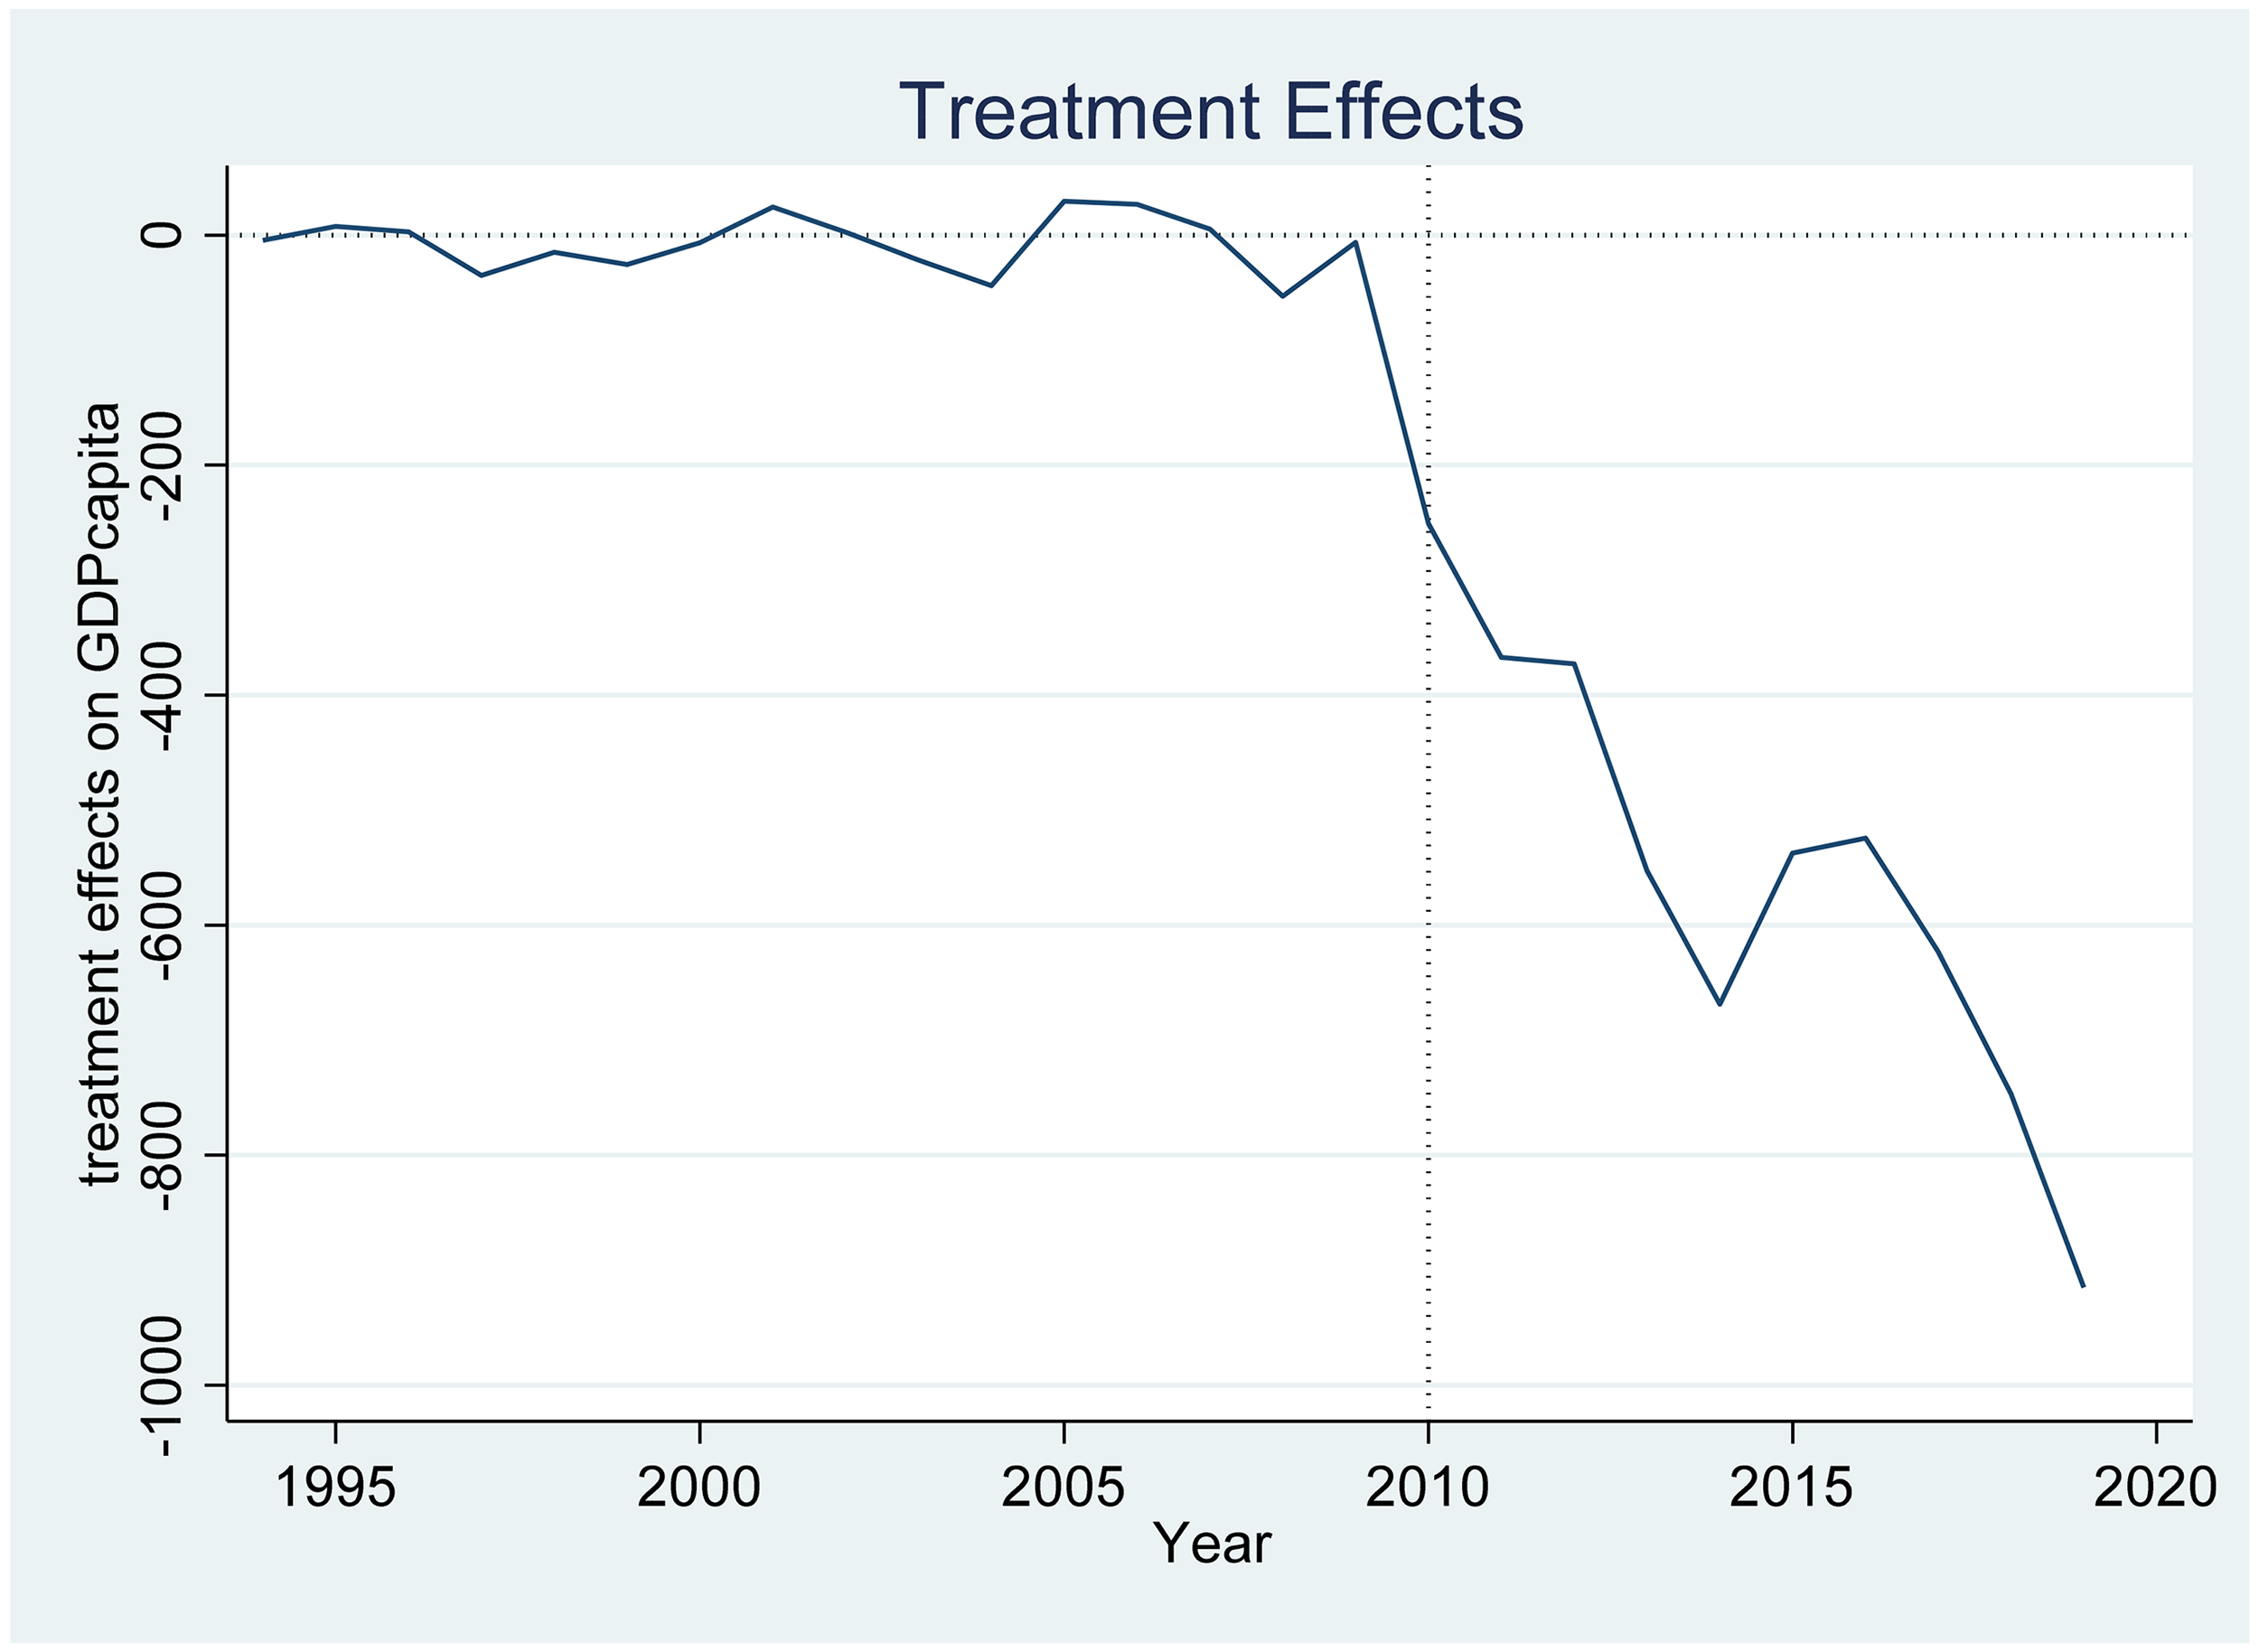
GDP gap Between Actual and Synthetic South Africa. Source: Own Calculation Using WDI (2025) Data.
We went further and considered the fact that South Africa was announced as the host of the 2010 FIFA World Cup in May 2004. Thus, although the final games of the 2010 World Cup were played in June-July 2010, hosting this mega tournament was a process that started in 2004. This is when stadiums and other infrastructure facilities like Gautrain rapid rail system, and the King Shaka International airport were constructed. Hotels and other accommodation facilities also prepared for this event during the period 2004 to 2009. To consider this, we changed the treatment year from 2010 to 2004 and analysed the difference between actual and synthetic South Africa. Figures 3 and 4 show the results. These figures show that actual South Africa performed better than synthetic South Africa over the period 2004 to 2009 (see Figure 4 for a more visible gap between actual and synthetic South Africa). This suggest that the benefits from FIFA World Cup were enjoyed by South Africa during the period when the country was preparing for the final tournament games and not during or after the games. This result show that the actual hosting of the final games does not have a positive economic effect but the period from announcement to the year prior the tournament had beneficial effects. These results support findings by Horne and Manzenreiter (2004) in the case of South Korea, Mello (2024) and Kurscheidt et al. (2008).
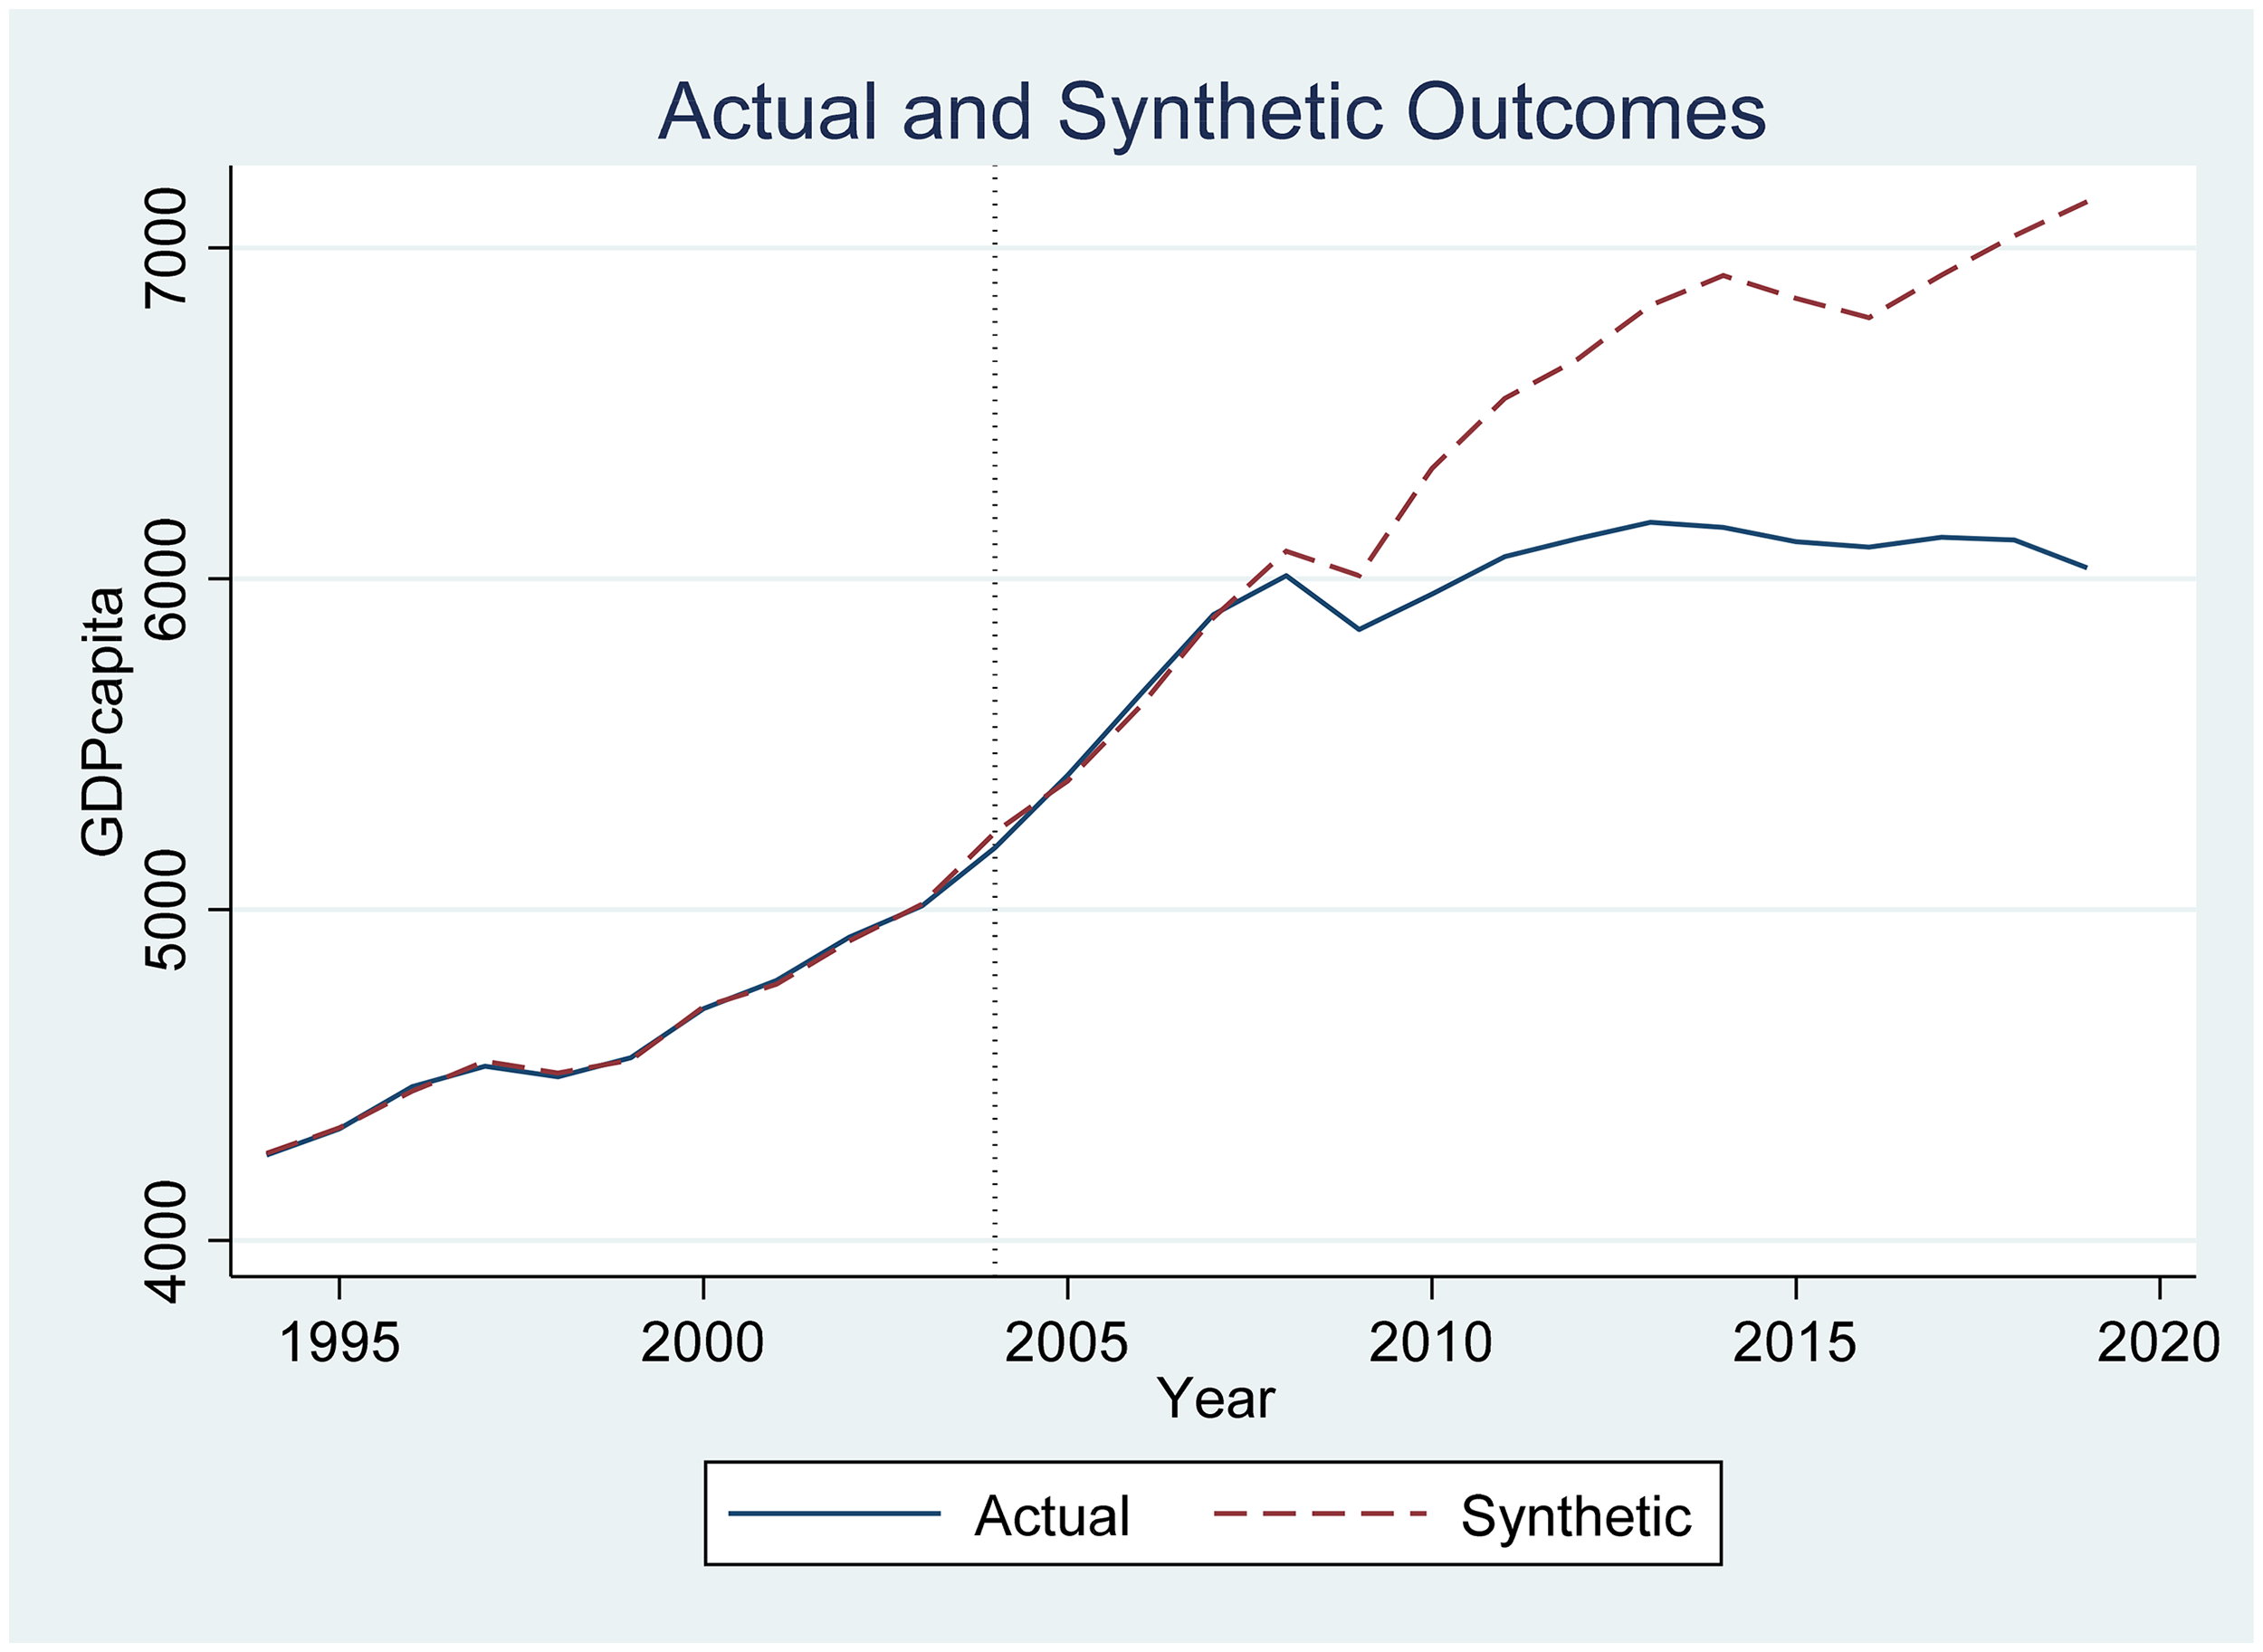
Real GDP per Capita gap Between South Africa and its Synthetic Using 2004 as Treatment Year. Source: Own Calculation Using WDI (2025) Data.
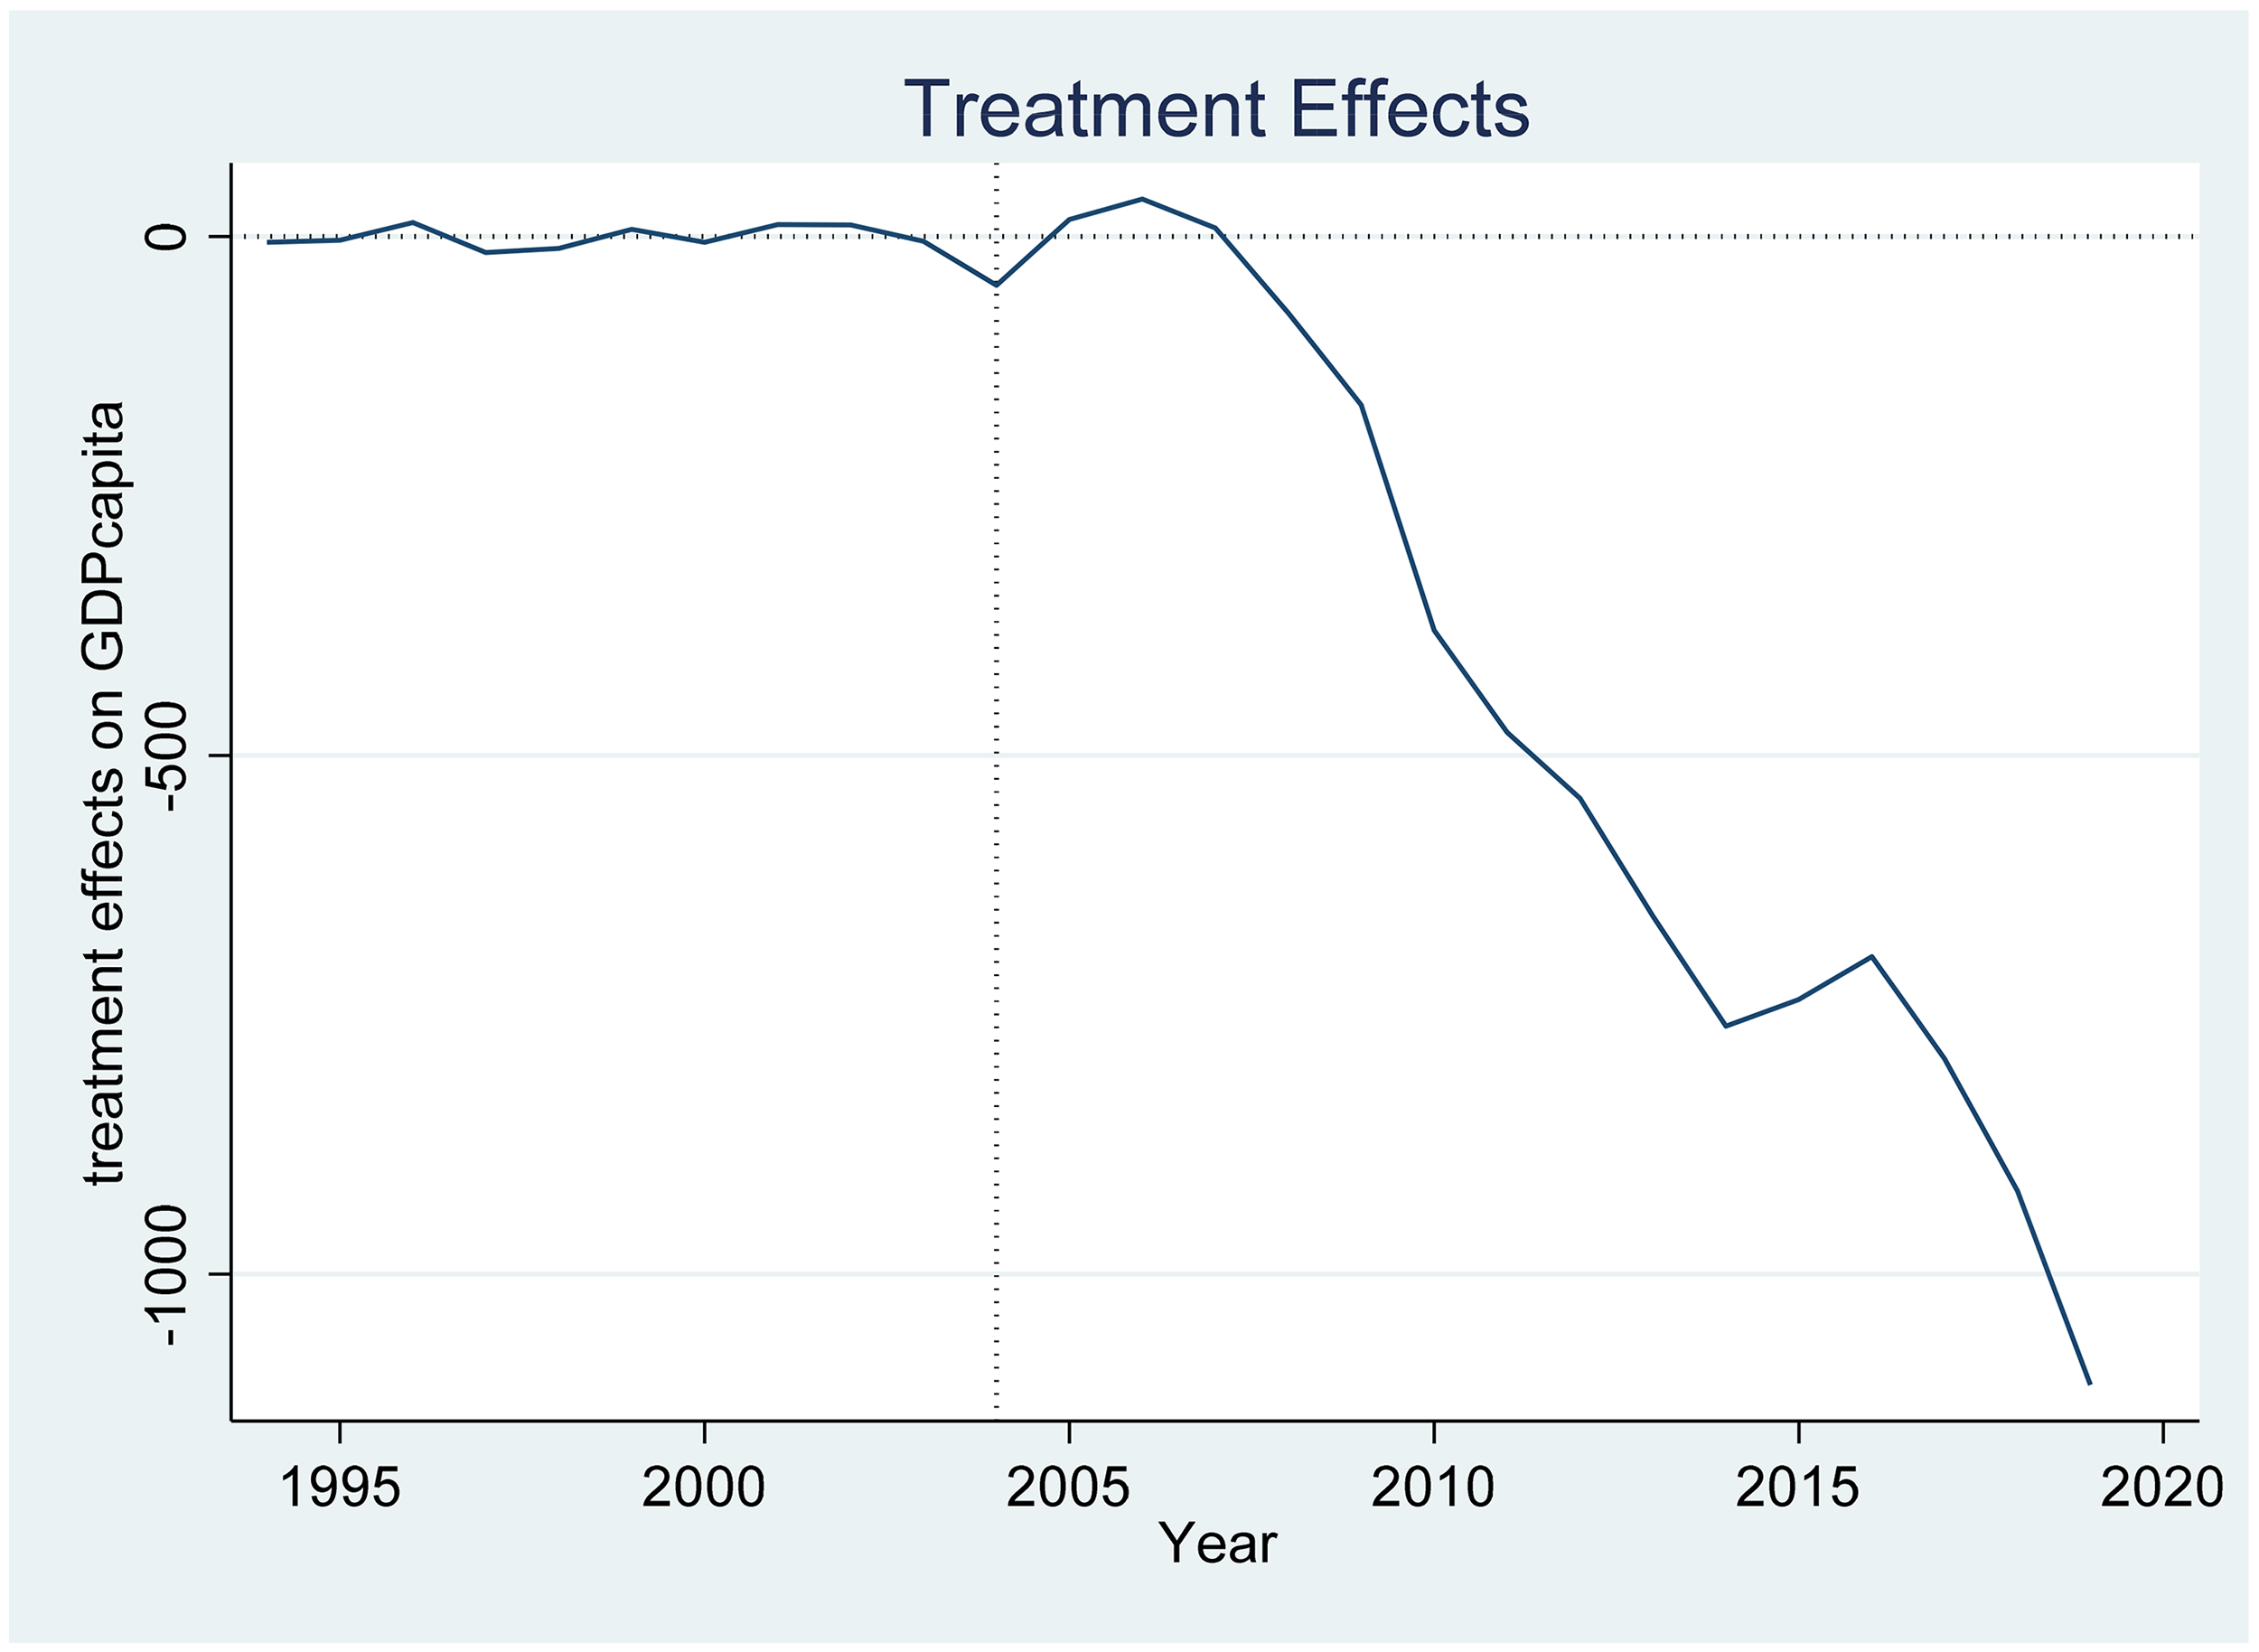
Figure 2: GDP gap between Actual and Synthetic South Africa using 2004 as treatment year. Source: Own calculation using WDI (2025) data.
The results using 2004 as treatment year were obtained using 11 covariates but with only eight of these covariates forming the optimal balance whilst in the case of countries or units, optimal balance was made up of seven countries out of 44 with Morocco having the greatest weight of 31.3%, Brazil (24.7%), Algeria (17.9%), Malaysia (14.3%), Kazakhstan (2%), Costa Rica (6%), and Mexico (0.6%). The model has an R-squared of 99.3% and the covariate balance was smaller for synthetic South Africa compared to the average control, except for one covariate. Thus, there were positive treatment effects from 2004 up to 2009 and thereafter treatment effects became negative.
We explored South Africa's sectoral data to try and explain the driving forces behind these results. In the case of treatment year 2004 and for the services sector, synthetic South Africa performed as much as actual South Africa between the periods 2004 till 2006, with the GDP per capita gap being close to zero. However, the GDP gap started being negative after 2006 following the same trajectory or pattern as country level GDP per capita (see Figures 17c and 17d in the appendix). In the case of the industry sector, actual South Africa performed better than synthetic South Africa during the period 2004 till 2006/7. The GDP per capita gap was positive over this period and became negative after 2007 onwards (see Figures 18c and 18d). The positive GDP per capita outlook seen above was therefore partly driven by what was happening in the industry sector. 14 Since this sector covers many other sectors like manufacturing and construction, it is possible that the positive changes in 2008 were buoyed by these sectors, particularly construction. Data from Statistics South Africa partly corroborate these findings. The construction sector grew faster than other sectors over the period 2004 to 2007 and reached its slowest growth around 2010/11 (see Figure 5 below). Generally, all sectors, except agriculture forestry and fisheries, appear to have been experiencing downward growth rates. In 2010, the manufacturing and the services sectors grew by 6% and 1.7% respectively, whilst others grew at less than one percent (see Figure 5 and Table 5 in the appendix).
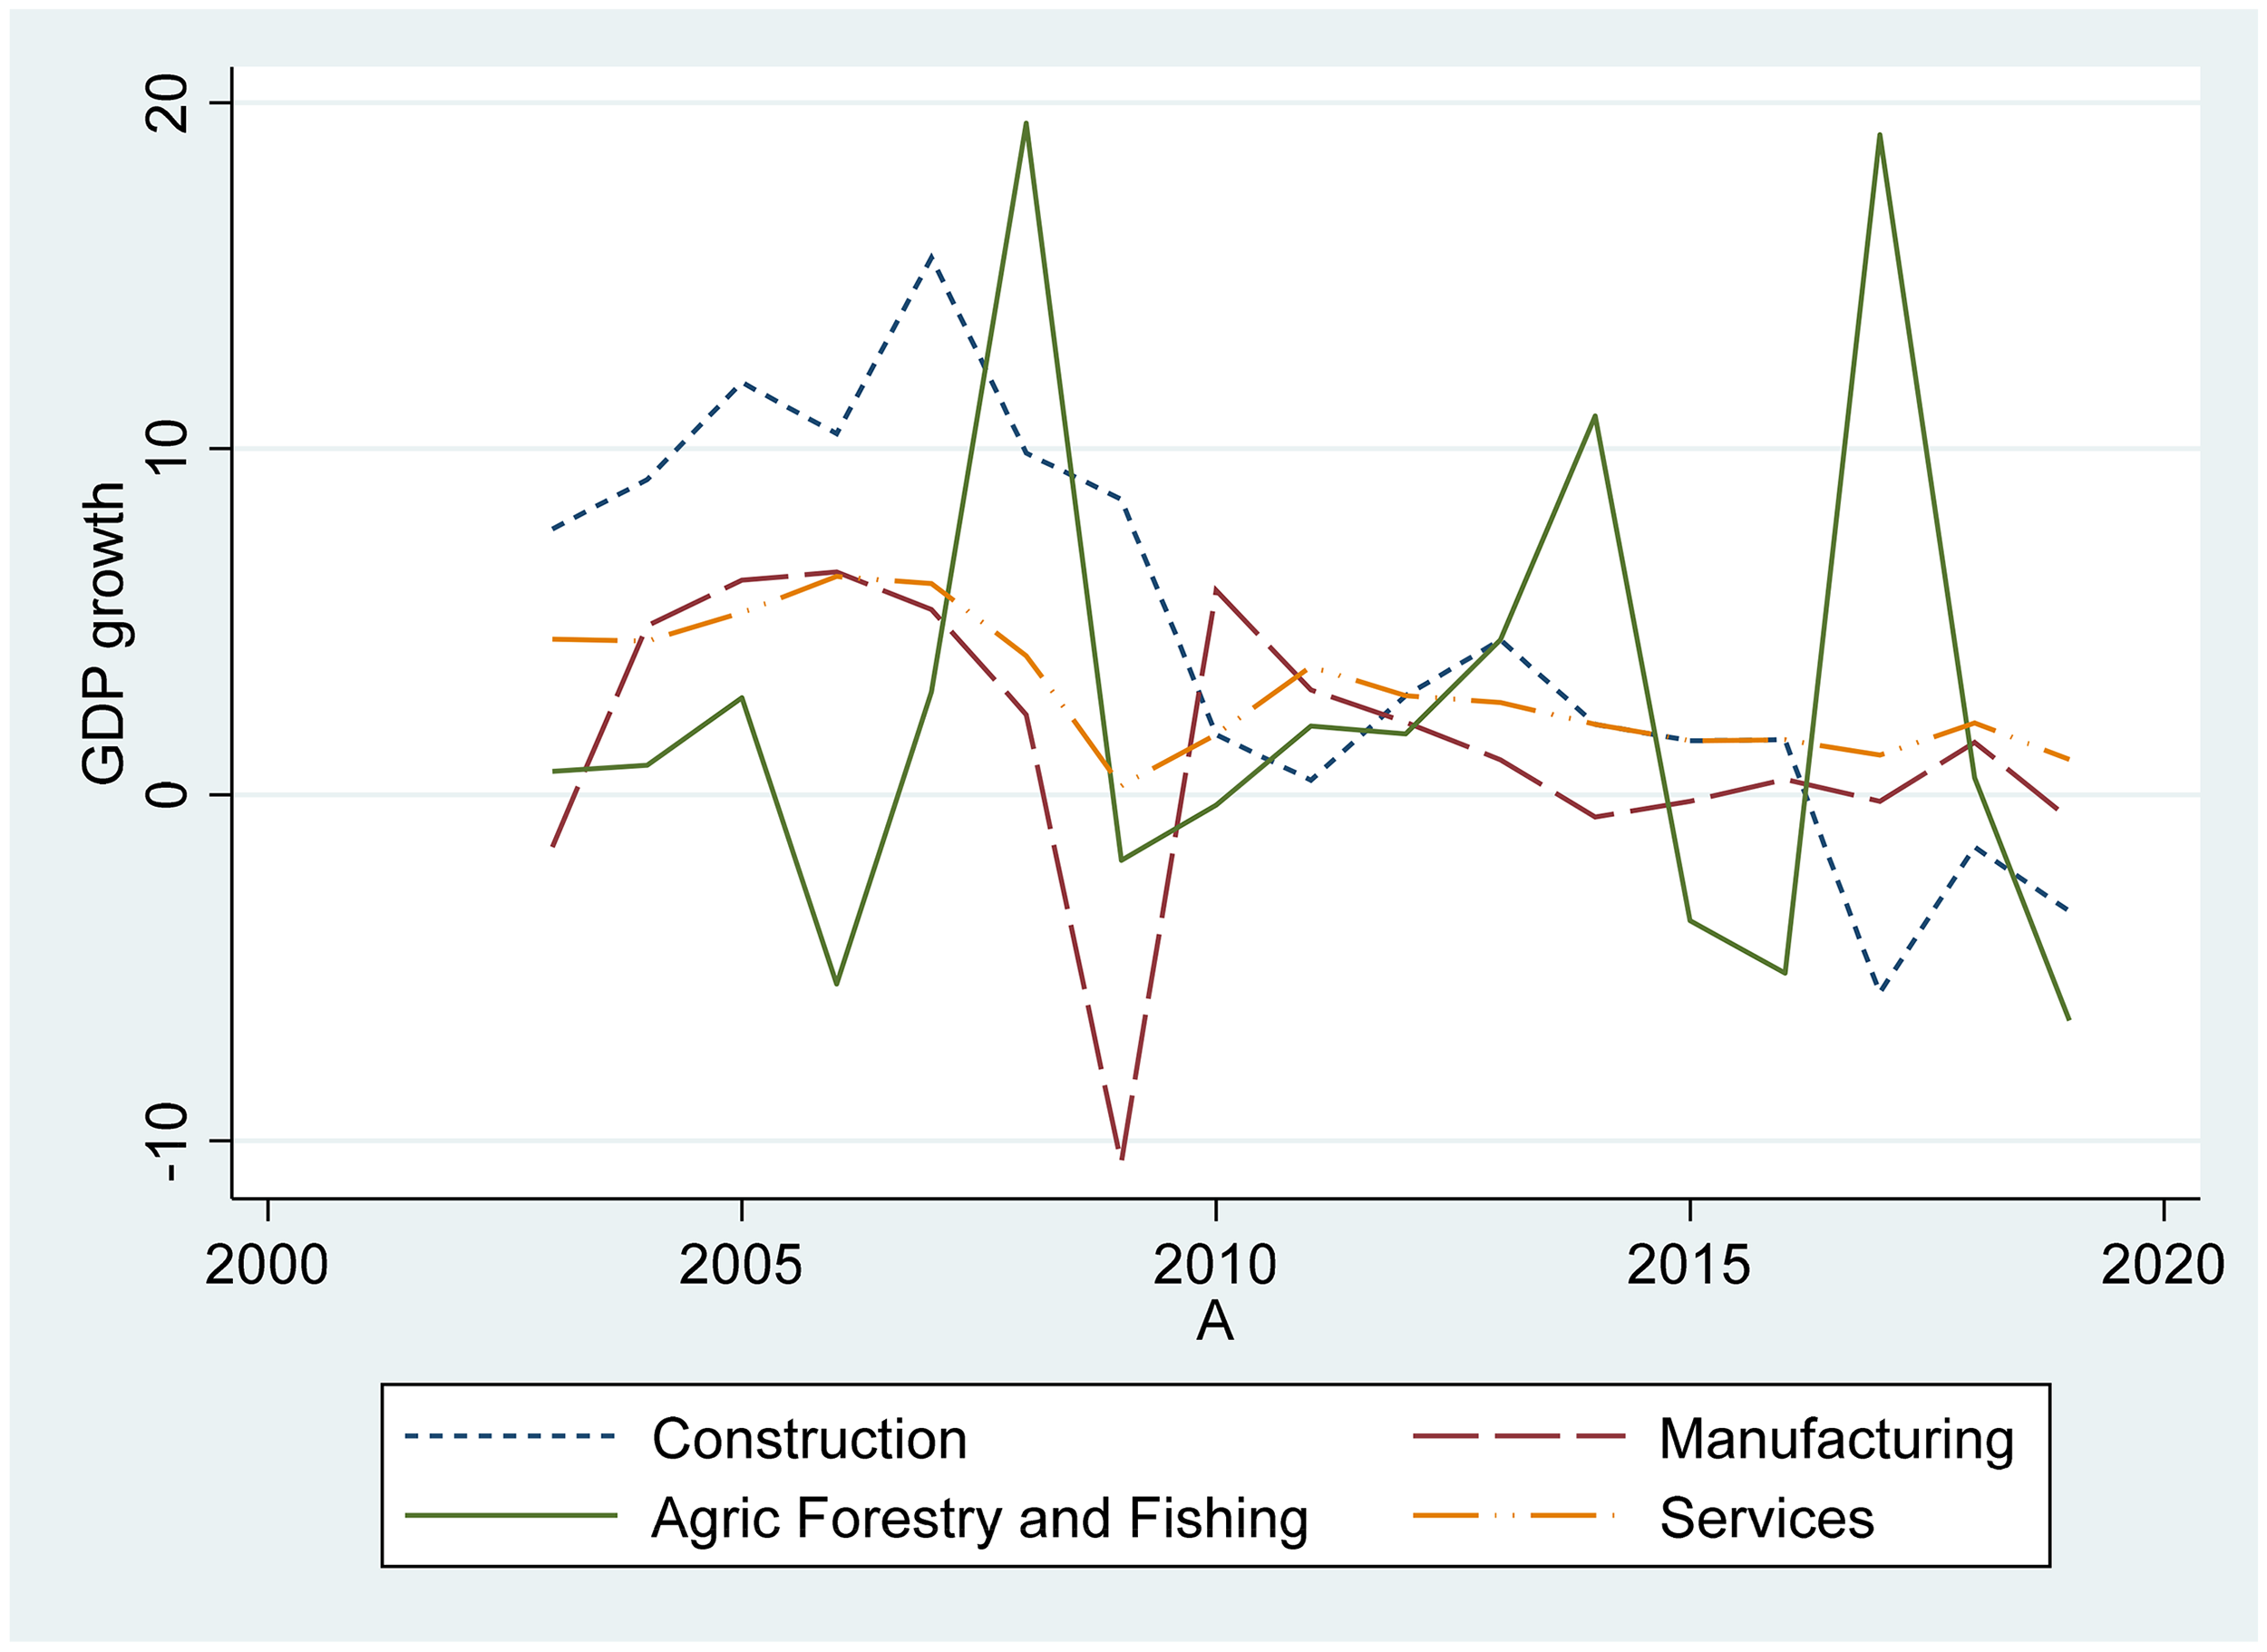
GDP Growth of Main Sectors in South Africa, 2003–2019. Source: Own Calculation Using Quantec EasyData (2025) Data.
In 2011 onwards, growth in the services sector overtook other sectors and the subsector behind this appears to have been wholesale, retail trade, hotel and restaurants, which grew by 4.5%, followed by Transport, storage and communication as well as general government services (see Figure 6). During the period 2005 to 2008, these services subsectors appear to have been performing better compared to period after 2010 (see Figure 6 below).
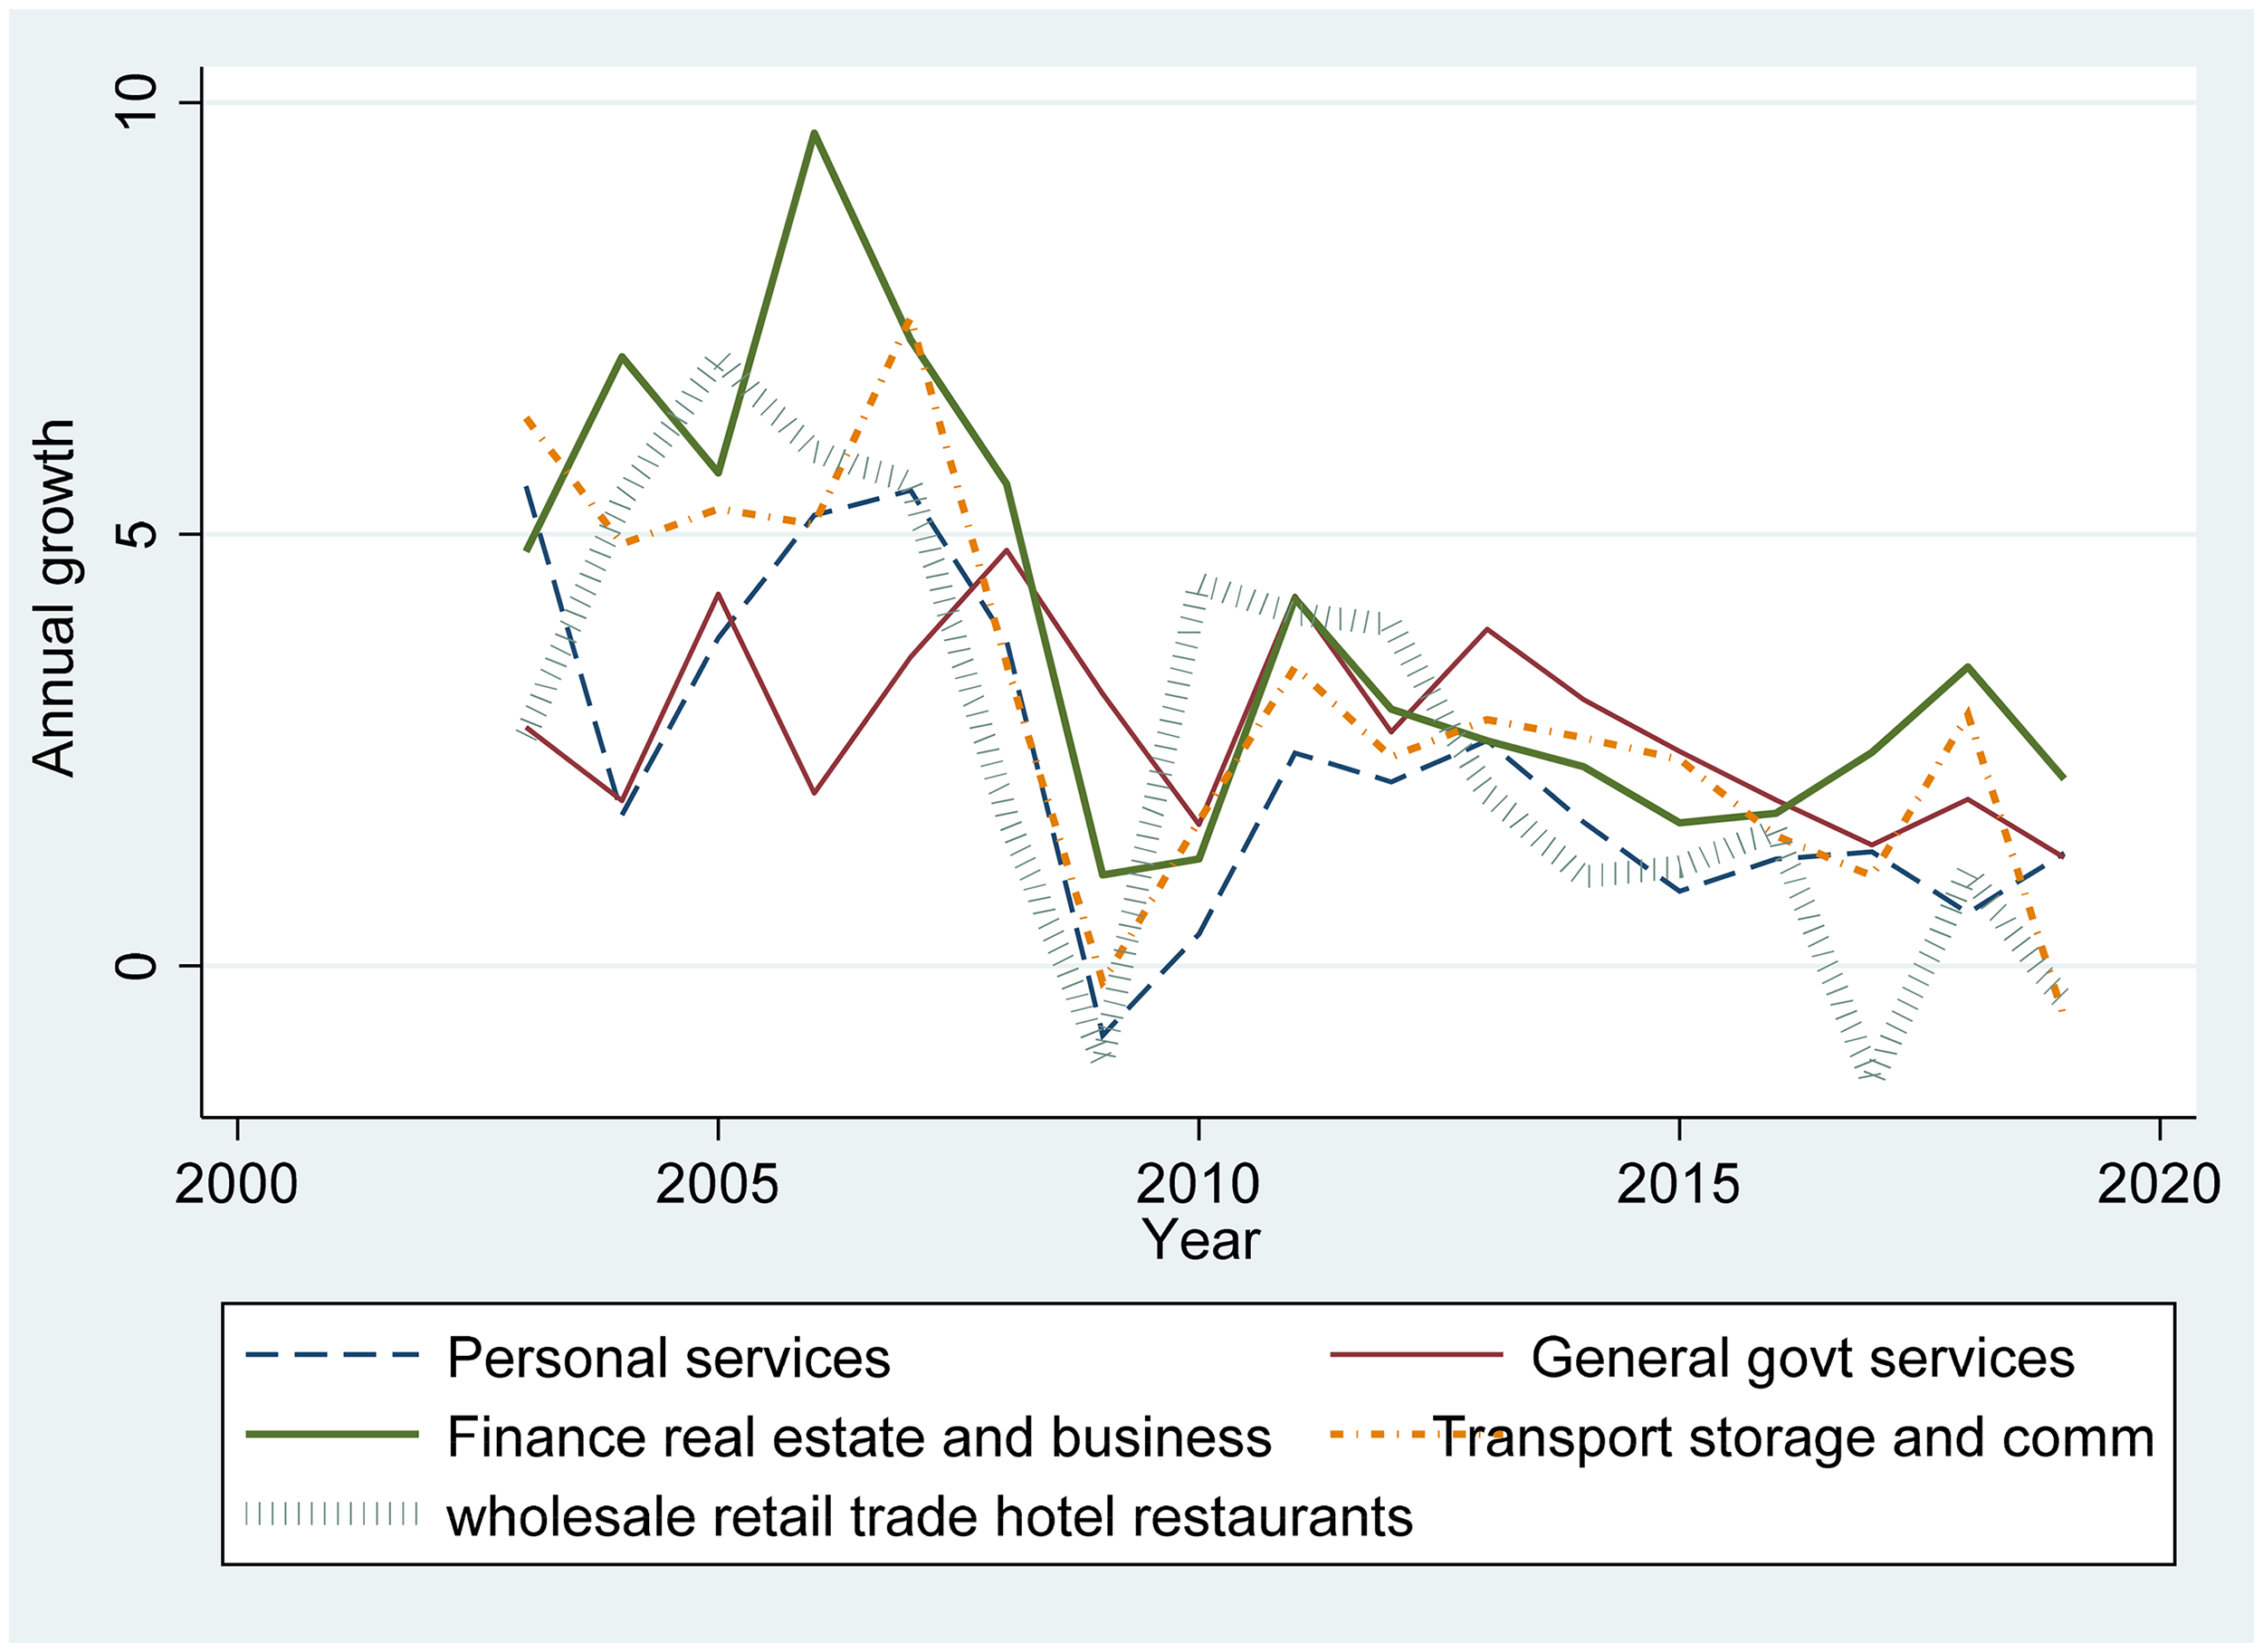
Annual Growth of the Services Subsectors in South Africa. Source: Quantec Easydata, 2025.
So, the growth in output over the period 2004 to 2008 was buoyed by the construction, manufacturing and services sectors, which performed better than the post-2010 period. We went on to investigate how this growth was distributed across the nine provinces of South Africa. Figure 7 shows that generally South Africa as a country performed well in 2004–2008 and badly post-2010, in 2011–2019.
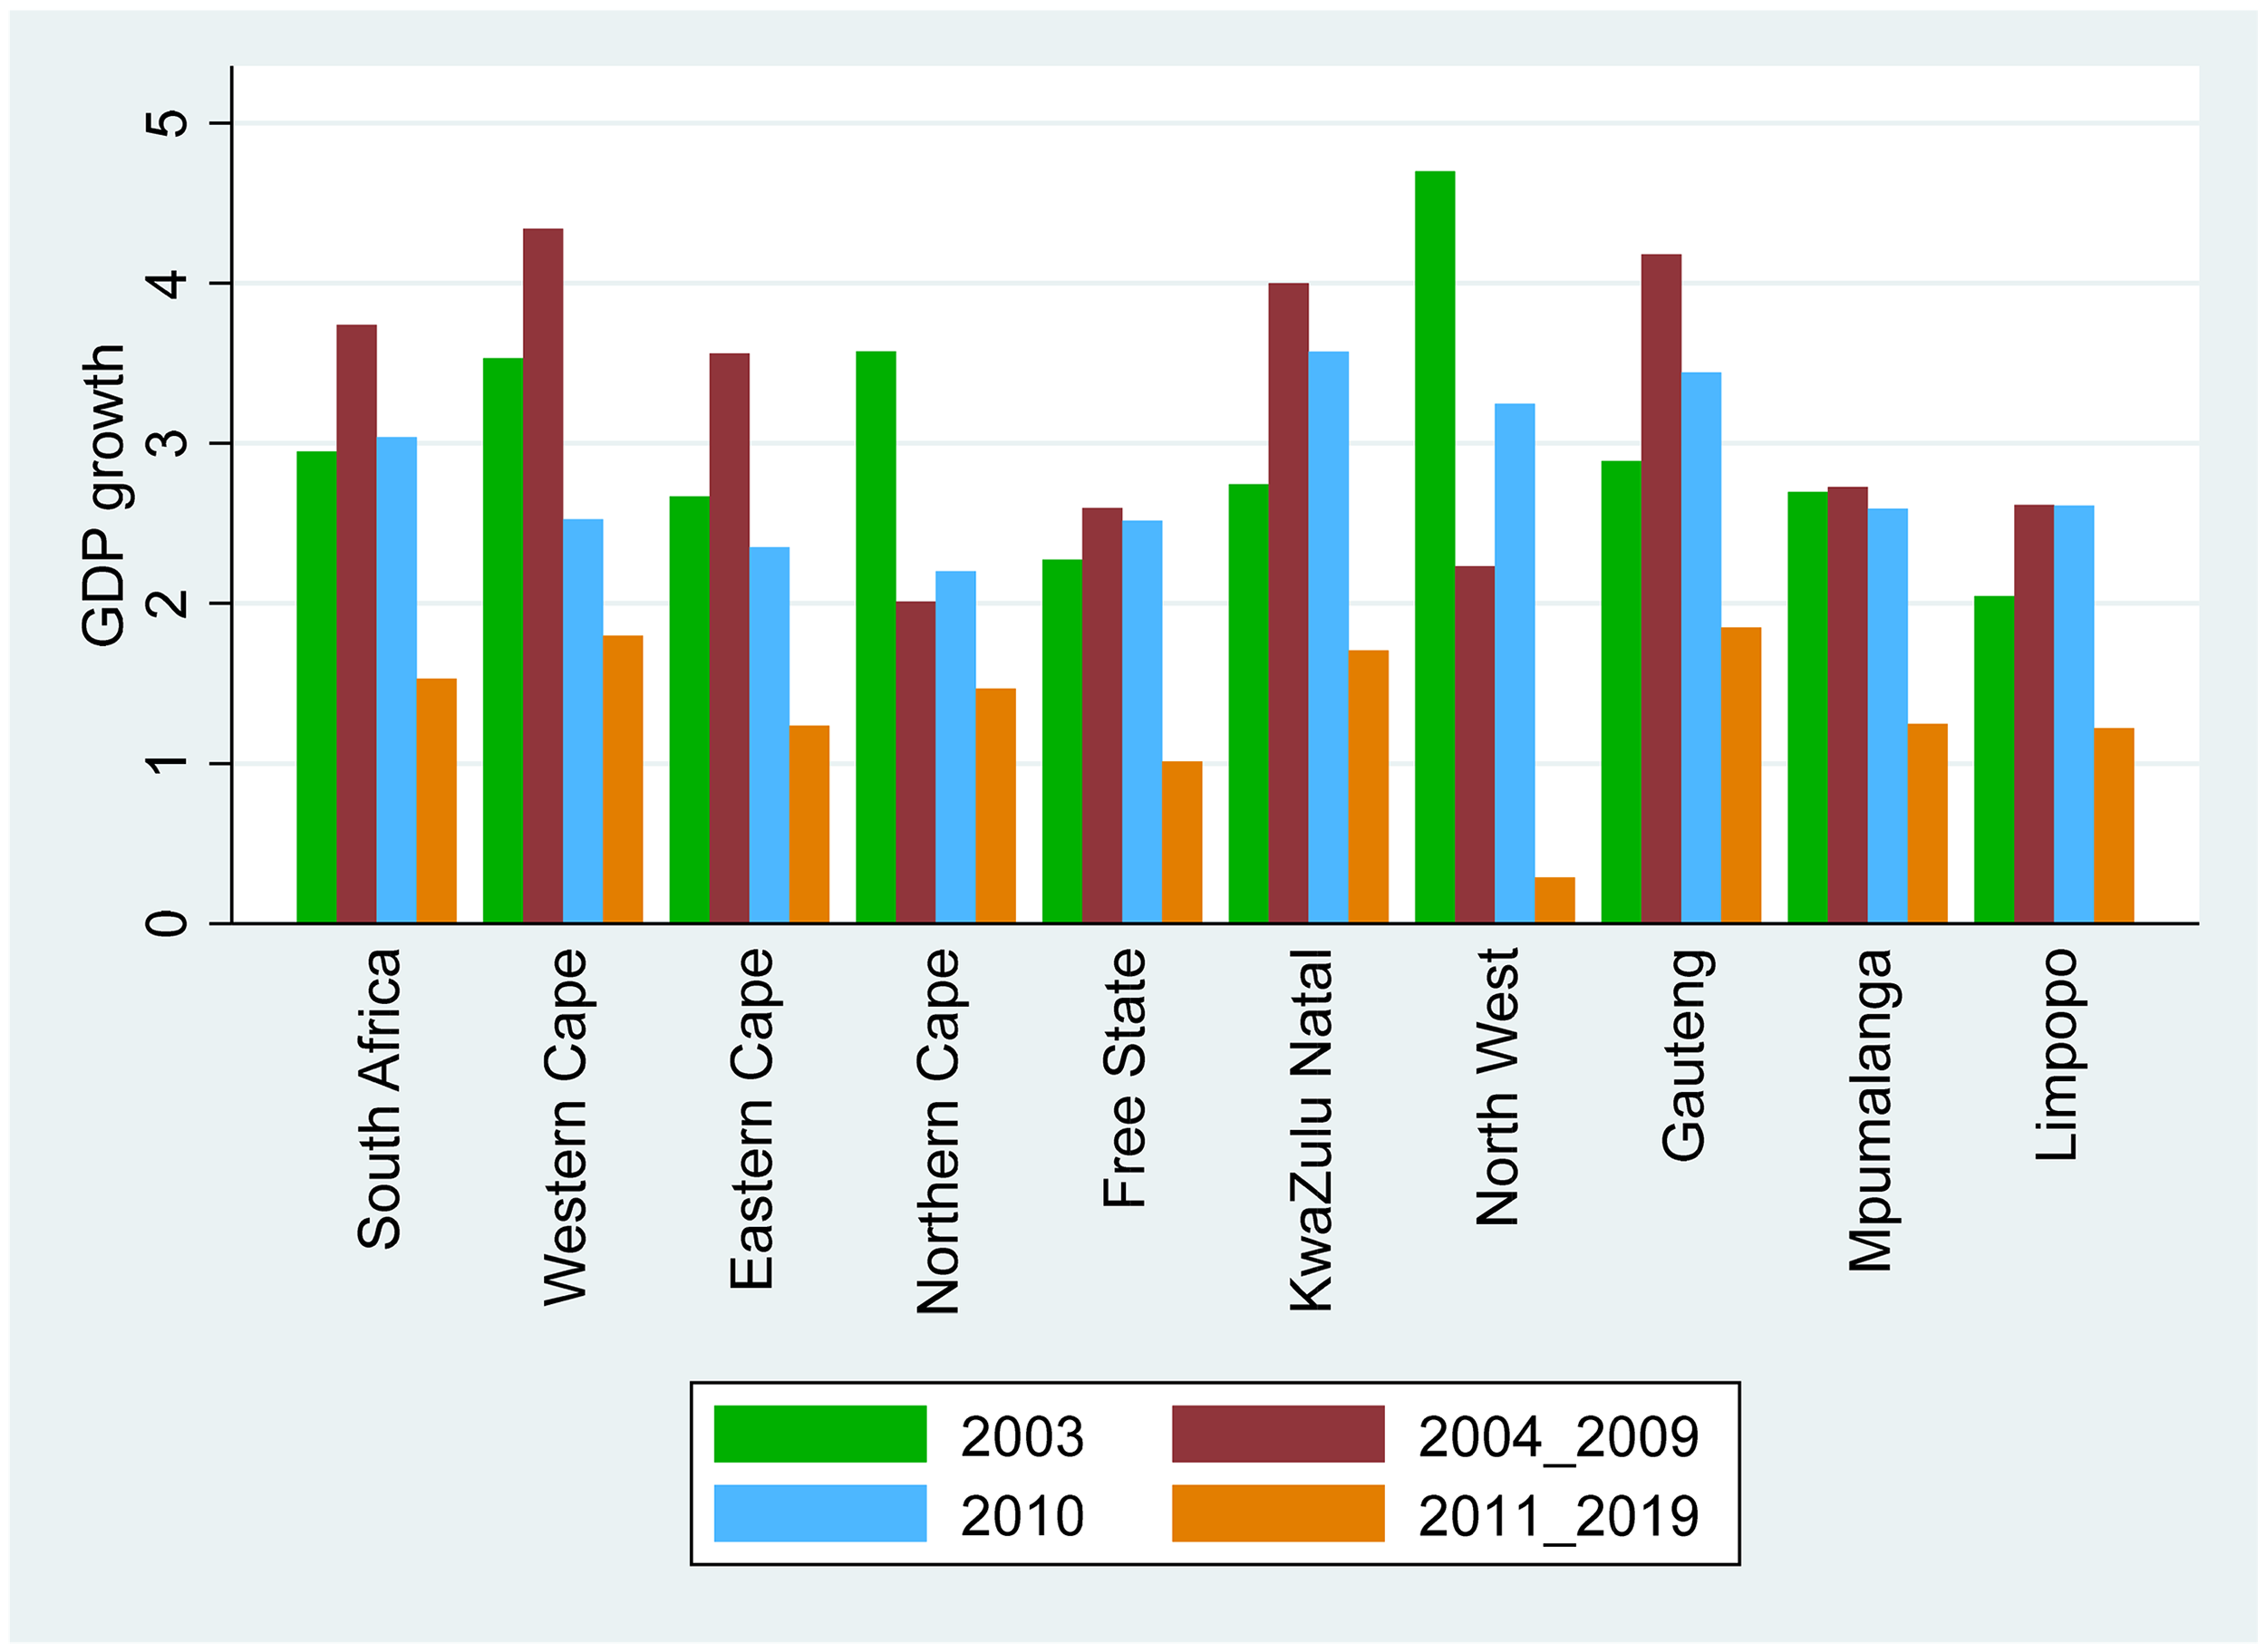
GDP Growth Across South African Provinces. Source: Own Calculation Using Quantec EasyData (2025) Data.
The performance of the country in 2010 was as good as it was in 2003. The provinces that benefited more than the others in 2010 include KwaZulu Natal and Gauteng (the country's economic hub), with the least beneficiary being the Northern Cape. However, over the 2004 −2008 period the main beneficiaries were the Western Cape, KwaZulu Natal, and Gauteng, with Northern Cape benefiting the least (see also Table 6 in the appendix). 15
Inferences and Robustness Checks
To check the reliability of the results presented above for GDP per capita using both 2010 and 2004 as treatment years, we carry out falsifications tests in the form of in-space and in-time placebo tests (See Figure 19). For the in-space placebo tests, we conduct a fake treatment by moving South Africa into the donor pool and iteratively estimating the treatment effect for each country in the donor pool. We expect the untreated countries not to be significantly affected by the FIFA World Cup event.
We calculated the ratio (R) of post-treatment mean squared prediction error (MSPE) to pre-treatment MSPE (Cunningham, 2021; Matta et al., 2019). The ratio is calculated for each country in the sample: the treated country and those in the donor pool. For South Africa, we expect the pre-treatment MSPE to be very small and the posttreatment MSPE to be quite significant compared to countries in the donor pool. For year 2004, using all control units, the probability of obtaining a post/pretreatment MSPE ratio as large as South Africa was 0.022 whilst excluding control units with pretreatment MSPE two times larger than the treated unit, the probability of obtaining a post/pretreatment MSPE ratio as large as South Africa's is 0.0833. In the case of 2010, these two probabilities were 0.0278 and 0.0625, respectively.
These results suggest that based on the SCM estimator we can credibly identify the treatment effect on the South African economy because fake treatments especially for year 2010 are larger than the treatments effects for South Africa. The 2010 tests were done using a cutoff of two and significance level of six. Even though seven covariates were used for optimal weighting, about 30 countries were used to create optimal unit weights with largest weights coming from Brazil (31.5%), Iran (21.7%), Morocco (15.3%) and Botswana (14.3%). The average treatment effect over the posttreatment period was negative and equal to −$401.0723.
The right-sided (left-sided) p-value of the treatment effect for a particular period is defined as the frequency that the placebo effects are greater (smaller) than or equal to the treatment effect. If the estimated treatment effect is positive, then the right-sided p-value is recommended; whereas the left-sided p-value is recommended if the effect is negative, as is the case here. In the case of 2004 treatment year, the treatment effect was positive for the years 2005 up to 2007 and then became negative in 2008 going forward. The p-values during some of the years when the treatment effect was positive were significant, the same applies to the years when the treatment effects were negative after 2010 (see Table 4). The results of the in-time placebo tests are presented in Figures 8 and 9.
Placebo Tests with Fake Treatment Units Using 2010 and 2004. Source: Own Calculation Using WDI (2025) Data.
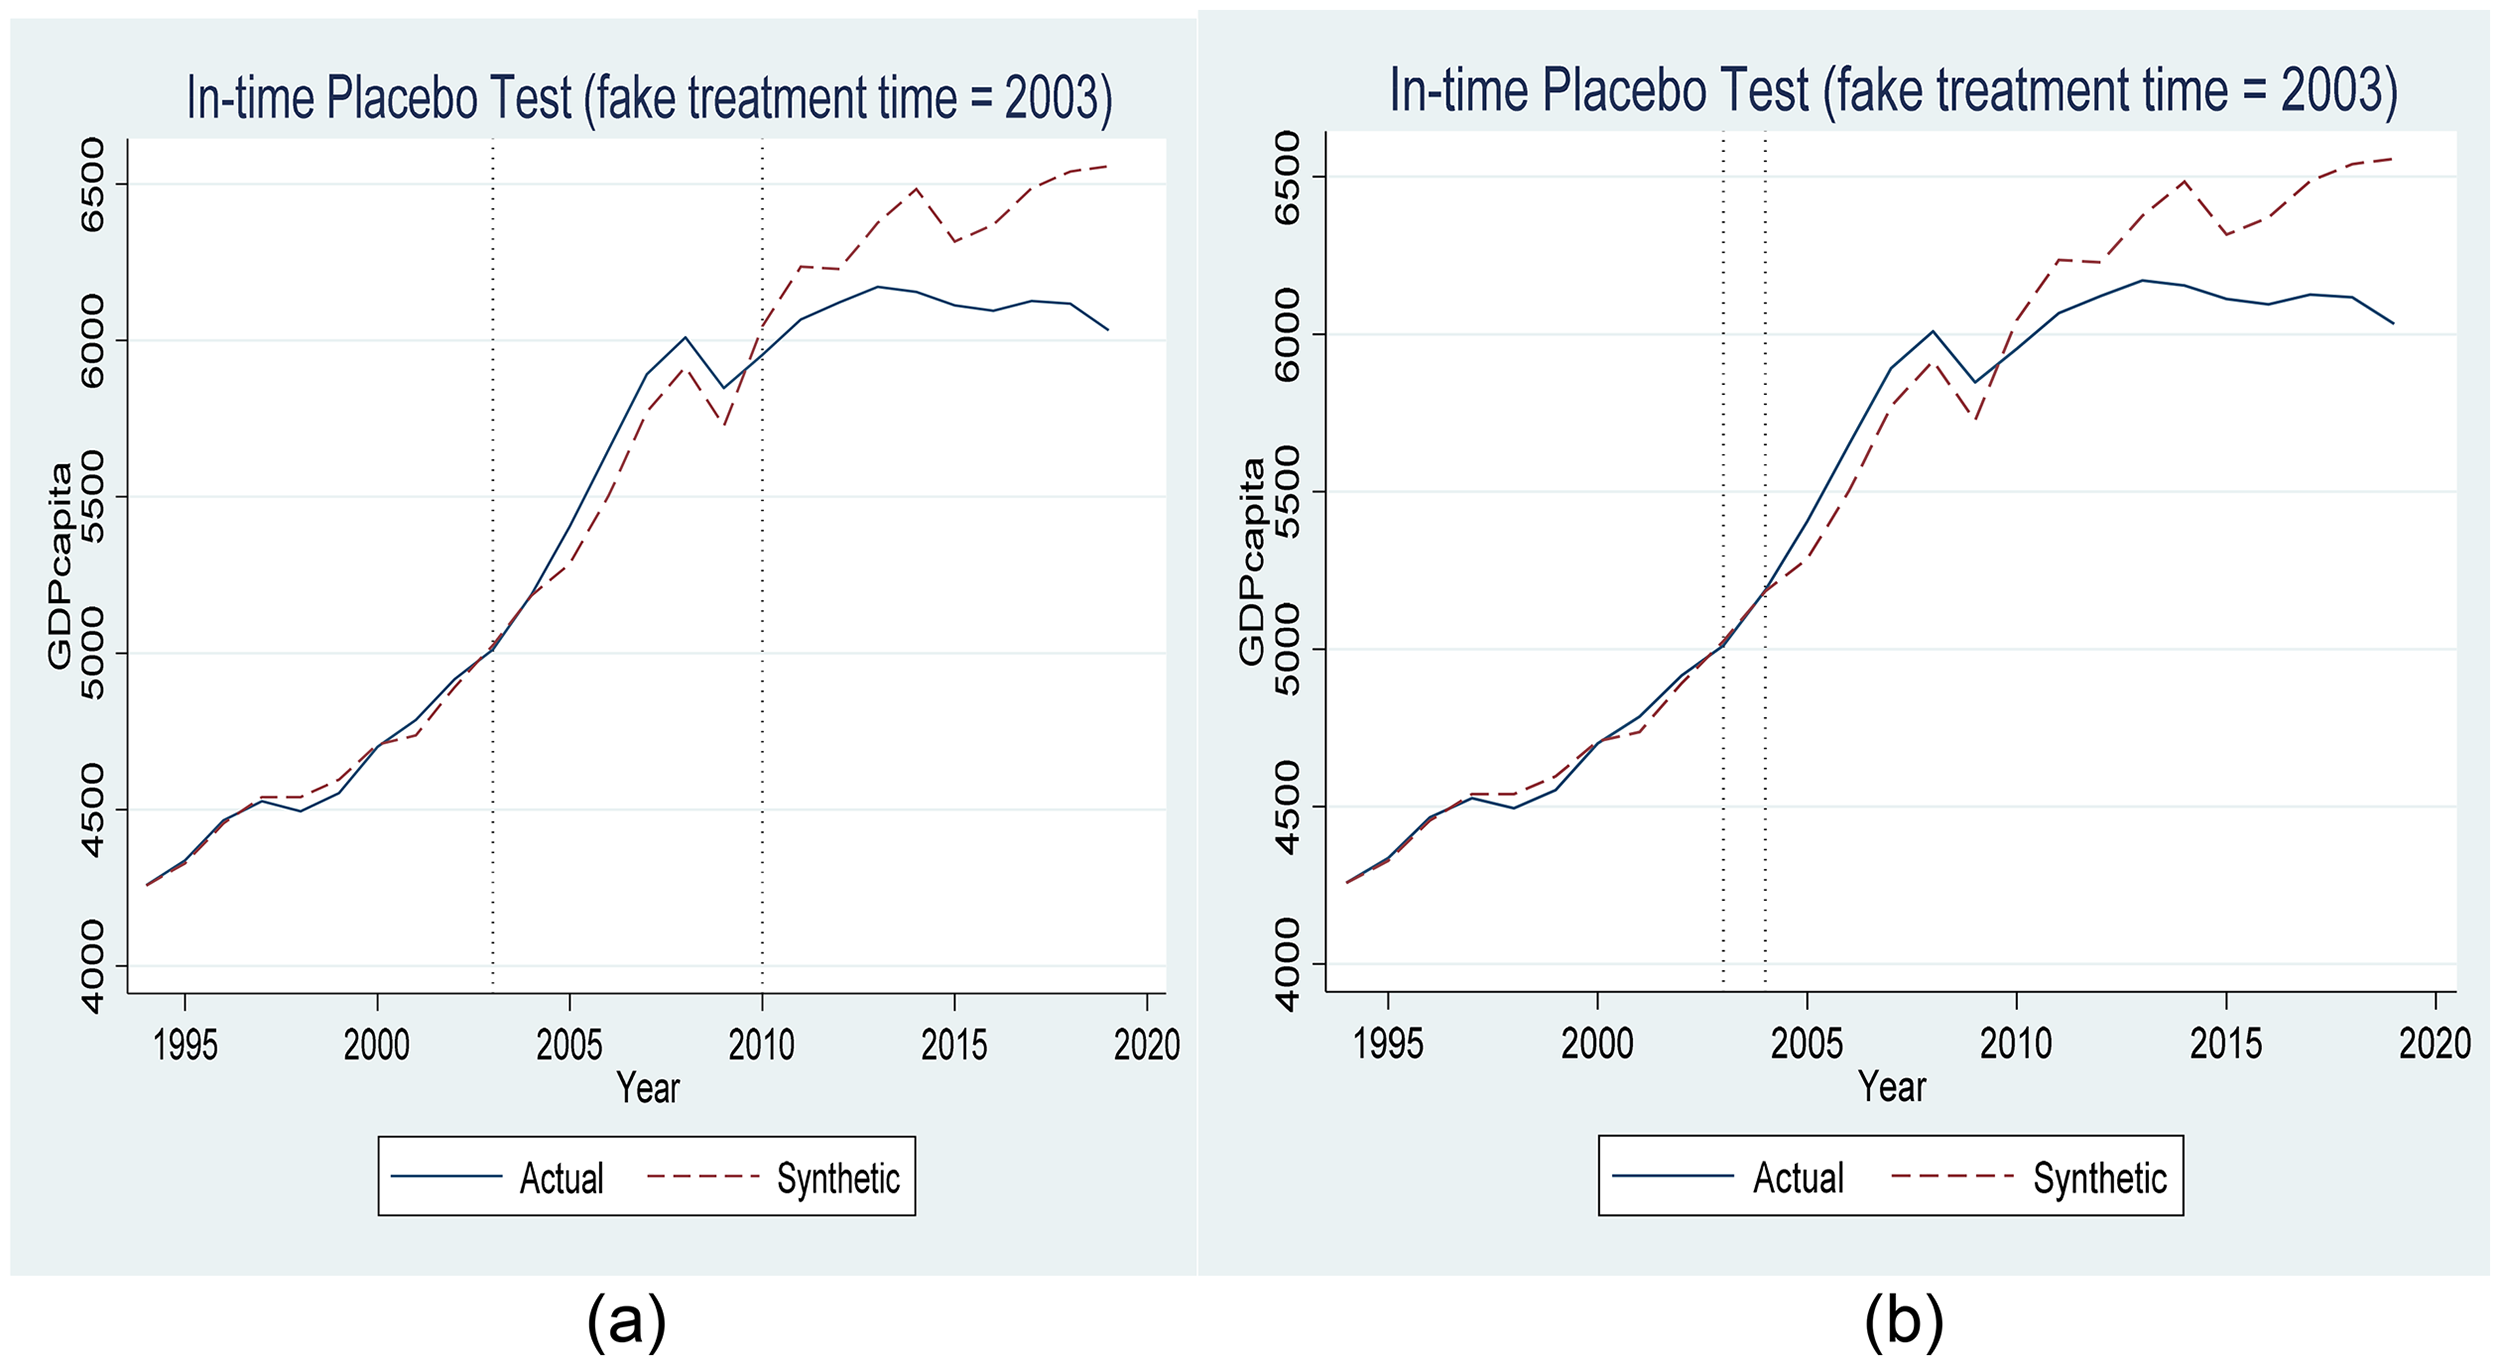
Placebo Tests with Fake Treatment Time Using 2003 as Treatment Year. Source: Own Calculation Using WDI (2025) Data.
In-Space Placebo Test Results Using Fake Treatment Units and 2004 as Treatment Year.
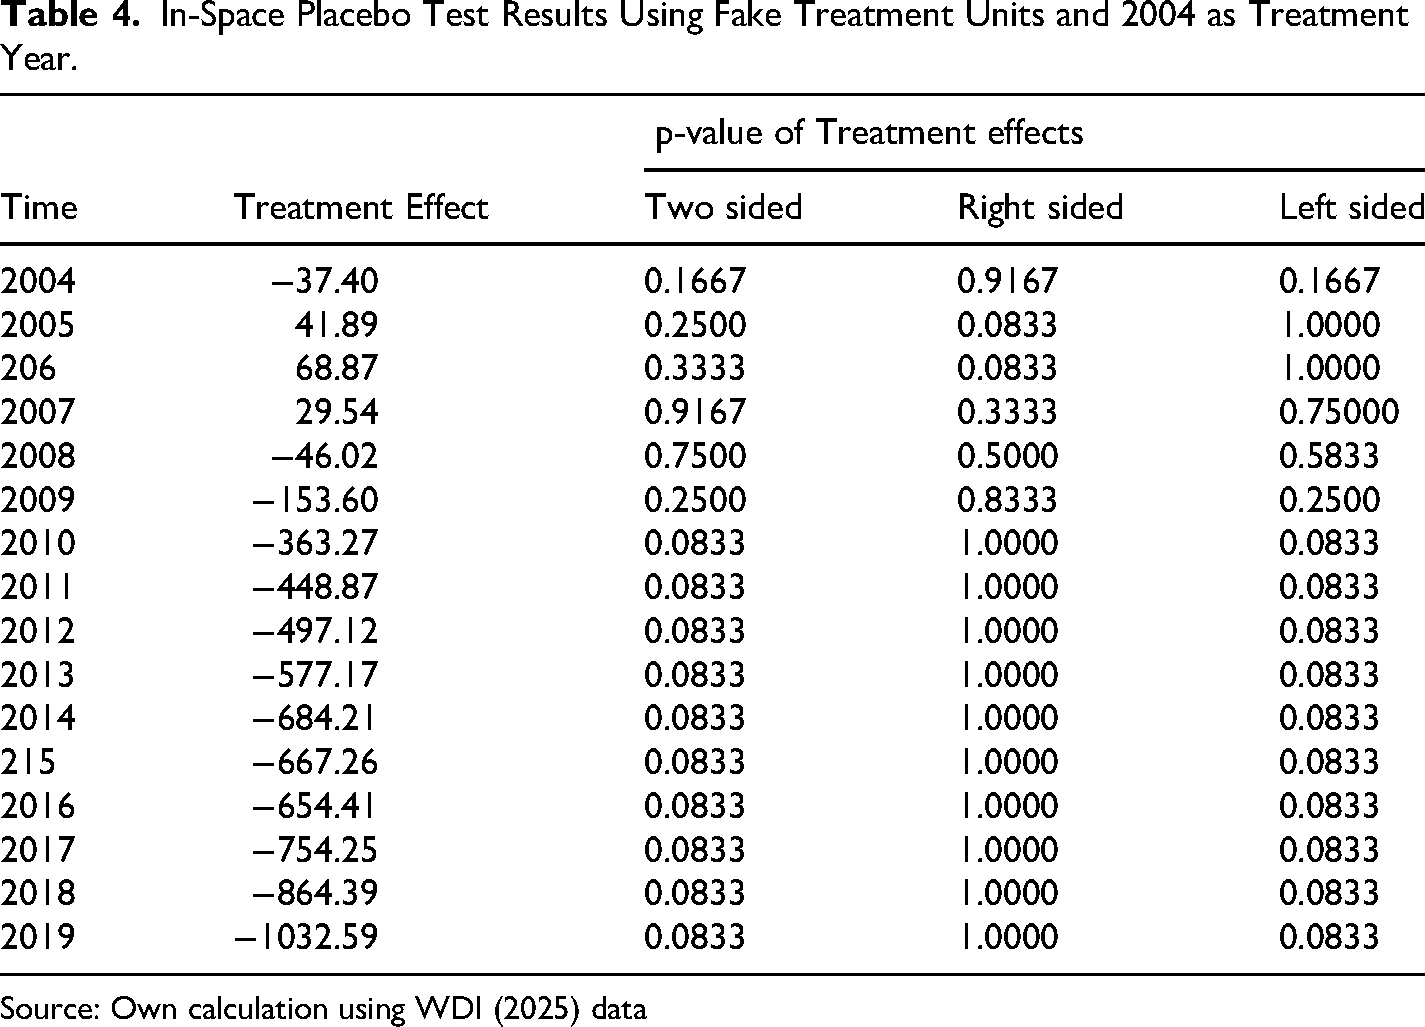
Source: Own calculation using WDI (2025) data
The in time placebo tests done by changing the treatment year to 2003 before the 2010 World Cup host was announced are presented in Figure 9. For example, the in-time placebo test conducted using 2003 as the treatment year (instead of 2004 or 2010) shows lack of good matching before the 2003 fake treatment year. There appears to be some noticeable placebo effects before the treatment years for example between the period 1997 and 2003. Perfect prior matching up to year 1997 is misleading because even if the fake treatment was capturing the Rugby World Cup and the Africa Cup of Nations tournaments hosted by South Africa, one would expect matching prior to these periods. This also shows that the fake treatment is also not capturing even the Cricket World Cup that South Africa co-hosted with Zimbabwe and Kenya. The leave-one-out placebo tests where one of the control units with non-zero weight is left out were also done and the results are qualitatively similar, no matter which control unit with a nonzero weight is excluded (see Figures 20a to 20d in the appendix). What the leave-one-out (Loo) results show is that the estimated treatment effects are not driven by any particular control unit and are therefore robust.
Impact on Tourism
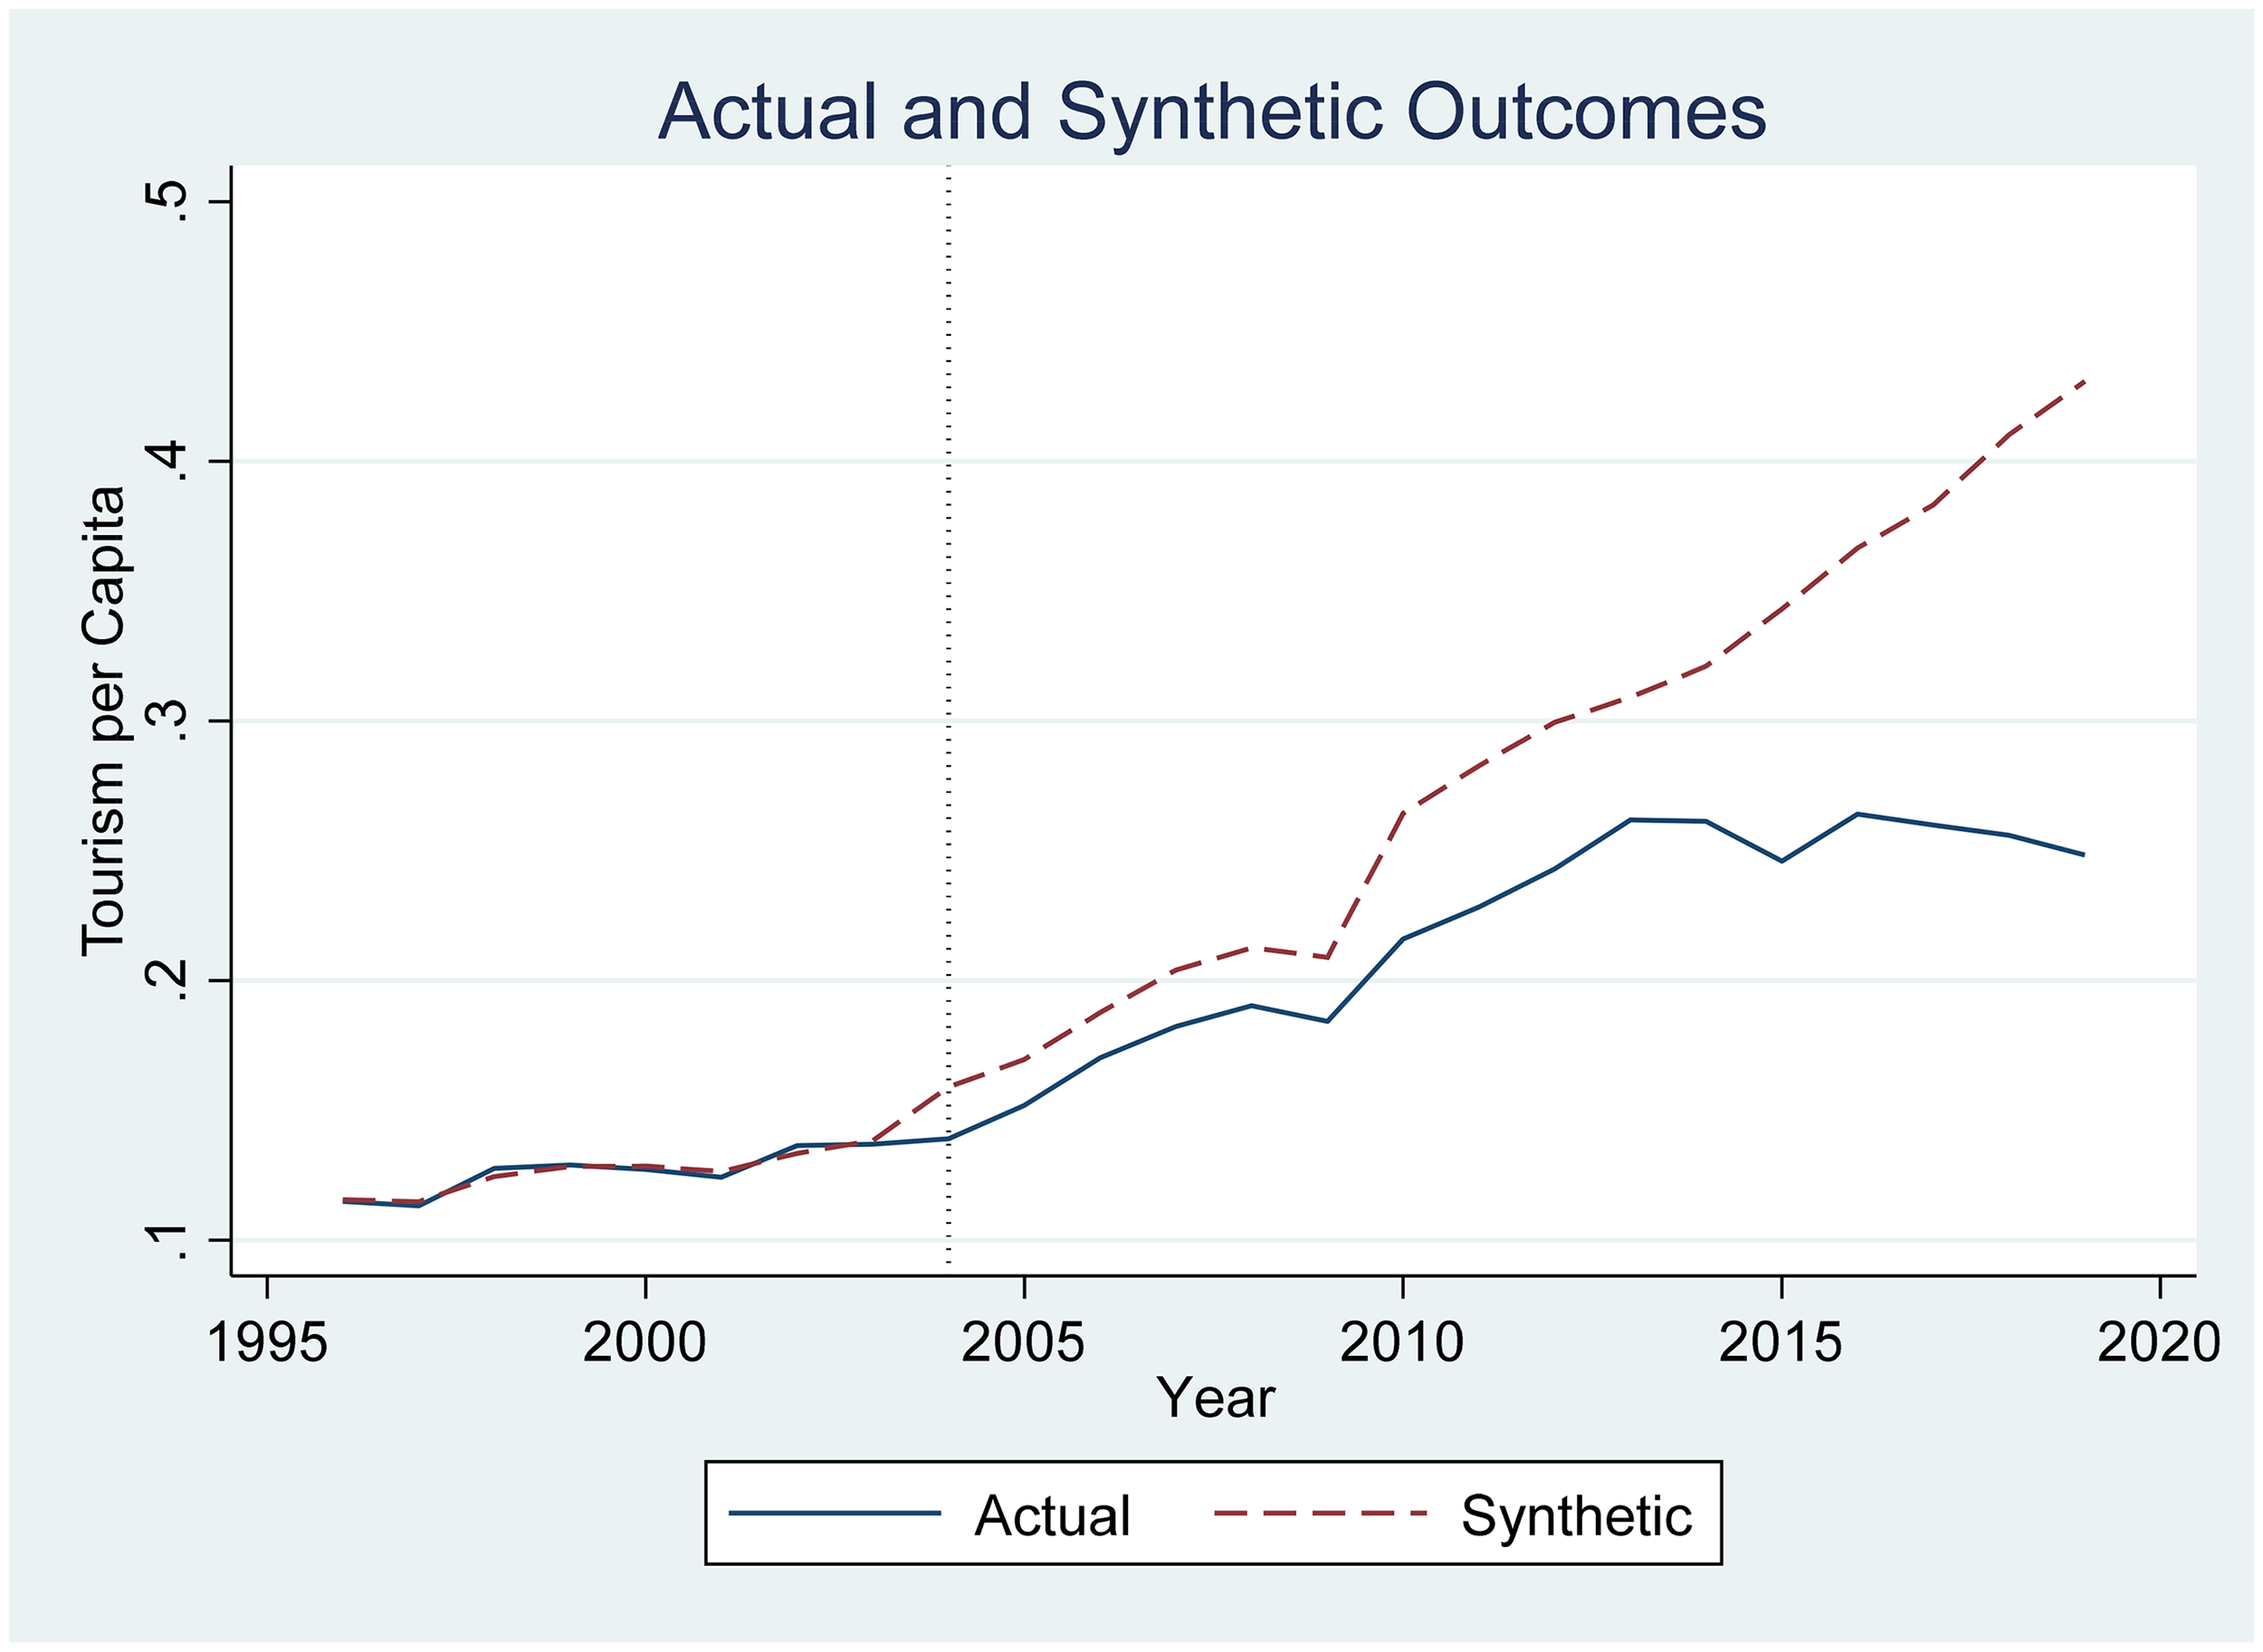
In addition to analysing the impact on GDP per capita, we went further and looked at how the 2010 World Cup impacted inbound tourism to South Africa. We followed the same approach as above when looking at GDP per capita and assumed that the treatment year was 2010 (see Figure 10 below). 16
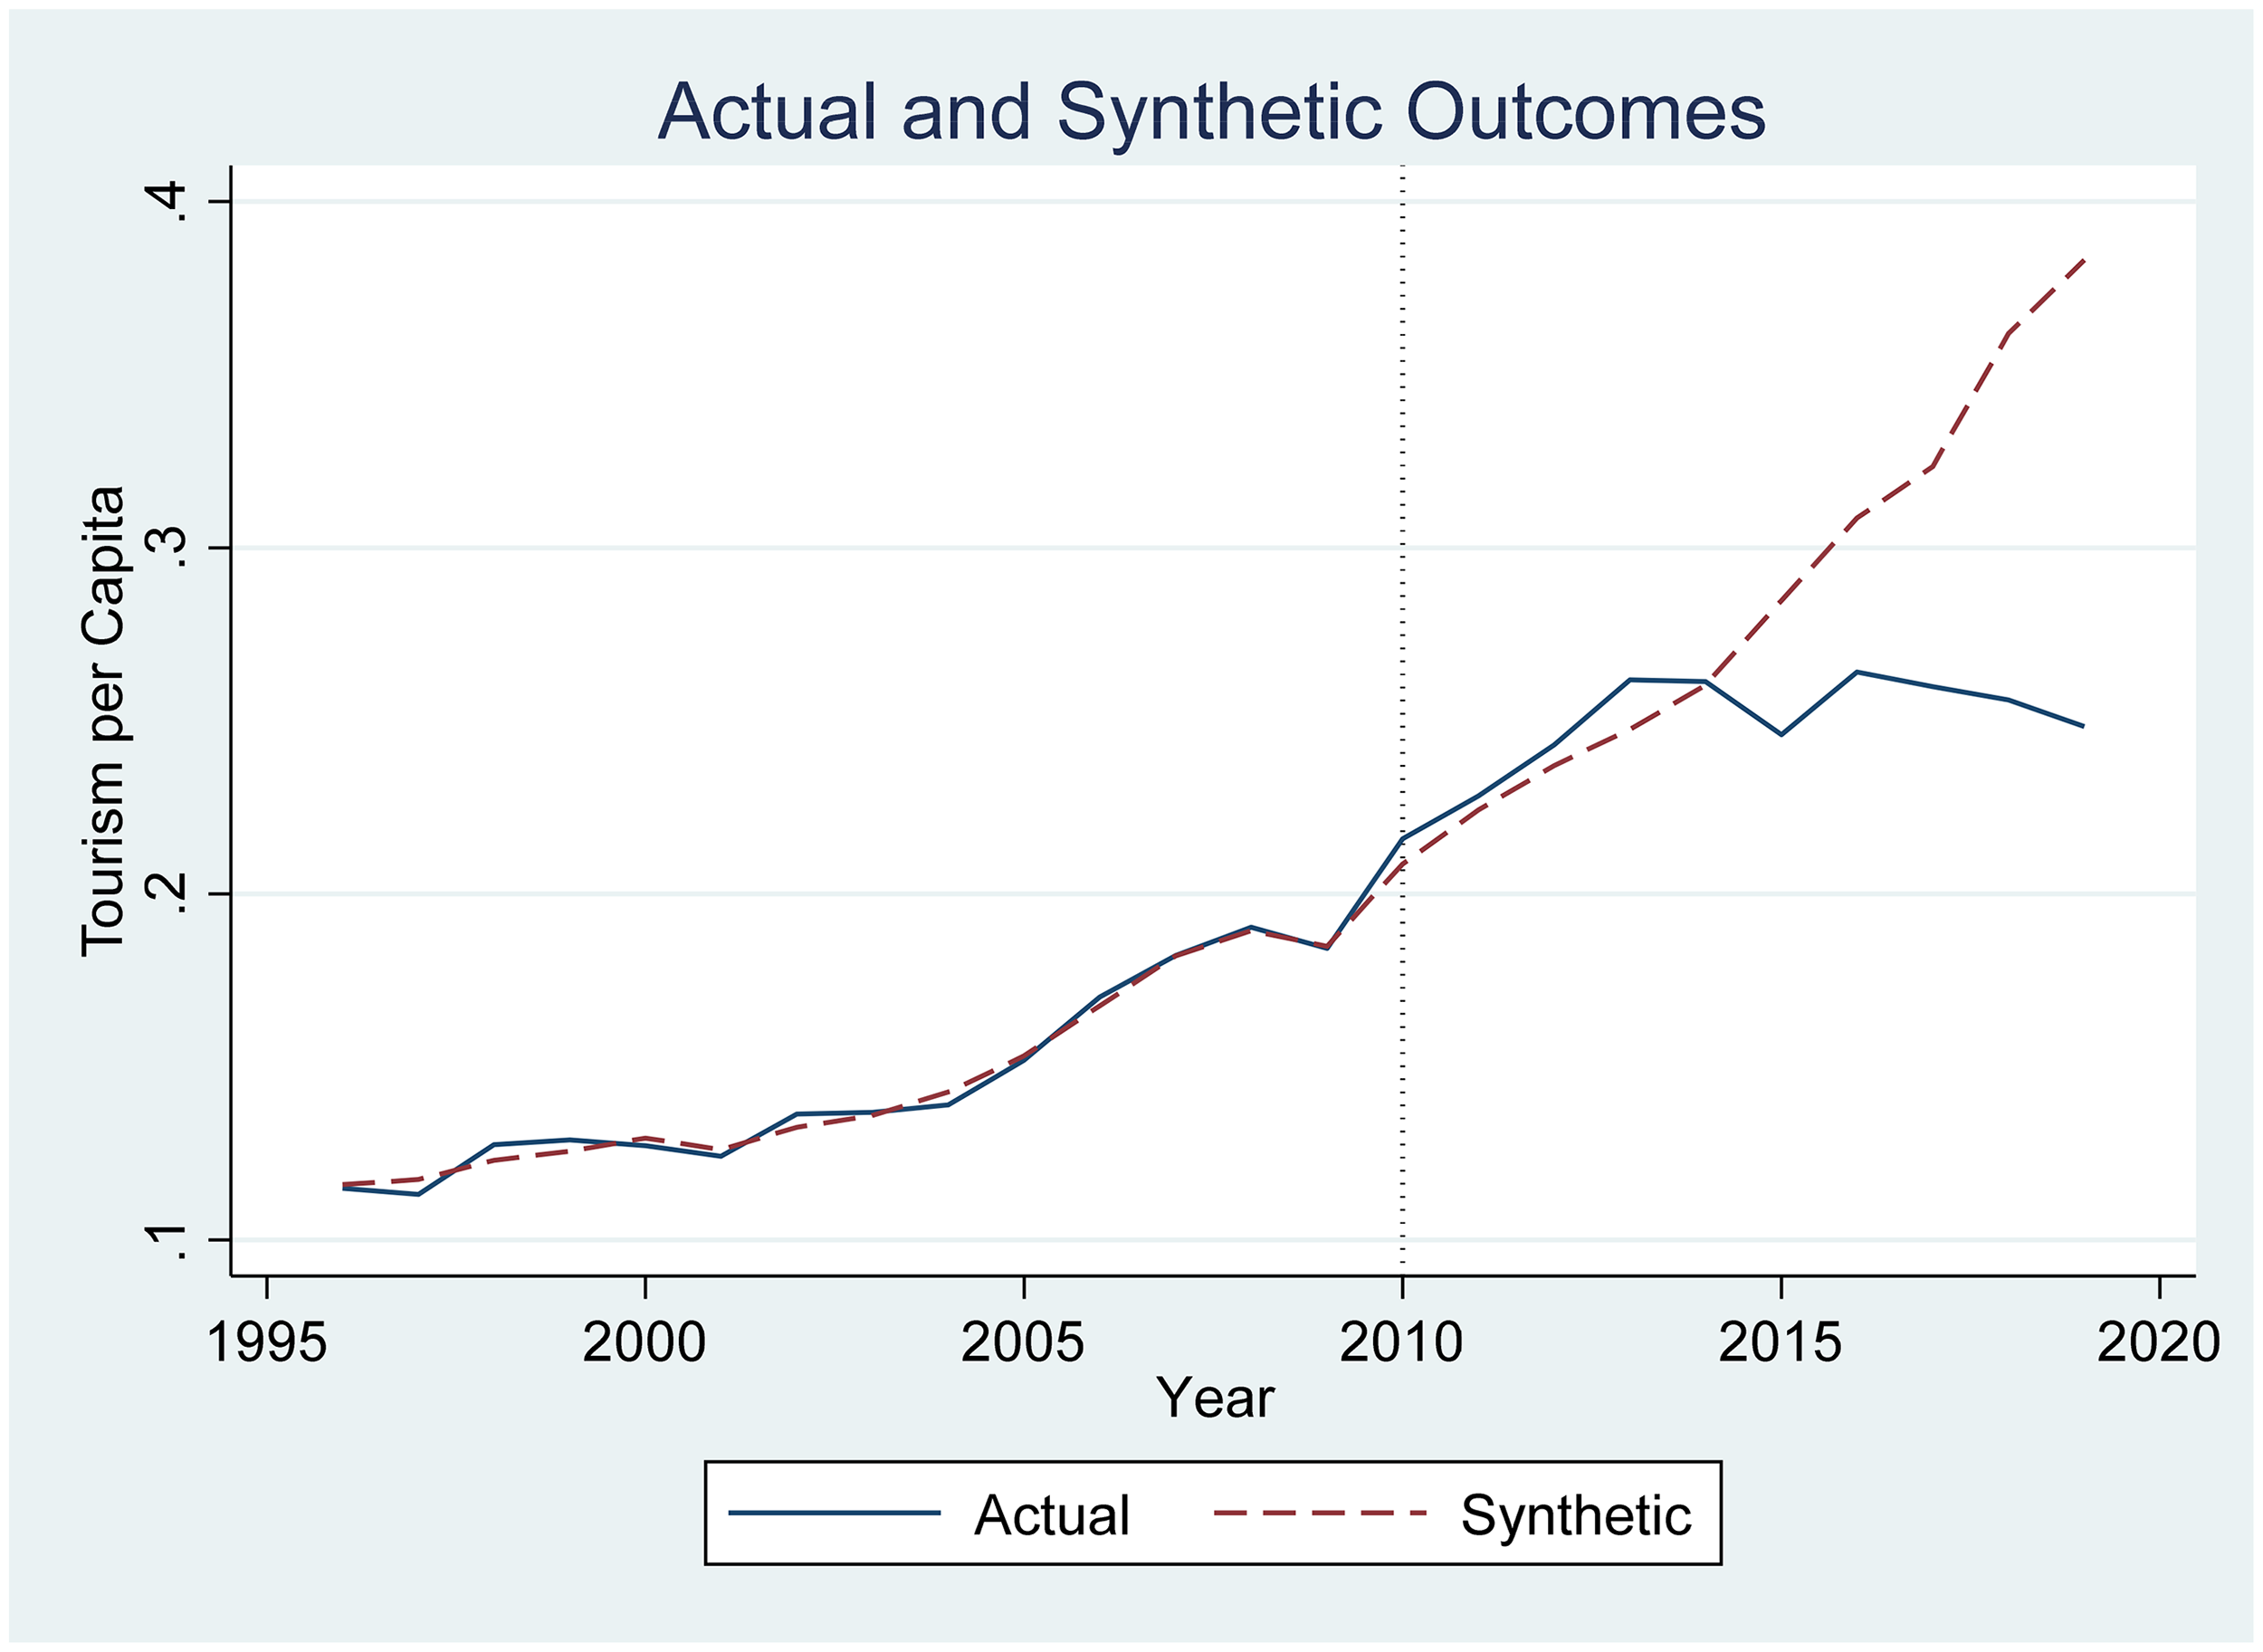
Impact on Inbound Tourism to South Africa Using 2010 as Treatment Year. Source: Own Calculation Using WDI (2025) Data.
Figure 10 shows that in 2010 there was an increase in the number of people who visited South Africa during the World Cup. However, it also appears that between the periods 2010 and 2014, actual South Africa outperformed synthetic South Africa in terms of international tourist arrivals. This could be due to the legacy effects of the World Cup. Figure 11 shows the actual gap between synthetic and actual South Africa over the study period. These results support findings by Brenke and Wagner (2007), Fourie and Santana-Gallego (2011), Baumann and Matheson (2018), Peeters et al. (2014) and Du Plessis and Maennig (2011).
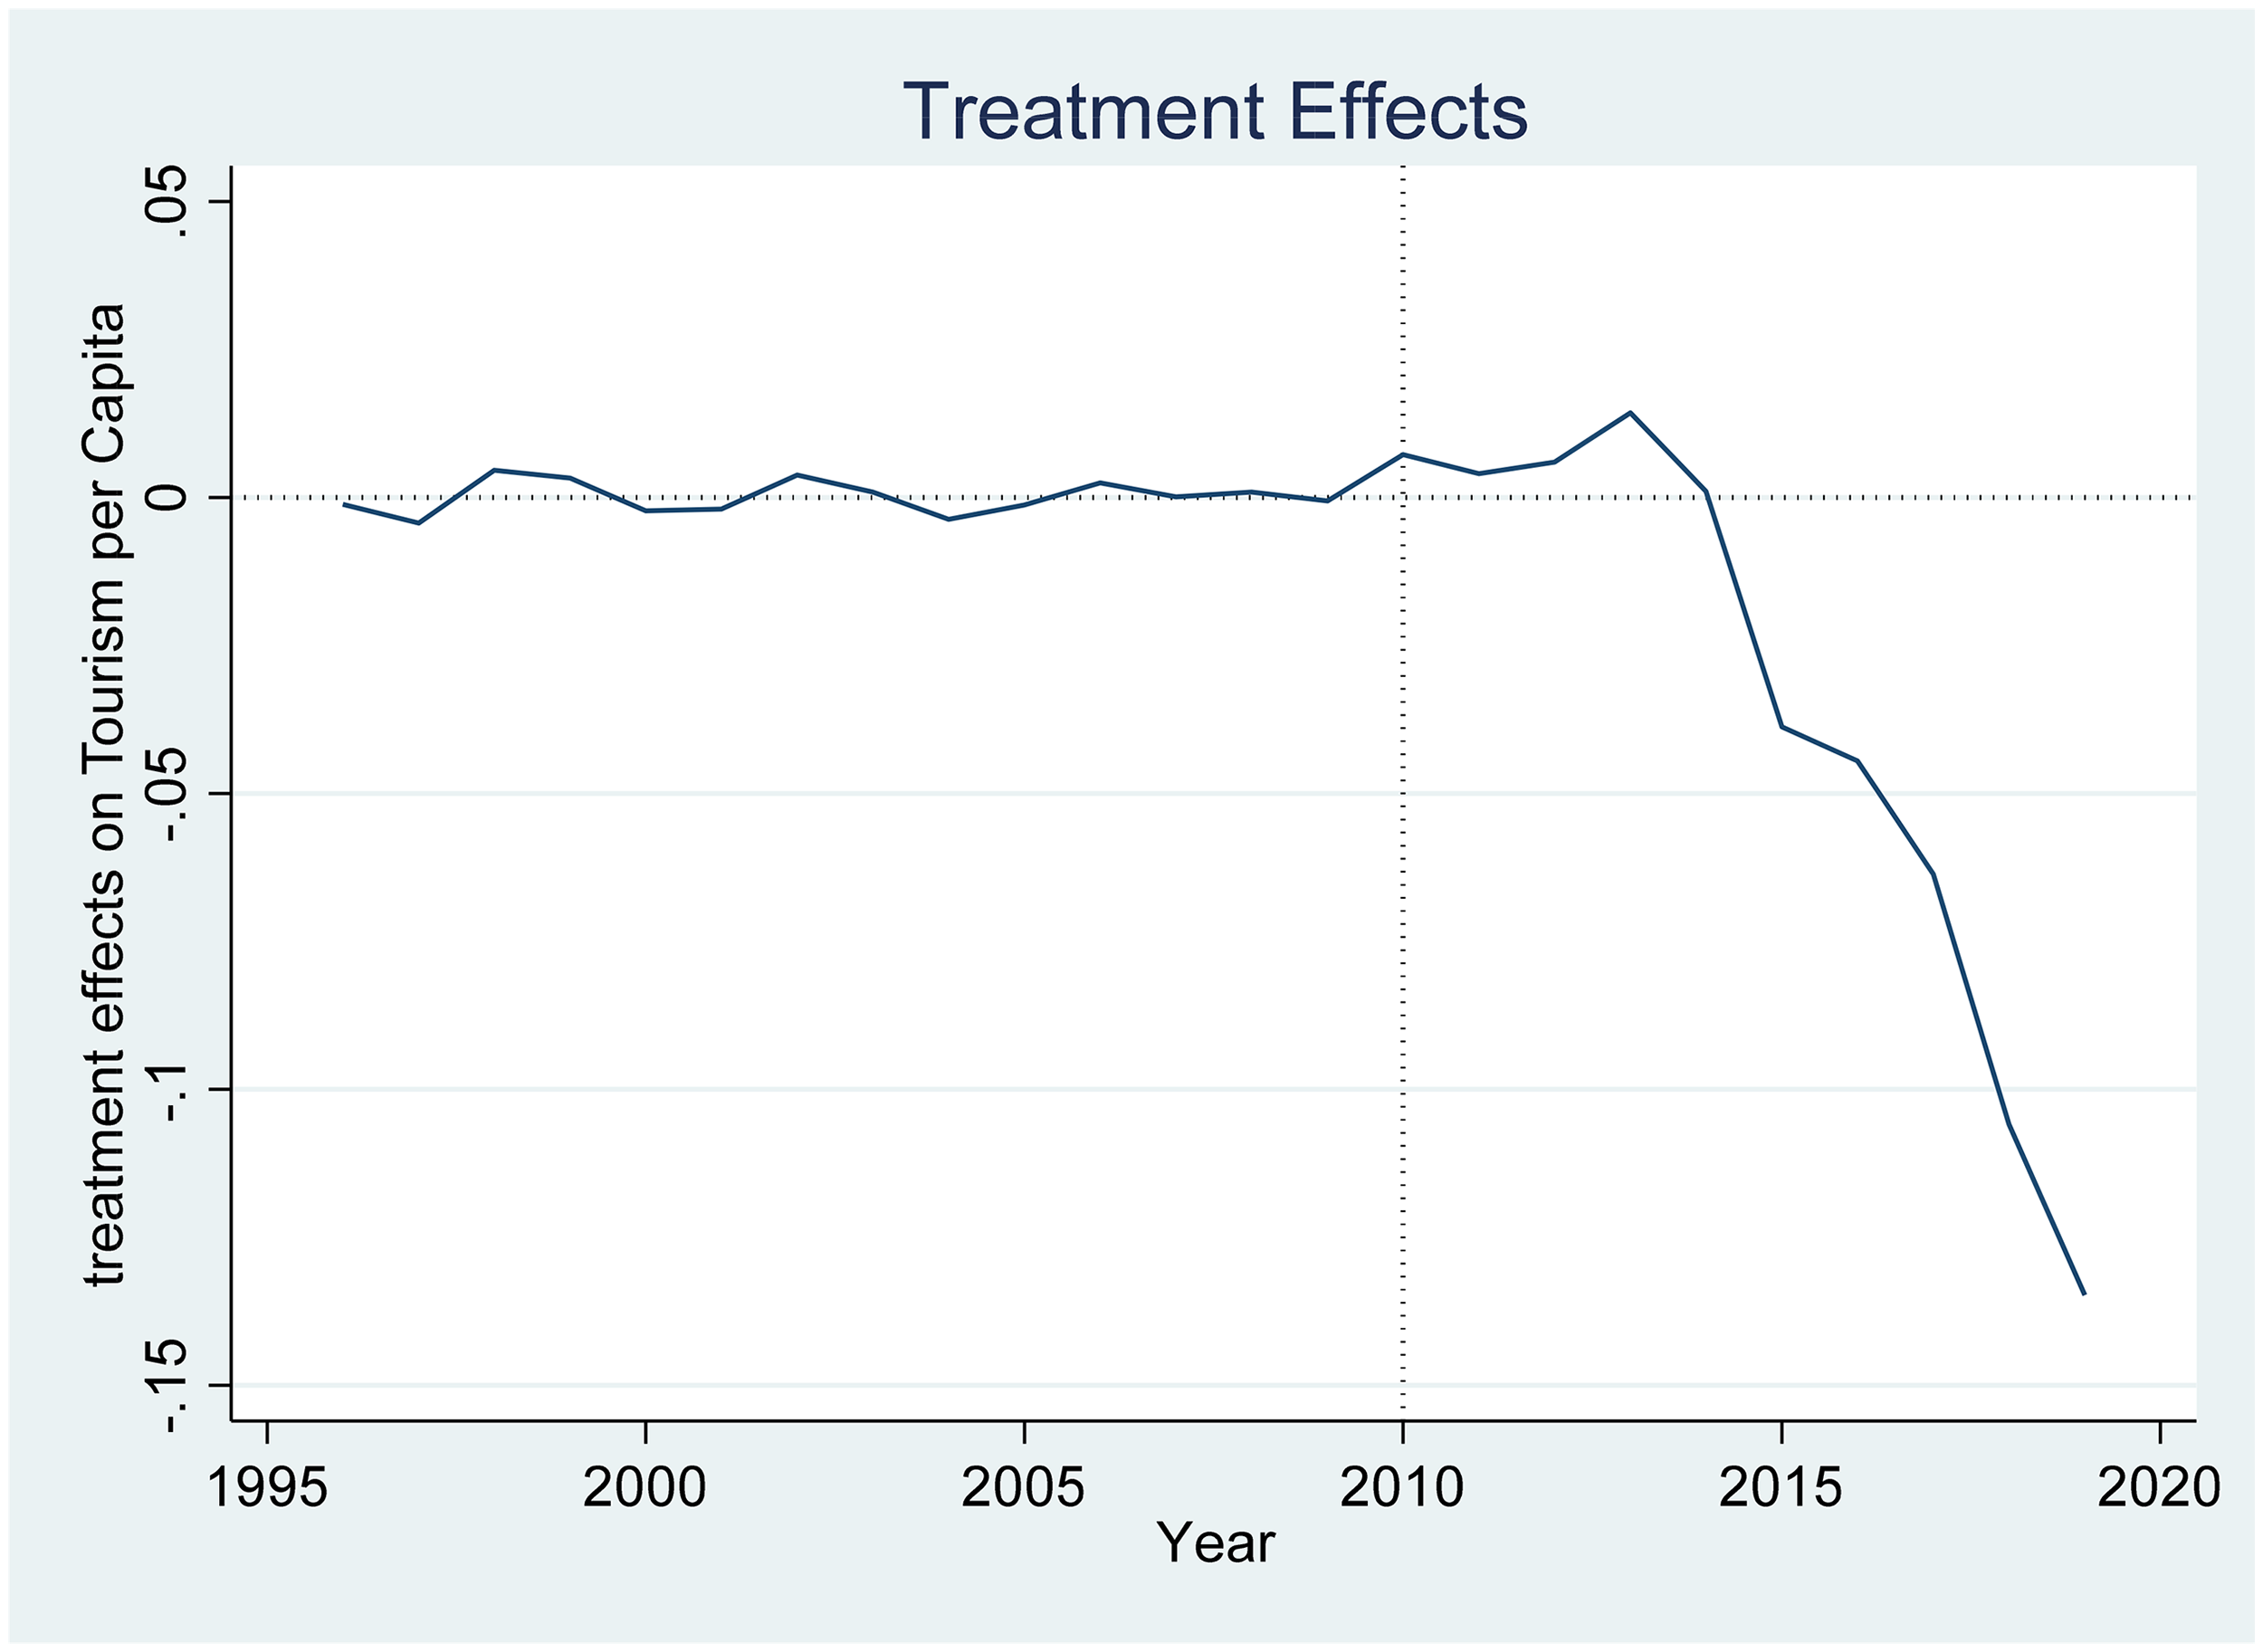
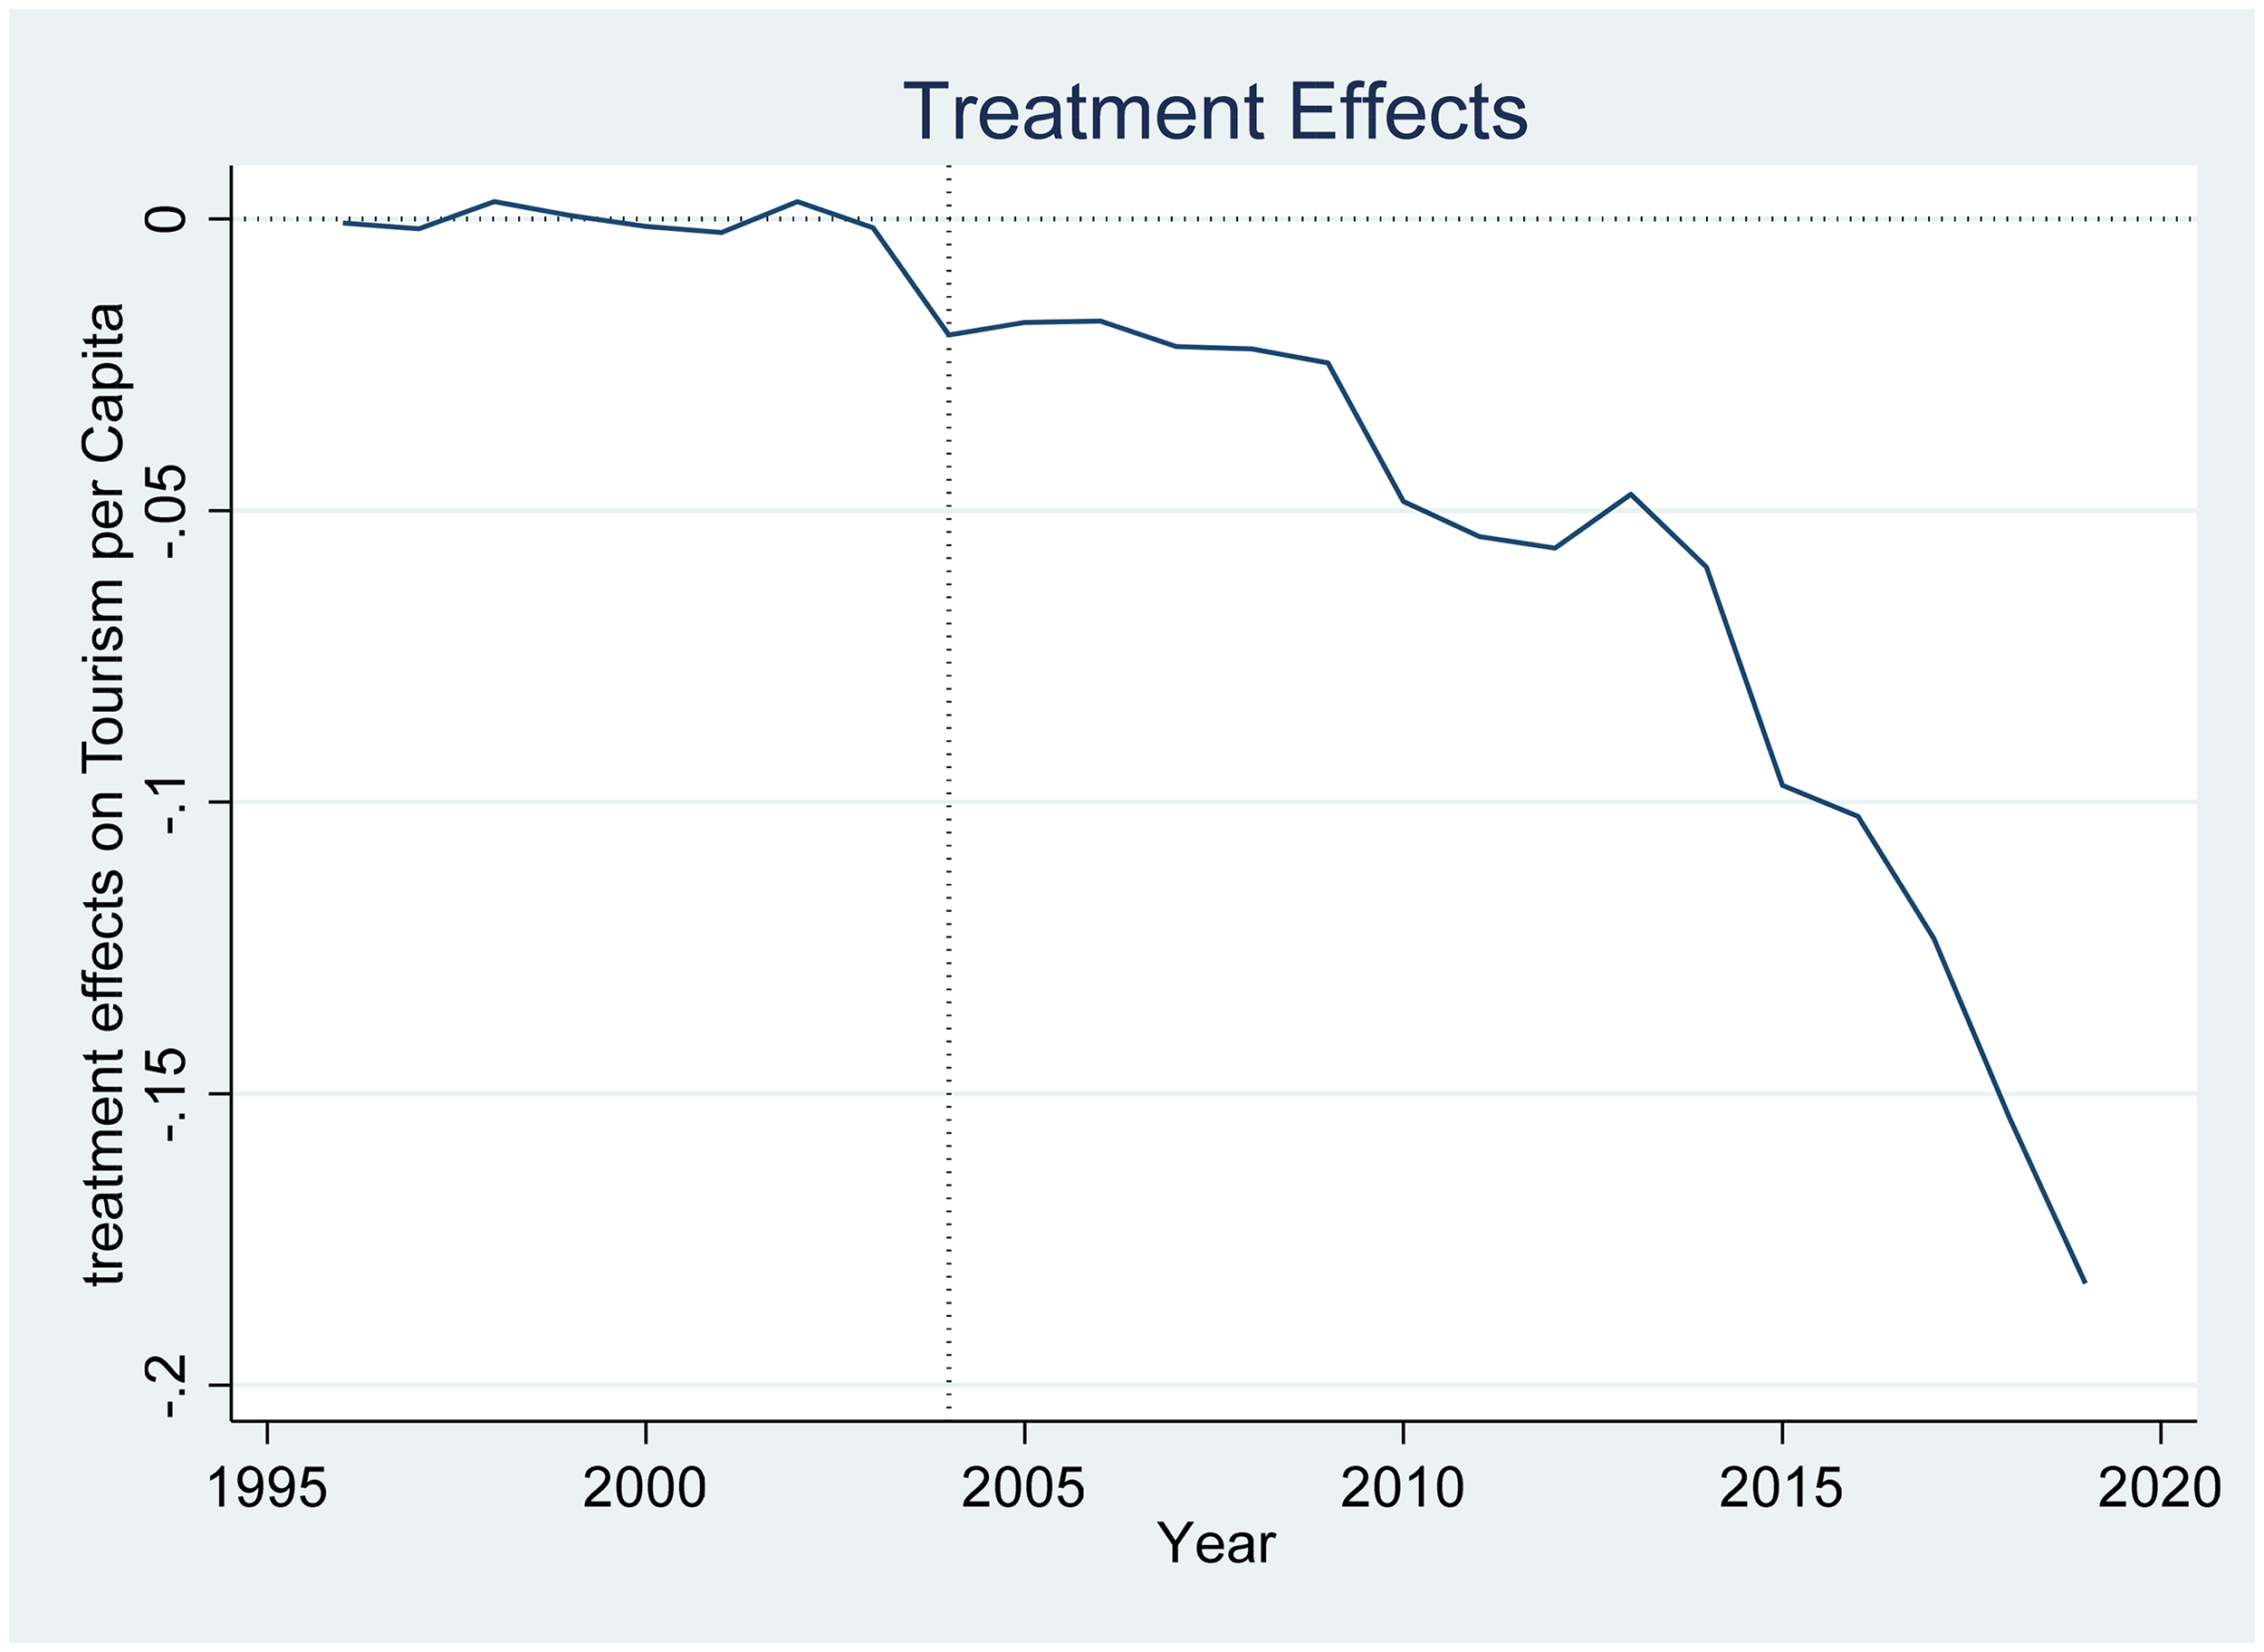
Inbound Tourism gap Using 2010 as Treatment Year. Source: Own Calculation Using WDI (2025) Data.
Figure 11, the gap graph, shows a small positive change in tourist inflows in 2010 that was followed by an upward trajectory. The inflow of international tourists probably created a hysteresis effect where some visitors fell in love with the country and decided to come and explore it further. Perhaps media attention also swayed tourists interest towards the country. We also changed the treatment year from 2010 to 2004, and the picture is as shown in Figures 12 and 13.
Impact on Inbound Tourism Using 2004 as Treatment Year. Source: Own Calculation Using WDI (2025) Data.
Tourism gap Using 2004 as Treatment Year. Source: Own Calculation Using WDI (2025) Data.
The above two figures basically show a negative change in tourism inflows suggesting that the announcement of South Africa as the 2010 World Cup host did not spur international tourism arrivals. The worldwide publicity about South Africa after being announced as a host dented tourist inflows. This could be true if tourists’ attention was diverted to issues to do with crime and security and less on the beautiful flora and fauna, etc. Media attention on South Africa was also still growing in preparation for the World Cup.
Figure 14 shows that tourism arrivals have been declining since 2006 and only spiked in 2010 during the FIFA World Cup. For the period 2004 to 2009, average tourism arrivals growth per year was around 6% and jumped to 19% in 2010, with the average for the period post-2010 being 3% per annum. There was a huge decline in tourist visits in 2009 that also translated into a huge fall in tourism receipts. The change from 2009 to 2010 could be due to the substitution effect where non-soccer tourists were replaced by soccer loving international fans.
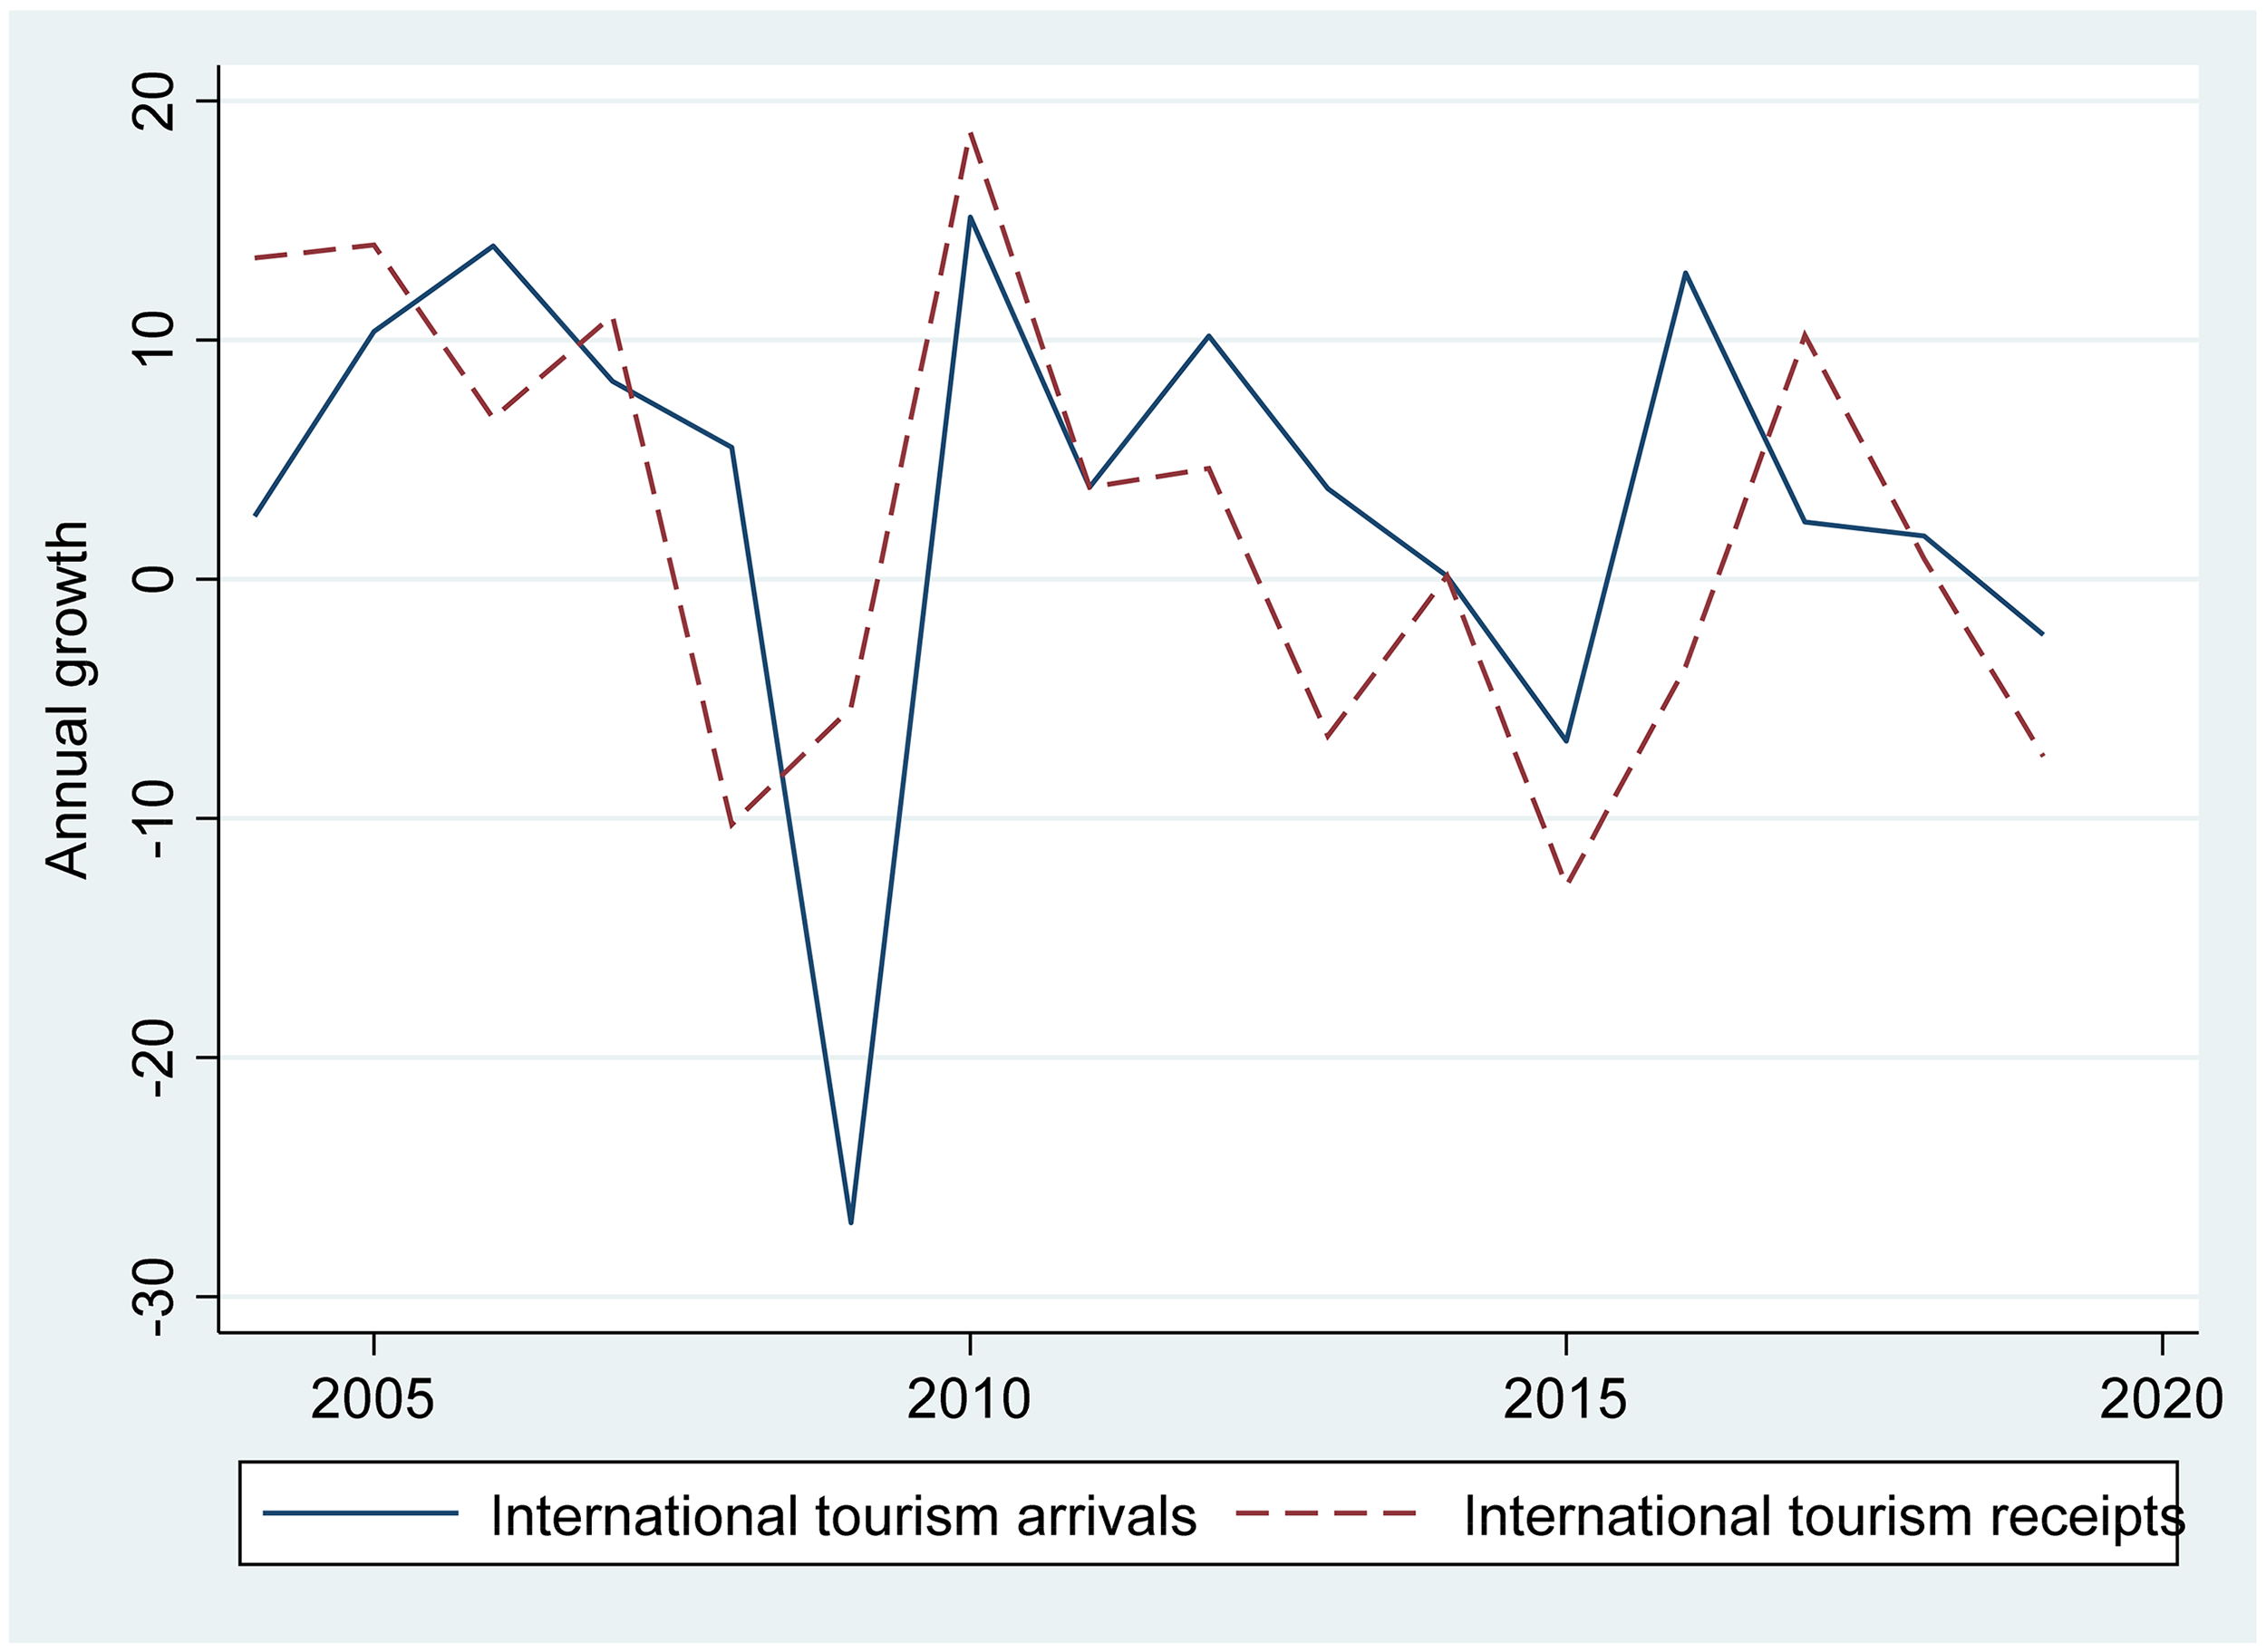
Annual Growth in Inbound Tourism to South Africa, 2004–2019. Source: Own Calculation Using WDI and UNWTO (2025) Data.
It therefore appears that the actual hosting of the final games in 2010 had a big impact on tourism visitors and receipts compared to the period when South Africa was announced as a host in 2004. A large percentage of people who visited the country in 2010 were from Africa (71%), followed by Europe (17%) but there was a huge increase in visitors from Americas by 37% and East Asia and the Pacific (36%). Visitors from South Asia declined from 44% to 31% over the period 2009 to 2010 probably due to crowding-out effect. These are countries that are generally not into soccer but play the game of cricket. Tourism statistics also show that 96% of visitors in 2010 came for personal reasons suggesting that they came for the World Cup or other non-business purposes. However, there was a big increase in the visitors who came for business and professional purposes (68%) compared to personal reasons (14%) (see Table 7).
Inferences and Robustness Checks
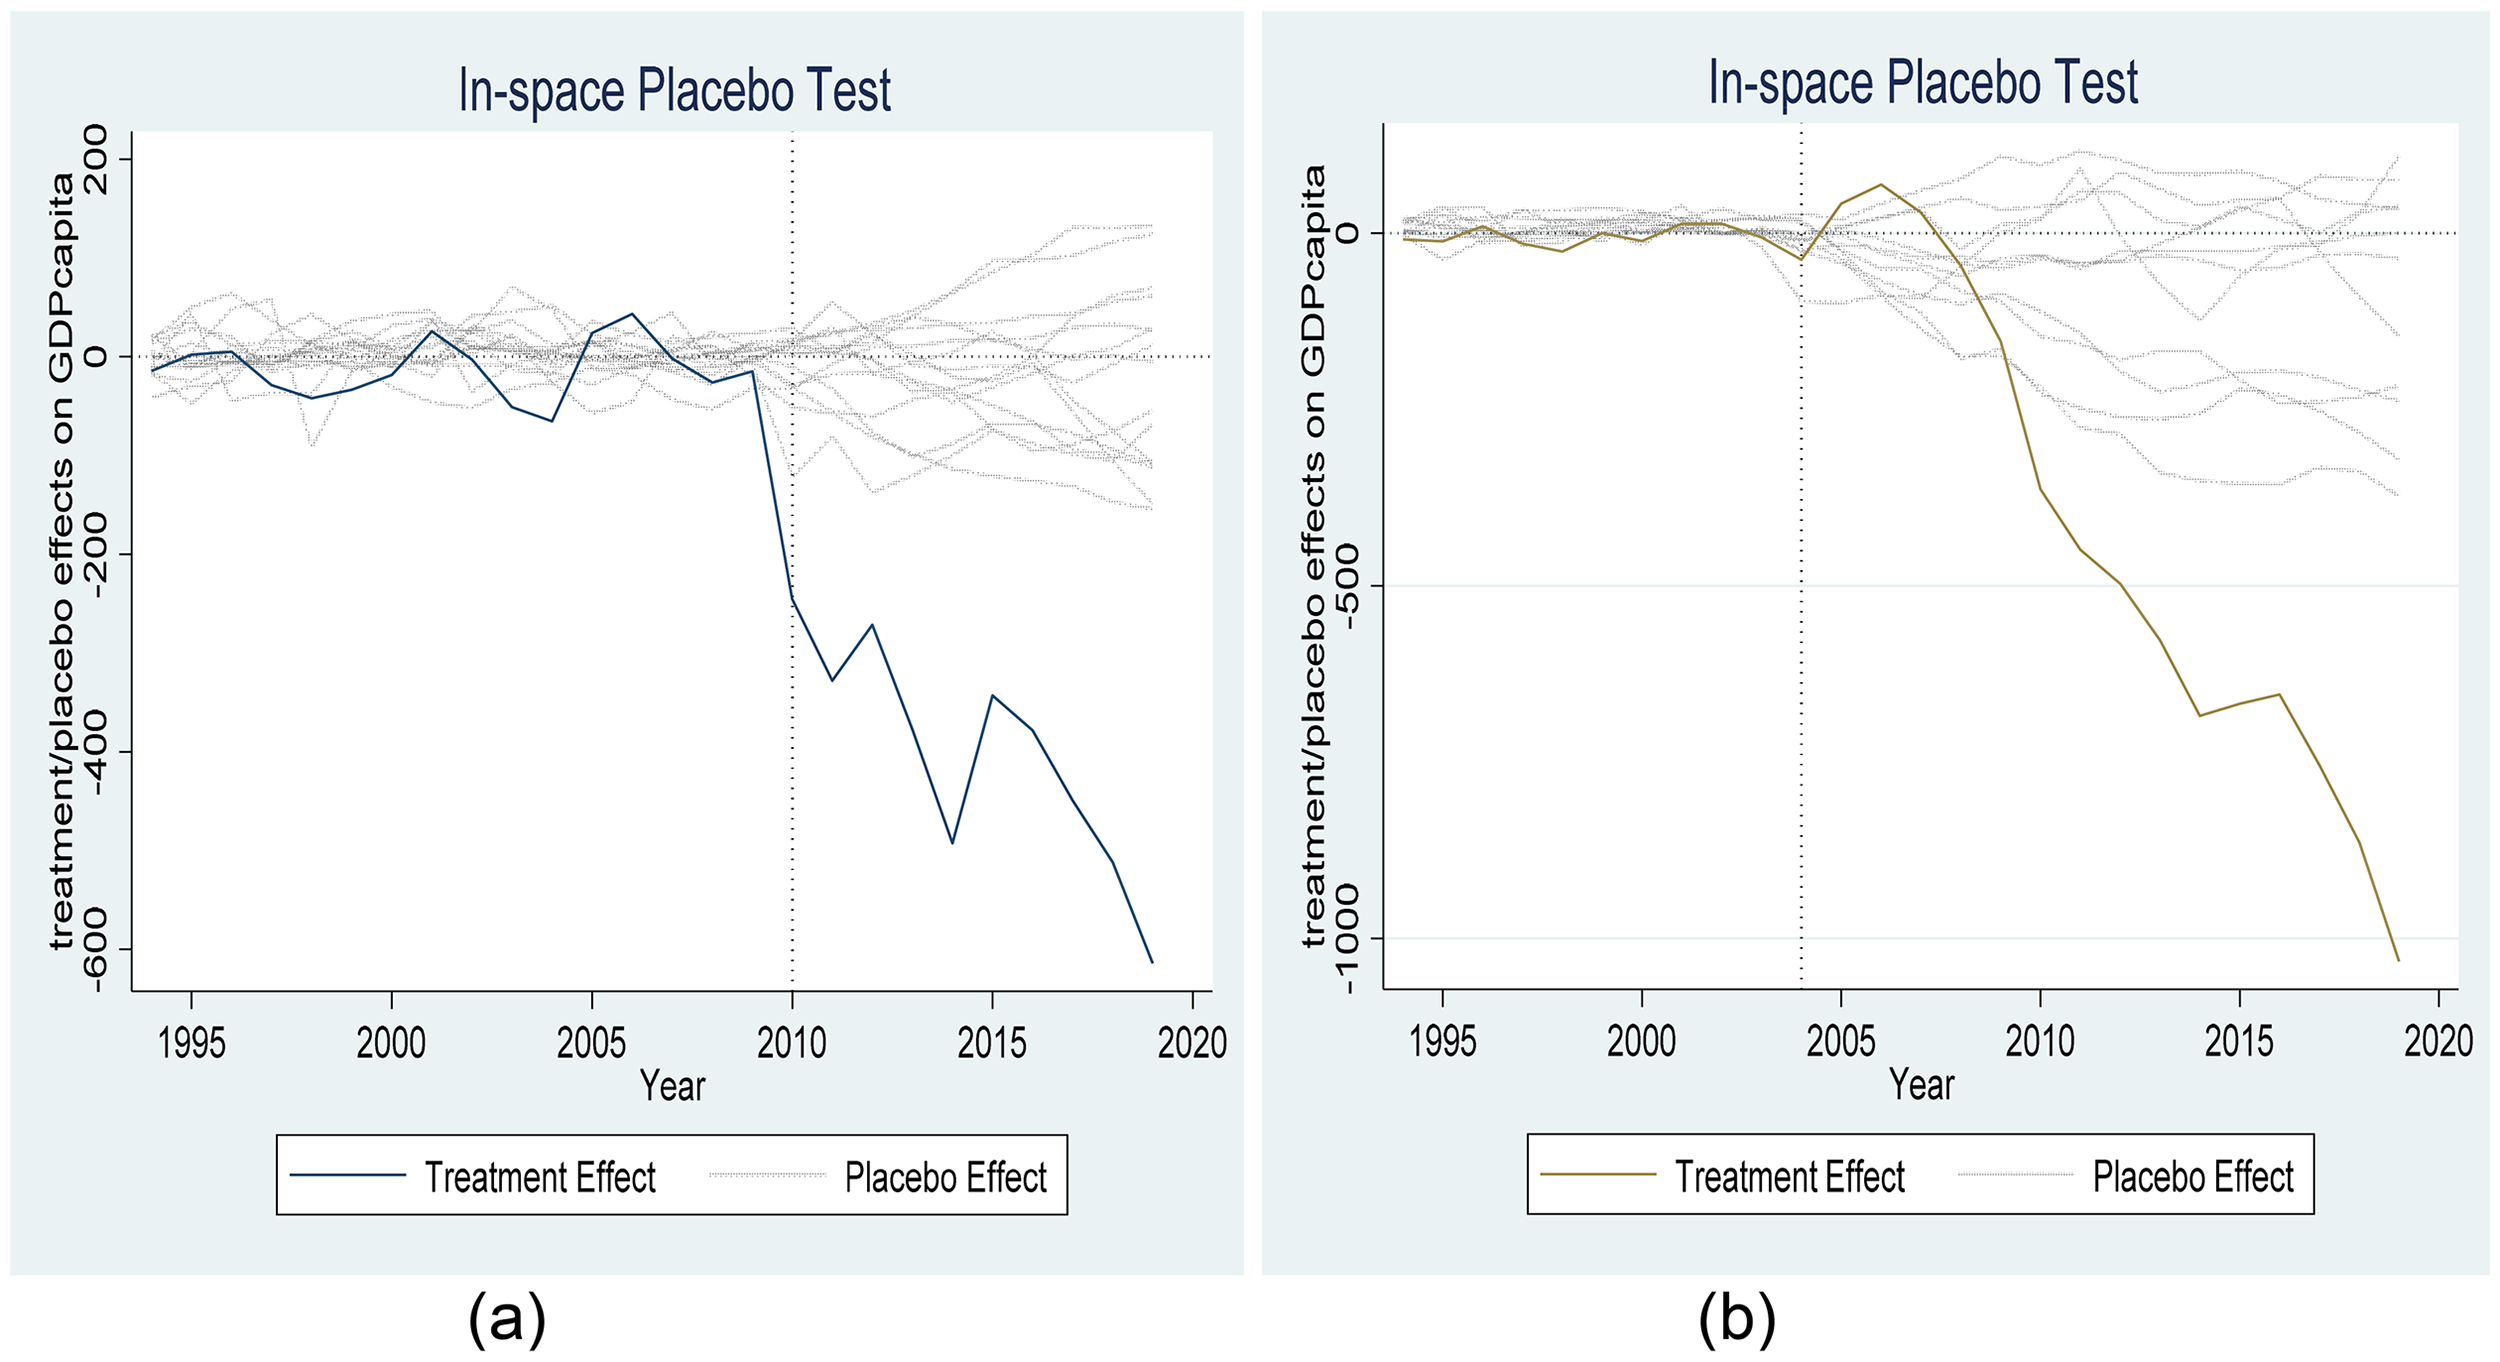
The placebo tests results obtained when we conducted the tests using these two different treatment years (2004 as the event announcement year and 2010 and as the year when the event was held) partly strengthen the credibility of the above results. The in-space placebo tests results when using the above two years (2004 and 2010) are presented in Figures 15a and b. The 2010 in-space placebo tests show an average treatment effect over the post-treatment period that is negative and significant over the period (−0.0321) with the probability of obtaining a post/pretreatment MSPE ratio as large as South Africa's being 0.0769 with 2017 and 2018 treatment effects significant at 0.0909 or at 10%. In the case of 2004, the probability of obtaining a post/pretreatment MSPE ratio as large as South Africa's is 0.0645 and the average treatment effect over the posttreatment period 2004 to 2019 is −0.0943 and significant for the years 2007 onwards with a left sided p-value of 0.0714 (see Table 8 appendix). 17
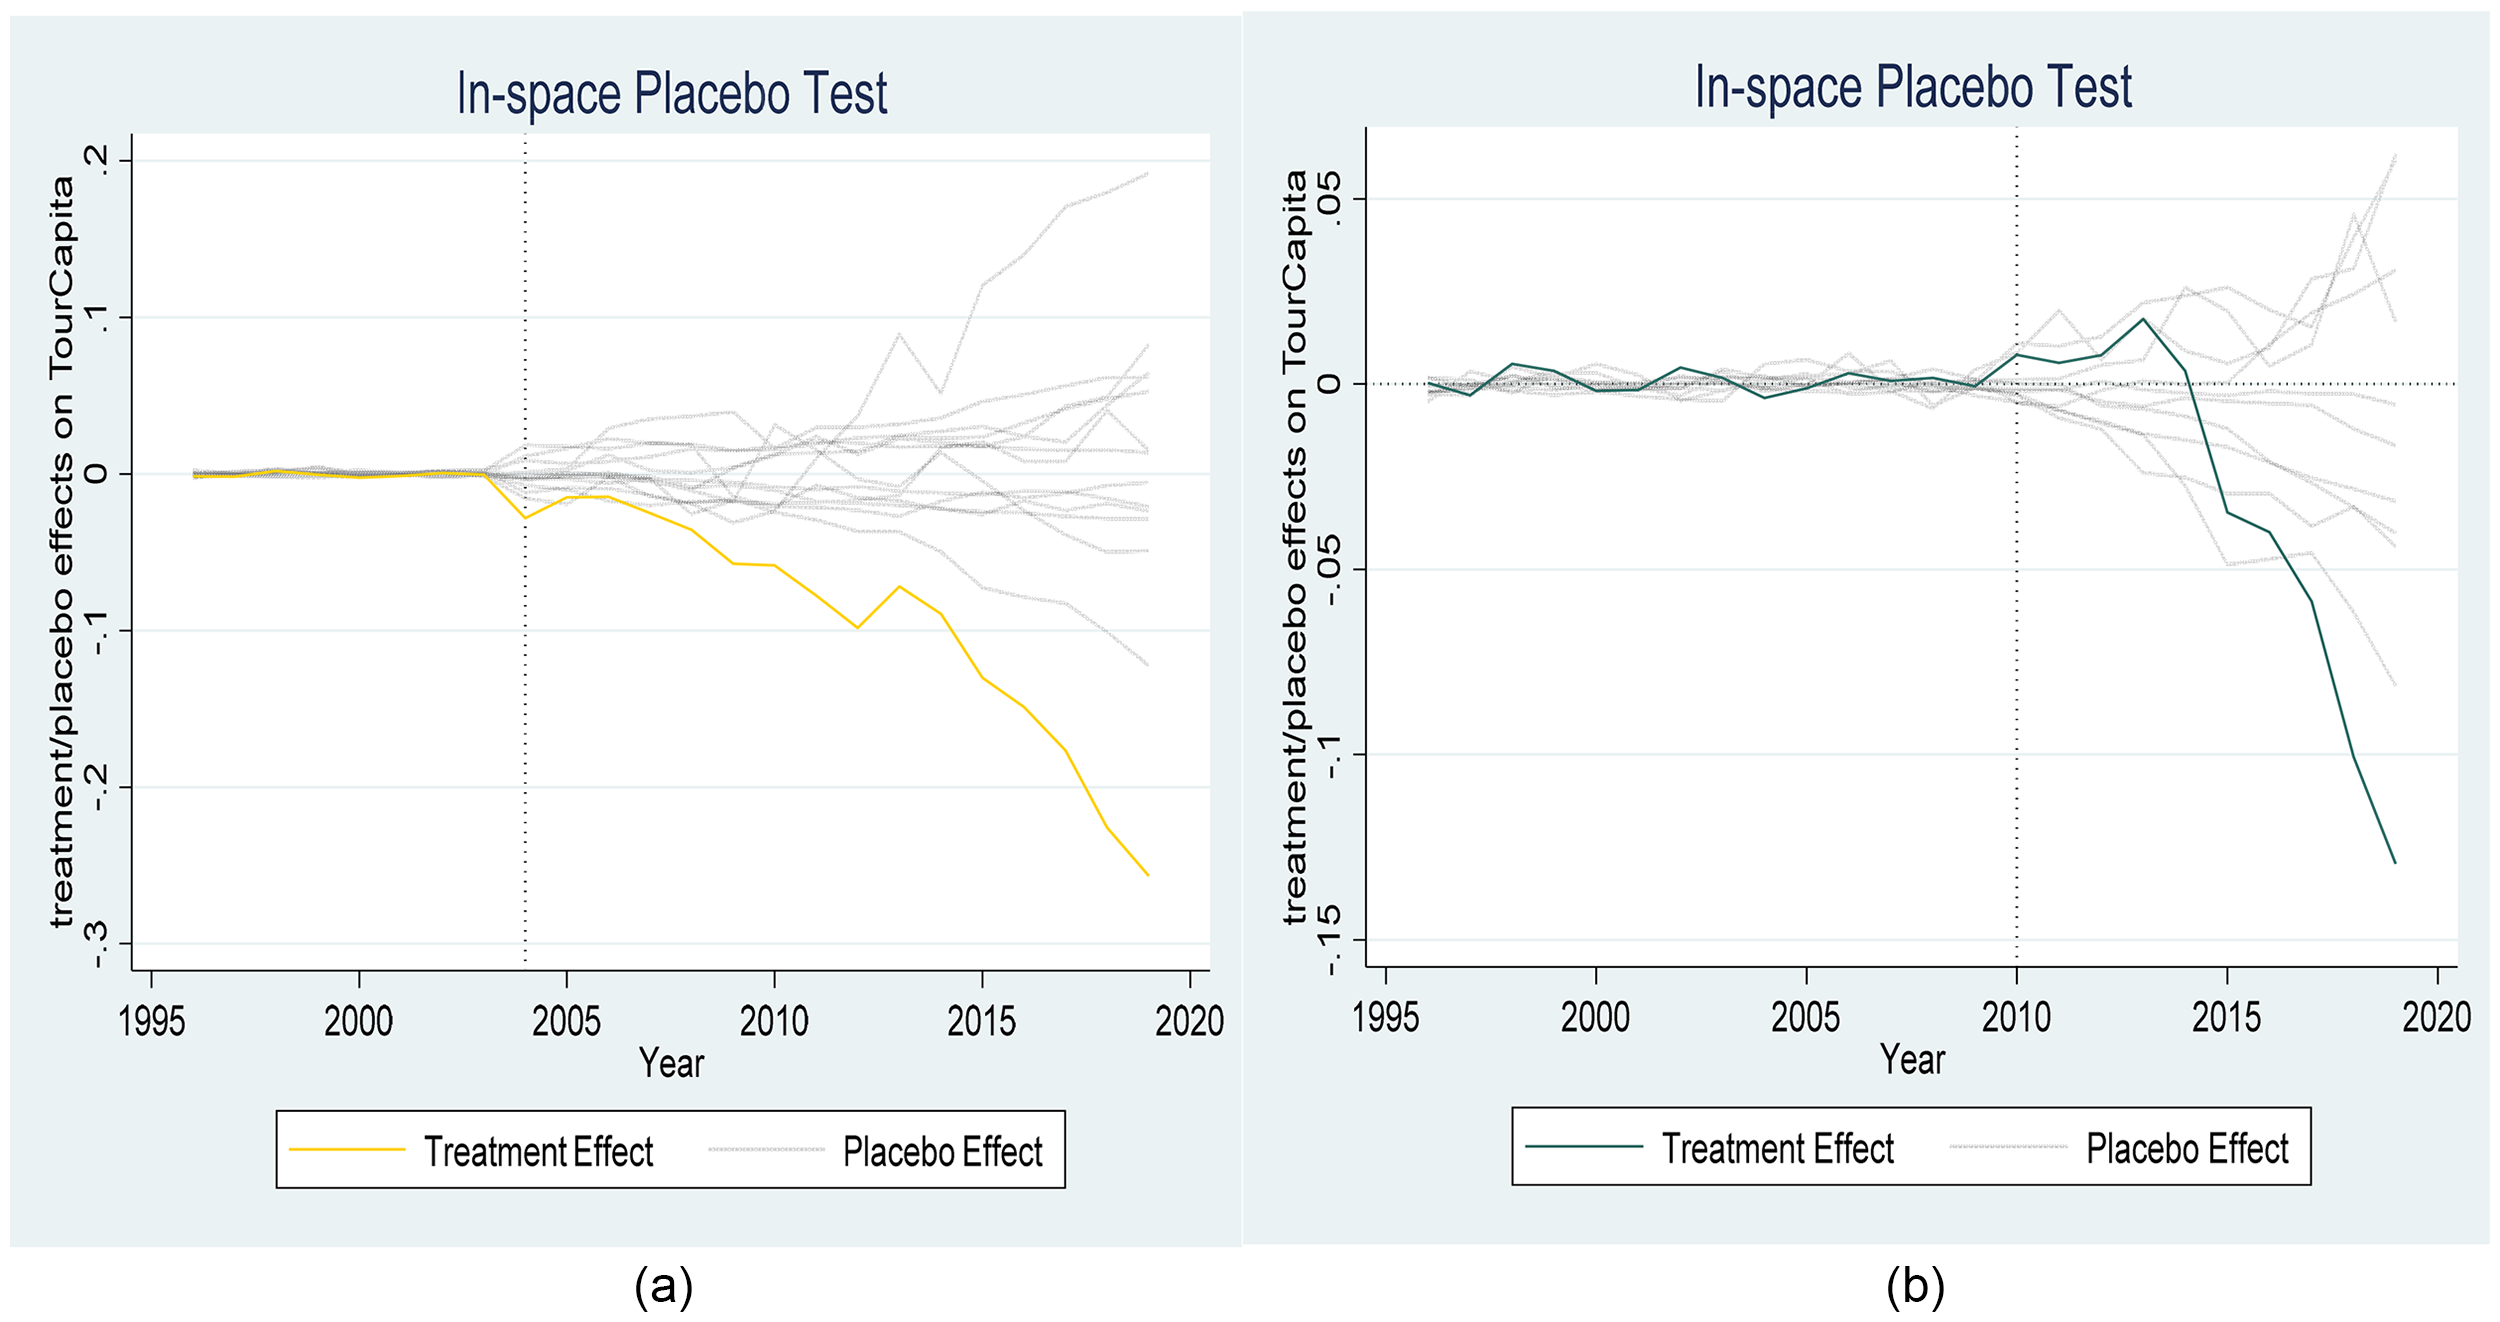
a. In-Space Placebo Test. Note: When using 2004 (year when South Africa was announced as the 2010 World Cup host) as treatment year. b. In time placebo test. Note: When using 2010 (year when event was held) as treatment year. Source: Own calculation using WDI (2021) data.
Conclusions and Policy Recommendations
The announcement of South Africa as the 2010 host of the FIFA World Cup in May 2004 beating Egypt and Morocco was a triumphant moment not only for South Africa but for the African continent. It marked the first time in FIFA's history that the World Cup would be hosted by an African country. In addition to the novelty and the “feel good” effects associated with these kind of mega events, South Africans expected to reap some economic benefits from hosting the event.
Although so many ex-post studies have been done to ascertain whether the 2010 World Cup lived to its economic expectations, there is very little consensus. A number of these studies are qualitative in nature, and those that are quantitative use techniques that do not clearly isolate the causal impact of the FIFA World Cup. We attempt to bridge this gap by using the Synthetic Control Method which helps us create a synthetic South Africa without the World Cup and whose performance (in terms of GDP and tourism arrivals) is compared to actual South Africa. Various robustness checks are done to ensure credibility of our results. Results show that the 2010 final games had no impact on the country's GDP but had a positive impact on international tourism. However, the South African economy benefited more during the period post announcement in 2004 but before the actual games. Growth appears to have been driven by the many projects that were initiated to take advantage of hosting the final games. These results, at least for south Africa, show that it is not the actual hosting of the World Cup that has a positive effect on GDP but the period of preparation for the tournament. The actual hosting of the tournament is only beneficial in the form of international tourism inflows. These results have implications for developed countries with good infrastructure for hosting mega events. These countries might benefit from tourism inflows and non-pecuniary effects.
Footnotes
Funding
The authors received no financial support for the research, authorship, and/or publication of this article.
Declaration of Conflicting Interests
The authors declared no potential conflicts of interest with respect to the research, authorship, and/or publication of this article.
Notes
Author biographies
Appendix
Average Growth Levels Before and After 2010 World Cup Year.
| 1994–2019 | 1994–2009 | 2011–2019 | ||||
|---|---|---|---|---|---|---|
| GDP | Population | GDP | Population | GDP | Population | |
| Argentina | 2.2 | 1.1 | 2.7 | 1.1 | 0.4 | 0.9 |
| Botswana | 4.1 | 1.9 | 3.6 | 2.1 | 4.1 | 1.5 |
| Brazil | 2.5 | 1.1 | 3.2 | 1.3 | 0.8 | 0.8 |
| Kazakhstan | 4.3 | 0.4 | 4.3 | -0.2 | 4.2 | 1.5 |
| Malaysia | 5.3 | 2.1 | 5.2 | 2.3 | 5.1 | 1.7 |
| Mauritania | 3.4 | 2.8 | 3.0 | 2.6 | 4.2 | 3.1 |
| Algeria | 3.2 | 1.8 | 3.4 | 1.6 | 2.6 | 2.0 |
| Morocco | 4.2 | 1.3 | 4.6 | 1.4 | 3.5 | 1.2 |
| South Africa | 2.7 | 1.2 | 3.3 | 1.1 | 1.6 | 1.4 |
Source: WDI, 2025