
Abstract
Statistics on expected goals and expected points in football provide insights into teams’ expected performance based on data about shots. Some teams exceed expectations, while others fall short of this benchmark. In this preregistered study, we employ random-effects meta-analysis to decompose the deviation from expected performance into luck and skills, using data from the top seven European football leagues for men over three seasons. Our results indicate that approximately 40% of the variation in over-/underperformance during a league season is attributable to skills, while the remaining 60% is due to luck. Over a season of 38 matches, these estimates imply that the standard deviations in points attributed to skills and luck are roughly 6 points and 7 points, respectively. We demonstrate the significance of luck through simulations, indicating that, on average, it affects league rankings by 1.8 positions and showing that luck plays a decisive role in determining end-of-season outcomes.
Introduction
Engaging in and watching sports is a favorite pastime for many people, and the sports industry has become a large and rapidly growing global sector (Riot et al., 2018). The widespread interest, coupled with its economic relevance, has spurred an increasing academic literature focused on sports. Scholars have explored various phenomena, such as whether there is a “hot hand” effect in basketball (Gilovich et al., 1985; Miller & Sanjurjo, 2018), whether coaches affect outcomes (Berry & Fowler, 2021), whether game theory can predict behavior during football penalty kicks (Chiappori et al., 2002), whether football players and coaches exhibit reference-dependent behavior (Bartling et al., 2015), whether there is ethnic discrimination in refereeing and wage-setting (Parsons et al., 2011; Price & Wolfers, 2010; Szymanski, 2000), and whether there is nationalistic favoritism in sports judging (Emerson et al., 2009; Sandberg, 2018).
Football is the most popular sport worldwide, with the European football market generating over £35.3 billion in revenue during the 2022/23 season (Deloitte Sports Business Group, 2024). Anyone familiar with football recognizes that luck can play a decisive role in individual games (Skinner & Freeman, 2009), and the implied unpredictability of match results may contribute to the sport's popularity (Neale, 1964; Pawlowski & Anders, 2012; Rottenberg, 1956). However, determining the precise impact of skills versus luck on football outcomes remains elusive, even as recent research begins to address this question (Brechot & Flepp, 2020; Gauriot & Page, 2019; Sarkar & Kamath, 2023; Wunderlich et al., 2021). There is also a related body of literature on the importance of luck versus skills in sports and games more generally. For example, Gilbert and Wells (2019) examined the role of luck in individual games within major US professional team sports, including Major League Baseball (MLB), the National Basketball Association (NBA), the National Football League (NFL), and the National Hockey League (NHL), as well as for skills-based board games, including chess and Go. Their findings suggest that luck played the most significant role in MLB games and was least important in NFL games, while they found that luck was more influential in chess than in Go. Fioravanti et al. (2023) found that luck, ability, and effort play nearly equal roles in explaining performance variations in English Premiership Rugby. Levitt and Miles (2014) highlighted the importance of skills in online poker, although they did not quantify the role of luck. Additionally, the literature on competitiveness in sports is related to luck, as competitiveness can be modeled as the likelihood of an underdog winning (Ben-Naim et al., 2006).
Football experts typically argue that luck may play a role in individual games, but over the course of a league season with many matches, the best team consistently emerges as the winner. One way to quantify the importance of luck over a league season is to compare actual outcomes to outcomes expected based on actual match events. The availability of detailed statistics about football games has greatly enhanced the opportunities for making such comparisons. It is now common to report expected goals (xG), which describes the number of goals a team is expected to score based on the goal-scoring opportunities they create in a match (Anzer & Bauer, 2021; Rathke, 2017; Robberechts & Davis, 2020). Similarly, the expected goals of the opponent reflect the number of goals a team is expected to concede during a game. Expected goals are based on data on the position of shots as well as the location of defenders and goalkeepers; however, the exact data and modeling techniques used vary across data providers. Statistics on expected goals can also be converted into the number of points a team is expected to receive in a match and, consequently, the expected league position throughout a season. Expected goals and points can be used as performance indicators, as benchmarks for defining over- and underperformance, or as information to forecast results in future games. See Heuer and Rubner (2009, 2012), Heuer et al. (2010), Klemp et al. (2021), and Wunderlich (2024) for further discussions of performance indicators and forecasting of football matches.
While it is tempting to attribute deviations from expected goals and points in individual games or over a season to luck (Mauboussin, 2012; Sobkowicz et al., 2020), it cannot be ruled out that some teams are more skilled at converting shots into goals or systematically better at preventing goals from shots by the opponent (unless the xG model used is perfect in predicting goals). A recent study by Sarkar and Kamath (2023) compares the difference between actual and expected goals and points for the top and bottom six ranked teams in the top five football leagues in Europe. Surprisingly, their findings suggest that luck generally does not influence league positions. We revisit this question using a different methodology and including all teams irrespective of their league position.
We delineate the variation in over- and underperformance into skills and luck using a random-effects meta-analysis. The random-effects meta-analytic model is specifically designed to decompose the variability across the pooled estimates into random sampling variation and heterogeneity (Borenstein et al., 2010; Higgins et al., 2009; Riley et al., 2011), making it a suitable tool for analyzing over- and underperformance in football results. Heterogeneity measures the systematic variation in deviations from expected performance across teams throughout a season and is indicative of variability attributable to skills. As an example of between-team variability in overperformance, consider a team that consistently outperforms expected points due to strong finishing abilities or effective defensive organization. On the other hand, luck accounts for variations in overperformance that arise from factors such as referee decisions, deflected shots resulting in goals or own goals, or the variability in a particular player's finishing ability. Wunderlich et al. (2021), for instance, found that randomness played a role in nearly 50% of all goals scored in the Premier League. For further discussion and examples of how luck affects goal scoring in football, see Lames (2018). Additionally, the hot hand fallacy, i.e., the phenomenon of winning and losing streaks being attributed being due to skills rather than luck, highlights the challenges humans face in distinguishing between random and systematic influences on sports outcomes (Gilovich et al., 1985; Heuer & Rubner, 2009; Miller & Sanjurjo, 2018).
We used data provided by Football xG (https://footballxg.com/) encompassing the three seasons 2021/22, 2022/23, and 2023/24 for the seven European top leagues for men based on the UEFA club coefficients (bit.ly/45UvErs): Premier League (ENG), La Liga (ESP), Ligue 1 (FRA), Bundesliga (GER), Serie A (ITA), Eredivisie (NLD), and Liga Portugal (PRT). The xG data obtained from Football xG is based on the position of shots and the location of defenders and goalkeepers (this information was obtained from personal communication with the data provider).
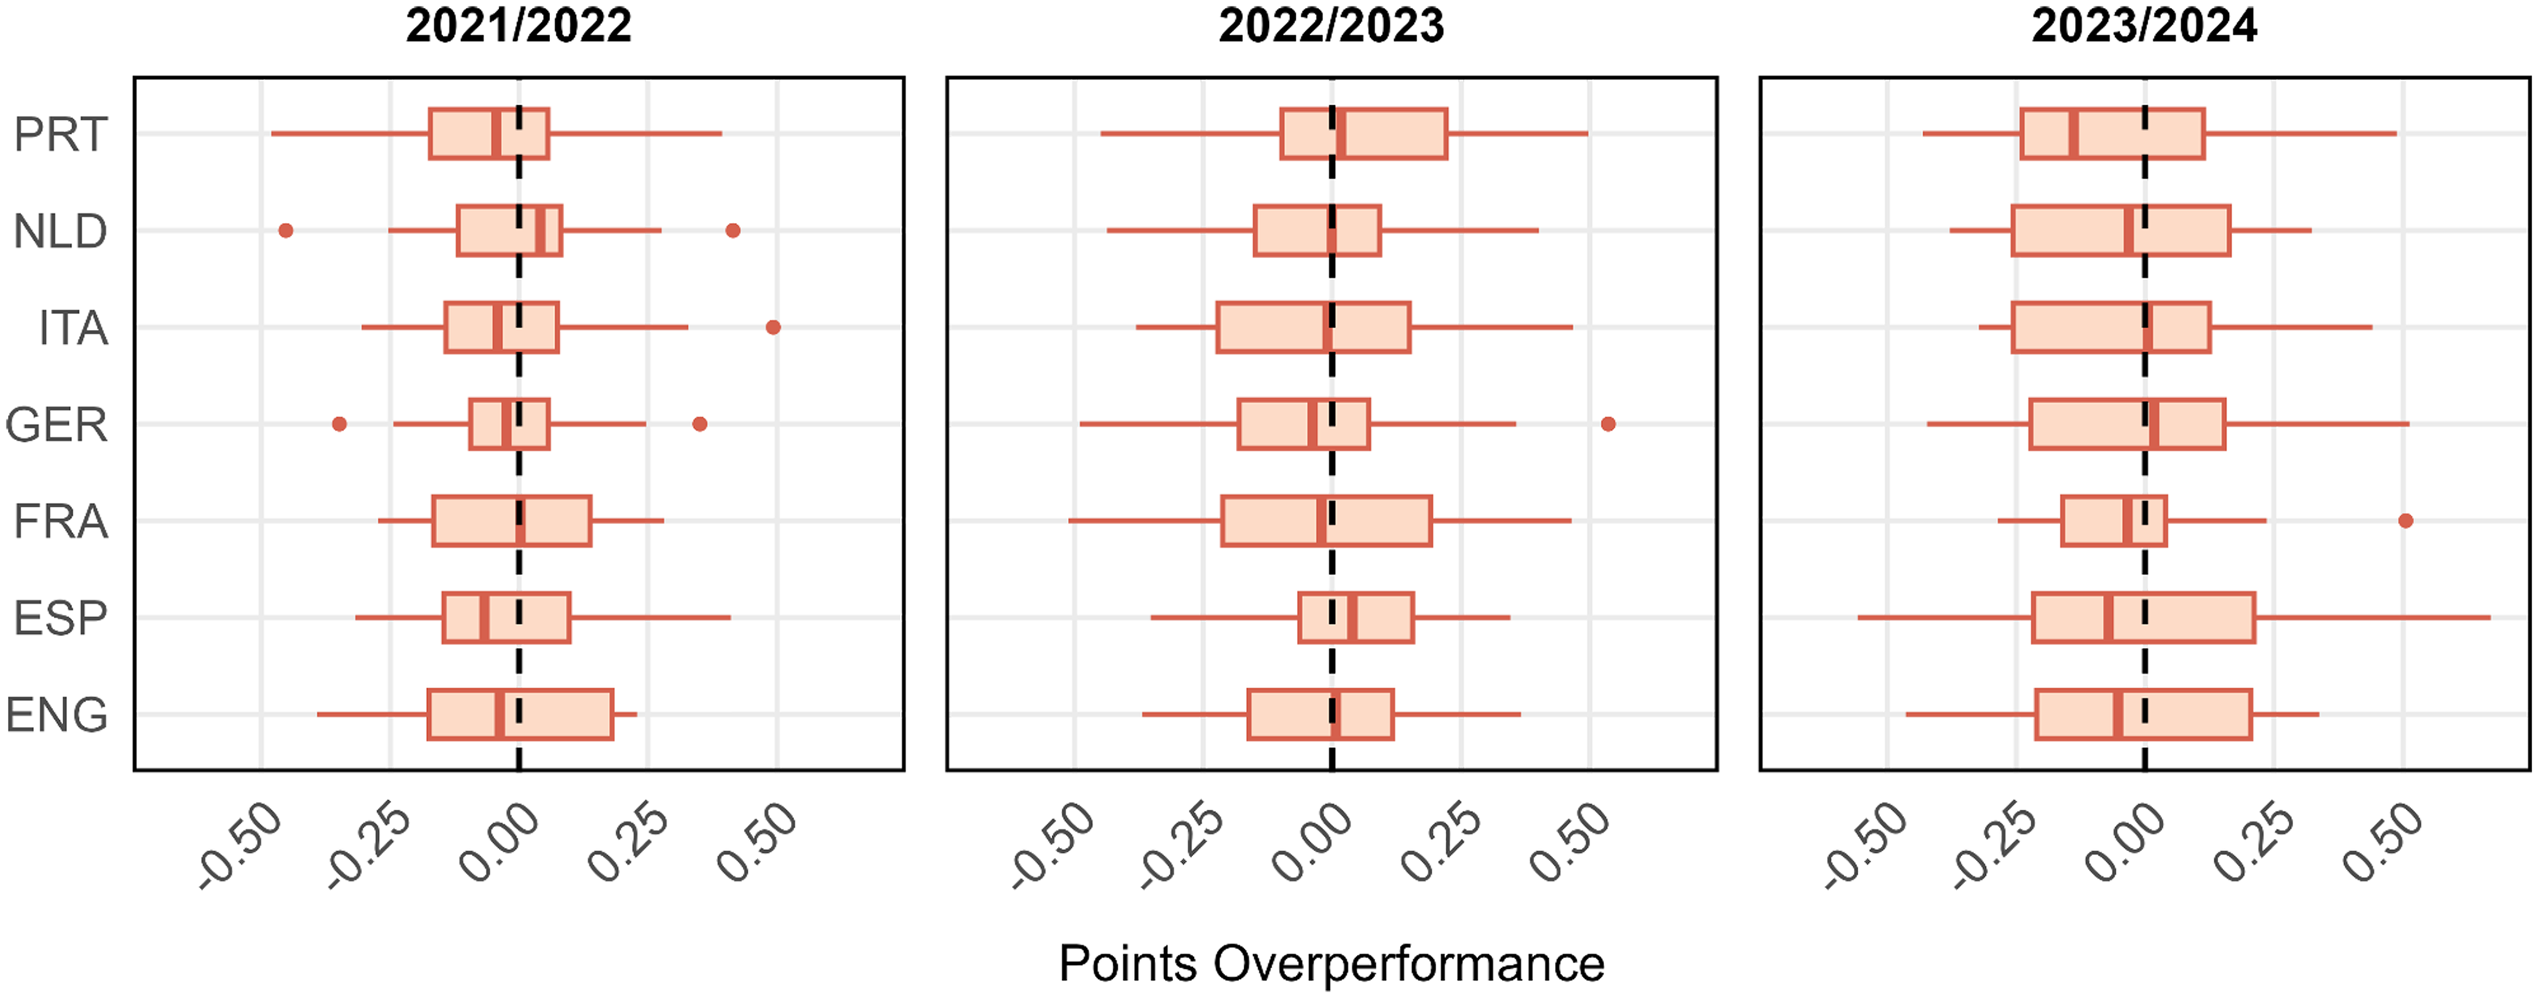
To set the stage, Figure 1 plots the average difference between teams’ actual points and teams’ expected points per game, referred to as points overperformance (PP), for each of the seven leagues in each of the three seasons (similarly, Online Appendix Figures 1–3 illustrate the distributions of three more outcome measures entering our analyses below; see also Online Appendix Tables 1–8 for descriptive statistics overall and per league). The data in Figure 1 indicates that there is substantial dispersion in deviations from expected points across teams. In the 2023/24 season, the most overperforming team in the Premier League (ENG) was Manchester City, achieving, on average, 0.337 points more than expected per game; Sheffield United was the team that underperformed the most, finishing with 0.464 points fewer than anticipated per game. The difference of 0.802 points between the two extremes of the distribution is substantial, given that the 20 Premier League teams scored 1.392 points per match on average (sd = 0.532). On the season level, with the league season comprising 38 games, the difference between the most overperforming and the most underperforming team amounts to 30.4 points, relative to an average season-level points score of 52.9 (sd = 20.2) in the 2023/24 Premier League. The observation that Manchester City was the most overperforming team, while Sheffield United was the most underperforming team in the 2023/24 season may indicate a general trend where strong teams overperform and weak teams underperform, which we report some evidence for in Section “Simulations illustrating the impact of luck on league positions (not preregistered)”.
Over- and Underperformance in Points per Season (Points Overperformance).
Despite noticeable variability in the distribution of points overperformance across seasons and leagues, it stands out that the variability in deviations for expected points is substantial. Our research aims to quantify the extent to which disparities in over- and underperformance across teams can be attributed to skills or luck. This, in turn, allows us to quantify the role of luck in determining end-of-season outcomes, such as winning the league or qualifying for the Champions League. We focus solely on luck as an explanation for teams’ performance relative to expectations instrumentalized in terms of expected goals (xG) and expected points (xPTS) based on shots, while neglecting the randomness that leads to shots. Our research question is not only intriguing on its own but also significant for managers and executives in the football industry and for understanding both the potential and limitations of using xG data for forecasting future football games and setting betting odds (e.g., Dmochowski, 2023; Spann & Skiera, 2009; Wunderlich & Memmert, 2018). If there is heterogeneity in overperformance, it is evident that xG statistics will be systematically biased as a forecasting tool unless they are combined with additional data that explains the variability. Heterogeneity can be seen as the upper bound for enhancing the explanatory power of xG models. Recognizing the role of randomness in overperformance is also crucial for evaluating the performance of football teams and making informed managerial decisions, such as whether to replace a coach or buy or sell players. Misinterpreting random variation as being due to skills can lead to poor decision-making, such as in the gambler's fallacy (Cowan, 1969; Sundali & Croson, 2006; Tversky & Kahneman, 1971, 1974).
Materials and Methods
Below, we outline the data and variables used and provide further details about the analyses and tests. Preregistration of a detailed analysis plan prior to accessing data mitigates the scope for questionable research practices (John et al., 2012; Nelson et al., 2018; Nosek et al., 2018; Simmons et al., 2011). Prior to obtaining the data used in our study from Football xG (https://footballxg.com/), we posted an analysis plan at the Open Science Framework (OSF) detailing the study's design and all planned analyses and tests (osf.io/9p8qr). To verify receipt of the data after posting our PAP, we have added an addendum to the PAP with a letter from Football xG confirming the date they sent us the data. The only exception to this is that Football xG, prior to posting the PAP, sent us an example of the data structure with data for one Premier League team, Arsenal, for the 2023/24 season. We report all our preregistered tests and analyses and transparently report all deviations from the PAP. The only deviations are that we added some not preregistered exploratory analyses described in detail in a separate section below and that there was an error in the PAP regarding the number of observations in the 2021/22 and 2022/23 seasons, which has no impact on the implementation of the analyses (details are provided in the subsection Data and Variables below).
Data and Variables
We use data provided by Football xG (https://footballxg.com/) for the three seasons 2021/22, 2022/23, and 2023/24 for seven European top leagues for men: Premier League (ENG), La Liga (ESP), Ligue 1 (FRA), Bundesliga (GER), Serie A (ITA), Eredivisie (NLD), and Liga Portugal (PRT). We use the following variables, measured for each team on the game level, to construct our outcome variables: (i) goals scored (G); (ii) expected goals scored (xG); (iii) goals against (GA; equivalent to the opponent's G); (iv) expected goals against (xGA; equivalent to the opponent's xG); (v) points (PTS); and (iv) xPTS. Based on these data, we construct the following variables (for each team and each game) used as outcome variables in our analyses (while these variables measure over- and underperformance, we refer to them as “overperformance” for simplicity):
Defensive overperformance (DP) = expected goals conceded (xGA) − goals conceded (GA). Defensive overperformance measures whether a team conceded more or fewer goals than expected in a game; positive (negative) values indicate overperformance (underperformance). Goals overperformance (GP) = offensive overperformance (OP) + overperformance (DP). Goals overperformance measures whether the goal difference (G − GA) of a team was larger or smaller than the expected goal difference (xG − xGA); positive (negative) values indicate overperformance (underperformance). Points overperformance (PP) = points (PTS) − expected points (xPTS). Points overperformance measures whether a team received more or fewer points than expected; positive (negative) values indicate overperformance (underperformance).
For each of the 20 teams in the Premier League (ENG), La Liga (ESP), and Serie A (ITA), there are 38 observations on the above variables for every season, as a season consists of 38 rounds; for each of the 18 teams in Bundesliga (GER), Eredivisie (NLD), and Liga Portugal (PRT), there are 34 observations on the above variables for every team. For Ligue 1 (FRA), there are 20 teams per season in the seasons 2021/22 and 2022/23, and 38 observations on the specified variables for every team, while there are 18 teams and 34 observations on the same variables for each team in the 2023/24 season. In the PAP, we mistakenly stated that there were 18 teams per season in Ligue 1 for all three seasons. As a result, we reported an incorrect number of observations for the 2021/22 and 2022/23 seasons and the overall total in the study. Thus, our sample involves 4,728 observations per season (from 2,364 games) for the 2023/24 season and 4,876 observations per season (from 2,438 games) for the 2021/22 and 2022/23 seasons. The total number of observations for the three seasons is 14,480 observations (from 7,240 games).
Preregistered Analyses and Tests
We test the preregistered hypotheses below, which are divided into primary hypothesis tests, secondary hypothesis tests, preregistered exploratory analyses, and robustness tests. In testing these hypotheses, we interpret two-sided p-values < 0.05 as “suggestive evidence” and two-sided p-values < 0.005 as “statistically significant evidence,” as suggested by Benjamin et al. (2018). The reason for using this more conservative threshold for “statistically significant findings” is to reduce the risk of false positives and to communicate results in a responsible way. As noted by Benjamin et al. (2018), a p-value of 0.05 does not represent strong evidence in favor of the tested hypothesis. 1
We use the restricted maximum likelihood estimator (Viechtbauer, 2005) to estimate random-effect meta-analyses using the
For the random-effects meta-analyses in the primary and secondary hypothesis tests described below, we have 132 team-level observations (including the means and standard errors of the mean of the outcome variables) per season for the 2023/24 season and 134 team-level observations per season for the 2021/22 and 2022/23 seasons. For the sub-group tests of individual leagues in the preregistered exploratory analyses below, we have 20 team-level observations for Premier League (ENG), La Liga (ESP), and Serie A (ITA) for all three seasons, 18 team-level observations for Bundesliga (GER), Eredivisie (NLD), and Liga Portugal (PRT) for all three seasons, and 20 team-level observations in the seasons 2021/22 and 2022/23 and 18 team-level observations in the 2023/24 season for Ligue 1 (FRA).
Preregistered Hypothesis Tests
Our analysis involves two primary hypothesis tests and two secondary hypothesis tests. The four tests aim to evaluate whether there is heterogeneity, specifically whether the variation across teams exceeds what would be expected due to pure randomness. Consequently, heterogeneity reflects the part of the overall variability that is attributable to skills rather than chance. The four tests share the same methodology but differ in terms of the dependent variable. Particularly, we aggregate the team-level means (and the associated standard errors) of the dependent variable (goals overperformance, points overperformance, offensive overperformance, or defensive overperformance) in a random-effects meta-analysis across leagues for each season; i.e., we estimate one random-effects meta-analysis comprising all seven leagues for each of the three included seasons. The particular hypothesis is evaluated based on the results of the corresponding Q-test. As measures of the degree of heterogeneity, we report τ and I², along with their 95% confidence intervals. We hypothesized that there would be heterogeneity across teams for all four outcome measures.
Primary hypothesis 1:
There is heterogeneity in goals overperformance across the included teams.
Primary hypothesis 2:
There is heterogeneity in points overperformance across the included teams.
Secondary hypothesis 1:
There is heterogeneity in offensive overperformance across the included teams.
Secondary hypothesis 2:
There is heterogeneity in defensive overperformance across the included teams.
Preregistered Exploratory Analyses
We also conduct several exploratory analyses, which are described below. Particularly, we revisit our primary and secondary hypotheses separately for each league. These exploratory analyses carry little weight, and the statistical power is substantially lower. Specifically, we conduct the heterogeneity tests pertaining to primary hypotheses 1 and 2 and secondary hypotheses 1 and 2 separately for each of the seven leagues in each of the three seasons, involving a total of 21 random-effect meta-analyses for each of the four exploratory analyses.
Exploratory analysis 1:
Separate tests per league of primary hypothesis 1.
Exploratory analysis 2:
Separate tests per league of primary hypothesis 2.
Exploratory analysis 3:
Separate tests per league of secondary hypothesis 1.
Exploratory analysis 4:
Separate tests per league of secondary hypothesis 2.
Robustness Tests
As a robustness test for all the primary, secondary, and exploratory hypothesis tests listed above, we estimate ordinary least squares regressions with the hypothesis test's outcome variable entering as the dependent variable and team fixed effects entering as the independent variables. The regressions are estimated at the game-per-team level (n = 4,876 for 2021/22 and 2022/23, and n = 4,728 for 2023/24 in the robustness tests of the primary and secondary hypotheses) separately for each season, with standard errors clustered at the game level (nc = 2,438 in 2021/22 and 2022/23, and nc = 2,364 in 2023/24, with two observations per cluster). The robustness tests for the presence of heterogeneity in overperformance measures involve conducting Wald tests to determine whether the team fixed effects are jointly significant. We report the regressions’ R² as a measure of the fraction of the variation explained by heterogeneity, although it is not comparable in terms of magnitude to the I² estimates in the meta-analytic tests (which are based on team-level rather than game-level observations). We also report the 95% confidence interval of R² based on the approximation suggested by Olkin and Finn (1995; also see Cohen et al., 2003), implemented in R's
Non-Preregistered Exploratory Analyses
We complement our preregistered analyses by reporting some results and analyses that were not preregistered to facilitate the interpretability of our findings in terms of the implications of the estimated magnitude of luck on outcomes relative to expectations. Since these analyses were not preregistered, results should be considered exploratory and interpreted with caution.
Descriptive Results on the Standard Deviation in Overperformance Due to Lucks
We preregistered to report the estimated heterogeneity (τ), quantifying the between-team standard deviation in over- and underperformance attributable to skills. The remaining part of the overall variation in overperformance measures, ν, is due to luck, i.e., ν² = σ² + τ². To complement the reporting of τ, we report the standard deviation attributable to luck (σ) based on the random-effects meta-analysis alongside its 95% confidence interval. The 95% confidence intervals for σ are based on the derivation of confidence intervals for standard deviations (Sheskin, 2011). Note that the reporting of the standard deviation attributable to luck (σ) was not preregistered but follows directly from our preregistered estimates of I² and τ.
Simulations Illustrating the Impact of Luck on League Positions
To demonstrate the effect of luck on teams’ end-of-season league ranking, we add simulation-based results. As the influence of luck will depend on the association between expected points and skills, we first estimate meta-regressions for each season, testing whether the team-level points overperformance is associated with team-level expected points per season. To illustrate the importance of luck, we conduct the following simulation separately for each league and season. Our starting point is the sum of expected points per team in each season. To account for heterogeneity in over- and underperformance, we determine the predicted performance relative to expectations based on the meta-regressions described above, multiplying the predicted value by the number of games per season. The ranking based on the adjusted expected points serves as the skill-based end-of-season league position table used as the benchmark in the simulation exercise. The adjustment based on the meta-regression amplifies the difference in expected points between teams while assuming that there is no additional heterogeneity across teams with the same number of expected points. Importantly, however, the adjustment of expected points does not affect the skills-based ranking as such. In each simulation run (k = 10,000), every team randomly draws additional points due to luck from a normal distribution with zero mean and a standard deviation equal to the estimated standard deviation attributable to luck (σ) in points overperformance for the particular season (i.e., the σ estimated as part of primary hypothesis 2 below, multiplied by the number of games per season, which translates into 6.629 (5.931) in 2021/22, 6.650 (5.950) in 2022/23, 6.733 (6.025) in 2023/24 for league seasons involving 38 (34) games, respectively). After adding the random draw to teams’ expected points, we compose a new fictional league ranking for each team and determine the absolute change in a team's position relative to the team's skills-based ranking (e.g., if a team was placed 9th on the skills-based ranking and 11th on the fictional ranking, this constitutes a change of 2 ranking steps). The absolute changes in ranking steps are then averaged across the 20 (or 18) teams per league season. The drawing of additional points, composing the fictional ranking, and determining absolute changes in rank positions were repeated in each of k = 10,000 simulation runs. The means across simulation runs for each of the three seasons constitute our results. To construct three additional outcome measures, we additionally record for each run (i) whether the top-ranked team changed, (ii) whether the four top-ranked teams changed, and (iii) whether the three bottom-ranked teams changed. We report the mean of these binary outcomes for each season, interpreted as the probability that luck changes (i) the winning team, (ii) the top four teams that qualify for the Champions League (or the Europa League or the Conference League for some of the spots in some of the leagues), and (iii) the bottom three teams that face relegation (or proceed to a qualifying round for not being relegated in some of the leagues).
Results
Preregistered Primary Hypothesis Tests
Our analyses focus on two primary outcome measures, as defined above: goals overperformance (GP), which measures the difference between the actual goal difference and the expected goal difference in a game, and points difference (PP), which measures the difference between actual points and expected points in a game. In our two primary hypotheses, we test if there is systematic variation in the two outcome measures – heterogeneity – across teams during a season, and we estimate the extent of this variability using random-effects meta-analysis. In the meta-analytical context, heterogeneity manifests itself in the effects being more different from one another than one would expect due to sampling errors alone (Borenstein et al., 2010; Higgins et al., 2009). Translated to our application, heterogeneity implies that skills matter for over- and underperformance. To test our two primary hypotheses, we estimate random-effects meta-analytic models, pooling the mean outcome per team and season. We aggregate teams across all seven leagues but estimate separate meta-analyses for each season.
The results are illustrated in Figures 2 and 3; detailed results are provided in Table 1. We report statistically significant heterogeneity (p < 0.005) according to Cochran's Q-test in all three seasons for goals overperformance and two out of three seasons for points overperformance, with suggestive evidence (p = 0.006) for heterogeneity in points overperformance in the 2021/22 season. Hence, overall, we find relatively strong support for our two primary hypotheses. The degree of heterogeneity, as measured by I², varies from 29.3% to 38.0% for goals overperformance and from 28.7% to 55.4% for points overperformance across the three seasons (see Figure 2). The average I² across the three seasons is 33.4% for goals overperformance and 43.8% for points overperformance, indicating that approximately 40% of the variability in overperformance relative to expectations is due to skills, while around 60% is attributable to luck.
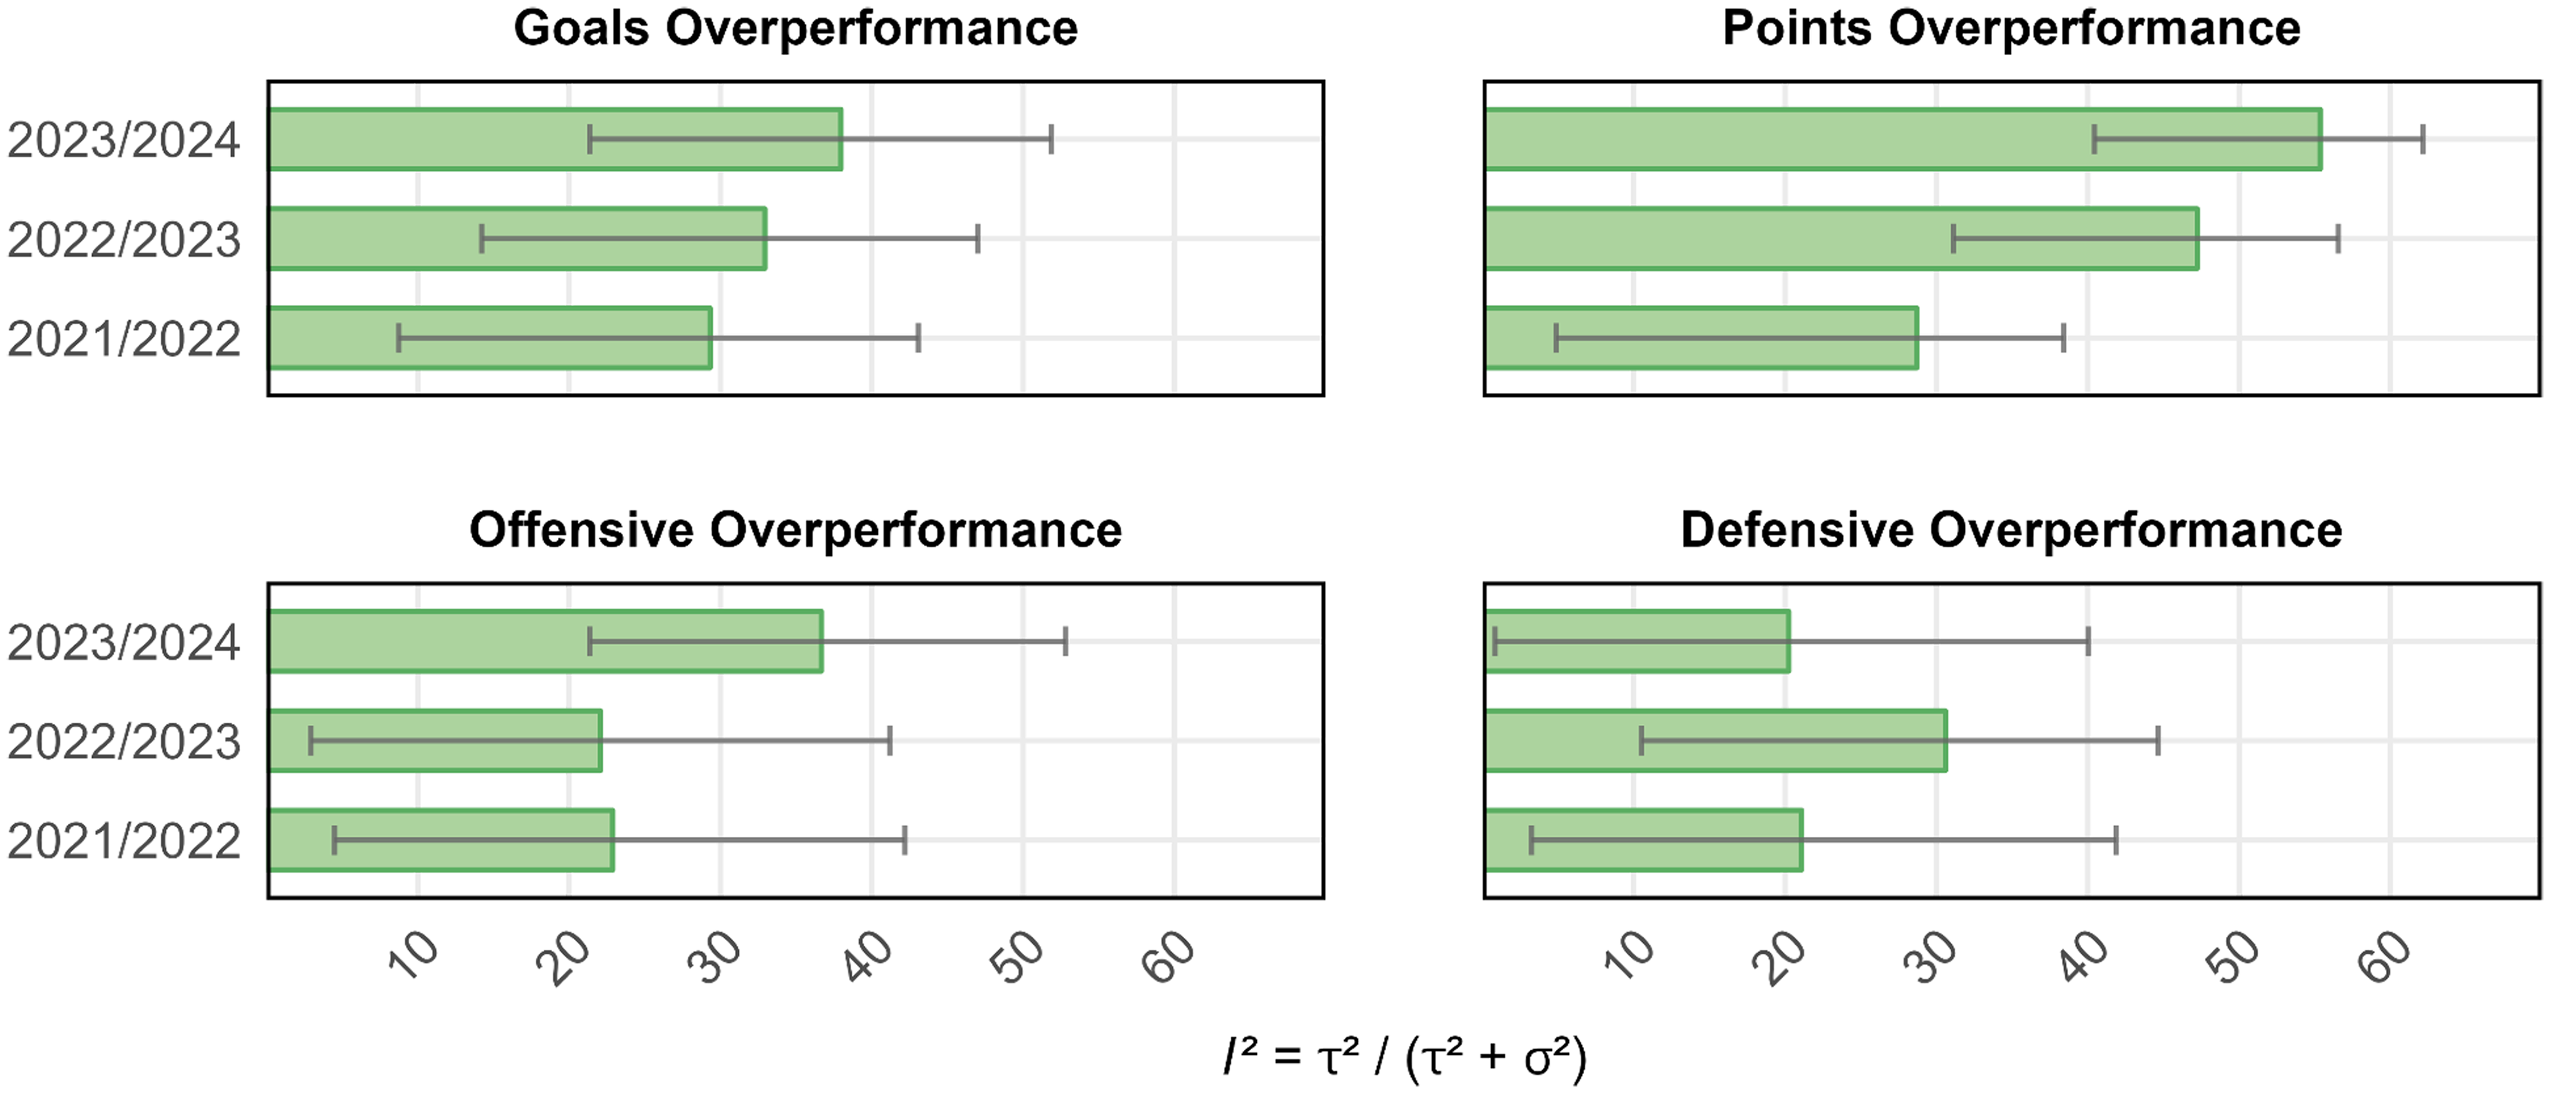
Heterogeneity in the Four Overperformance Measures per Season.
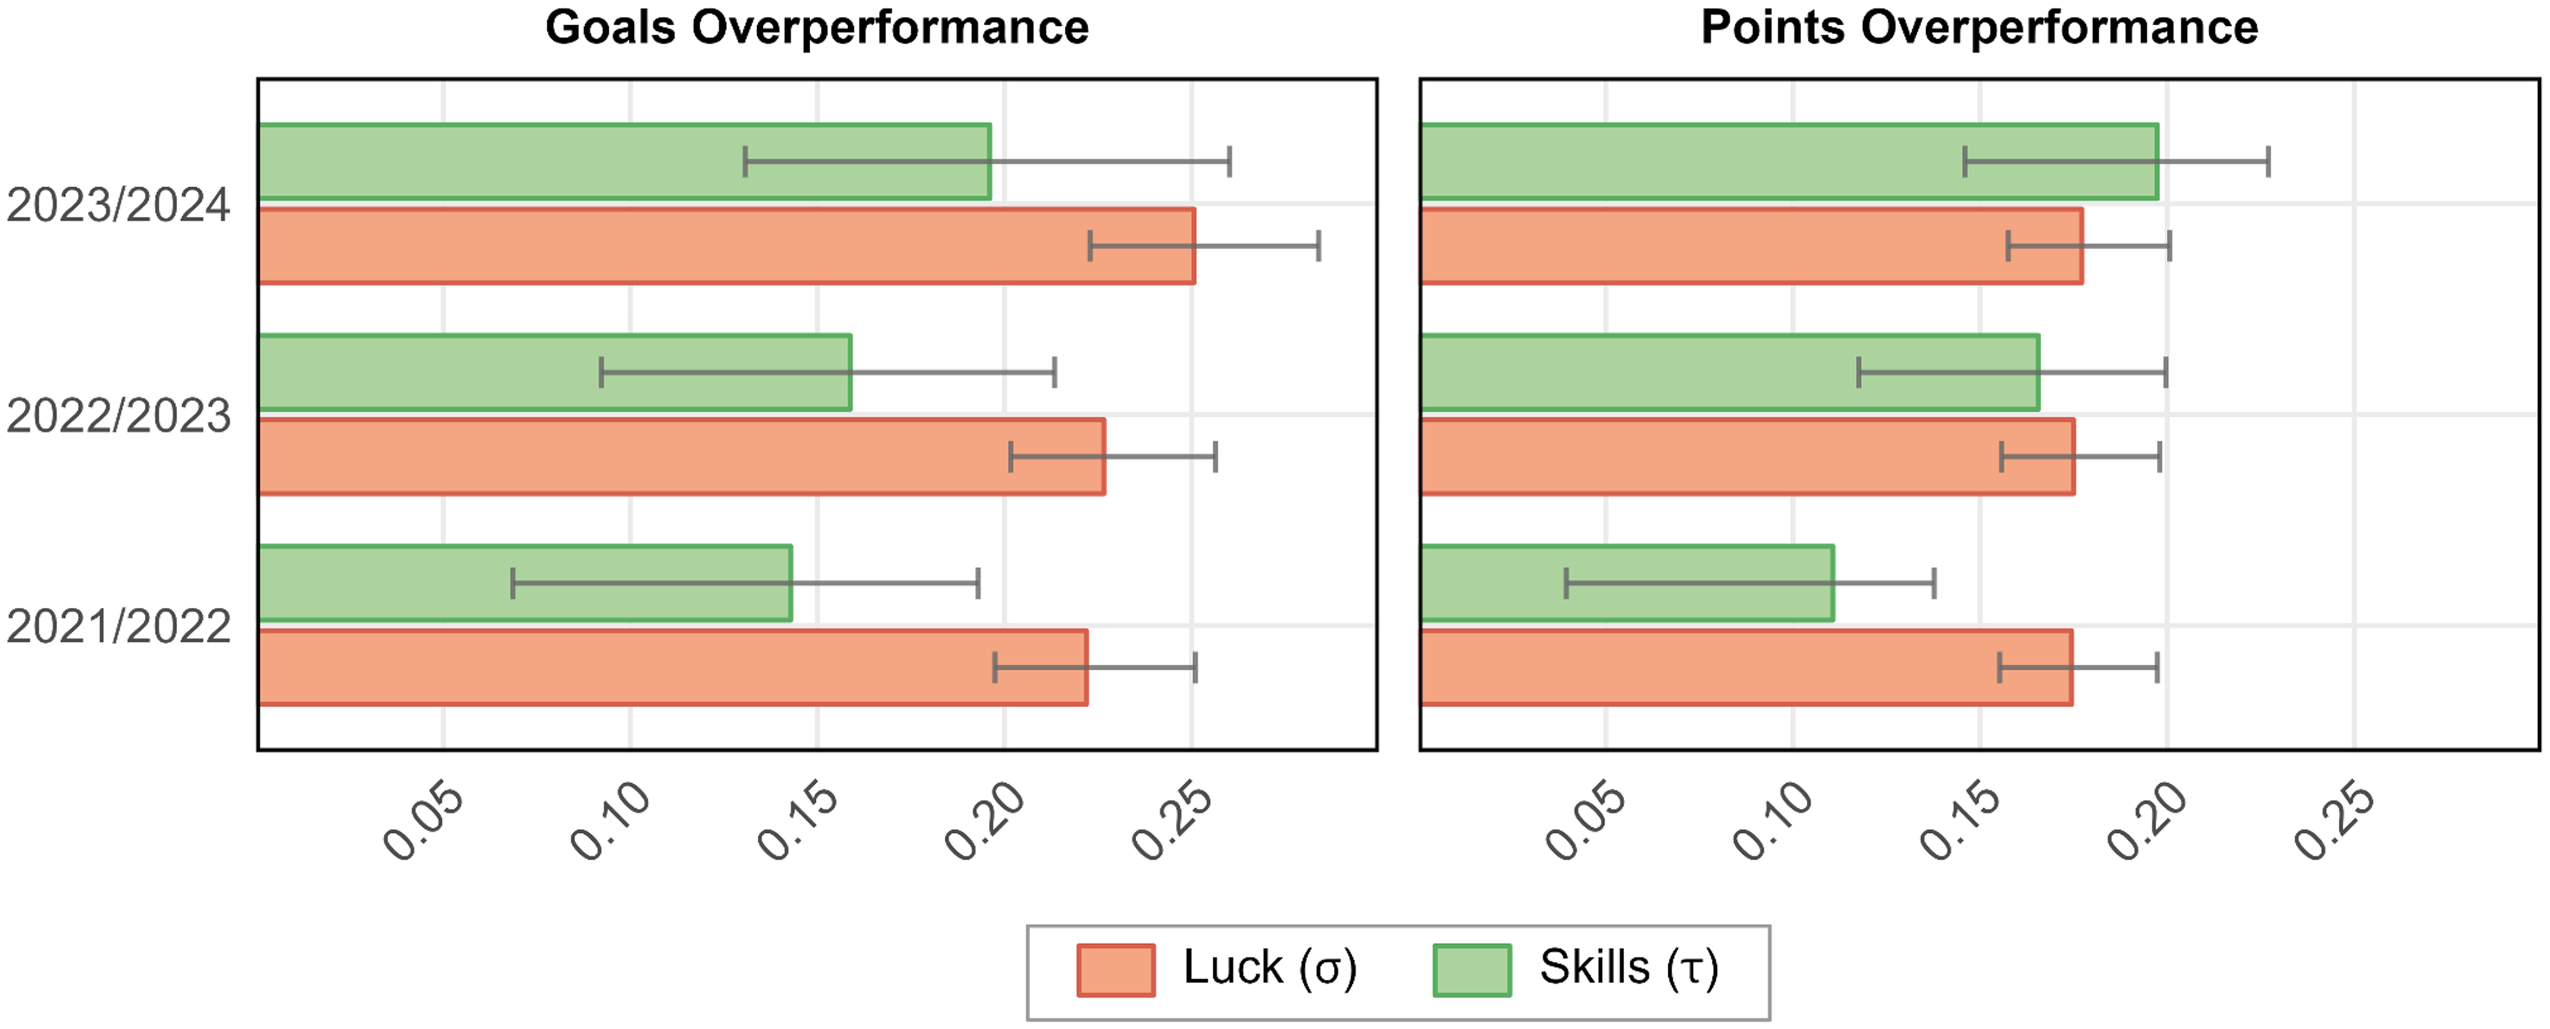
Luck vs. Skills in Goals Overperformance and Points Overperformance per Season.
Variance Component Estimates for the Four Overperformance Measures for Each Season, Pooled Across All Leagues (Preregistered Primary and Secondary Hypothesis Tests).
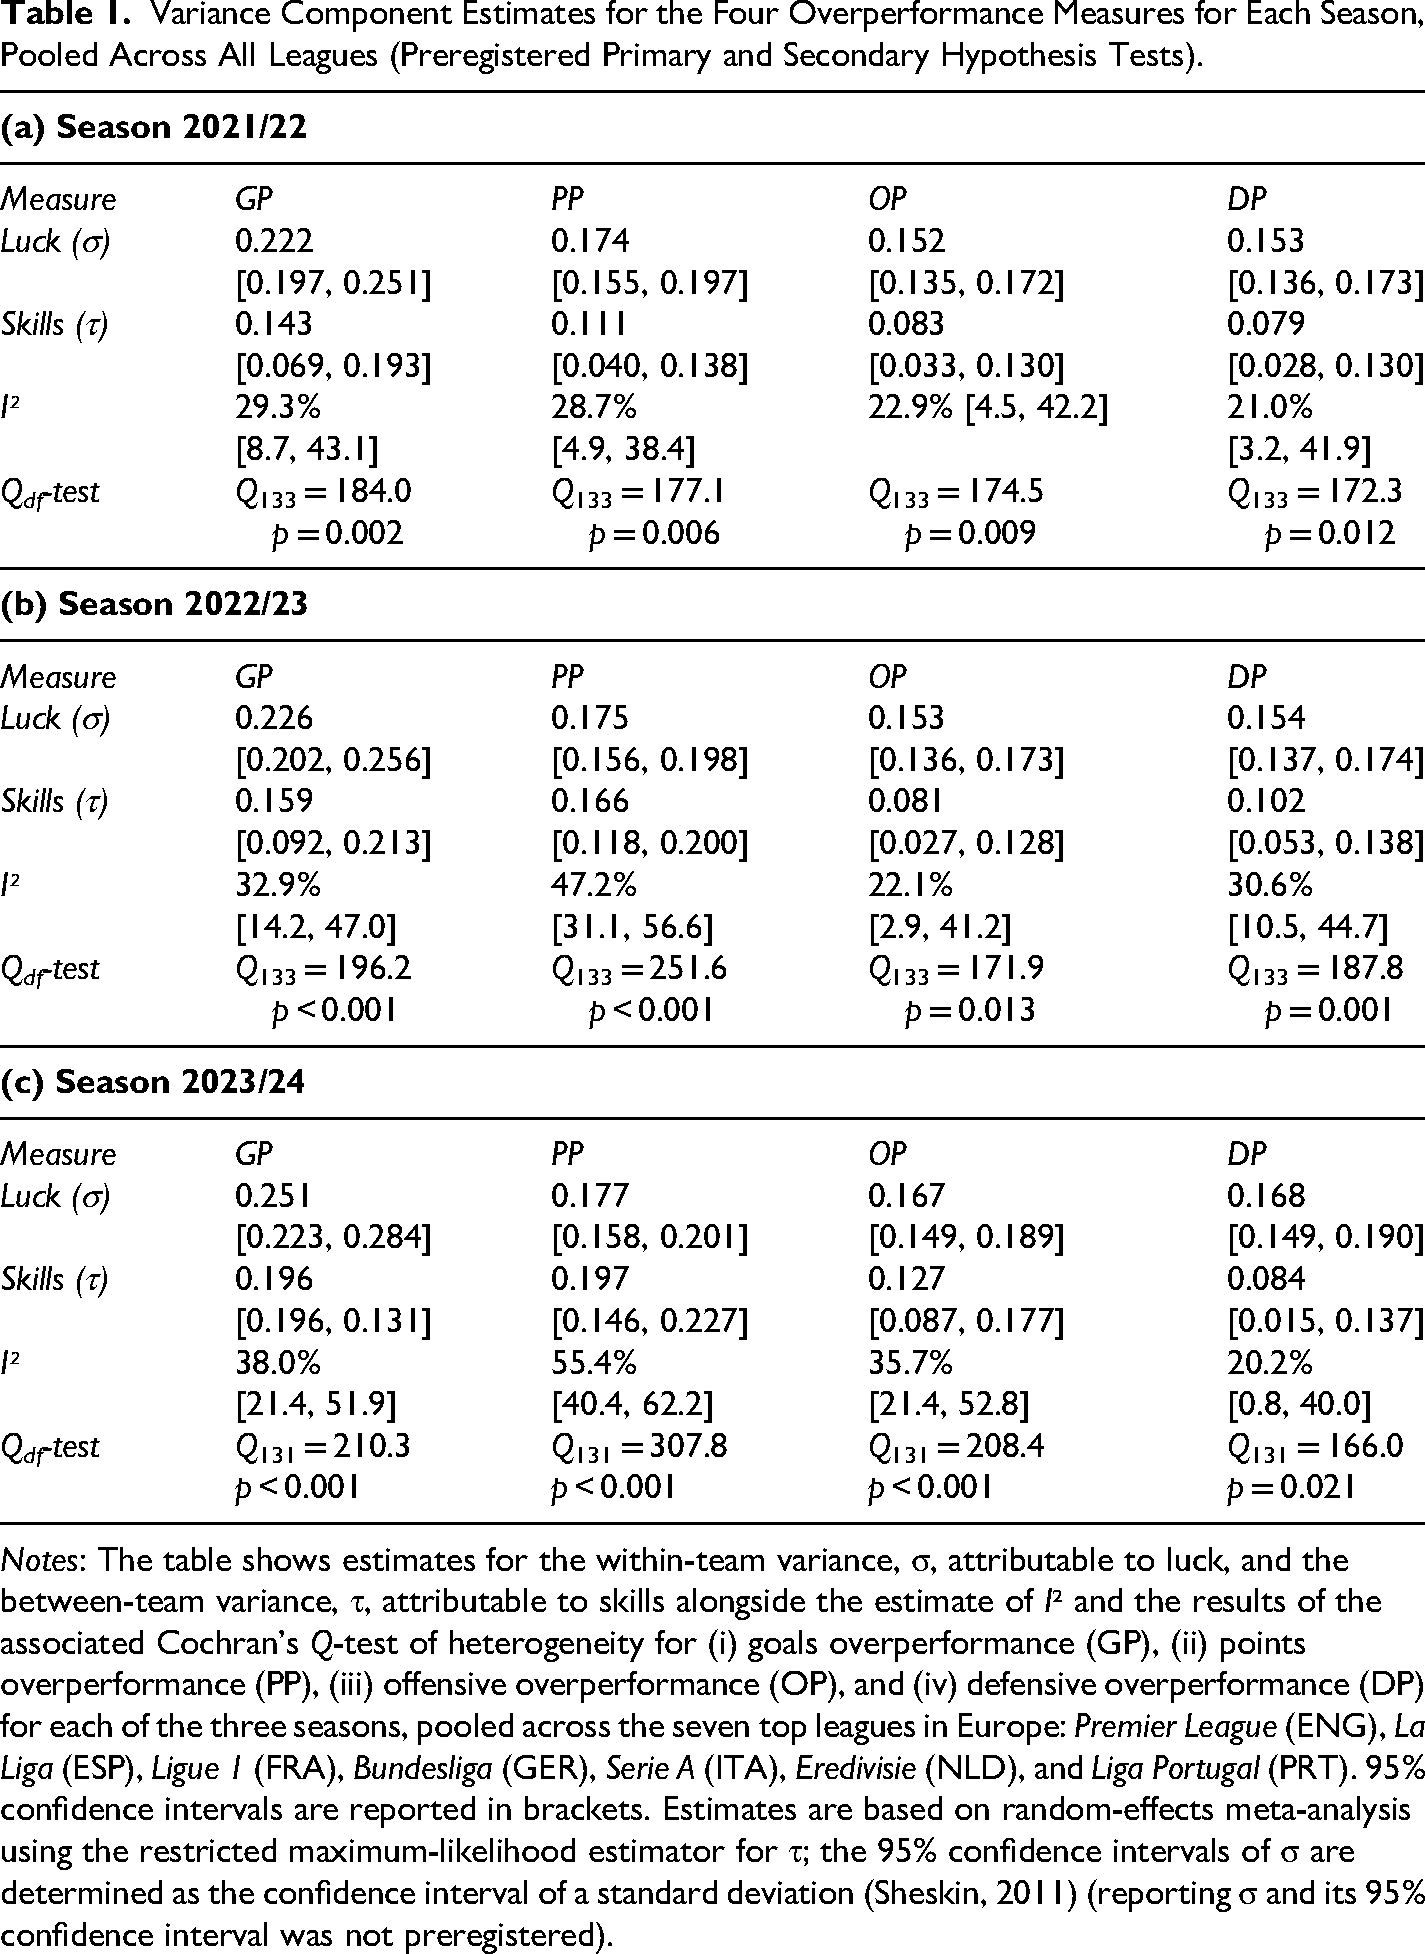
Notes: The table shows estimates for the within-team variance, σ, attributable to luck, and the between-team variance, τ, attributable to skills alongside the estimate of I² and the results of the associated Cochran's Q-test of heterogeneity for (i) goals overperformance (GP), (ii) points overperformance (PP), (iii) offensive overperformance (OP), and (iv) defensive overperformance (DP) for each of the three seasons, pooled across the seven top leagues in Europe: Premier League (ENG), La Liga (ESP), Ligue 1 (FRA), Bundesliga (GER), Serie A (ITA), Eredivisie (NLD), and Liga Portugal (PRT). 95% confidence intervals are reported in brackets. Estimates are based on random-effects meta-analysis using the restricted maximum-likelihood estimator for τ; the 95% confidence intervals of σ are determined as the confidence interval of a standard deviation (Sheskin, 2011) (reporting σ and its 95% confidence interval was not preregistered).
The estimated between-team standard deviation, τ, varies between 0.143 and 0.196 for goals overperformance, with a mean of 0.166 across the three seasons; for points overperformance, τ estimates range from 0.111 to 0.197, with a mean of 0.158. These estimates suggest that the standard deviation in performance relative to expectations among teams is 0.166 goals and 0.158 points per game. The remaining variability in overperformance can be attributed to luck. The estimated within-team standard deviation, σ, averaged over the three seasons, varies between 0.222 and 0.251, with a mean of 0.232 for goal difference, while σ estimates for points overperformance range from 0.174 to 0.177, with a mean of 0.175. Overall, the estimated variability attributed to luck turned out to be very robust across the three seasons, while the dispersion in overperformance due to skills was slightly more divergent. Note that we did not preregister the reporting of the standard deviation due to luck (σ); however, it follows directly from our preregistered estimates of I² and τ. The 95% confidence intervals for σ are based on the derivation of confidence intervals for standard deviations (Sheskin, 2011).
Preregistered Secondary Hypothesis Tests
In two secondary hypotheses, we focus on the components that constitute goals overperformance: offensive and defensive overperformance. Offensive overperformance (OP) is defined as the difference between the actual number of goals scored and expected goals; defensive overperformance (DP) is defined as the difference between expected goals conceded and the actual number of goals conceded. We hypothesized that part of the variability in offensive and defensive overperformance is systematic (heterogeneity). The two hypotheses are tested in the same way as the primary hypotheses above. The results are illustrated in Figures 2 and 4; detailed results are provided in Table 1. For offensive overperformance, Cochran's Q-test indicates statistically significant evidence (p < 0.005) of heterogeneity in the 2023/24 season and suggestive evidence (p < 0.05) in the remaining two seasons. For defensive overperformance, we report statistically significant evidence of heterogeneity in the 2022/23 season and suggestive evidence in the 2021/22 and 2023/24 seasons. Thus, overall, we find support for our two secondary hypotheses, suggesting that the variability in the two primary outcome measures (i.e., goals and points overperformance) is driven by skills in realizing goal opportunities and preventing opponents’ scoring opportunities alike.
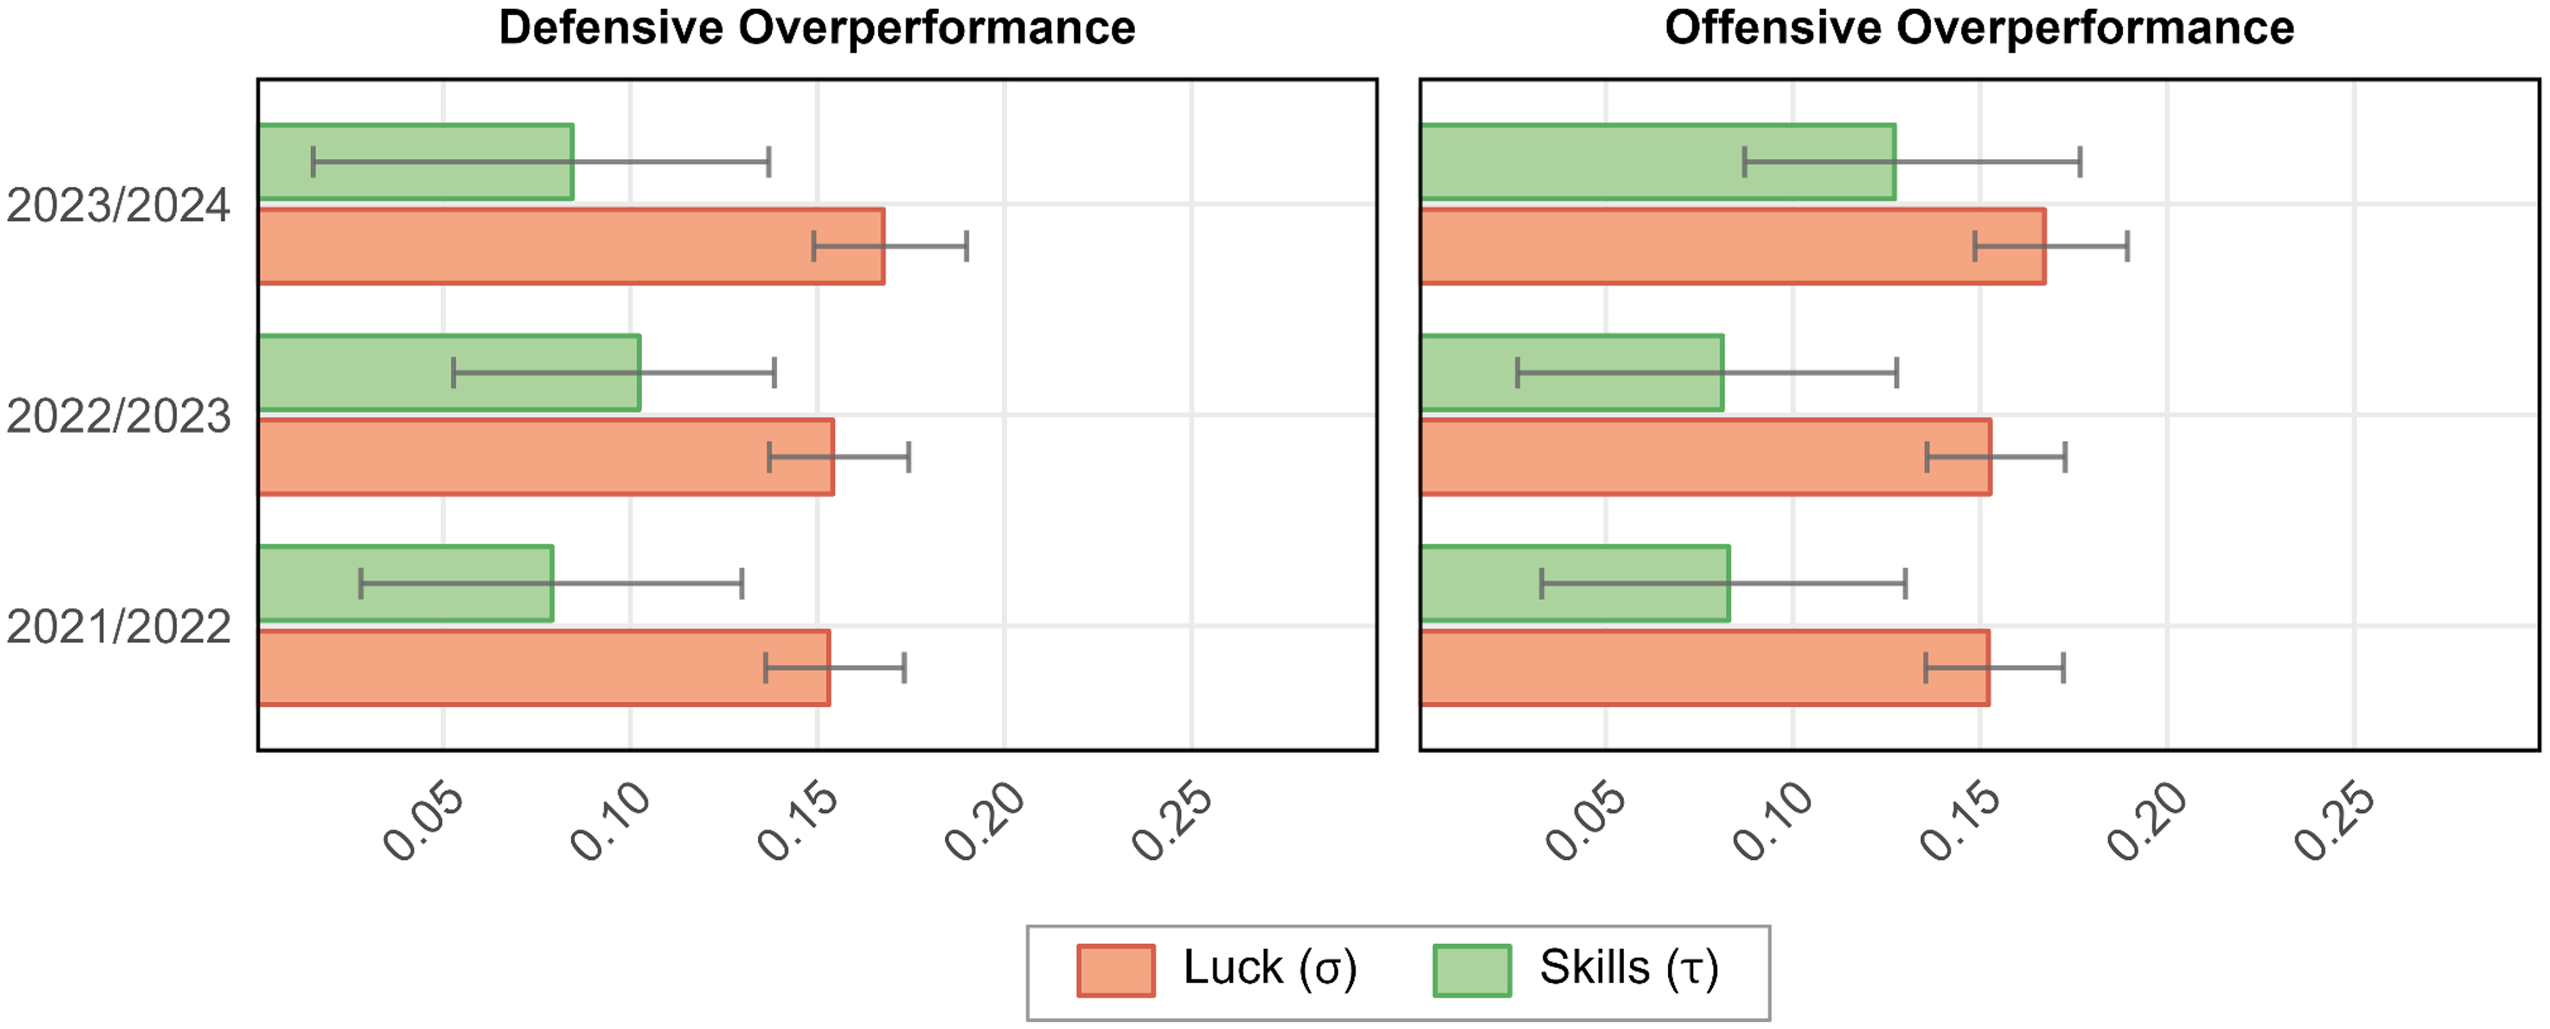
Luck vs. Skills in Offensive Overperformance and Defensive Overperformance per Season.
The estimated I² for offensive overperformance ranges from 22.1% to 35.7% across the three seasons, with an average of 26.9%, and from 20.2% to 30.6%, with an average of 23.9%, for defensive overperformance (see Figure 2). On average, about 25% of the variation in offensive and defensive overperformance can be attributed to skills, while the remaining variability is due to luck. This is somewhat lower than for goals overperformance and points overperformance, but the confidence intervals in the I² estimates are relatively wide. For offensive overperformance, the estimated τ varies between 0.081 and 0.127 across the three seasons, with an average of 0.097; for defensive overperformance, τ ranges from 0.079 to 0.102, with an average of 0.088. These estimates suggest that the standard deviation in over-/underperformance across teams due to skills, on average, is 0.097 in terms of goals scored per game and 0.088 in terms of goals conceded per game. The remaining dispersion in teams’ performance relative to expectations can be attributed to luck. The standard deviation due to luck, σ, varies between 0.152 and 0.167, with a mean of 0.157 for offensive overperformance, and between 0.153 and 0.168, with a mean of 0.158 for defensive overperformance. As for the primary outcomes, σ estimates turned out to be robust across the three seasons, whereas τ estimates are somewhat more variable. Note that we, as stated above, did not preregister the reporting of σ; however, it follows directly from our preregistered estimates of I² and τ.
Preregistered Exploratory Analyses: Subgroup Analyses
For completeness, we revisit the primary and secondary hypotheses separately for each league in exploratory analyses. The statistical power in these tests is obviously lower, and the results should be interpreted with caution. These results are reported in Online Appendix Tables 9–15. The point estimates of heterogeneity are consistent with the results reported above, but the estimates are less precise due to the lower sample sizes. For goals overperformance, I² varies between 0.0% and 57.3% across league seasons, τ varies between 0.000 and 0.309, and σ varies between 0.195 and 0.281. For points overperformance, I² varies between 0.0% and 74.0% in the different estimates, τ varies between 0.000 and 0.301, and σ varies between 0.164 and 0.197.
Preregistered Robustness Tests
As robustness tests of all the primary, secondary, and exploratory hypotheses tested above, we estimate ordinary least squares regressions on the game-per-team level, with the hypothesis test's outcome variable entering as the dependent variable and team fixed effects entering as the independent variables. Standard errors are clustered at the game level, and the regression models are estimated separately for each season. To test for heterogeneity, we carry out a Wald test of whether the team fixed effects are jointly significant; the extent of heterogeneity is quantified in terms of the regression's R². These results, reported in Table 2, with separate results per league in Online Appendix Tables 16–22, are in line with the meta-analysis results reported above. Particularly, the Wald tests indicate statistically significant (suggestive) evidence of heterogeneity in eight (four) of the twelve regression analyses.
R² and Wald Test Results of Joint Significance of Team Fixed Effects in Game-Level Ordinary Least Squares Regressions of the Four Overperformance Measures for Each Season, Pooled Across All Leagues (Preregistered Robustness Test).
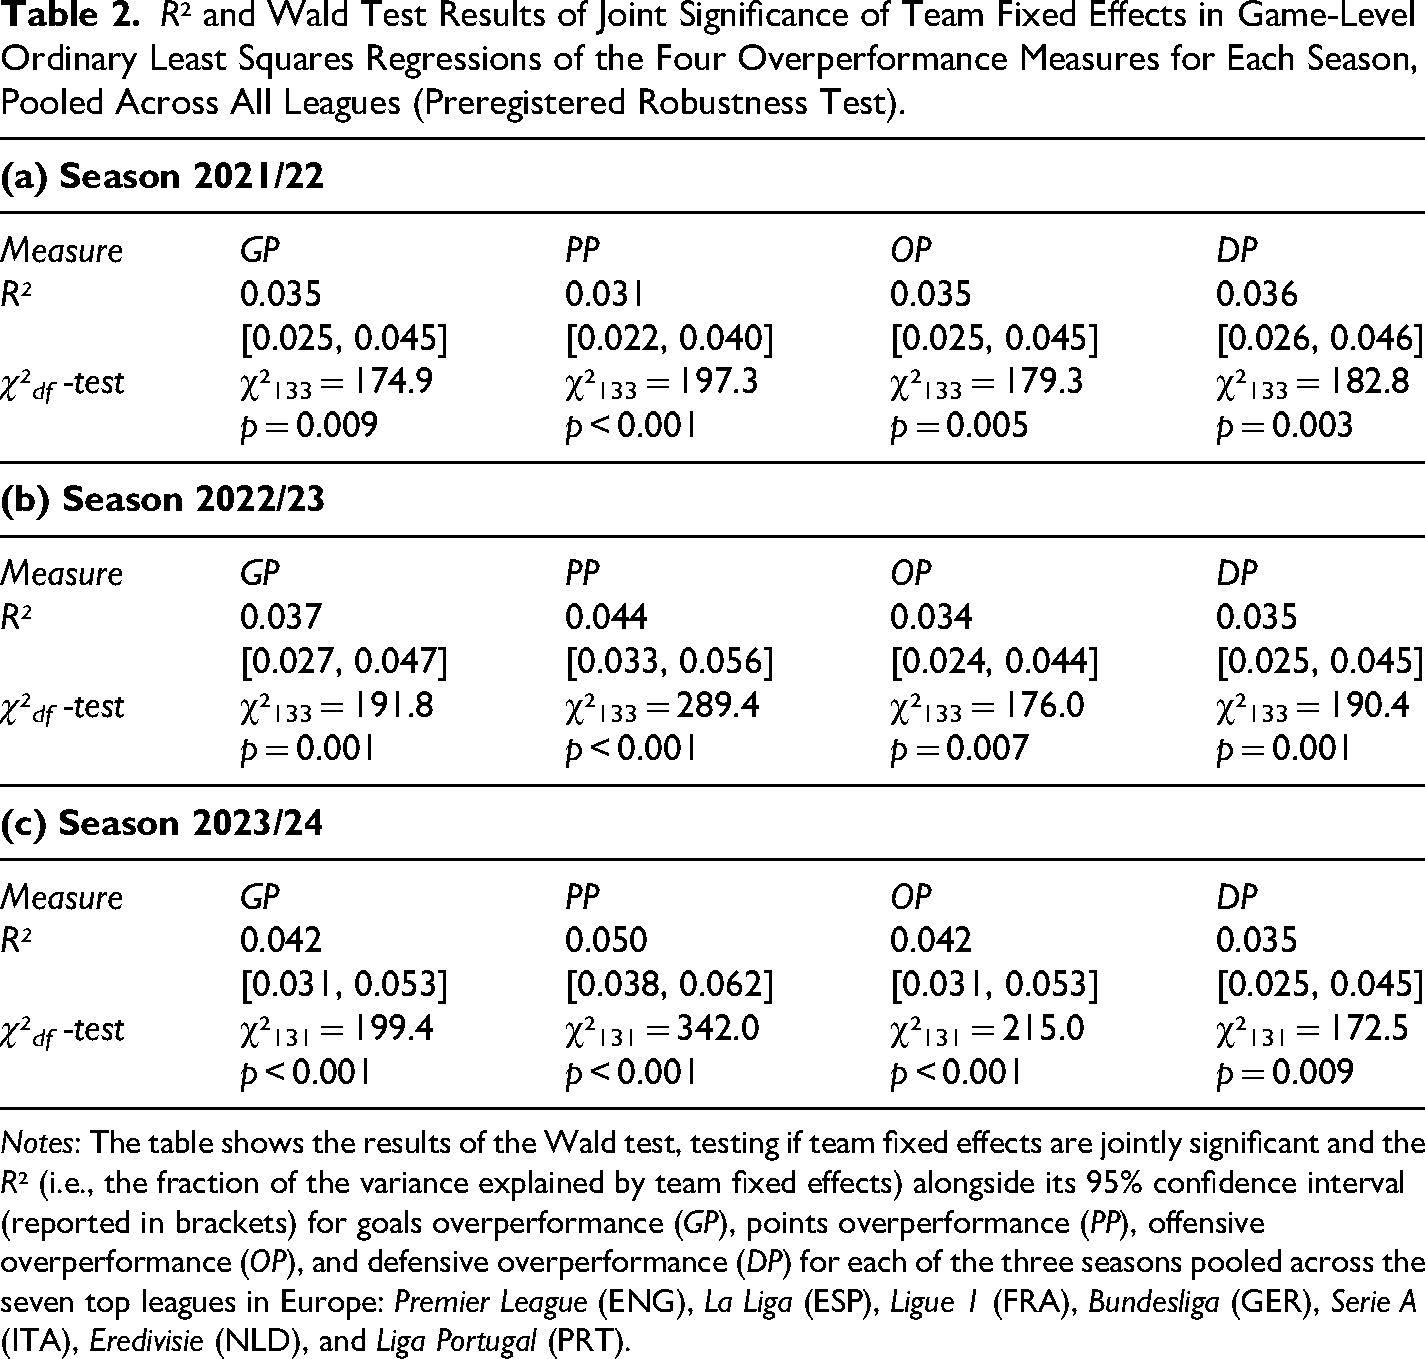
Notes: The table shows the results of the Wald test, testing if team fixed effects are jointly significant and the R² (i.e., the fraction of the variance explained by team fixed effects) alongside its 95% confidence interval (reported in brackets) for goals overperformance (GP), points overperformance (PP), offensive overperformance (OP), and defensive overperformance (DP) for each of the three seasons pooled across the seven top leagues in Europe: Premier League (ENG), La Liga (ESP), Ligue 1 (FRA), Bundesliga (GER), Serie A (ITA), Eredivisie (NLD), and Liga Portugal (PRT).
The R² in the robustness tests of the primary and secondary hypotheses across seasons ranges from 3.5% to 4.2% for goals overperformance, from 3.1% to 5.0% for points overperformance, from 3.4% to 4.2% for offensive overperformance, and from 3.5% to 3.6% for defensive overperformance. Note that the R2 in the robustness analyses captures the fraction of the variance per game explained by heterogeneity, whereas I² in the random-effects meta-analyses quantifies the fraction of the variance per team per season. Consequently, R2 and I² estimates cannot be directly compared with one another.
Simulations Illustrating the Impact of Luck on League Positions (Not Preregistered)
We explore the impact luck has on the end-of-season table ranking of teams using simulations. This exercise and the corresponding results are exploratory and should be interpreted cautiously due to the absence of preregistration. As the impact of luck will depend on the association between expected points and skills (where skills are defined as the systematic variation in points overperformance between teams), we start by estimating random-effects meta-regressions testing if the teams’ expected points moderate over- and underperformance. Particularly, we conduct meta-regressions of the mean points overperformance on the mean team-level expected points separately for each of the three seasons; the results are reported in Table 3. We find a statistically significant association between skills and performance relative to expectations in all three seasons, with an average coefficient of 0.393, implying that a one-point increase in expected points is associated with an increase of 0.393 points per game (translating into 14.9 points per season with 38 games). This suggests that teams that are expected to receive more points are more likely to overperform, indicating that teams that are more skilled overall, as measured by expected points, are also more adept at converting shots into goals and preventing opponents from converting their shots. As these tests were not preregistered, these results need to be confirmed in future confirmatory analyses to carry more weight.
Meta-Regressions of Points Overperformance on Expected Points per Season.
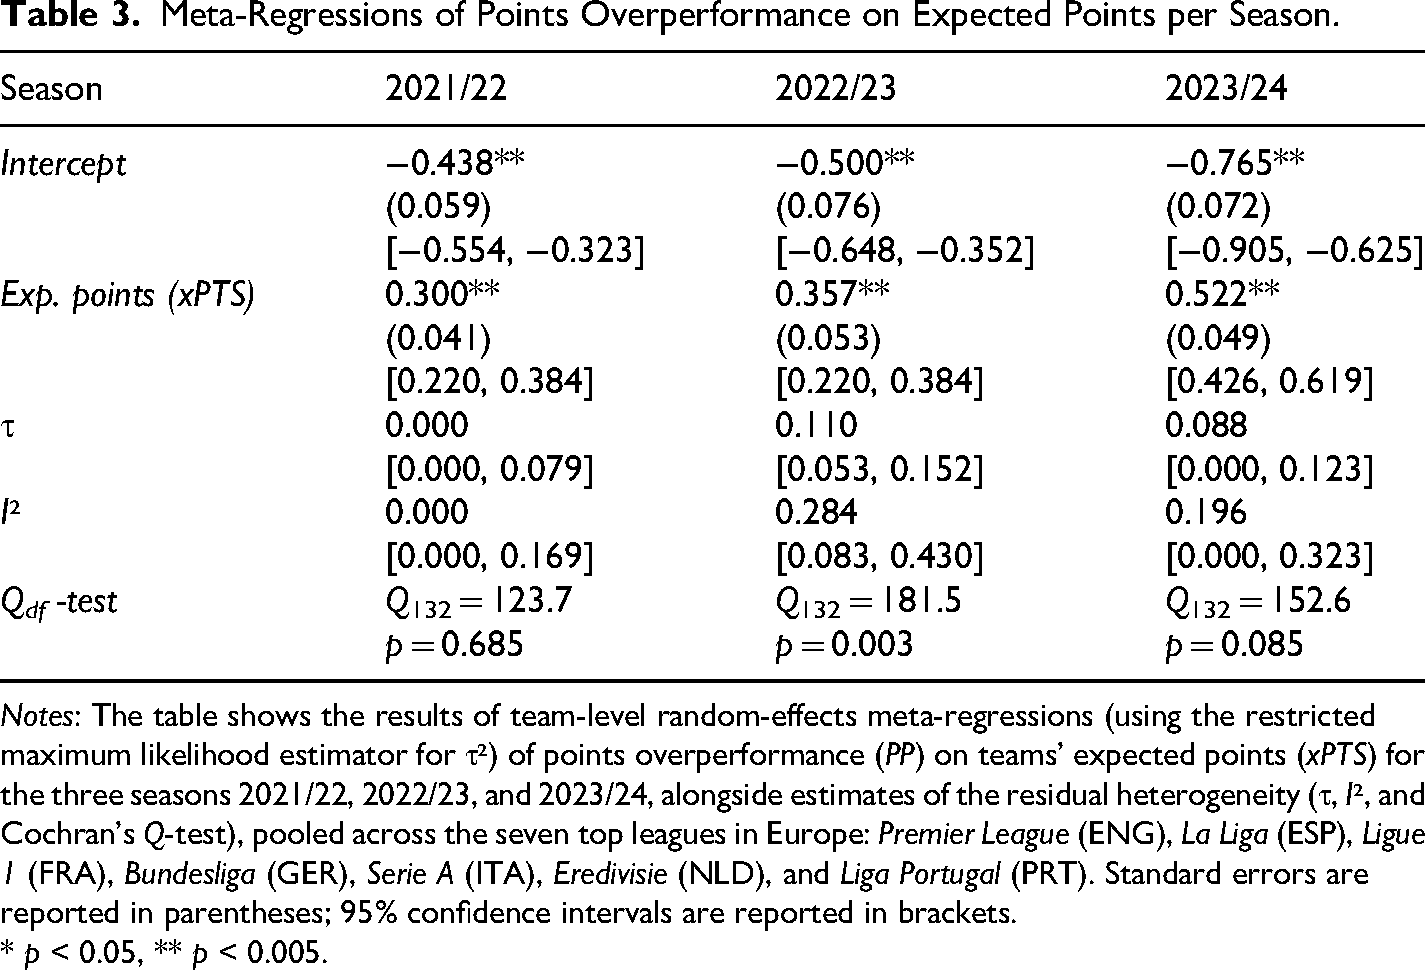
Notes: The table shows the results of team-level random-effects meta-regressions (using the restricted maximum likelihood estimator for τ²) of points overperformance (PP) on teams' expected points (xPTS) for the three seasons 2021/22, 2022/23, and 2023/24, alongside estimates of the residual heterogeneity (τ, I², and Cochran's Q-test), pooled across the seven top leagues in Europe: Premier League (ENG), La Liga (ESP), Ligue 1 (FRA), Bundesliga (GER), Serie A (ITA), Eredivisie (NLD), and Liga Portugal (PRT). Standard errors are reported in parentheses; 95% confidence intervals are reported in brackets.
* p < 0.05, ** p < 0.005.
To illustrate how variability attributable to luck translates into variability in end-of-season league rankings, we engage in a simple simulation exercise, which we carry out separately for each league and season (as described in more detail in the Materials and Methods section above). The results are illustrated in Figure 5. Across leagues and seasons, the average change in league positions due to luck varies between 1.389 and 2.359, with an average of 1.781, and the likelihood that the winning team is altered due to chance varies between 0.4% and 74.4% (m = 33.9%). The impact of luck changes the list of top teams qualifying for the Champions League with a probability ranging from 1.6% to 92.0% (m = 56.0%), while the set of teams facing relegation is altered with a probability varying from 35.8% to 96.5% (m = 75.9%).
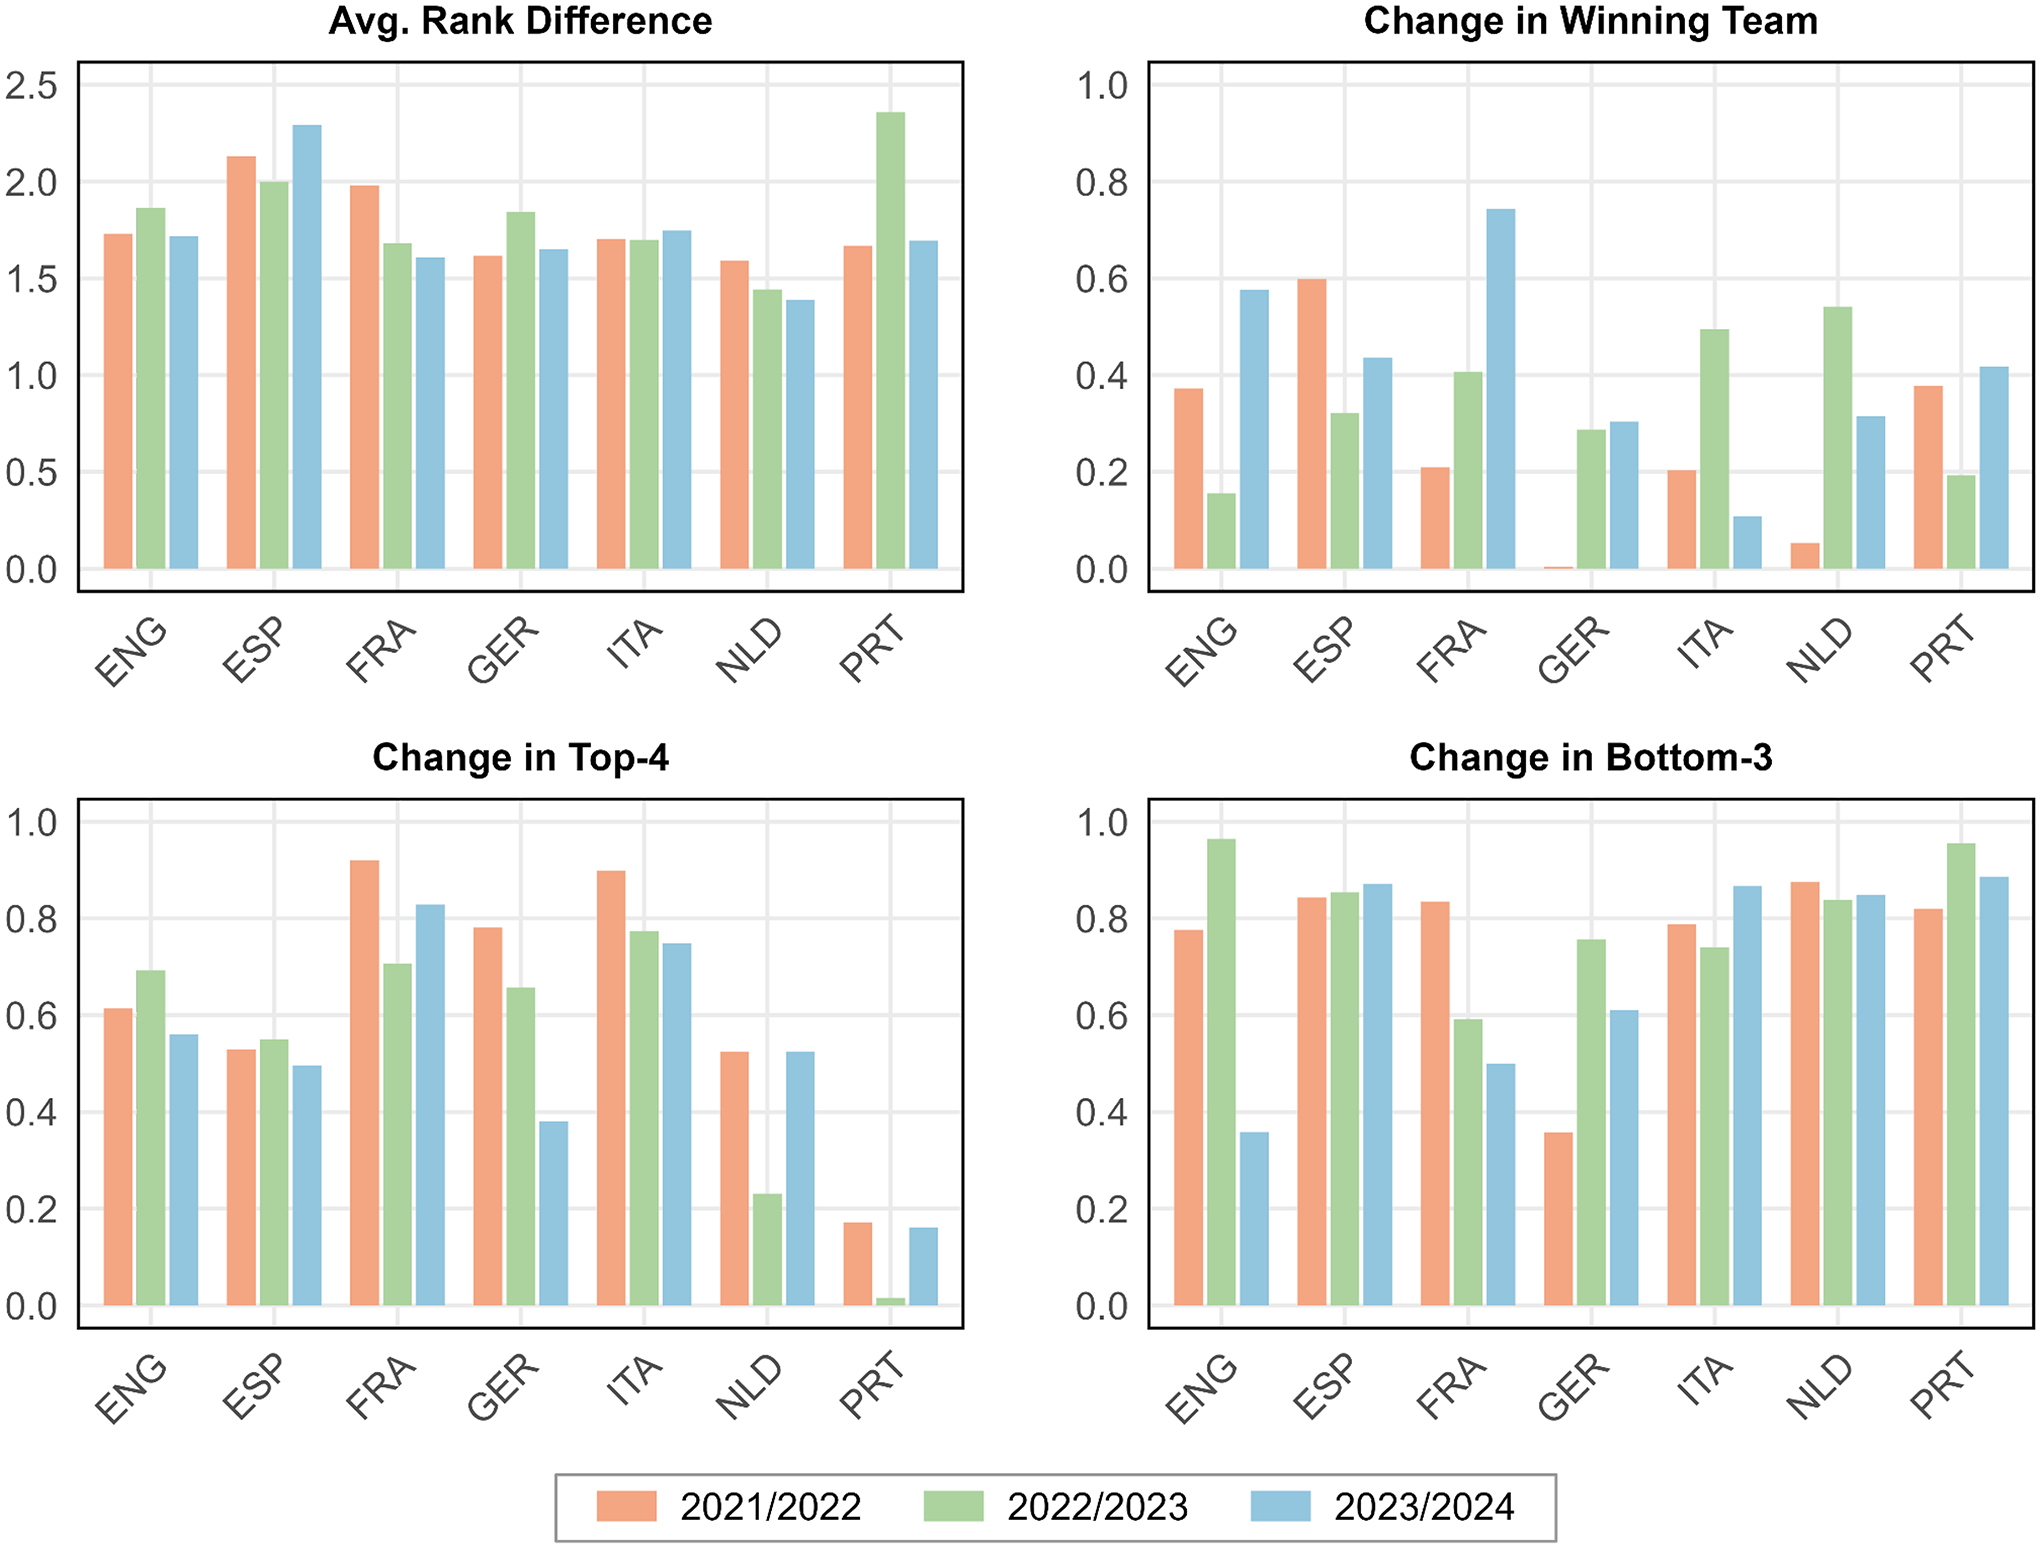
Simulation Results (Not Preregistered).
Discussion
We tested two primary hypotheses about the presence of heterogeneity in goals overperformance and points overperformance across seven football leagues in Europe for three seasons, hypothesizing that part of the variability in deviations from the expected performance is attributable to skills. We reported statistically significant evidence of heterogeneity in five of the tests, while suggestive evidence was noted in the sixth test. This suggests that there are moderators of teams’ overperformance, which are not accounted for in performance predictions. In addition, two secondary hypothesis tests provided support for the existence of systematic variability above and beyond chance in offensive and defensive overperformance. Therefore, we found strong support for heterogeneity in over- and underperformance, which is indicative of skills explaining part of the variability in teams’ performance relative to expectations in football.
Regarding the magnitude of heterogeneity, our point estimates indicate that skills account for approximately 40% of the variation in over- and underperformance, while luck accounts for roughly 60% of the deviations from expected performance. Over the course of three seasons (consisting of 38 matches each), the average estimated standard deviation in over- and underperformance due to skills (τ) is approximately 6 points per season, while the average standard deviation due to luck (σ) is about 7 points per season. These estimates suggest that the ability to perform better than expected can significantly impact a team's final position in the league, especially for teams that are closely ranked in the league position table. Additionally, our analysis suggests that luck also plays a crucial role in determining league positions. Simulation results show that, on average, luck can affect a team's rank by 1.781 positions and has a 56.0% probability of affecting the top four positions, securing qualification for the Champions League.
There are some important caveats regarding our results. We focused solely on luck as an explanation for teams’ performance relative to expectations instrumentalized in terms of expected goals (xG) and expected points (xPTS). However, it is likely that luck also plays a role in determining the number of shots in a game, which is not incorporated in our results. The variability in our outcome measures will also depend on the predictive ability of the expected goals data used. Our results indicate significant heterogeneity, suggesting that the predictive accuracy of the xG data used is decent but not optimal as a performance indicator. As these predictions become more sophisticated, the variation in outcome measures between teams may decrease. The expected goals data used in this study is based on the position of the shots as well as the location of defenders and goalkeepers. However, if additional variables associated with the efficiency of converting shots into goals were modeled, the predictions may capture part of the variation in over- and underperformance that we attributed to skills. This expected decrease in heterogeneity attributable to skills suggests that our estimates of the significance of skills in these outcome measures set an upper bound on the maximum additional variation that more sophisticated prediction models can explain. One additional variable that could enhance the predictive accuracy of expected goals data is modeling the identity of the player with the goal-scoring opportunity, allowing for the inclusion of differences in player-specific skills in converting shots into goals. The lack of publicly available game-level data on expected goals from different providers complicates the process of testing for differences between different estimations of expected goals and points. However, we analyzed the correlation between expected goals and points at the season level for the 2023/24 season across the top five leagues using data from Understat (https://understat.com/), the data provider referenced in the study by Sarkar and Kamath (Sarkar & Kamath, 2023). We manually sourced the data from the league tables featuring expected goals and points from the Understat website, noting that data for Eredivisie (NLD) and Liga Portugal (PRT) are not available. The Pearson correlations for expected goals ranged from 0.966 to 0.983 across the five leagues, and for expected points, the correlations varied between 0.962 and 0.991. It is important to note that the luck component of the variation in overperformance—defined as the fraction of the variability between teams not explained by heterogeneity—may depend on omitted variables, model limitations, or systematic dispersion that xG models do not account for, which could potentially result in an overestimation of the luck component.
Applying our methodology to more leagues and seasons in future research could enhance the precision of estimates of the variability attributable to luck and skills. Additionally, it opens up opportunities to investigate whether the skills component of performance relative to expectations is related to specific team characteristics or individual players. Our methodology can also be adapted to analyze individual players instead of teams to determine the extent to which deviations from expected goals for players are explained by skills or luck.
Supplemental Material
sj-pdf-1-jse-10.1177_15270025251374620 - Supplemental material for Skills vs. Luck: Decomposing Deviations from Expected Performance in European Football Leagues
Supplemental material, sj-pdf-1-jse-10.1177_15270025251374620 for Skills vs. Luck: Decomposing Deviations from Expected Performance in European Football Leagues by Felix Holzmeister and Magnus Johannesson in Journal of Sports Economics
Footnotes
Funding
The authors received no financial support for the research, authorship, and/or publication of this article.
Declaration of Conflicting Interests
The authors declared no potential conflicts of interest with respect to the research, authorship, and/or publication of this article.
Supplemental Material
Supplemental material for this article is available online.
Notes
Author Biographies
References
Supplementary Material
Please find the following supplemental material available below.
For Open Access articles published under a Creative Commons License, all supplemental material carries the same license as the article it is associated with.
For non-Open Access articles published, all supplemental material carries a non-exclusive license, and permission requests for re-use of supplemental material or any part of supplemental material shall be sent directly to the copyright owner as specified in the copyright notice associated with the article.