
Abstract
Attendance in women’s soccer is on the rise in Europe, making it the most-watched women’s team sport. Without massive financial backing from TV contracts, economic success heavily depends on ticket revenue. As women’s matches are typically played on weekends, clubs face competition from men’s soccer over fans’ interest and potentially stadium attendance. Covering data from ten seasons in Germany’s Women’s Federal League (Frauen-Bundesliga), this article empirically tests if overlaps with men’s soccer games have any adverse demand on women’s soccer games.
Introduction
While gender differences in sports participation are declining (Burton, 2015; Capranica et al., 2013; Eime et al., 2021; Houghton et al., 2017), there still is a considerable discrepancy in demand for female and male sports leagues (Lagaert & Roose, 2018). With soccer being the most popular sport worldwide, attendance in first divisions differs significantly between women’s and men’s German Bundesliga leagues. In the season 2023/24, the average attendance was 39,506 for men’s games and 2,865 for women’s games (transfermarkt.de; soccerdonna.de). This comparatively low number makes the German Frauen-Bundesliga rank second in European women’s leagues, trailing only the FA Women’s Super League with an average attendance of 7,380 spectators per game (footballwebpages.co.uk). Attendance numbers for the German first division of women’s soccer are sparked by single games with very high attendance, such as the game between Frankfurt and Cologne on April 23, 2023, drawing a record crowd of 38,365 attendees. Many other games in the same season only raised the interest of a three-digit number of spectators.
The drivers for demand in women’s soccer have hardly been researched yet and are the main focus of the paper at hand. Particular attention is paid to the potential substitution effects between men’s and women’s soccer leagues in Germany. Games in different leagues can be framed as potential substitutes for those interested in soccer. This paper determines if and how strong demand for women’s Bundesliga soccer is impacted by parallel games in men’s Bundesliga soccer. Before turning the attention to the data analysis, the following section describes the state of research on attendance in women’s soccer.
Literature
The decision to attend a sports event live is a choice between alternatives, and the (un)availability of substitutes significantly influences the demand for sports events (Rottenberg, 1956). Substitutes for stadium spectators are highly idiosyncratic. However, from a theoretical perspective, it seems plausible to assume that games from other leagues are perceived as (imperfect) substitutes (Mongeon & Winfree, 2013). Spectators also have a preference for higher game quality (Rosen, 1981), prefer known and established quality over unknown talent (MacDonald, 1988), and build up consumption capital over time for famous players, and teams (Adler, 1985). Accordingly, if games take place in close proximity, individuals interested in stadium tickets are likely to prefer games from higher-level leagues over lower-level league games. This type of substitution relates to the spatial dimension, that is, the proximity of alternatives, as first discussed by Hotelling (1929). Empirical findings confirm substitution effects (i) within the same league (Baade & Tiehen, 1990; Demmert, 1973; Hansen & Gauthier, 1989; Hill et al., 1982; Noll, 1974; Winfree, 2009b; Winfree et al., 2004), (ii) between different sports (Paul, 2003; Rascher et al., 2009; Winfree, 2009a), and (iii) between different leagues in the same sport (Gitter & Rhoads, 2010; Rascher et al., 2009; Wallrafen et al., 2019; Winfree, 2009a).
Borland and MacDonald (2003) provide a systematic overview of determinants for stadium ticket demand. The demand factors they identify continue to serve as the foundation for nearly all empirical research on stadium demand to this day. An overview of recent studies is presented by Schreyer and Ansari (2022). They, like Leeds and Leeds (2013) a decade before them, note that women’s sports receive almost no attention in sports economics research. The following studies are exceptions to this trend. Some of the previous studies on demand for women’s leagues investigate motives for planned consumption (as summarized in the next section), while others examine actual consumption. For women’s soccer, Coates (2013) investigates the sustainability of hosting the Women’s World Cup in terms of the demand for domestic league games in the USA and does not find a positive effect. His argument, however, is not based on ticket demand but rather on the poor economic development of women’s leagues. Regarding the German Women’s Bundesliga, Hallmann (2012) observes a low level of awareness, especially when compared to the Women’s National Team. Surveys conducted after the Women’s World Cup hosted in the home country confirm relatively low interest in league matches. Gomez-Gonzalez et al. (2024) perform an experiment showing participants’ unmodified and blurred video clips of elite female and male soccer players. When participants watch blurred videos that do not identify the gender of the players, ratings for women’s and men’s videos do not differ significantly.
Regarding the determinants of demand, only initial findings are available for women’s soccer. Meier et al. (2016) examine ticket demand for games in the German Women’s Bundesliga from 1998 to 2012. Their results partially support the findings for the men’s league matches and show that the number of tickets sold depends on factors such as the expected match quality, the relevance of the game for the championship, and the weather on the day of the match. A similar study for ticket demand in the Women’s Professional Soccer League is presented by LeFeuvre et al. (2013). They demonstrate that demand for matches increased subsequent to the USA Team securing second place in the 2011 World Cup. Valenti et al. (2020) analyze games in the UEFA Women’s Champions League (UWCL) from 2009 to 2018. They identify the competition round, uncertainty of match outcome, the reputation of the visiting team, and the weather as the main determinants of ticket demand. In a related study for the English FA Women's Super League, the same group of researchers (Valenti et al., 2024) finds that strong local economy, weekend games, favourable weather, and shorter travel distances increase attendance at FA WSL matches. They also capture the effect of integrated clubs and show reduced attendance for women’s matches when these clash with games of the respective men’s team. If games of men’s and women’s teams of the same club are played in temporal succession, attendance increases. For data from various leagues, (Hadwiger et al., 2024) also indicate that integrated women’s football teams can, in fact, attract larger crowds. They note that synergies are not a given emerging from a strong brand effect. In contrast, positive effects, for example, the temporary relocation to the men’s home stadium, can be seen. They also highlight the importance of scheduling for attendance.
This paper’s contribution to the literature is twofold. First, it demonstrates much-needed insights into the spectator demand for women’s sports. Second, to the best of our knowledge, it is the first paper to examine substitution effects across women’s and men’s leagues in Germany. The paper results provide the opportunity for integration of match-day planning in women’s soccer. A high degree of substitution towards men’s soccer could optimally indicate not setting women’s games simultaneously.
Data & Empirical Framework
Data
In our study, we focus on women’s soccer in Germany, especially the women’s first division, named Frauen-Bundesliga. The league was founded in 1990 and, according to soccerdonna.de (the equivalent to transfermarkt.de for female soccer), aggregated market valuations of players across the league add to roughly 15.5 million Euro as of February 2024, about half the aggregated value of fourth division men’s teams. The league features twelve teams to compete for the championship. In the Women’s Bundesliga, teams play against each other twice per season, resulting in a total of 22 games per team. In total, 22 matchdays with six matches each aggregate to a total of 132 games per season. Note that the number of teams and matches per season is considerably lower compared to the men’s Bundesliga (18 teams, 306 games per season). Just like in other sports, leagues take years to establish a fan base, which can explain the rather small number of teams per season in our setting (Agha & Berri, 2023).
Our data covers seasons from 2009/10 until 2018/19. Although attendance data is available from the 2008/09 season onwards, numerous missing values led us to start our analysis from the 2009/10 season onward. The onset of the coronavirus disease 2019 (COVID-19) pandemic served as a natural end to our observations, as the following three seasons are strongly affected by attendance restrictions. The women’s data are gathered from soccerdonna.de, and the men’s data are collected from transfermarkt.de. Extra data for weather and betting odds were collected from meteostat.net and betexplorer.com. Missing observations on women’s attendance and stadium names were filled in using data from weltfussball.de.
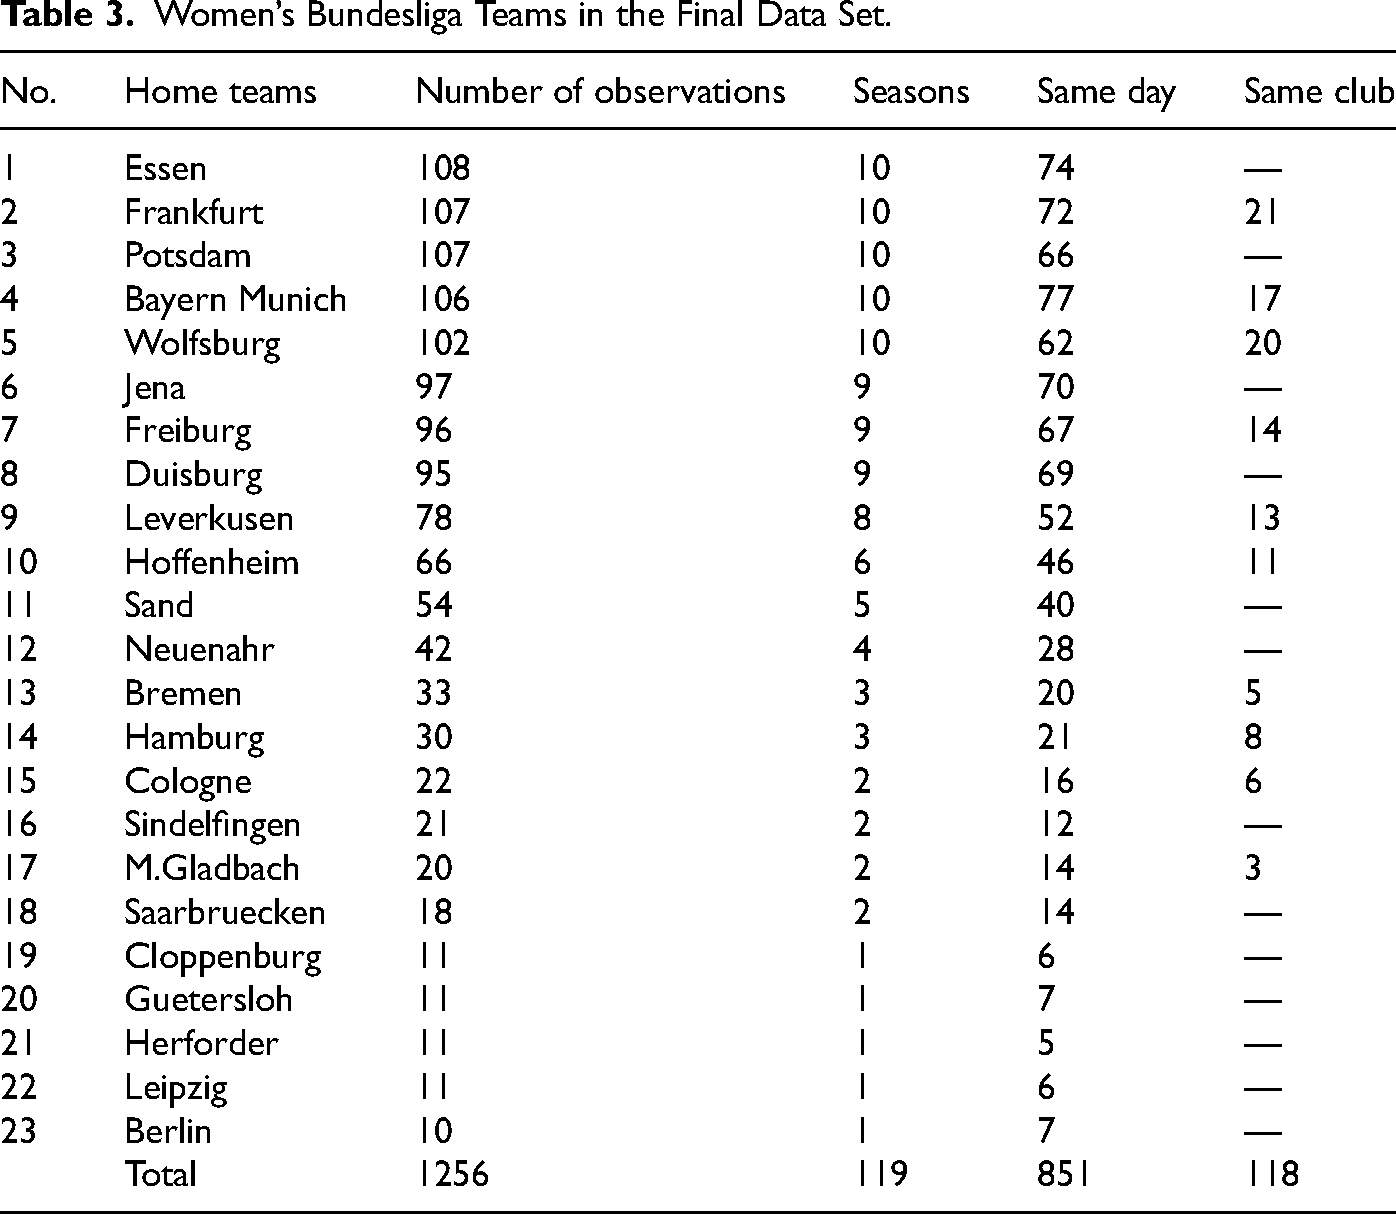
During the ten seasons of data, 23 different teams were part of the Bundesliga. Four teams played a singular season, five played two seasons, two played three seasons, one played four seasons, one played five seasons, one played six seasons, one played eight seasons, three played nine seasons, and five played all ten seasons (See Table 3). The average attendance in our data is slightly below 1,000, with a varying spectrum of fan engagement observed throughout the seasons. Figure 1 shows the average attendance per team and season for teams who played for more than two seasons in the league. Given that teams play eleven home games per season, one can easily observe that many teams fail to attract a four-digit number per game. Attendance ranges from small scale attendance in a match to turnouts exceeding 12,000 fans in others. Figure 1 indicates that there are big differences in attendance between teams, which shows the importance of controlling for the home team effect in the following regressions. Also, there is no clear time trend for attendance when focusing on teams that are part of the league for multiple seasons. Attendance increases over time for some teams while it decreases for others.
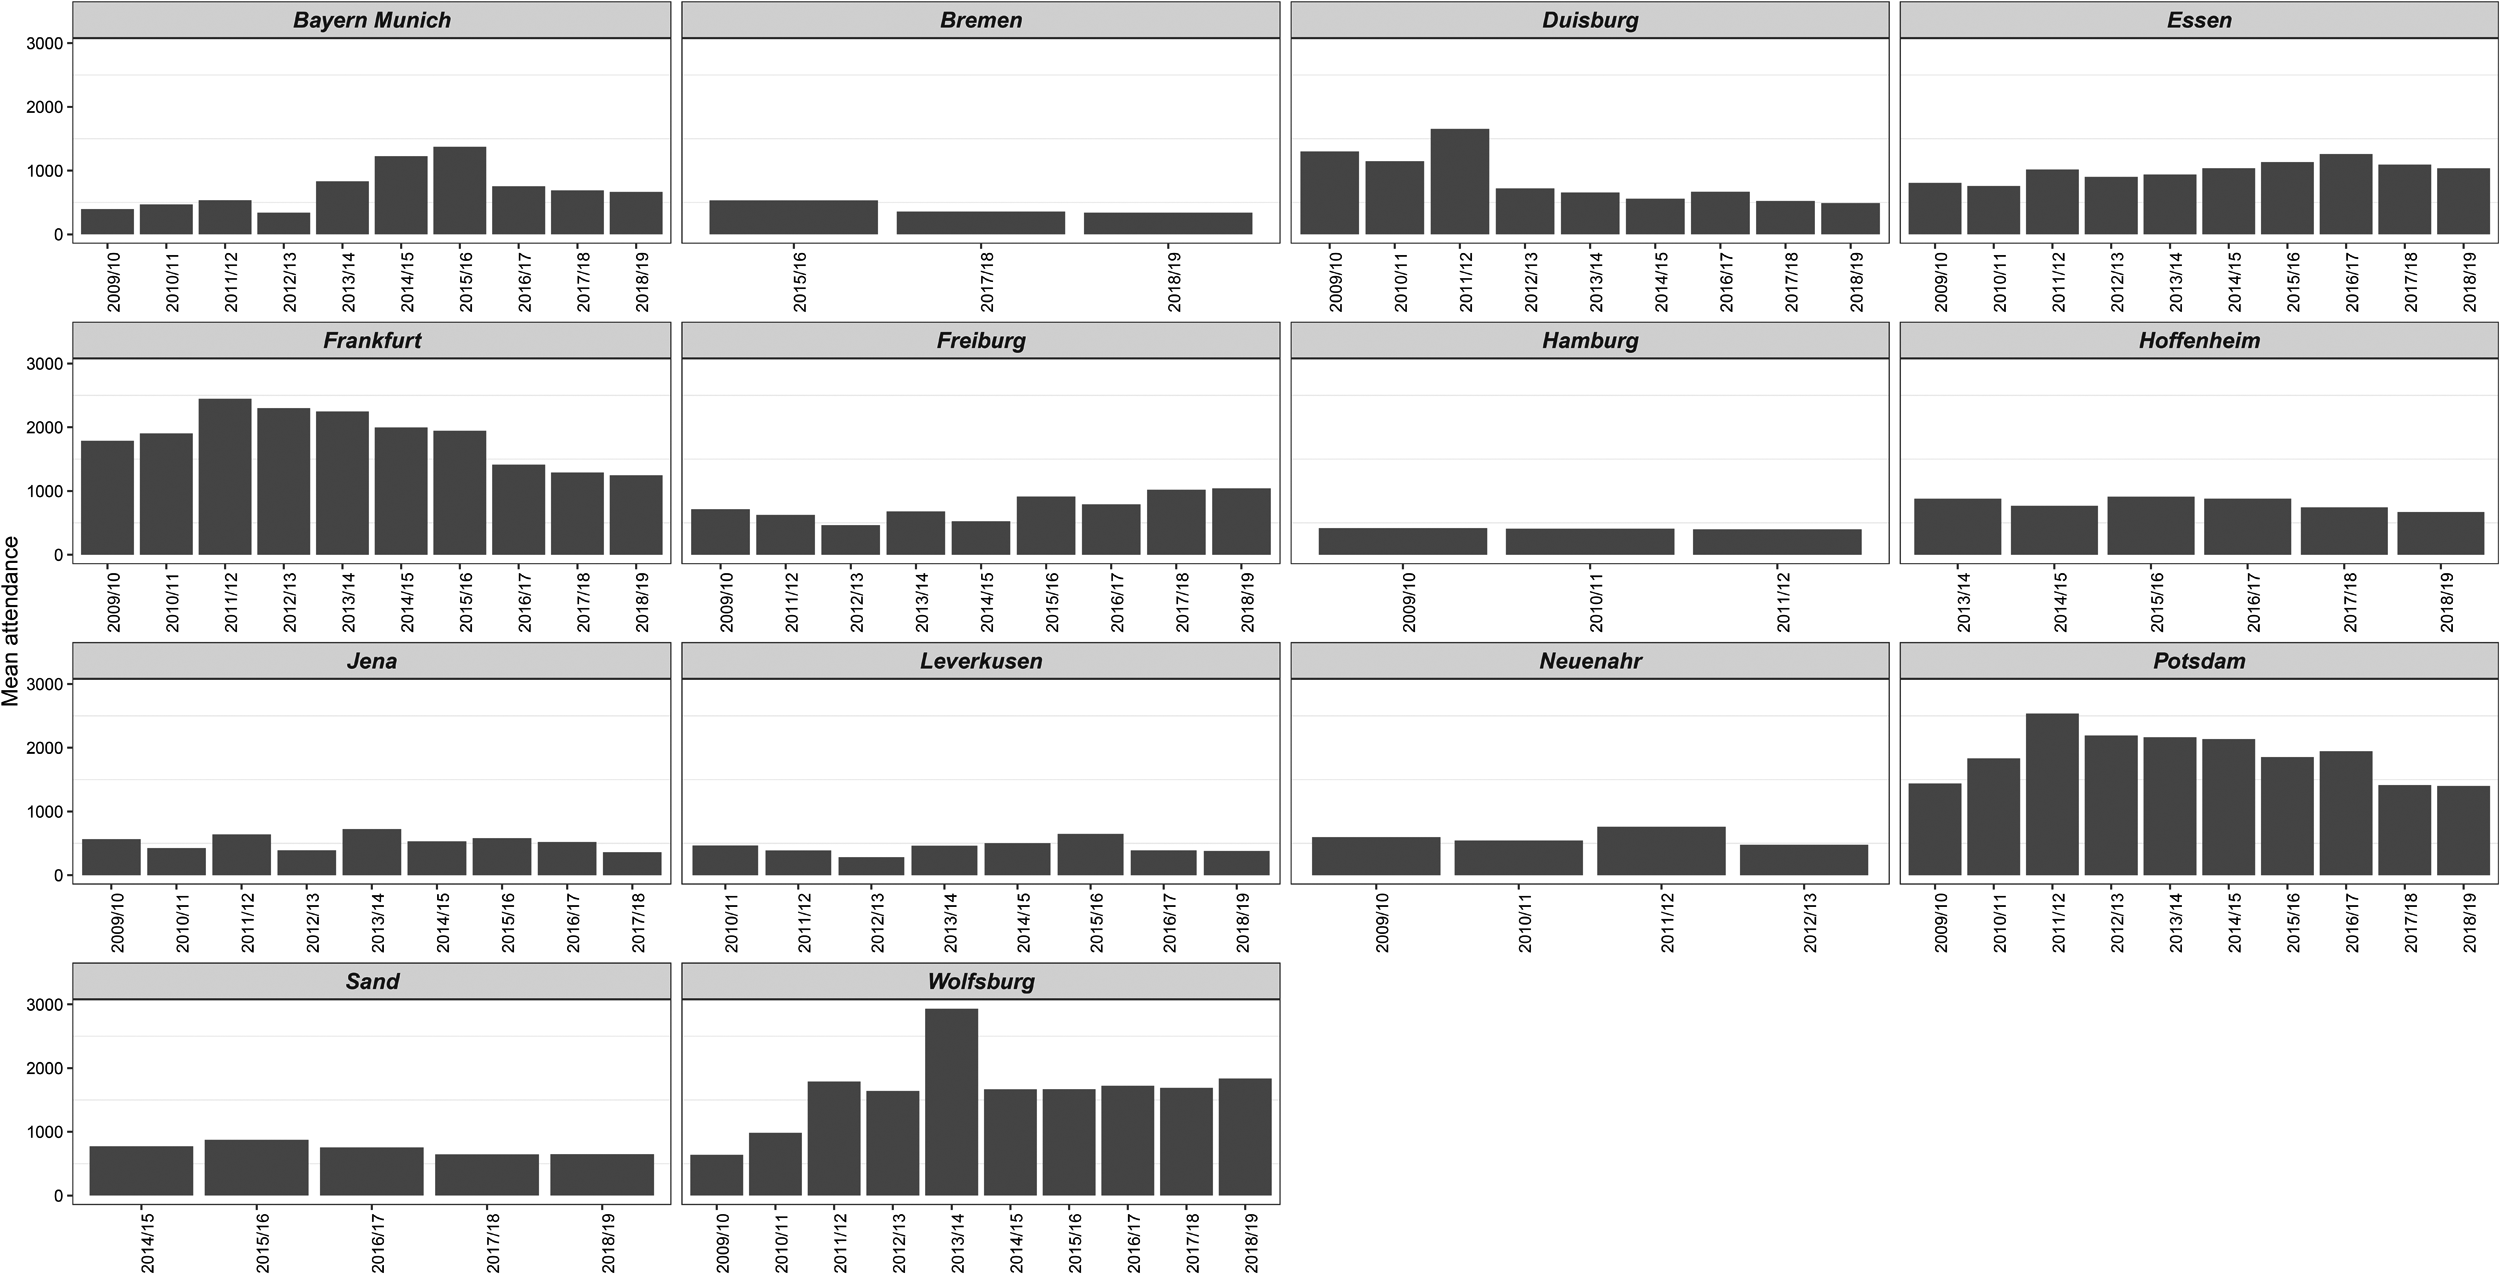
Average attendance per team and season for teams who played for more than two seasons in the league.
Women’s Bundesliga Teams in the Final Data Set.
The season in the women’s league covers two calendar years and typically runs from late September in a year until mid-to-late May in the following year. The winter break of around six weeks runs from mid-December until the end of January. Unlike men’s Bundesliga soccer, which features most games on Saturdays, Sundays are the most frequent days for matches in women’s Bundesliga matches. Figure 2 supports no trend for a change in the distribution of matches between weekdays over our observation period. As most games are played on weekends and during the same month as the men’s Bundesliga, there is a large overlap between matches in the men’s and women’s Bundesliga. Such overlap is not only given in a time dimension but also regarding the teams themselves. In the last seasons of observation, 2018/2019, both the men’s and women’s Bundesliga feature teams of Bayern Munich, Wolfsburg, Hoffenheim, Freiburg, Leverkusen, Bremen and M.Gladbach. Potentially, an overlap of games by women’s and men’s teams of the same Bundesliga club can cause reduced interest in one of them, most likely in the women’s team.
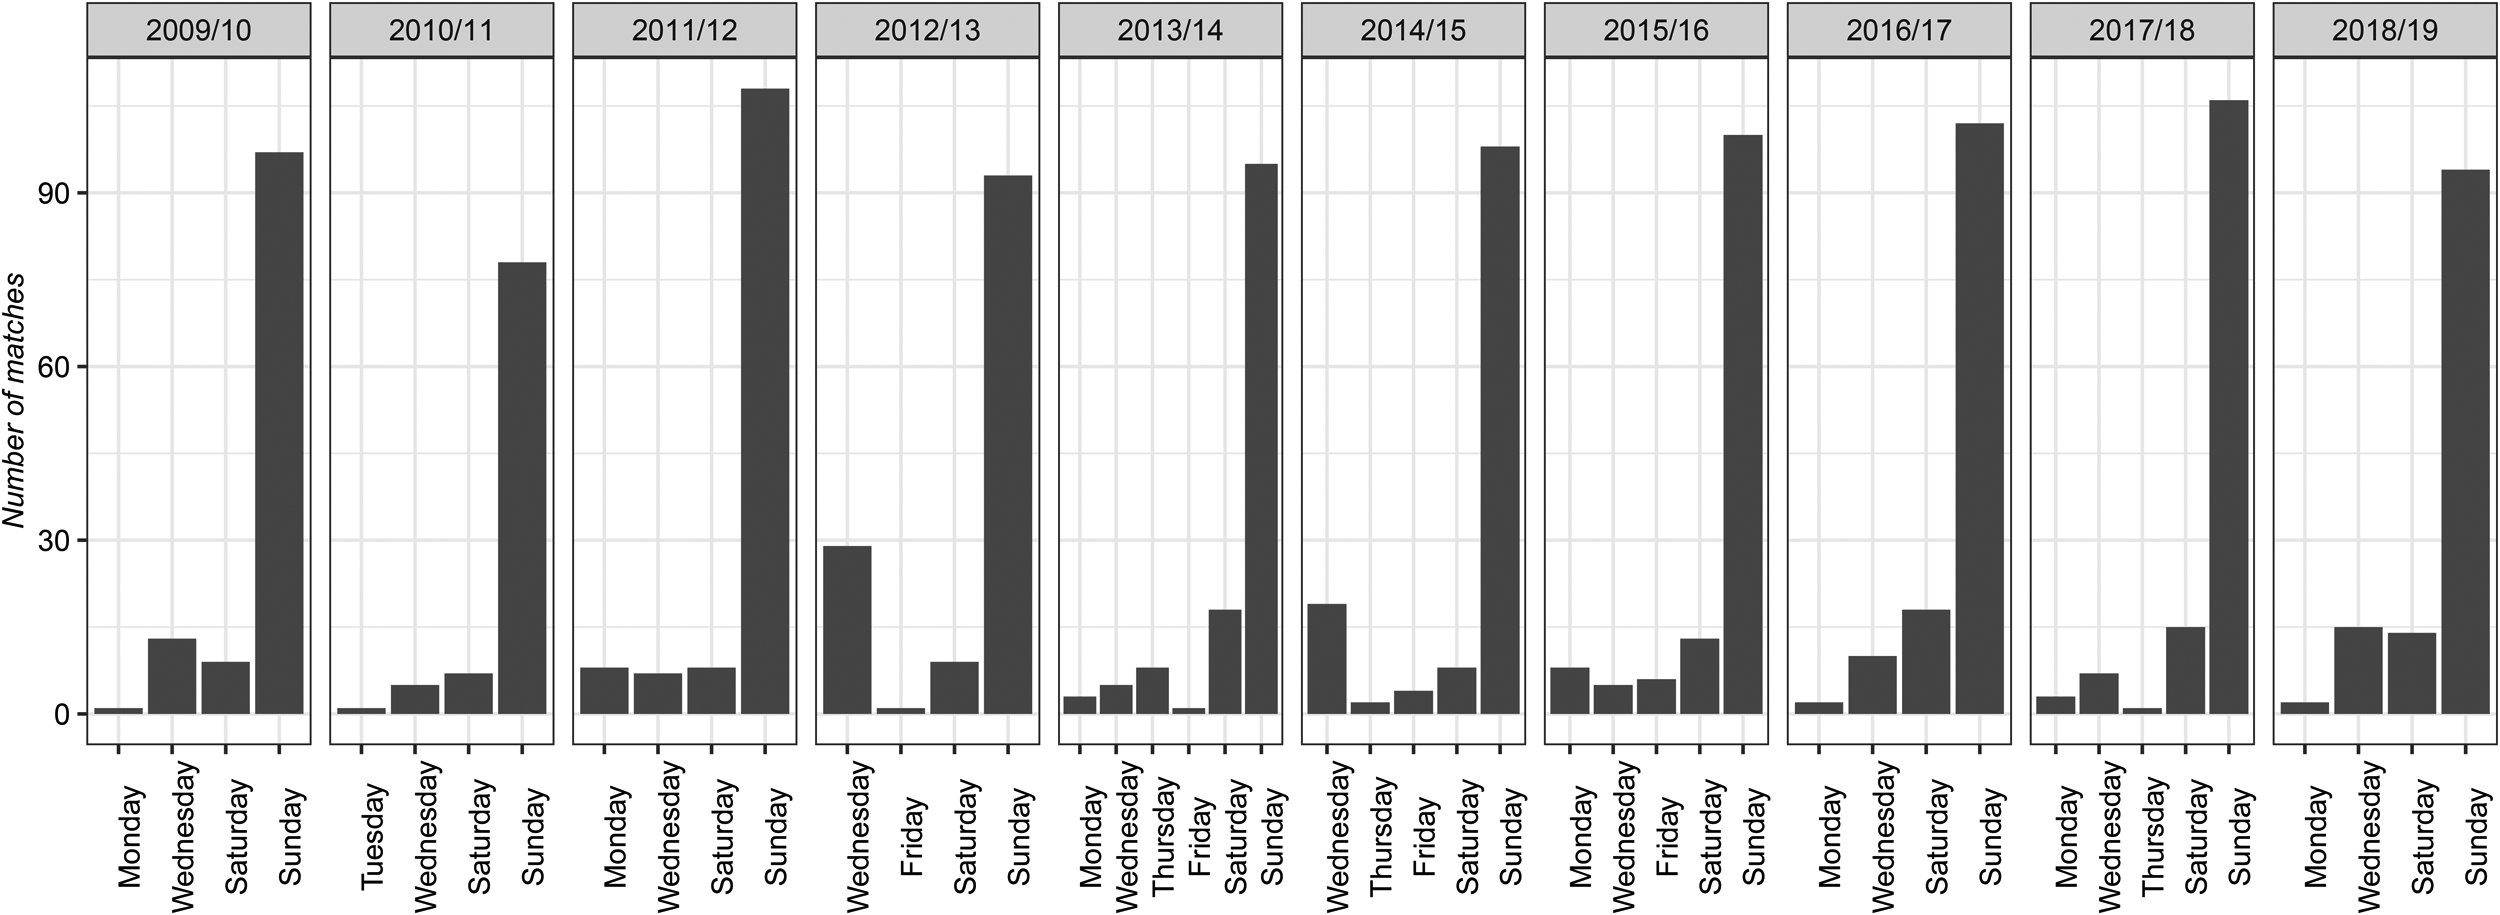
Distribution of matches over weekdays per season.
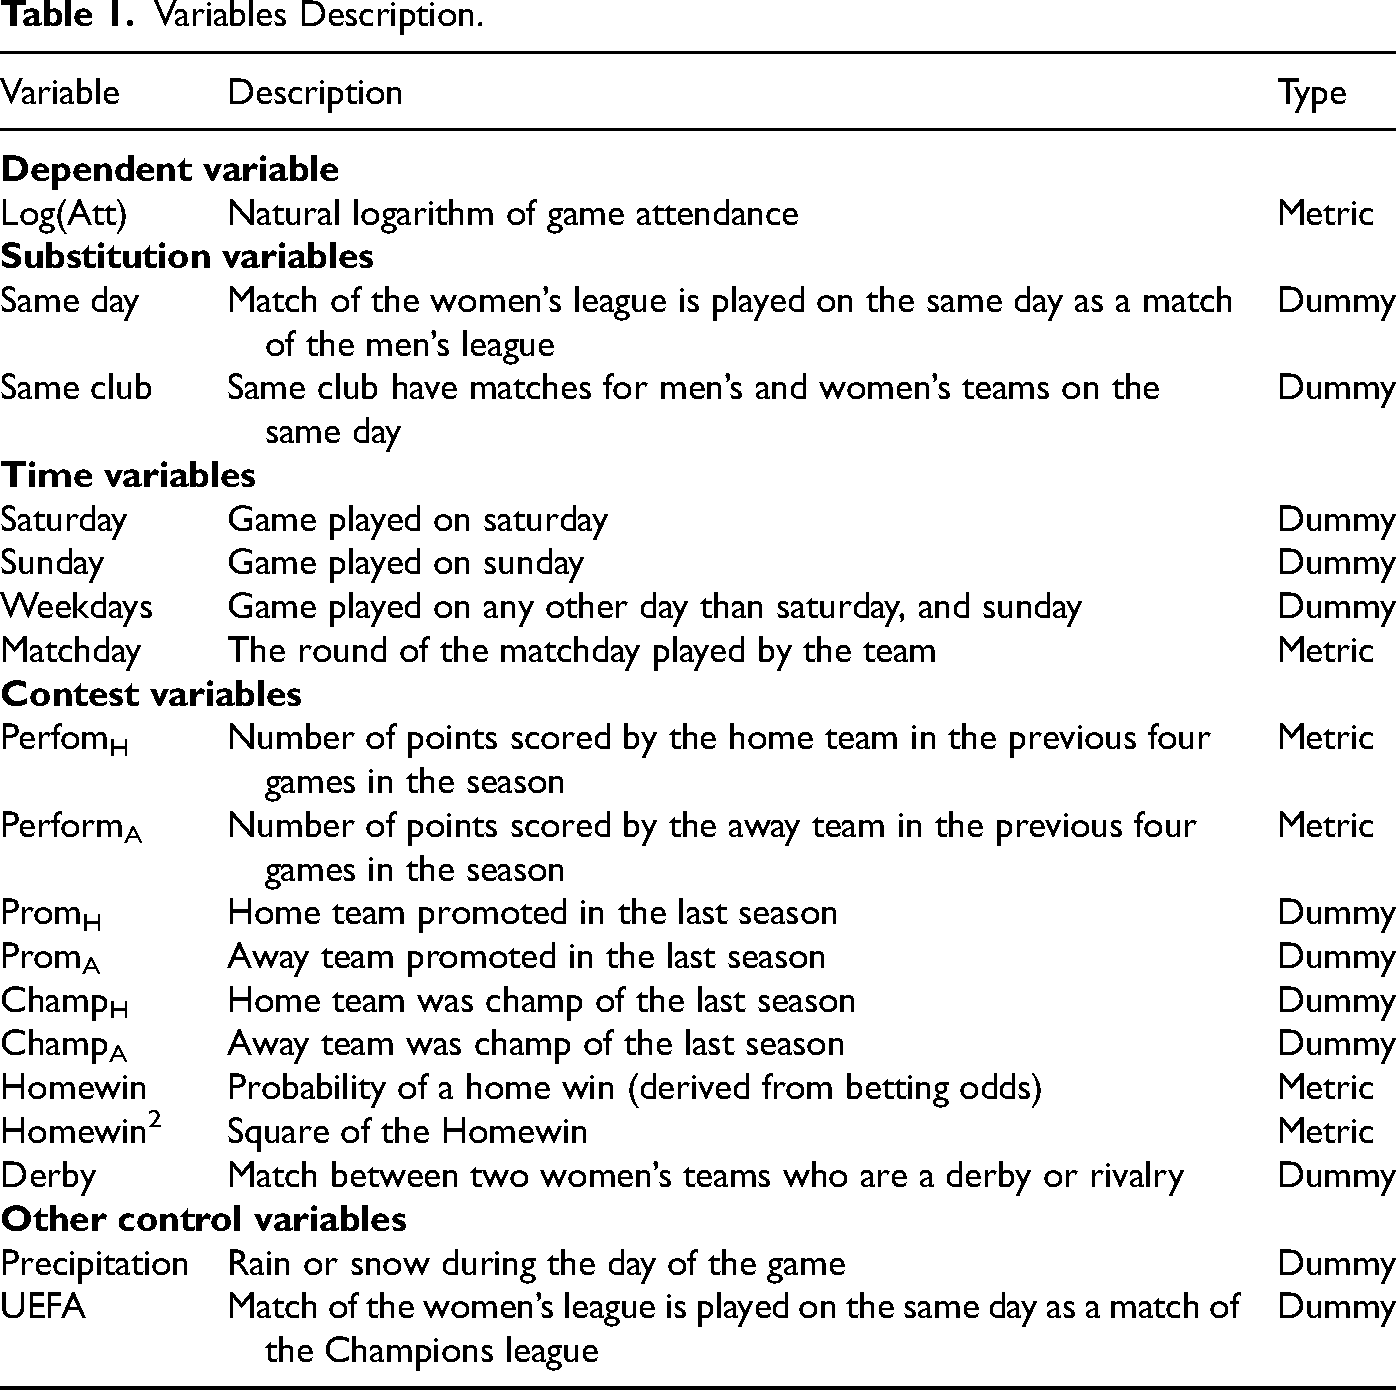
Table 1 provides an overview of the variables to be included in estimating attendance in women’s Bundesliga games. The dependent variable (Log(Att)) is the logarithm of the attendance at a given game since attendance is not normally distributed but right skewed, as shown in Figure 3. The substitution variables identify if (a) men’s Bundesliga games are played on the same day as the women’s Bundesliga game considered (Same Day variable). Second, we check if (b) men’s Bundesliga games run concurrent with games of the women’s team of that same club. Both substitution variables are dummies, as overlaps either do or do not exist (Same Club variable).
Variables Description.
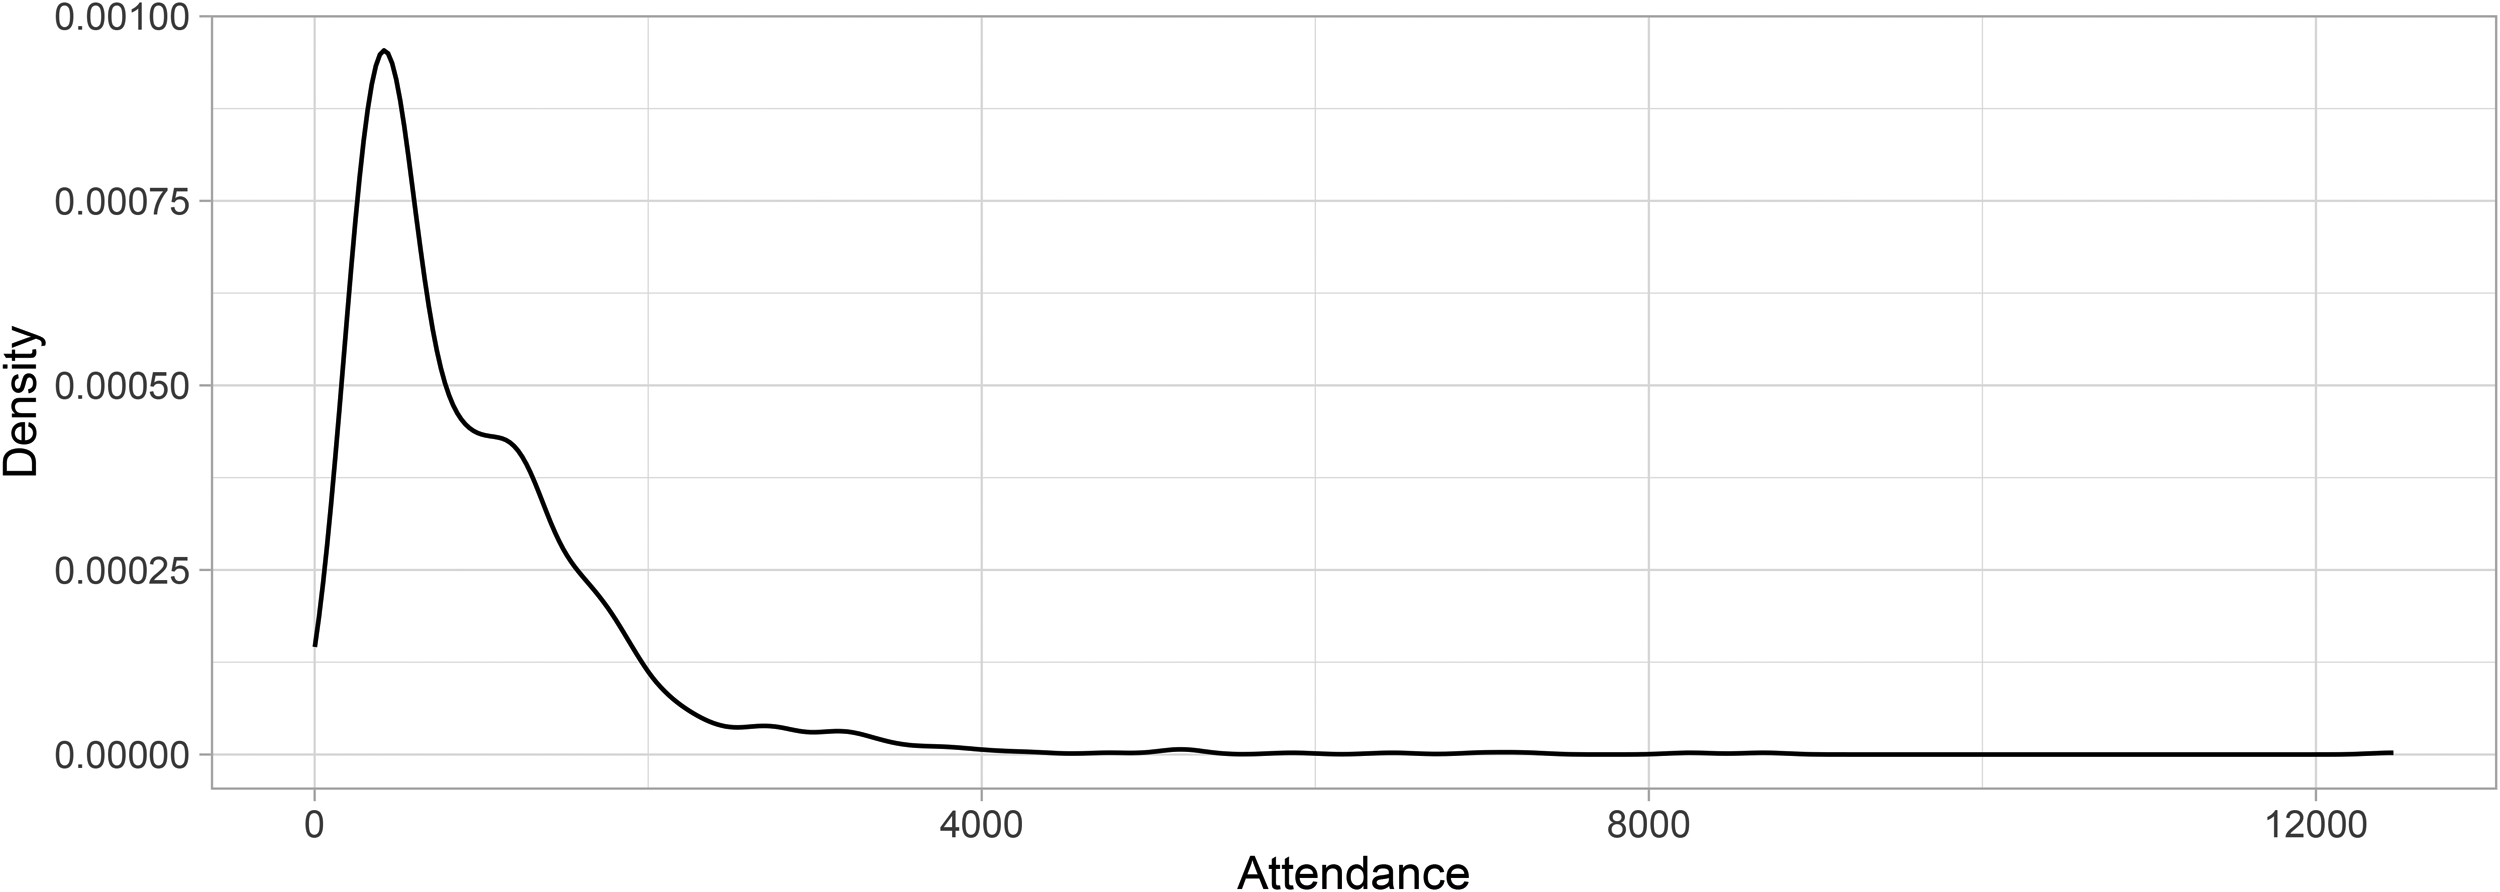
Density of attendance for all games over 10 seasons.
For the time variables, as indicated by Wallrafen et al. (2019), we include the day of the week as a determinant for attendance demand. Following Figure 2, we distinguish between games played on Saturday, Sunday, and Weekdays. The majority of matches, approximately 77%, occur on Sundays, followed by approximately 10% on Saturdays and 9% on Wednesdays, with the remainder spread across other days. Matches played on Mondays through Fridays are infrequent and are collectively grouped as Weekdays because of their low number of observations. The Matchday of the season is included to control for the fluctuations in attendance over the season.
Several contest variables are included to display the current and historical performances of the opponents. PerformH and PerformA indicate the most recent performance, that is number of points, by teams in their last four games, for the home team and the away team, respectively. As recently promoted teams’ fans may draw high attendance according to Forrest and Simmons (2006), we implement variables PromH and PromA to indicate whether the home or away team entered the league for the current season as a promoted team. ChampsH and ChampsA show if either of the teams is the current champion, potentially drawing additional interest from fans. Fans are potentially interested in the teams’ winning chances. Accordingly, Homewin and Homewin2 indicate the winning chances of the home team. The final contest control variable in our analysis is Derby, which equals 1 if a match is played between two teams with a derby or rivalry relationship. As noted by Forrest and Simmons (2006) and Forrest et al. (2004), identifying derbies is inherently subjective. To define this variable, we rely on well-known derbies widely recognized in German media and frequently referenced in articles about the women’s Bundesliga. These include regional derbies also prominent in the men’s league, such as the North derby between Bremen and Hamburg (hsv-ev.de), the Rhine derbies available in our dataset is between Cologne and Leverkusen (dfb.de), the Revier derby between Duisburg and Essen (kicker.de), and the East derby between Jena and Leipzig (leipzigerzeitung.de). Beyond the regional derbies given the environment of the league, it is important to accounts for prominent rivalries. From the 2000/2001 season, the league champion alternated exclusively between Frankfurt and Potsdam, until Wolfsburg secured its first title in the 2012/2013 season. Since the 2014/2015 season, the league’s champions and runners-up have consistently been either Bayern Munich or Wolfsburg. Consequently, these two significant rivalries were identified in our dataset (zdf.de; eintracht.de).
Further control variables are included, as shown in studies by Valenti et al. (2020) and Wang et al. (2018), weather conditions on match day can impact stadium attendance. The variable Precipitation indicates if it rained or snowed during the match. A dummy variable for the UEFA Champions League matches occurring concurrently with the women’s matches. We expected that fans might opt to stay home and watch UEFA matches if they coincide with women’s matches (Wallrafen et al., 2019).
Missing observations, particularly in variables such as betting odds and precipitation, reduced the total number of observations from 1,320 to 1,256. Table 2 presents the descriptive statistics for all variables. Approximately 70% of women’s matches coincide with men’s Bundesliga matches on the same day, indicating a significant overlap in scheduling. Additionally, around 9.4% of women’s matches occur simultaneously with the men’s team matches within the same club. Approximately 6% of matches coincide with the UEFA matches. Regarding weather conditions, half of the games were played on rainy or snowy days.
Descriptive Statistics.
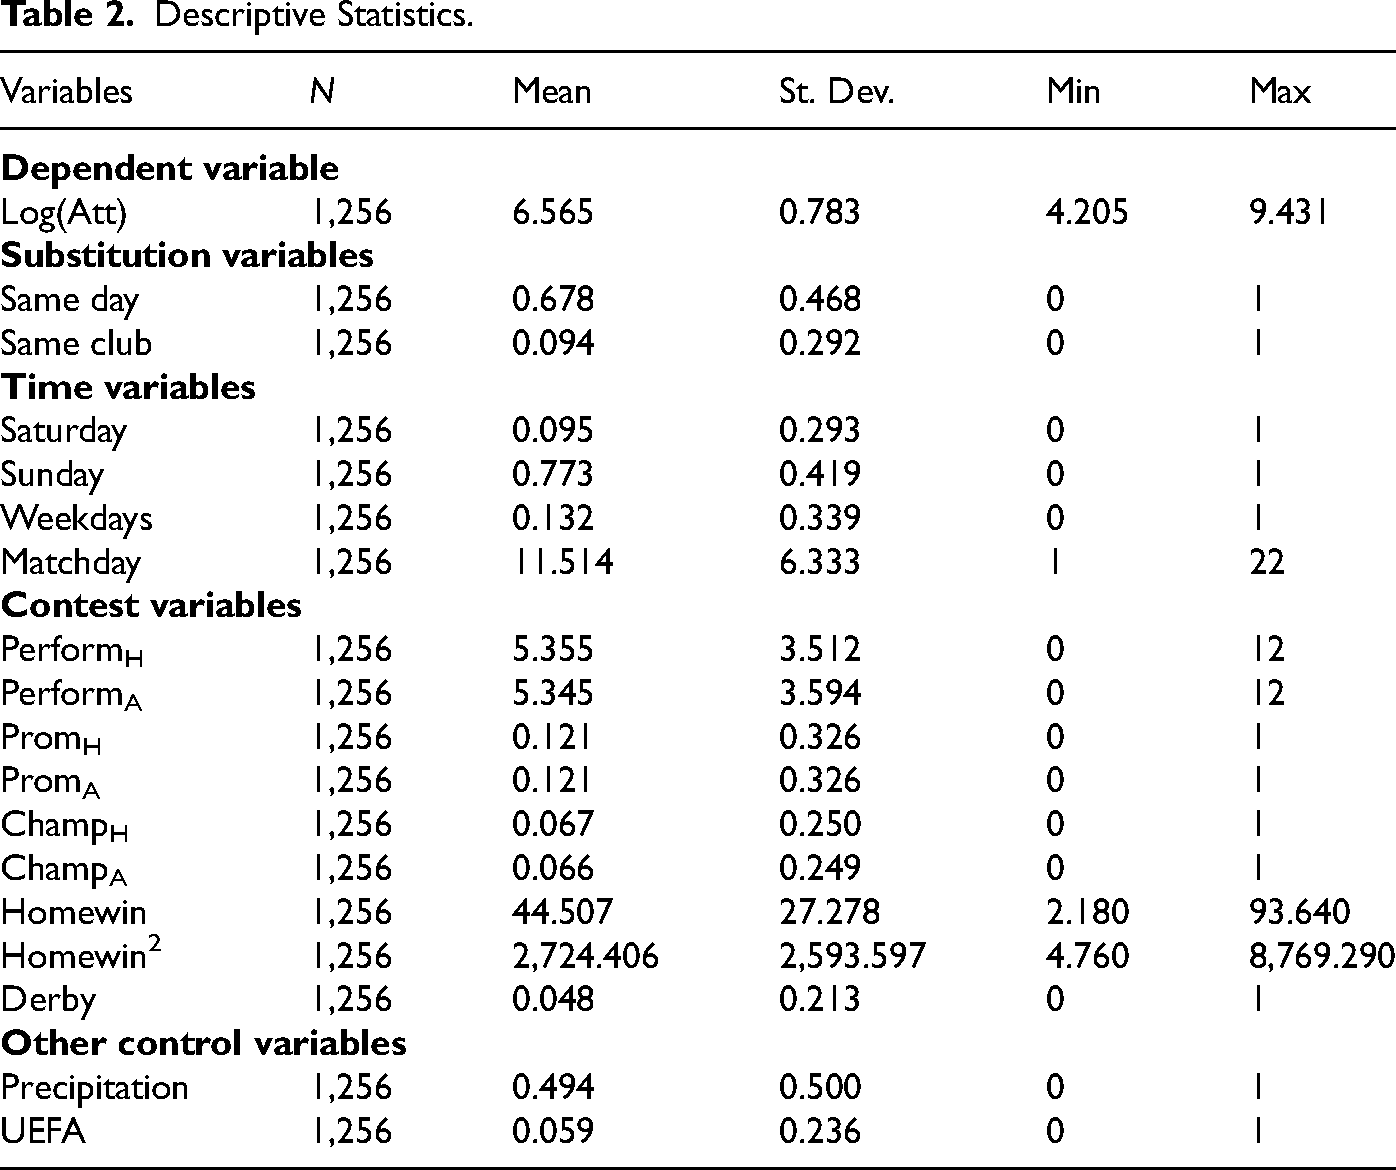
Table 3 shows the statistics for the teams’ substitution variables. It includes the total number of observations in the final data set for every team alongside the total number of seasons. It highlights the Same Day variable and shows the total number of matches played concurrently with men’s Bundesliga matches for each team. This data unveils significant overlaps between women’s and men’s Bundesliga matches, with notable observations across various teams. For instance, Bayern Munich’s women’s team had approximately 73% of their home games coincide with men’s Bundesliga matches. Similarly, teams like Duisburg, Jena, Sand, M.Gladbach, and Saarbruecken experienced high percentages, too, with over 70% of their matches aligning with men’s Bundesliga matches.
Table 3 also highlights the Same Club variable, shedding light on the overlap between women’s and men’s Bundesliga matches within the same club. Among the 23 clubs included in the final data, 10 feature both their women’s and men’s teams competing simultaneously in the first Bundesliga. The frequency of concurrent games within clubs is contingent upon the duration of both teams’ tenures in their respective Bundesliga leagues. The Same Club variable underscores the notable overlap between women’s and men’s Bundesliga matches, but this time within these clubs. For instance, out of their 77 games, Bayern Munich women’s team played 17 of them on the same day as the Bayern Munich men’s team. For Frankfurt and Wolfsburg, around 30% of their games were played with their respective men’s teams playing, too. Across the entirety of the dataset comprising 1,256 women’s Bundesliga games, a significant proportion of 851 games (or 68%) coincide with the scheduling of men’s Bundesliga matches. Additionally, in 118 games (or 9.4%), women’s teams compete on the same day as the men’s team of the same club.
Estimation Model
The unbalanced panel structure of our data is caused by the annual promotion and relegation of teams, resulting in varying numbers of matches played by each team, as illustrated in the total observations in Table 3. The panel dataset consists of home teams as cross-sectional units and match days as time series units (23 teams and 108 match days). The following equation (1) represents our empirical model to explain attendance in women’s soccer: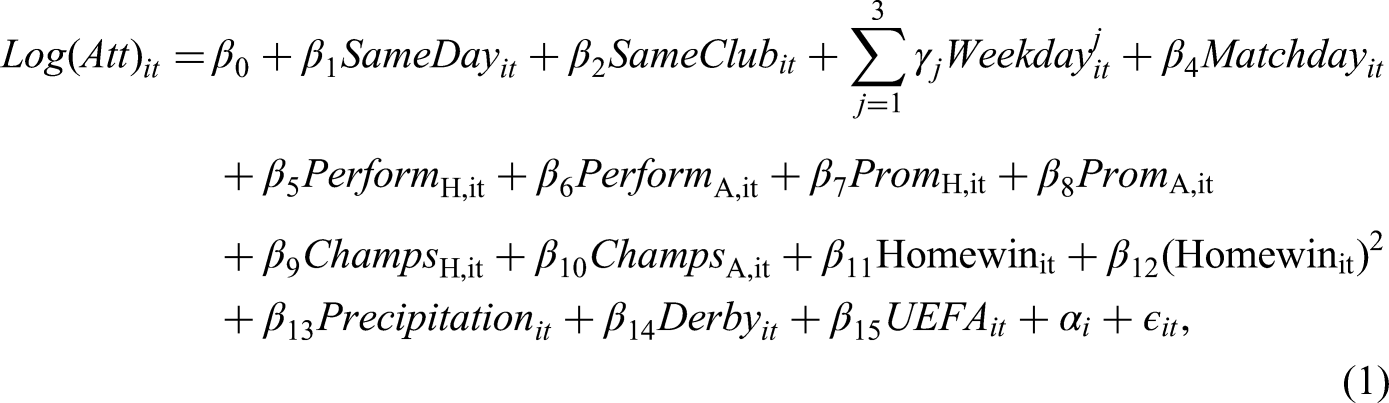
Several preliminary tests were conducted to determine the most suitable method for the analysis. These tests revealed the presence of heteroscedasticity, serial correlation, and cross-sectional correlation. The Breusch-Pagan test identified heteroscedasticity, consistent with previous findings in the literature (Valenti et al., 2020; Wallrafen et al., 2019), as a result of the attendance variations across clubs. Additionally, both serial correlation and cross-sectional correlation were detected through the Breusch–Godfrey and Breusch–Pagan Lagrange multiplier tests. Subsequently, robustness tests using Hausman tests favoured the fixed effects regression model over the random effects model.
The chosen fixed effects regression model incorporates Driscoll and Kraay standard errors (DKSE), selected for their efficacy in addressing the aforementioned issues, aligning with previous research (Wallrafen et al., 2019). These models are well-suited for handling unbalanced panel data and account for heteroscedasticity, cross-sectional and serial correlation in the error terms using the “sss” estimator in R software. Following the methodology outlined in Hoechle (2007) and Wallrafen et al. (2019), the maximum lag length of autocorrelation is set to four based on the plug-in estimator by Newey and West (1994):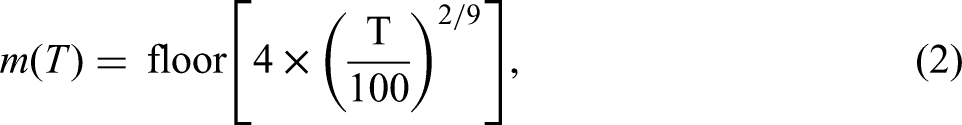
Results
The initial regression model in Table 4 features Same Day as the primary independent variable. Across the four fixed-effects regression models with DKSEs, all employing Log(Att) as the dependent variable, varying sets of control variables are introduced. In Model 1, Same Day serves as the sole independent variable. The subsequent Model 2 incorporates time variables such as Saturday, Sunday, Weekdays (as a reference category), and Matchday. Model 3 includes further contest variables, while the Model 4, regarded as the full model, integrates additional variables related to Precipitation and concurrent UEFA Champion Leagues matches. Team fixed effects is included in all the models as a control variable.
Results of Fixed Effects Regressions with Same Day as Main Independent Variable.

Note. Significance levels: ˆ*p < .1; ˆ**p < .05; ˆ***p < .01.
The significance of the Same Day variable remains notable as more control variables are added, with its coefficient showing a negative impact on attendance in all the regression models. Based on the comprehensive model (model 4), which includes all control variables, the average marginal effects can be calculated using the percentage points formula
Examining the control variables, starting with the time variables, the coefficient of Saturday and Sunday coefficients is positive. However, neither of them is significant in model 4. The Matchday variable is negatively significant, similar to previous studies (Pawlowski & Anders, 2012; Wallrafen et al., 2019).
For the contest variables, the results of the last matches of the team affect attendance demand positively, with both PerformH and PerformA exhibiting positive signs. Notably, there is a significant positive effect observed for previous champions in both home and away matches (ChampH and ChampA). If a new team is promoted in the first women’s division, it doesn’t affect the attendance, whether they are playing home or away matches (PromH and PromA). Additionally, game uncertainty variables align with prior research (Nalbantis et al., 2017; Wallrafen et al., 2019), showing a decreasing with increasing rates for (Homewin & Homewin2). Derby and rivalry matches generate increased interest among fans, as evidenced by the high positive significance level for Derby. The Precipitation variable lacks significance, contrary to previous findings (Pawlowski & Anders, 2012; Wallrafen et al., 2019). Results concerning the UEFA variable are highly significant as predicted. Fans will substitute the women’s matches for the UEFA. Table 4 shows that women’s attendance will, on average, decrease by 28.8 percentage points when they play concurrently with the UEFA Champions League.
The second regression model in Table 5 examines the impact of the Same Club variable as the main independent variable to assess whether the simultaneous scheduling of women’s and men’s same-club teams affects attendance. Table 5 displays the results of the four fixed-effects regression models with DKSEs, indicating a consistently negative and significant impact on attendance, with the level of significance increasing as more control variables are added. Specifically, women’s games played concurrently with their men’s teams result in an average decrease of 16 percentage points in attendance in the full model (model 4). The effects of other explanatory variables remain consistent with those observed in the Same Day regression Table 4 except for the Match Day variable. It still has negative significance but at a 10% significant level.
Results of Fixed Effects Regressions with Same Club as Main Independent Variable.
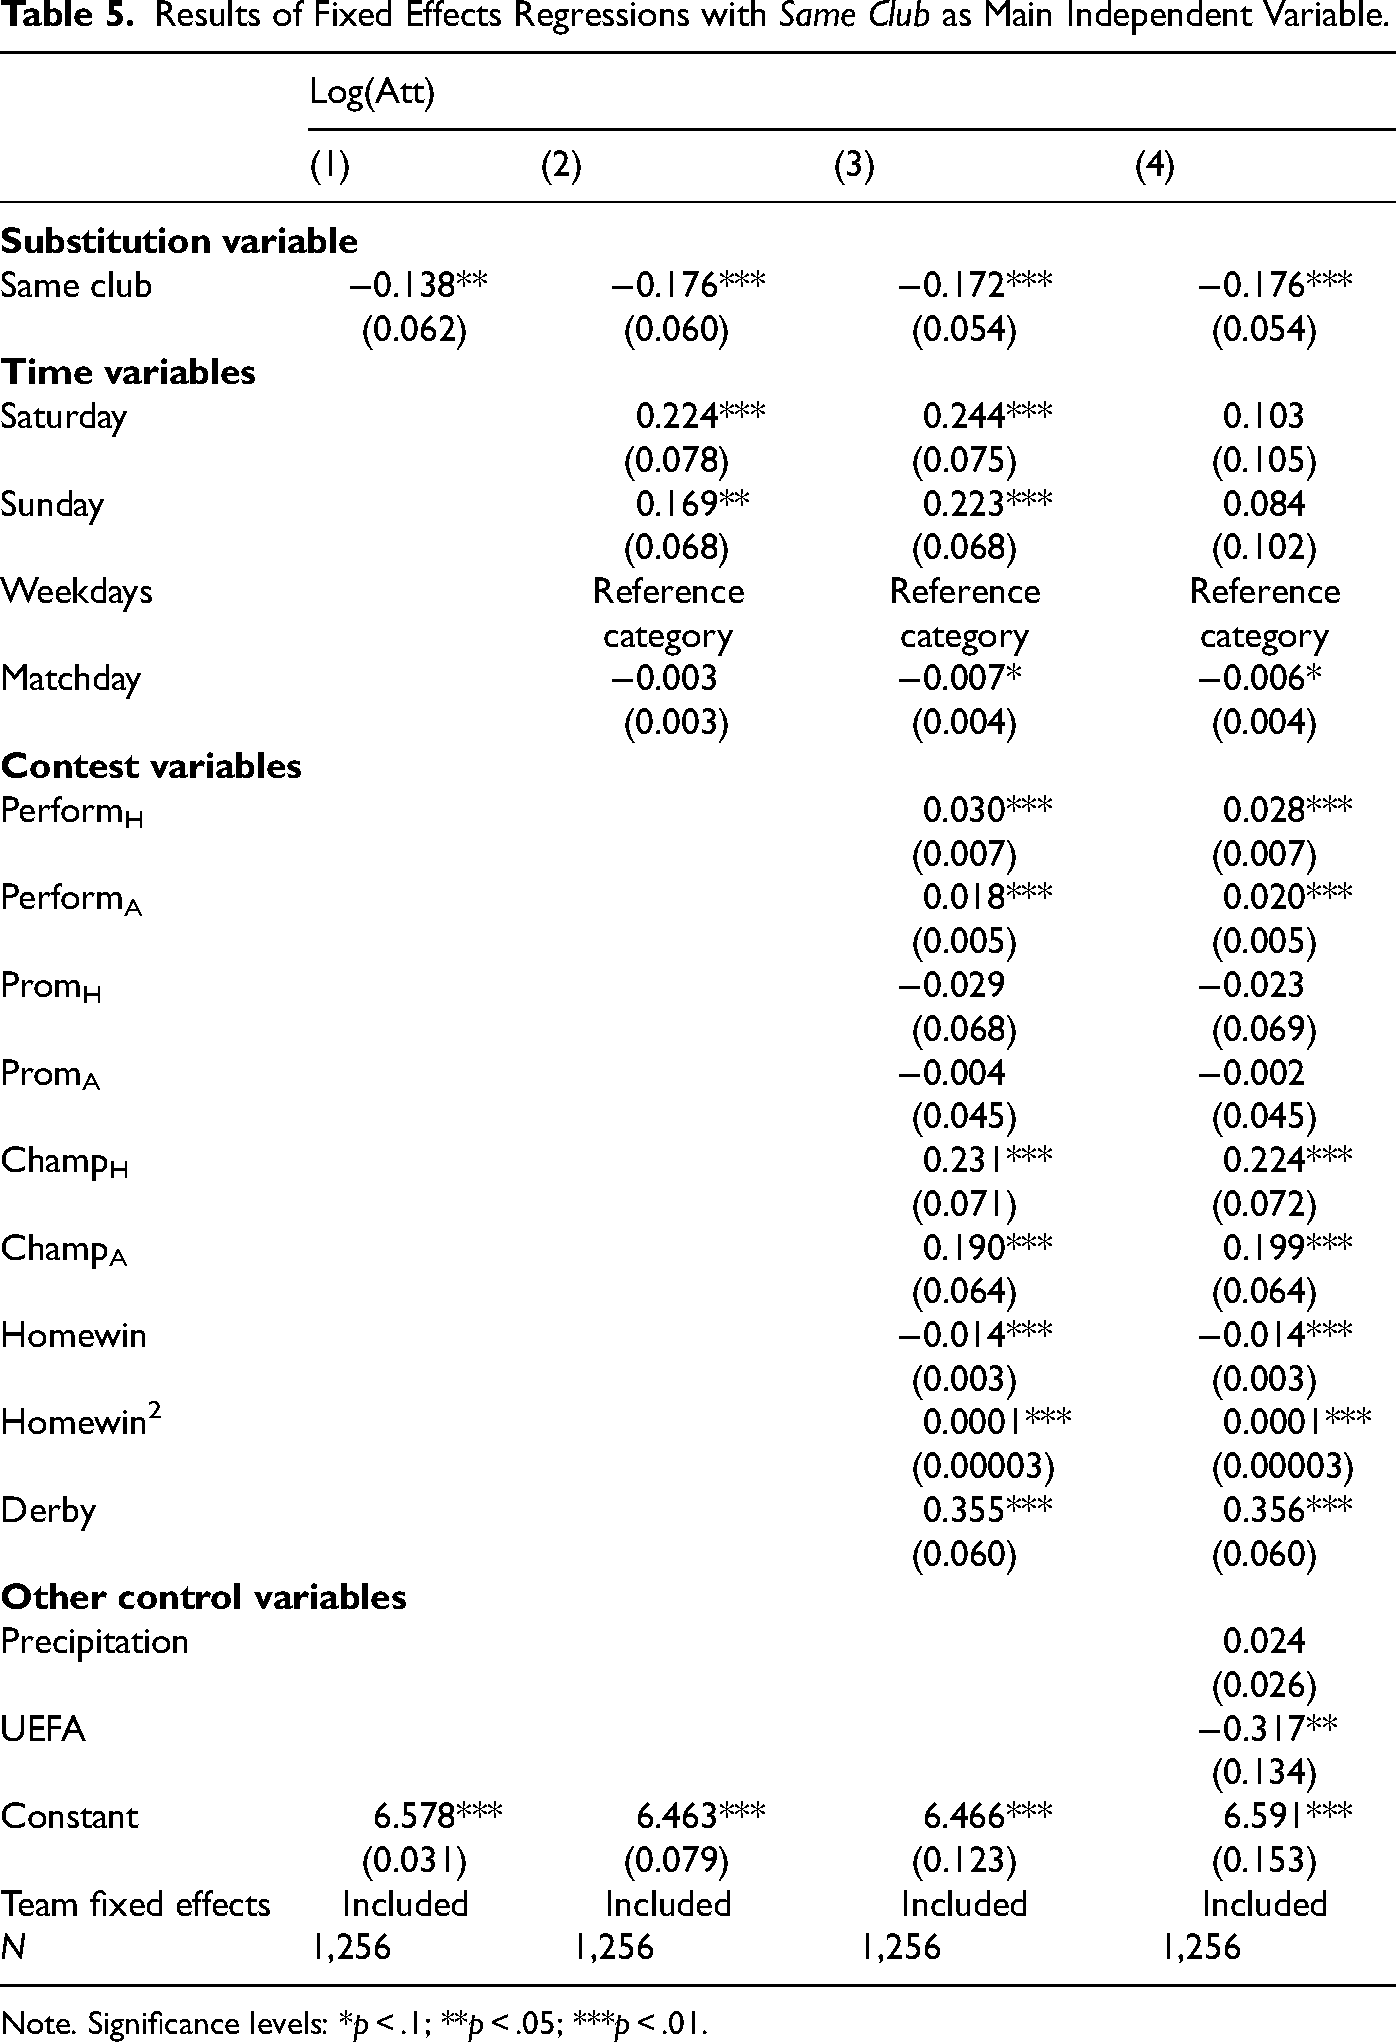
Note. Significance levels: *p < .1; **p < .05; ***p < .01.
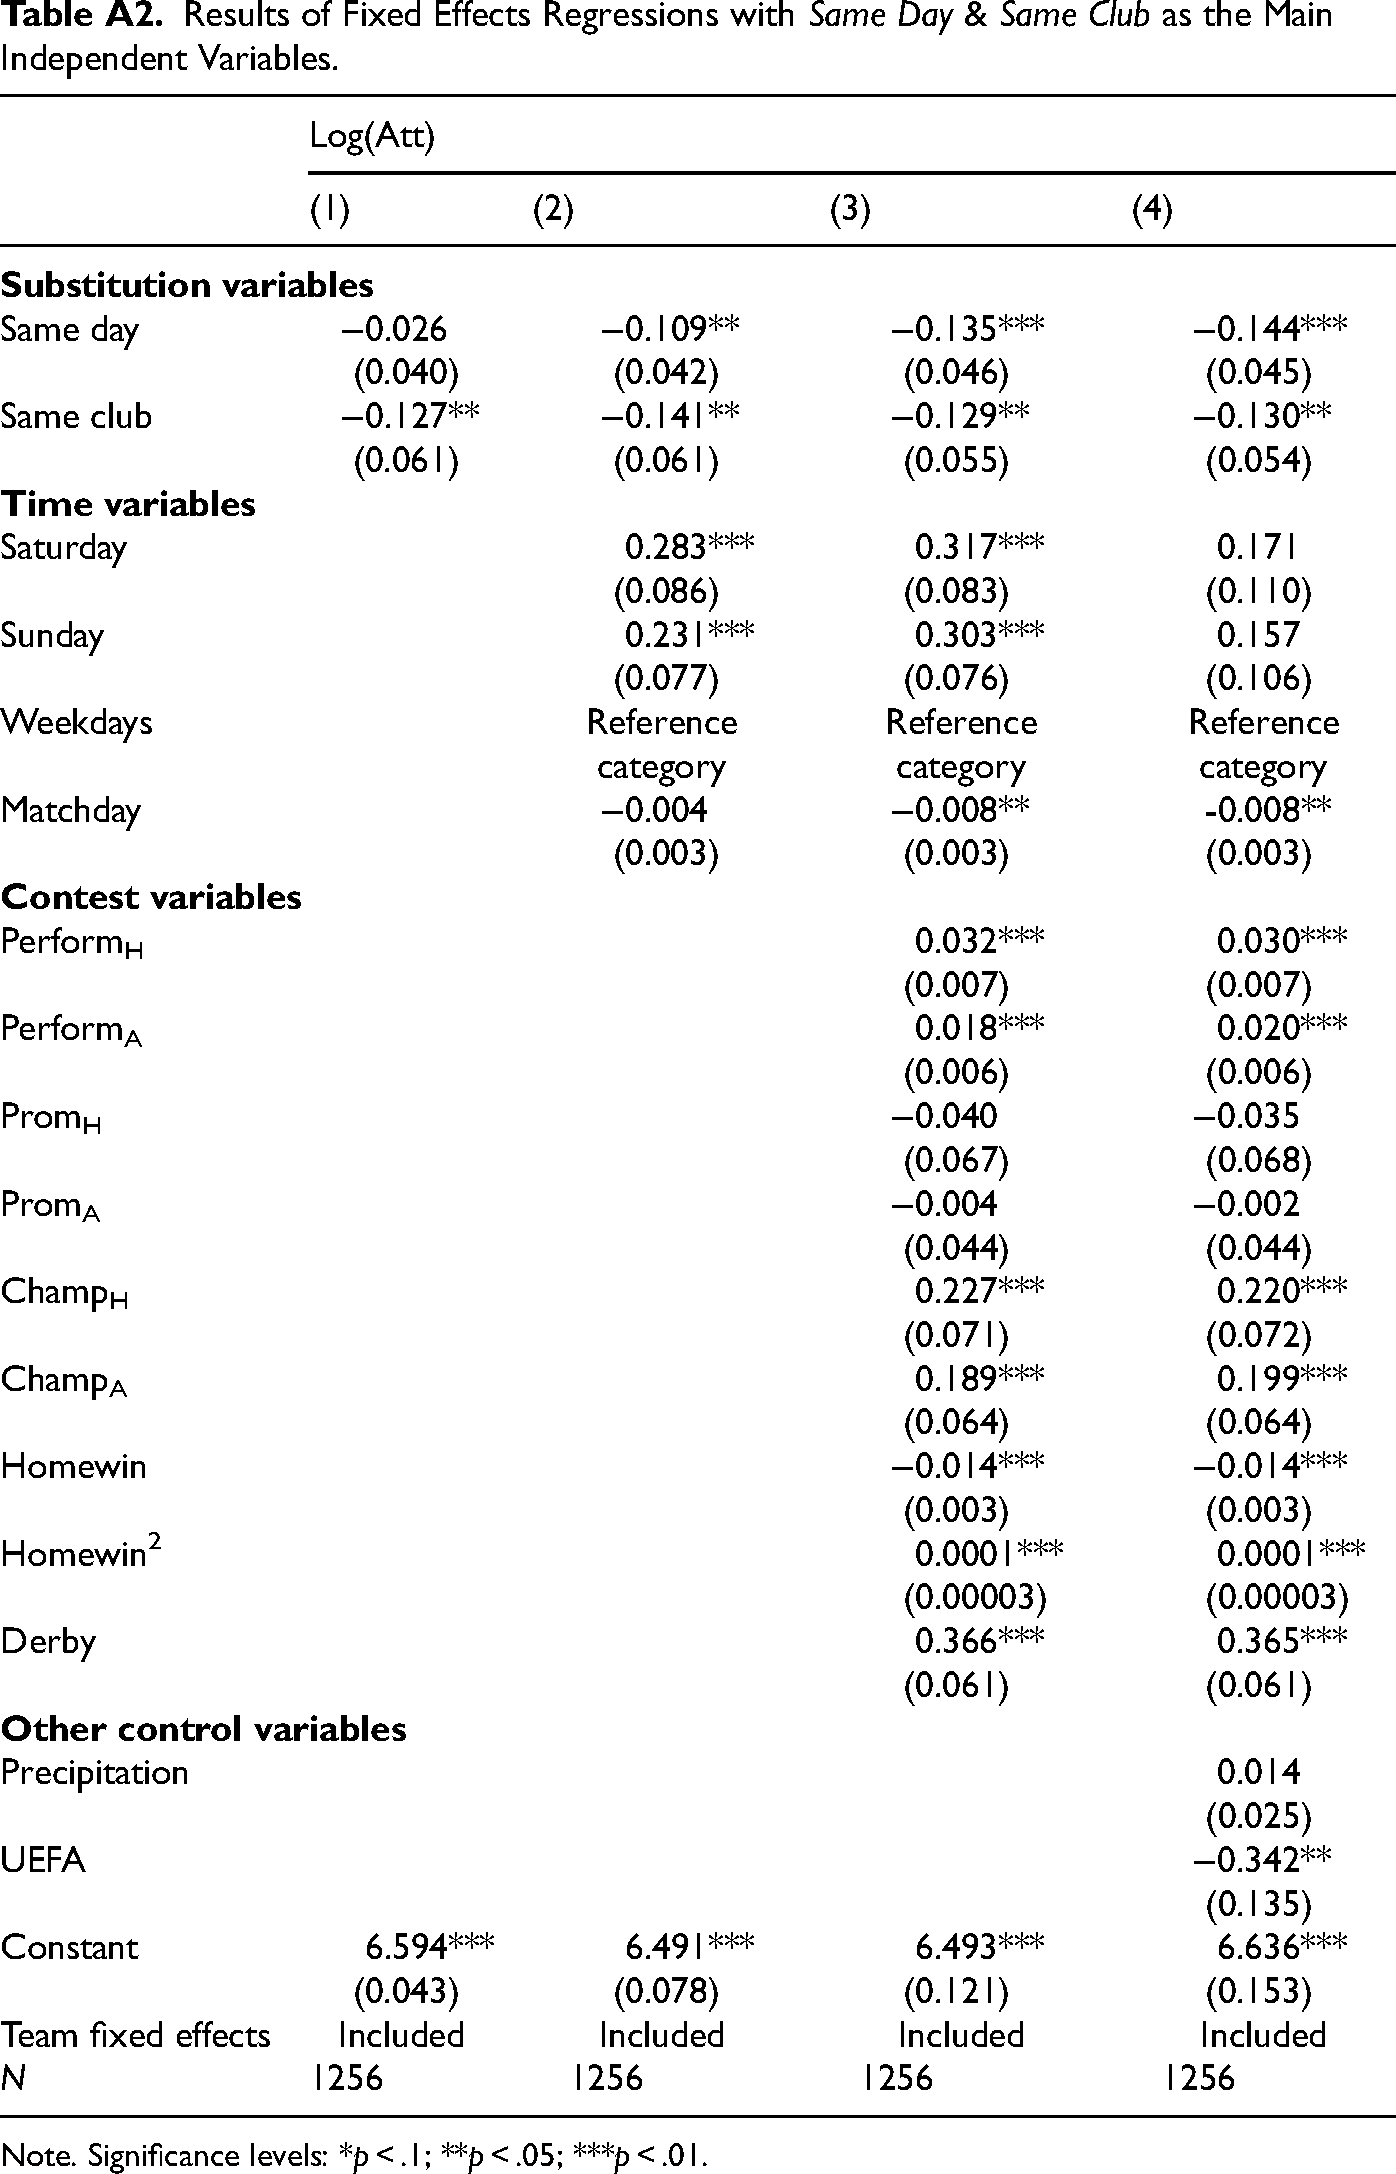
To further verify the robustness of the Same Club regression results, a supplementary regression is run exclusively for the 10 women’s teams with overlapping matches with their men’s teams. The Same Club variable remains highly significant and has a greater impact on attendance (see Table A1 in the Appendix for more details). This confirms the existence of substitution effects, as attendance at women’s matches decreases by 16 percentage points when they play simultaneously as their male counterparts. Finally, we tested the robustness of our results by running the same regression models with both substitution variables: Same Day & Same Club (An OLS regression was run first to ensure no multicollinearity between them). The results in Table A2 in the Appendix show the high significance for both variables at 1% and 5%.
Conclusion
With substantial revenue tied to game attendance due to limited TV contracts, the success of women’s soccer depends on attracting fans to stadiums. Hence, it is important to look for opportunities to increase the game attendance. We have examined whether the overlap between women’s and men’s matches has an impact on the women’s attendance. We check this by analyzing data for 1,236 games over ten seasons for the German Women’s Bundesliga.
Initially, we observe a highly significant effect for the Same Day variable, indicating a 15 percentage point decrease in attendance when there are overlapping match days between women’s and men’s matches. Additionally, we analyze the Same Club variable, which refers to overlapping matches of the same team for women’s and men’s matches. The attendance decreases by 16.1 percentage points. Those numbers are considerably higher than those reported by Valenti et al. (2024) for the English FA Women’s Super League. It is important to note that Valenti et al. (2024) only consider overlaps of both teams playing at home. It is noteworthy that the coefficient for the UEFA variable is negative and highly significant in all regressions. This suggests that when there is an overlap between women’s matches and UEFA Champions League matches, fans tend to prefer the latter, potentially due to differences in quality (MacDonald, 1988; Rosen, 1981).
As women’s soccer is a very dynamic setting, drivers of match attendance are very much subject to change. This paper chooses COVID-19 as a stopping point as spectators were banned or limited afterwards. After games reopened to the public, attendance increased above pre-COVID level. Such demand shift potentially is given to the increased level of interest in society and could go hand in hand with changing determinants of attendance over time. Also, we derive determinants of demand from the literature on men’s football. There could be alternative drivers of demand for women’s soccer. Agha & Berri (2023) show that the factors that affect demand in the WNBA are uniquely different than in the NBA in both size and significance. Finally, we do not have access to the ticket prices for the individual games. Hence, observed changes in attendance could also be caused by the unobservable price to attend.
Overall, these findings underscore the complex interplay between the women’s and men’s Bundesliga schedules and highlight the importance of carefully considering scheduling arrangements to optimize fan engagement and increase attendance at women’s soccer stadiums. Attendance may increase for matches scheduled during the weekdays if they avoid Wednesdays. For those games to be played on Wednesdays, it is important to notice the negative effect of parallel games in the UEFA Champions League. For matches on the weekend, it is essential for clubs that have both men’s and women’s soccer teams in the first Bundesliga to avoid scheduling their matches on the same day.
Footnotes
Declaration of Conflicting Interests
The authors declared no potential conflicts of interest with respect to the research, authorship, and/or publication of this article.
Funding
The authors received no financial support for the research, authorship and/or publication of this article.
Appendix
Results of Fixed Effects Regressions with Same Day & Same Club as the Main Independent Variables.
| Log(Att) | ||||
|---|---|---|---|---|
| (1) | (2) | (3) | (4) | |
|
|
||||
| Same day | −0.026 | −0.109** | −0.135*** | −0.144*** |
| (0.040) | (0.042) | (0.046) | (0.045) | |
| Same club | −0.127** | −0.141** | −0.129** | −0.130** |
| (0.061) | (0.061) | (0.055) | (0.054) | |
|
|
||||
| Saturday | 0.283*** | 0.317*** | 0.171 | |
| (0.086) | (0.083) | (0.110) | ||
| Sunday | 0.231*** | 0.303*** | 0.157 | |
| (0.077) | (0.076) | (0.106) | ||
| Weekdays | Reference category | Reference category | Reference category | |
| Matchday | −0.004 | −0.008** | -0.008** | |
| (0.003) | (0.003) | (0.003) | ||
|
|
||||
| PerformH | 0.032*** | 0.030*** | ||
| (0.007) | (0.007) | |||
| PerformA | 0.018*** | 0.020*** | ||
| (0.006) | (0.006) | |||
| PromH | −0.040 | −0.035 | ||
| (0.067) | (0.068) | |||
| PromA | −0.004 | −0.002 | ||
| (0.044) | (0.044) | |||
| ChampH | 0.227*** | 0.220*** | ||
| (0.071) | (0.072) | |||
| ChampA | 0.189*** | 0.199*** | ||
| (0.064) | (0.064) | |||
| Homewin | −0.014*** | −0.014*** | ||
| (0.003) | (0.003) | |||
| Homewin2 | 0.0001*** | 0.0001*** | ||
| (0.00003) | (0.00003) | |||
| Derby | 0.366*** | 0.365*** | ||
| (0.061) | (0.061) | |||
|
|
||||
| Precipitation | 0.014 | |||
| (0.025) | ||||
| UEFA | −0.342** | |||
| (0.135) | ||||
| Constant | 6.594*** | 6.491*** | 6.493*** | 6.636*** |
| (0.043) | (0.078) | (0.121) | (0.153) | |
| Team fixed effects | Included | Included | Included | Included |
| N | 1256 | 1256 | 1256 | 1256 |
Note. Significance levels: *p < .1; **p < .05; ***p < .01.