
Abstract
In the National Basketball Association (NBA), basketball data and analytics is an area of significant financial investment for all 30 franchises, despite there being little quantitative evidence demonstrating analytics adoption actually improves team-level performance. This study seeks to measure the return on investment of analytics on NBA team success in a time of great demand for analytical front office personnel. Using a two-way fixed effects modeling approach, we identify the causal effect of analytics department headcounts on regular season wins using 12 years of season-level data for each team. We find a positive and statistically significant effect, suggesting clubs that invest more in analytics tend to outperform competitors when controlling for roster characteristics, injuries, difficulty of schedule, and team-specific and time-specific effects. This research contributes to the body of literature affirming the value of data analytics for organizational performance and supports current investments in analytics being made by NBA teams.
Introduction
The implementation of sports analytics is motivated by the fundamental belief that data-driven decision-making improves performance outcomes. This notion has been researched and proven to be true with respect to financial outcomes for for-profit companies (Baijens et al., 2022; Müller et al., 2018; Shabbir & Gardezi, 2020). Despite this, there is limited quantitative evidence of such phenomena in professional sports. Currently, it is unclear if investment in sports analytics helps professional teams win more games, and if so, to what extent.
In the National Basketball Association (NBA), one of the most prominent sports leagues in the world, a key performance indicator (KPI) for every franchise during the regular season is number of wins. With such fierce competition, team owners make significant investments in players, coaches, training staff, facilities, amenities, and more in order to vie for a competitive advantage. For instance, during the 2022–2023 NBA season, clubs spent on average US$156 million on player salaries alone. However, franchises face financial constraints; in particular, the league-mandated salary cap restricts roster spending, and maximum salary restrictions limit how much a single athlete can be paid. While it is possible to exceed the salary cap by paying a luxury tax, doing so is difficult, especially for smaller market teams. Ultimately, the allocation of resources, particularly toward player personnel, is a costly and high-stakes task with little room for error and naturally demands well-informed decision-making processes.
In the public eye, sports analytics has become a hot topic amongst fans, and there is well-known anecdotal evidence of significant return on investment (ROI) for team performance. The 2011 film Moneyball (Miller, 2011), based on Michael Lewis’s 2003 book Moneyball: The Art of Winning an Unfair Game, chronicles how the 2002 Oakland Athletics, under general manager Billy Beane, utilized baseball analytics, or sabermetrics, to compete against much wealthier teams in Major League Baseball’s (MLB’s) unequal payroll system. By relying on data-driven decision-making while competitors engaged in traditional and flawed scouting practices, the athletes were able to consistently punch above their weight class, demonstrating how sports analytics can provide a competitive edge. Today, sabermetrics is pervasive across all levels of amateur and professional baseball and has greatly influenced the operations of front offices (Baumer & Zimbalist, 2014).
In tandem, the NBA has not been immune to the 21st-century data revolution. Fast-paced advances in basketball data collection, distribution, and analysis have present-day teams relying more and more heavily on data-driven decision-making. Naturally, the introduction of richer streams of basketball data has created a demand for technical staff with the skills to generate insights and improve performance. In 2024, all 30 teams have at least one employee who specializes in basketball analytics, but the level of adoption varies amongst clubs. Some organizations embrace newer, data-driven approaches in basketball operations, while others remain more grounded in traditional practice. Because significant financial resources are dedicated to basketball analytics across the association, understanding its ROI is crucial, and measuring a significant ROI would justify league-wide investment and potentially inform each team’s resource allocation process.
The goal of this paper is to quantify how investment in basketball analytics impacts win total during the NBA regular season using team-level results spanning the 2009–2010 and 2023–2024 NBA regular seasons. If we can demonstrate analytics indeed provides a competitive advantage, then we have evidence that the rapid adoption amongst professional sports teams is justified. Conversely, if we find analytics investment does not affect, or even hurts team success, then franchises may consider pivoting resources to other channels, such as coaching, player personnel, and facilities, among others. In this study, using analytics department headcount as a measure of investment and adoption, we estimate the effect of headcount on wins while controlling for roster strength, coaching experience, team continuity, and player health. We also include team-specific effects and time-specific effects to account for unobserved time-invariant confounders across teams, as well as trends and NBA-wide policies that affect all clubs. Under this framework, we find a positive and significant analyst effect that remains stable across multiple model specifications and assumptions.
The remainder of the paper proceeds as follows. Section “Literature Review” briefly summarizes the existing body of literature surrounding data analytics and organizational performance, as well as the landscape of basketball analytics. We then describe the data and variables used in our study in Section “Data” and the methods used in Section “Methods.” Next, Section “Results” presents the results from our empirical tests. Finally, Section “Conclusion” discusses conclusions, implications, and limitations, and offers avenues for continued research.
Literature Review
While research into the impact of data analytics on sports team performance is lacking, its positive effects in managerial and business settings are well-documented. The collection of survey data from business executives has allowed researchers to uncover big data analytics’s (BDA’s) beneficial effects on decision-making and financial performance. A 2010 MIT Sloan Management Review survey of over 3,000 executives across 108 countries and 30 industries found that approximately half of the respondents reported that enhancing data analytics was a priority for their organization, and high-performing companies were five times more likely to be employing data-driven solutions (LaValle et al., 2010). BDA assets improve firm productivity by 3% to 7%, particularly, in information-intensive and/or highly competitive industries (Müller et al., 2018). Additionally, BDA solutions improve the financial performance of businesses through mediating effects of business value and customer satisfaction (Raguseo & Vitari, 2018). The positive impact of BDA on organizational performance and knowledge management in small and medium enterprises is well established (Baijens et al., 2022; Shabbir & Gardezi, 2020), as well as its utility in real-time resource allocation and asset exchange (Fosso Wamba et al., 2015). Despite these advances, there is a notable gap in empirical research on BDA’s added value, particularly in the social sciences (Maroufkhani et al., 2019).
Given BDA is a proven asset in business and management, its potential in sports, and basketball in particular, is a topic of great interest. Chase (2020) argues that in the 21st century, the ability to harness the power of data through artificial intelligence and cloud computing is key to sustaining a competitive advantage in sports. Beyond basketball, sports such as professional soccer and baseball are already embracing analytics tools (Herberger & Litke, 2021). The wealth of historical sports data has made analytics a critical part of research & development processes. Teams across sports have been leveraging analytics for measuring the value of game states and actions, projecting win probabilities, and measuring team and player strength, among other applications (Baumer et al., 2023).
Basketball has been near the forefront of the sports analytics movement. In 2013, the NBA adopted SportVU technology, installing camera systems capable of “quantifying and recording unprecedented basketball data” in every stadium (Richman, 2013). The service, provided by technology company Stats Perform (previously STATS LLC), produces a live feed of player and ball-tracking metrics that can be analyzed by teams. Since this introduction of spatiotemporal data, basketball analytics has blossomed with novel avenues of research. Tracking data can be used to evaluate player decision-making using concepts such as expected possession value (Cervone et al., 2014; Jutamulia, 2021). Wearables and motion capture technology are helping teams manage injury risk (Bishop, 2023), and data science techniques are helping trainers and physicians understand how specific injuries hurt performance (Sarlis et al., 2021). Innovations in machine learning and artificial intelligence, such as the automation of basketball play classification through neural networks, have streamlined game planning and scouting processes for coaches (Markovic et al., 2020; Wang & Zemel, 2016). The rise of player and ball-tracking technologies in college basketball is enhancing talent identification and informing NBA draft strategies (Patton et al., 2021). Most recently, a new partnership between the NBA and Hawk-Eye Innovations brought cutting-edge skeletal data starting in the 2023–2024 season (NBA and Sony’s Hawk-Eye Innovations launch strategic partnership powering next generation tracking technology, 2023). These advances underscore the profound impact of basketball analytics on the way the game is studied and played, from strategy and talent identification to injury reduction and performance optimization. However, despite the impressive breadth of research in advancing sports analytics methodologies, there remains a hole in the literature on how such methodologies actually impact team-level KPIs. While modern-day sports analytics is impressive, its value remains unproven.
Notably, limited previous research on the topic fails to find a causal link between sports analytics investment and team outcomes, but this conclusion comes with limitations. Examination of the four major US sports leagues found that franchises that have adopted analytics show no competitive advantage (Freeman, 2016). The analysis used categories of analytics adoption published by the Entertainment and Sports Programming Network (ESPN) from the MLB, National Football League, NBA, and National Hockey League for the 2014 season. However, this study was a correlational analysis, and because categories were released for just the 2014 season, the sample is limited to only one year. Another study done on MLB teams from 2014 to 2017 uses ESPN-published categorical analytics adoption groups, as well as research staff headcounts from Baseball America Directories (Chu & Wang, 2019). However, this study does not use an econometric framework and relies on empirical conditional distributions, correlations, simple linear regressions, and decision trees. It finds being a “believer” in analytics is moderately positively correlated and statistically significant with wins for all seasons. However, when controlling for team payroll, multiple regressions show a positive and significant effect for research staff in only 2015. The authors do not control for any other confounding factors across MLB clubs beyond payroll. Additionally, decision trees for predictive classification tasks, unless carefully constructed, do not encode causal relations (Li et al., 2016). Nevertheless, this study demonstrates there is reason to believe an analytics effect may exist in MLB.
Although basketball analytics is pervasive in the modern professional game, we have yet to quantify its long-term effect on NBA teams. This paper seeks to address the lack of conclusive, empirical research on analytics in sports at a time when investment is at a historical high. Given the rapid spread of data analytics in basketball and existing evidence of BDA’s positive impact on firms in business contexts, we seek to determine whether a similar phenomenon exists in the NBA using an econometric approach and several years of data.
Data
Data Collection
All necessary datasets used in this study were publicly available. NBA teams are required to disclose player salaries, which can be found on www.HoopsHype.com. Season results (wins, losses, offensive metrics, defensive metrics, etc.) were obtained from ESPN at www.ESPN.com, and roster data was obtained from www.Basketball-Reference.com. Injury data, which teams must disclose on the NBA Injury Report (IR), was obtained from www.ProSportsTransactions.com. Finally, information about each team’s investment in basketball analytics was acquired from www.NBAStuffer.com, which maintains a head count of each franchise’s analytics department. The NBAStuffer website is dynamically updated, meaning data from previous seasons is not easily accessible, so the Internet Wayback Machine from www.web.archive.org was used to collect data from previous years. If multiple archives were created during a given calendar year, the archive logged closest to the date of the beginning of the regular season was used.
It should be noted that during the time period under consideration, the New Jersey Nets moved to Brooklyn, and the Charlotte Bobcats and New Orleans Hornets rebranded as the Charlotte Hornets and New Orleans Pelicans, respectively. To maintain consistency, the identity of these franchises remained consistent throughout the analysis. That is, all New Jersey Nets season-level observations are in the same group as all Brooklyn Nets observations and so on; we do not consider them as two different organizations.
Both manual annotation and automated scripts were used to scrape online data and merge the various sources into one table. Ultimately, we create a panel dataset consisting of season-level observations for each team, making the unit of analysis a team season. For each of these team seasons, we note the basketball analytics department headcount, relevant time-varying covariates, and team-level performance metrics. The exact variables are defined in the next subsection.
Variables of Interest
Table 1 defines the variables of interest for our experiment. In this section, we discuss the rationale behind the inclusion of each one.
Variable Definitions.
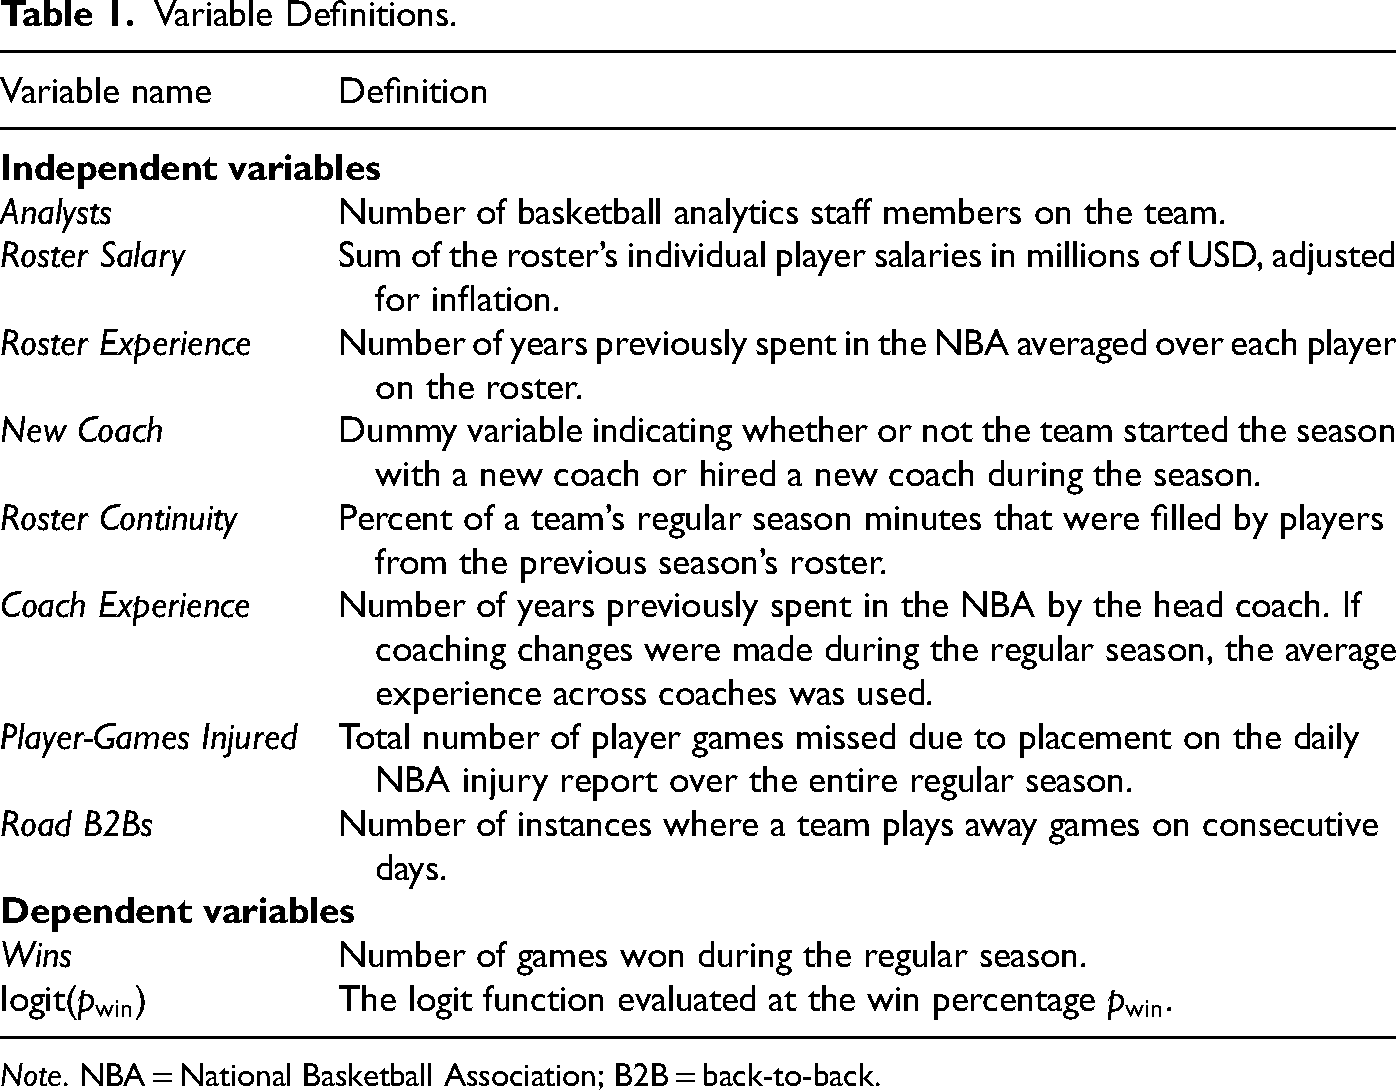
Note. NBA = National Basketball Association; B2B = back-to-back.
For this study, we require a measure of investment in basketball analytics. Ideally, every franchise would disclose how much money was spent on basketball analytics staff and resources each season, but this data is not publicly available. Instead, we use analytics department headcounts as a proxy under the assumption that more analytics personnel is an indicator of greater investment. We note that using a headcount metric is subject to limitations, which we detail in Section “Conclusion.” However, we find a similar approach is used in the business management literature, where human IT assets or the number of IT employees is used to analyze the effect of IT investment on firm performance (Sabherwal & Jeyaraj, 2015). Thus, the independent variable of interest is Analysts, which represents the observed analytics department headcount for each team season. According to NBAStuffer, headcounts were sourced by checking X (formerly Twitter) and LinkedIn profiles, annual media guides, front office staff directories, press releases and news, and communications with NBA insiders. It is important to note executives and nominally nontechnical individuals are considered as analytics staff by NBAStuffer if they are known to have an analytical background or embrace data-driven approaches in basketball operations. For example, Daryl Morey, current Philadelphia 76ers president and known basketball analytics aficionado, is included in the 76ers’ analytics department headcount. We recognize that these choices may be prone to subjectivity, but presently represent the most suitable proxy available to the authors.
The dependent variable is team performance, which we measure using the Wins variable, which denotes each team’s regular season win total. Wins is each team’s KPI assuming the ultimate goal of every club is to win as many games as possible. We exclude postseason wins for consistency since not all teams qualify.
To mitigate omitted variable bias, we collected several time-varying covariates to account for differences in observable team-level variables. These controls can be bucketed into two categories: (1) roster controls and (2) player health and fatigue controls. For category 1, the first control is Roster Salary, which is inflation-adjusted and calculated by summing each player’s earnings for the given season. This can be thought of as a weak proxy for roster strength because better players command higher salaries, and wealthier teams can afford better players and more analytics staff, both of which may increase winning odds. Next, we control for Roster Experience, calculated as the mean number of years each team member has previously played in the NBA. Intuitively, we expect more experienced teams to perform better than their younger counterparts. We note that we do not account for a turnover during past seasons due to trades and/or free agency as rosters were scraped from Basketball-Reference in January 2024. Next, because the quality of coaching may be an important determinant of team success, Coach Experience, the number of seasons of experience the head coach of the team possessed, was added. It is important to mention teams sometimes make coaching changes in the middle of the season. When this occurred, we took the average experience of all coaches who were active for that team season.
We note that an important factor of performance in sports is team coordination or team chemistry (Araújo & Davids, 2016; Eccles & Tenenbaum, 2004). Because coaching changes can interrupt the continuity, morale, and chemistry of a team, we include a dummy New Coach that indicates whether the team had a new head coach or experienced a mid-season firing. Additionally, we control for Roster Continuity, defined as the percent of a team’s regular season minutes that were filled by players from the previous season’s roster. This serves as a proxy for team chemistry, which reflects the degree to which team members interact positively and effectively on and off the court, and how familiar teammates are with each other’s play styles. Clubs with greater chemistry are thought to exhibit more teamwork, which could yield a competitive advantage.
For category 2, we include Player-Games Injured, which is the total number of times a team member was placed on the daily NBA IR for one game. Teams that suffer more injuries are unable to utilize their best players, which impairs winning chances. Next, we add the number of road back-to-backs played by the team that season, denoted as Road B2Bs. Playing consecutive games away from home is notorious for being demanding on the body because it entails shortened recovery windows and irregular sleep patterns due to travel and time zone differences, which are all factors that impact how fresh players are at tip-off and hurt performance (McHill & Chinoy, 2020).
A potential concern with our variable selection is how to disentangle the effects of analytics from Roster Salary, which may be viewed as a direct reflection of roster strength. While analytics staff contribute to building a strong roster, this objective does not necessarily align with achieving a high Roster Salary. Analytics is particularly effective at identifying undervalued metrics and players, optimizing roster performance relative to cost (Gavião et al., 2020; Harrison & Salmon, 2024; Li, 2021). In contrast, Roster Salary is largely driven by external factors, such as ownership priorities, market size, and broader economic conditions, which are beyond the control of analytics staff. To evaluate potential overlap, we conducted a variance inflation factor (VIF) analysis. The VIF values for Analysts (1.62) and Roster Salary (2.20) were below the threshold of 5, suggesting these variables capture distinct dimensions of team outcomes. Ultimately, we argue Roster Salary reflects financial and market-driven factors, while the Analysts measures internal capacity for decision-making and strategy, justifying the inclusion of both variables in our model.
Sample Restrictions and Characteristics
The sample size was primarily limited by the availability of information on analytics staff, which spans from the 2009–2010 NBA regular season to the 2023–2024 season, with the exception of 2018–2019. We excluded the anomalous 2011–2012 season, which was shortened due to a player lockout. The final balanced panel dataset consists of 12 seasons of data for all 30 teams, yielding a sample size of
Table 2 reports the descriptive statistics of the sample. By definition, teams win half of their games on average; the reason the mean Wins value is 40.11 and not 41 is that during the 2019–2020 season, the schedule was shortened from 82 games due to COVID-19. Additionally, the Boston Celtics and Indiana Pacers only played 81 games during the 2012–2013 season due to a canceled contest following the tragedy at the Boston Marathon. For roster salaries, clubs pay their players nearly US$120 million each season, although this figure has trended upward in recent years even when controlling for inflation. The mean Roster Experience is 4.5 years and coaches have between six to seven years of experience on average. For 13% of observations, the team had a new head coach. The average Roster Continuity is 63.7% and 26.25 is the mean number of games missed by players due to injury per team. Finally, the average club must play around 11 road back-to-backs each year. Notably, the number of club technical staff has increased substantially over time as shown in the comparative box plot found in Figure 1. At the start of the 2009–2010 NBA season, only 11 analysts existed across all teams. In October 2022, the league boasted a technical staff count of 132, more than a 10-fold increase. In the time window of the data, the average annual growth rate of basketball analytics headcount was 29%.
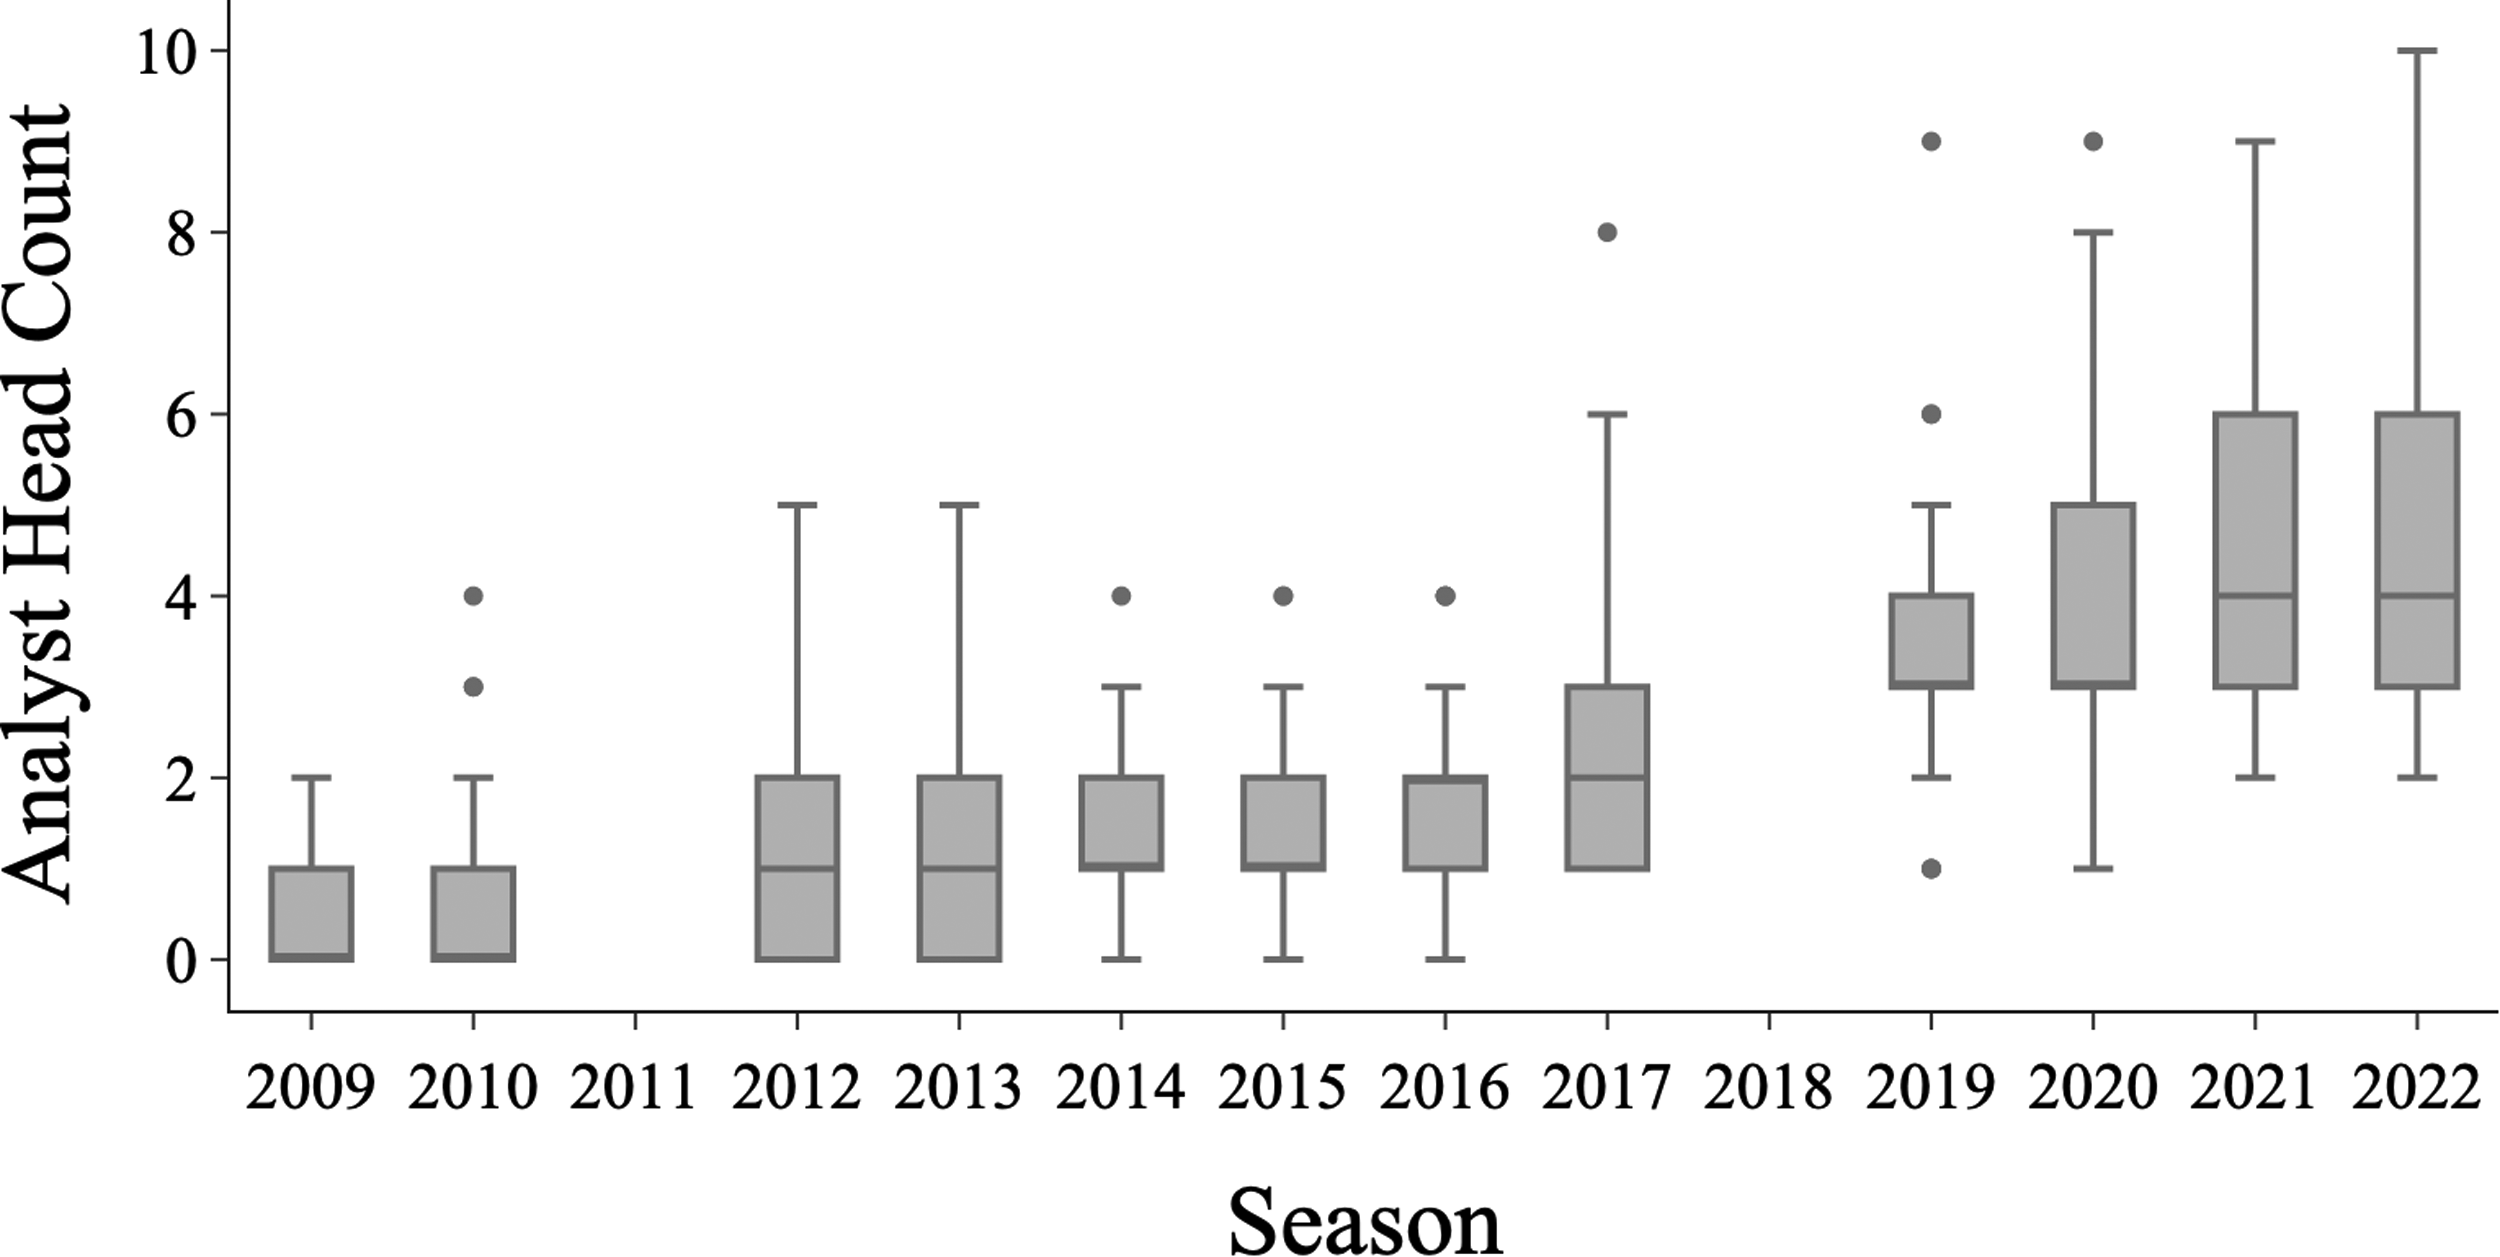
Box plots of NBA analytics department headcounts over time according to NBAStuffer. The years 2011 and 2018 are omitted owing to the lockout in 2011 and missing data in 2018. The median headcount is monotonically increasing from 2009 to 2022. Note. NBA = National Basketball Association.
Descriptive statistics
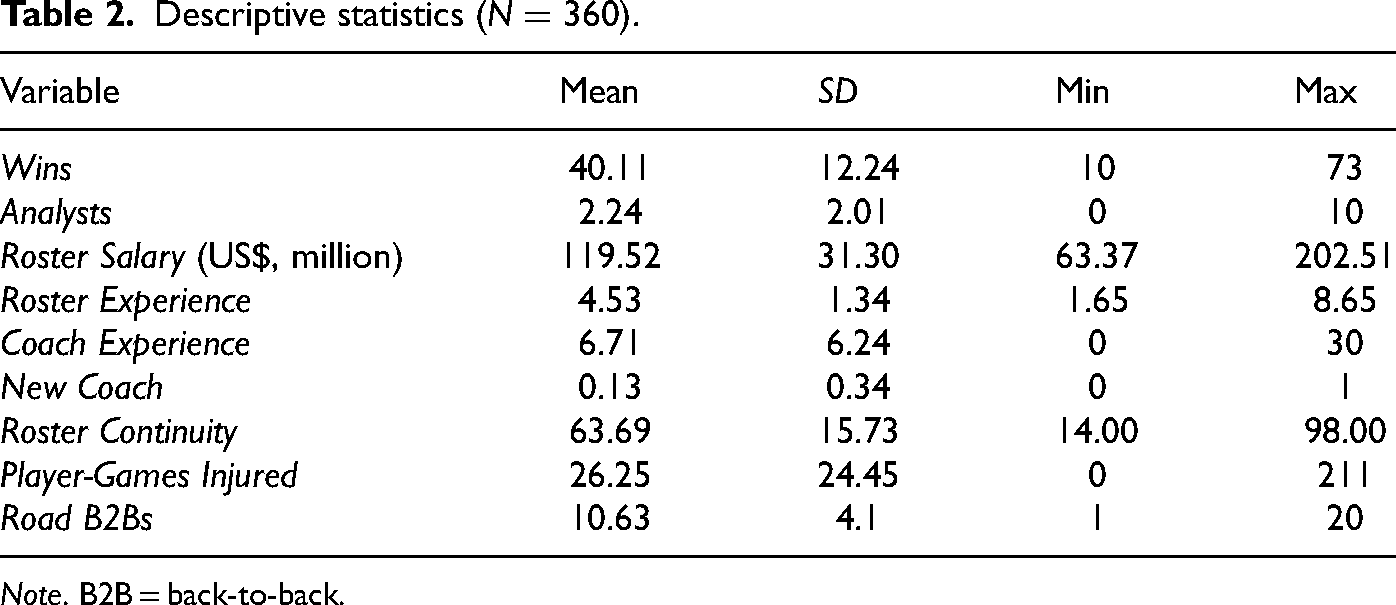
Note. B2B = back-to-back.
Methods
We employed various econometric approaches to estimate the causal effect of analysts on win total. We begin with an ordinary least squares (OLS) regression with controls and robust standard errors. Next, we use two-way fixed effects models to capture team-specific and time-specific effects on both Wins and
The inclusion of team and time-fixed effects is a crucial part of our analysis. Team fixed effects,
Additionally, time-fixed effects,
In summary, we estimate parameters in the following four models, where 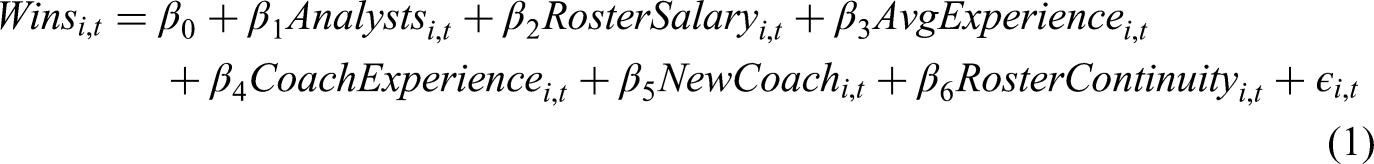
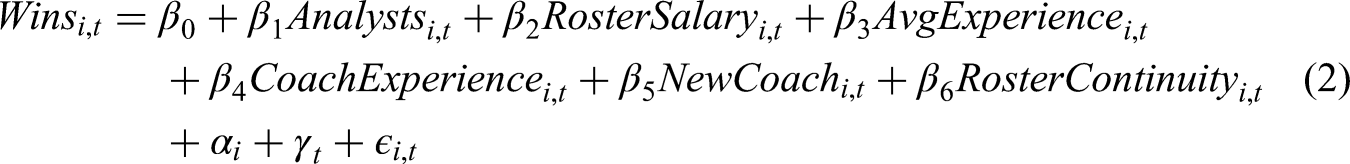
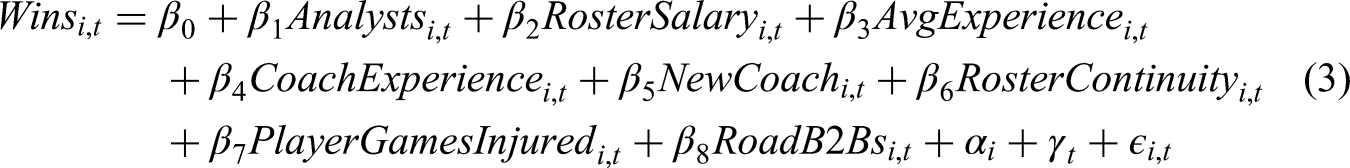
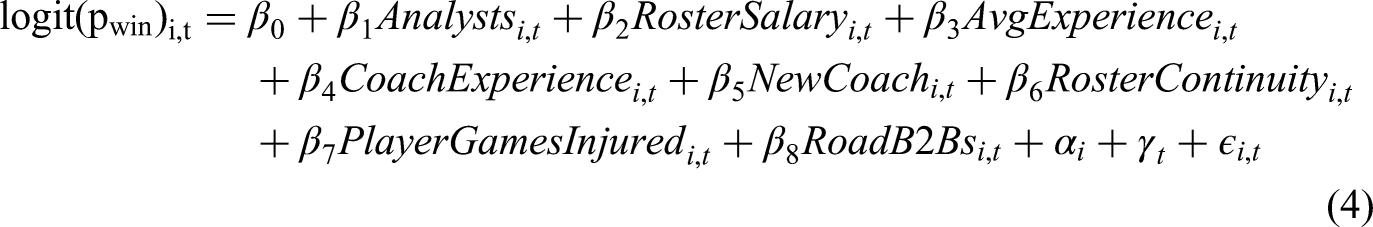
Results
Model Estimates
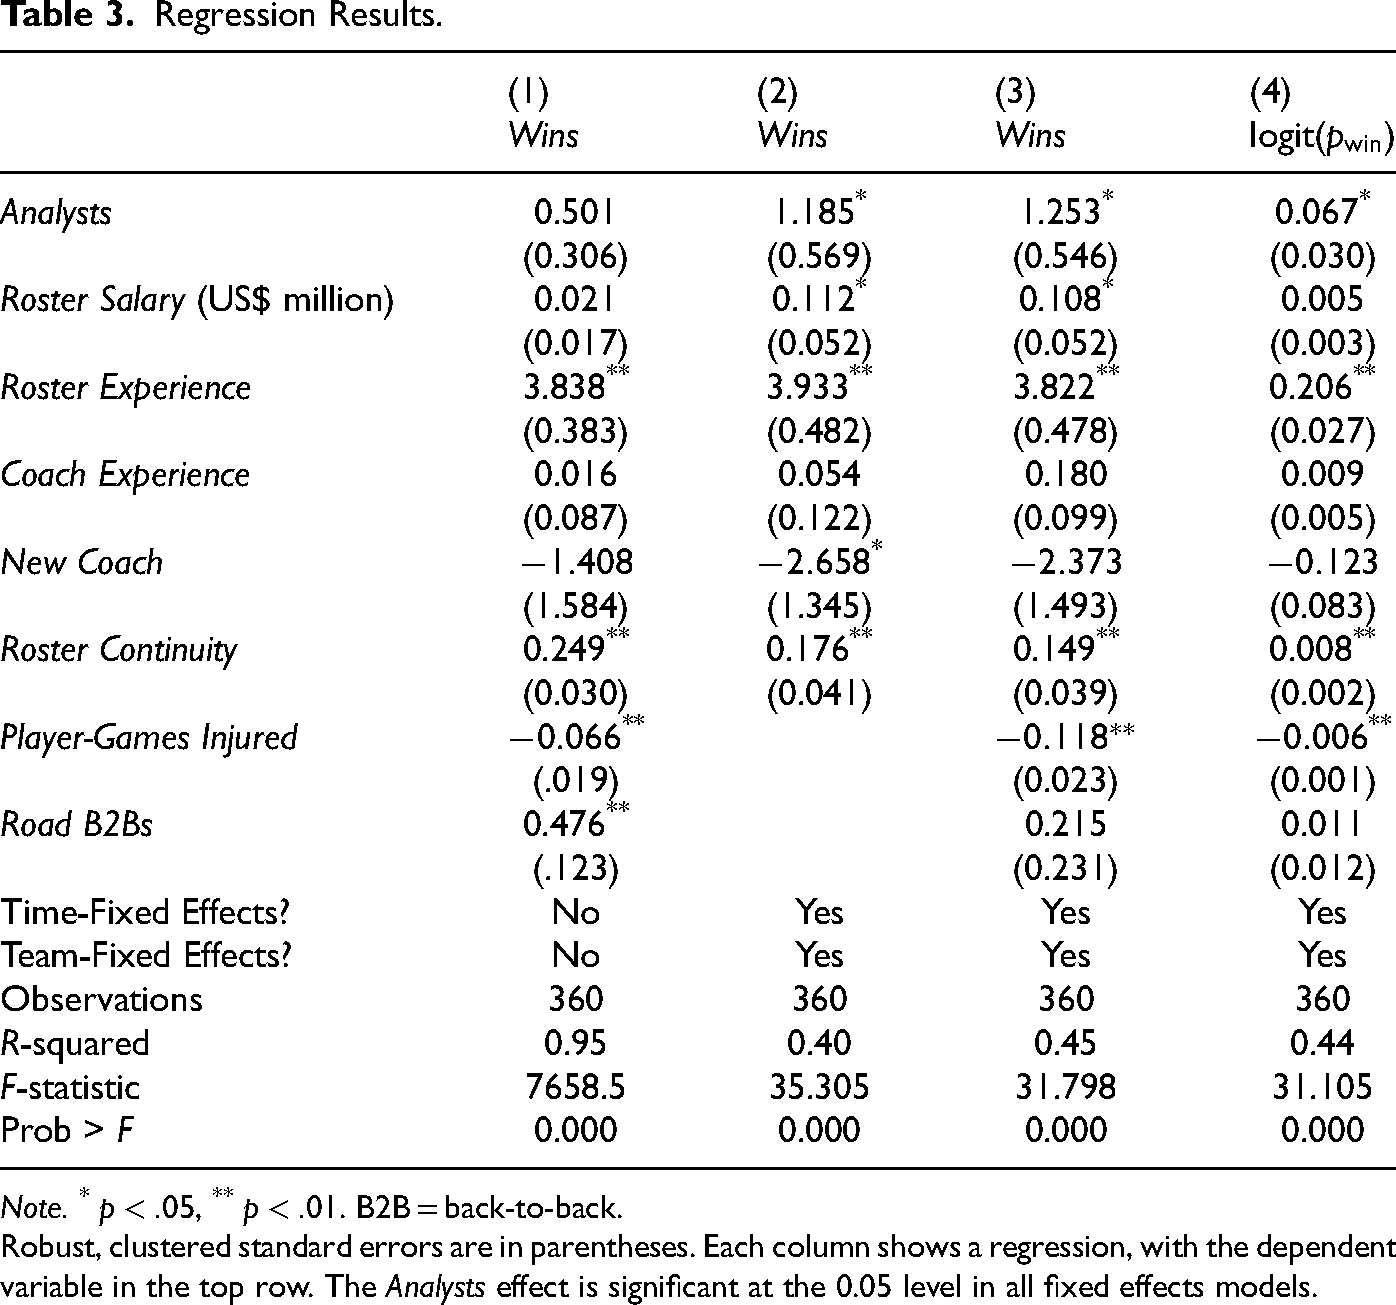
Table 3 reports estimates for the effect of Analysts on Wins and logit
In summary, the coefficient on the number of analysts in our linear fixed effects models remains stable between 1.1 and 1.3. Implications and practical takeaways are further discussed in Section “Conclusion,” where we discuss results from models (3) and (4).
Regression Results.
Note. *
Robust, clustered standard errors are in parentheses. Each column shows a regression, with the dependent variable in the top row. The Analysts effect is significant at the 0.05 level in all fixed effects models.
Conclusion
From the results of our fixed effect models, we conclude the effect of analytics department headcount on regular season win total is positive and statistically significant for NBA teams. Interpreting the coefficients of model (3) from Table 3 yields a number of insights. First, the directions of all statistically significant estimates are consistent with intuition. More technical analysts, more expensive players, more experienced personnel, and greater team chemistry all improve winning chances as indicated by the positive regression coefficients. The negative coefficient on Player-Games Injured demonstrates higher injury frequency decreases wins as expected. Next, we examine the absolute and relative magnitudes of our estimates. In model (3), we find that one analyst is worth an additional 1.25 wins. While one game in an 82-game season may seem insignificant, it can be the determining factor for making the playoffs or earning home-court advantage. Also, given the Roster Salary coefficient,
While model (3) provides interpretable effects within the observed range of the data, it is important to note that extrapolation beyond the range of 0 to 10 analysts would be invalid. For example, teams cannot achieve undefeated seasons simply by increasing analyst headcount or Roster Salary indefinitely. Additionally, model (4) demonstrates that the Analysts variable, while positive and significant, exhibits diminishing marginal returns.
There are a few limitations to this study. The analytics staff data from NBAStuffer is manually collected, meaning there is a potential measurement error in the
A design choice we considered when performing our empirical tests was whether or not the time-fixed effects allow for the inclusion of the 2011–2012 lockout season. However, due to the steep reduction in the number of games and uncertainty around how variables relating to player injury and fatigue behave in a shortened competition window, we still decided to omit it. Additionally, there is reason to be concerned about the accuracy of analytics department headcount data during this season, as analytics operations are likely to have been significantly reduced due to the financial constraints and operational disruptions caused by the lockout. Nevertheless, we remark the Analysts coefficient remains statistically significant at the 10% level (
As for the next steps, it may be worth exploring mediating effects through structural equation modeling, which could elucidate the mechanisms through which analytics improves team outcomes. Additionally, interactions between analytics investment and other team descriptors may be revealed with larger sample sizes in future studies. Also, there are a variety of more granular performance outcomes beyond wins that are prone to less randomness and may be impacted by basketball analytics such as offensive and defensive ratings, player efficiency ratings, assists-to-turnovers ratio, pace, player health, and more. Studying potential interaction effects with these performance metrics may shed light on areas where analytics is most useful. Because professional sports teams are also business units, similar analyses can be performed using financial outcome variables such as ticketing revenue or net profits. Models from economics or management theory describe how productivity scales with human capital can be incorporated. Finally, the scope of this project was focused on the NBA in the United States, and more research is needed to understand if the same effect exists in other sports and countries. With technology trickling down to college and high school athletics, it would be interesting to learn how the effect varies with skill level, or if it even exists at all beyond the professional ranks.
This work contributes to the growing body of literature uncovering the value of data and information technology for organizational success. Unlike previous research, this study demonstrates that with an econometric approach and sufficient time horizon, the utility of analytics found in business contexts also exists in professional sports. This finding suggests basketball analytics is a legitimate source of competitive advantage for clubs and has a tangible impact on team success, independent of roster composition, coaching experience, team chemistry, injuries, time-specific effects, and unobserved team differences. For both the NBA and its franchises, the evidence we present supports the significant league-wide investments being made in basketball data, whether it be contracting new data providers or hiring analytics personnel. It is clear that the adoption of basketball analytics is necessary to be competitive, and teams who are slow movers risk being left behind by the competition. Finally, our findings suggest that for sports leagues and sanctioning bodies hoping to foster a competitive and egalitarian landscape, making data and analytical tools available to all franchises and/or members is a worthy initiative.
Footnotes
Acknowledgments
The authors would like to thank NBAStuffer.com for their efforts in collecting and maintaining analytics department headcounts around the NBA. We also thank Professor Anna Mikusheva of the MIT Department of Economics for their advice on this project.
Declaration of Conflicting Interests
The authors declared no potential conflicts of interest with respect to the research, authorship, and/or publication of this article.
Funding
The authors disclosed receipt of the following financial support for the research, authorship, and/or publication of this article: For this project, the first author was supported by the MIT Sports Lab Pro Sports Consortium. The second author was supported by the ONR 2016 Vannevar Bush Faculty Fellowship from the Office of the Under Secretary of Defense.