
Abstract
We use Australian Thoroughbred racing data, including situational variables, to examine when a sequence of winning rides for a jockey initiates psychological momentum (PM) that makes a win on the next ride more or less likely, other things equal. Of the 42% of jockeys that exhibit PM, we find positive PM is much more common (80%) than negative PM; PM is more often precipitated by the first than the second win in the sequence; and the duration of PM is only a single ride in 90% of cases. The later the precipitating win in the sequence the more intense the PM generated. We find no evidence that PM is related to age, gender, or general riding ability. Although a broad strategy of betting on momentum-prone jockeys would result in losses, a more selective wagering strategy exploiting knowledge of when the PM is precipitated and its intensity, could generate a positive profit.
Introduction
The view that the psychological momentum (PM) can be an important factor in the success of sports contestants seems to be widely held (Adler & Adler, 1978). Iso-Ahola and Mobily (1980) define PM as an added or gained psychological power which changes interpersonal perceptions and influences an individual's mental and physical performance. The tendency to see short-run sequential dependencies (momentum) occurs in most competitive environments, including business (forecasting fads and fashion) and financial activities (the ups and downs of the stock market). But how momentum is created and then dissipated is mostly discussed in relation to sports. Commentators in a wide range of sports often remark that a successful action by one contestant (individual or team) has given that contestant momentum in future play. The thoroughbred racing industry is no exception. Racing commentators will observe that a jockey with several wins on the day's racing card is having a “good day at the track/office,” in the expectation that this winning streak is more likely than otherwise to continue. Casual observation tends to reinforce this view that jockey wins often come in streaks. 1
A considerable empirical literature has arisen testing for the presence of PM (or its equivalent—the “hot hand” HH) in a wide range of sports. The early results led to mixed conclusions and a meta-analysis (Avugos et al., 2012) led the authors to conclude against the existence of HH in sport in general. However, recent research has criticized some of these earlier studies, particularly those with negative findings, on several grounds. Stone (2012) showed that if the HH was interpreted as serial correlation in the probability of a success, then testing on the serial correlation in outcomes could vastly underestimate the true correlation of success probabilities. Miller and Sanjurjo (2018) uncovered a bias in the common measure of the conditional dependence of present outcomes on streaks of past outcomes in sequential data used in many studies. Once this bias was corrected for, some of the negative conclusions from the earlier studies were reversed. Livingston (2012) notes that where PM is an individual characteristic, negative results from tests that involve the aggregation of individual observations could mask the existence of HH for some individuals. Other issues include measurement error, small samples, lack of statistical power (Arkes, 2013); how to appropriately account for the influence of situational variables and, where applicable, opponents’ counter-strategies (Raab et al., 2012). More on this below.
In Wrathall et al., 2020 (WFR hereafter), we took this debate to thoroughbred racing in Australia. Thoroughbred racing is an important industry in Australia as evidenced by each State Government having a minister with a Racing portfolio. According to the Racing Australia Fact Book 2022, in the 2021/22 racing season, there were 387 race clubs, 4,078 trainers, 811 jockeys, 35,103 active race horses, 489 bookmakers, and 524 stallions standing at stud. Total race prizemoney was over $855 million and total wagering over $29 billion. Australians wager more on horse racing per capita than any other nation and one in every 254 Australians owns at least a share in a racehorse (Aushorse Guide).
In WFR we used evidence on jockey winning streaks from the complete riding history of a sample of 249 jockeys. We chose a test based on comparing each jockey's actual to predicted (based on the jockey's winning strike rate) numbers of steaks of each length and concluded that, while jockeys collectively had more winning streaks than would be expected on the basis of their strike rates, this did not imply that all jockeys individually had the hot hand. Using a simple t-test of the likelihood of the actual number of streaks being explained by a jockey's strike rate, we found that 58% of the jockeys in our sample did not exhibit HH at any streak length. The other 42% exhibited HH for at least one streak length, but only 4% were shown to have HH at all streak lengths. 2 On the basis of these results, it seemed reasonable to conclude that HH was present but not ubiquitous amongst the population of jockeys in Australia.
Taking its presence as given, our main objective in this paper is to extend and broaden our previous analysis by identifying relevant characteristics of jockey PM. For this, we use racing data for 426 jockeys drawn from horse races held in Australia over the 6-year period 2011 to 2016. In the Taylor and Demick (1994) model of the psychological and physiological processes that link past with future performances, all contestants begin without PM. The process is then initiated by a precipitating event whose impact on the contestant may lead to behavioral changes which affects performance and outcomes. But this is not guaranteed. The response will very much depend on the “personality” of the contestant and the nature of the contest.
Many factors impact on how a contestant reacts to recent performances and different contestants can react to the same situation in different ways. Some may respond positively to a recent success (or negatively to a recent failure), while others may be unaffected by recent performances. For some success can produce positive inhibition—a loss of momentum rather than a gain (Silva et al., 1988). 3 Similarly, not all successful actions need give rise to (positive) PM. A precondition is that the success be attributed by the contestant to internal factors (i.e., their own ability and effort) rather than to “luck” or external factors outside the contestant's control. Fortunately, such internal attributions are likely, because contestants have generally been found to attribute success to their own ability and effort, and to attribute failure to external factors (Sedikides & Gregg, 2008; Weiner, 1985).
Our analysis therefore requires an outcome likely to act as a precipitating event and for this, we choose a sequence of wins, consistent with our approach in WFR. We are not trying to cover all possible candidates to be precipitating events, which could include wins on outsiders or sequences involving both wins and places. Rather we want something plausible and relatively easy for the betting market to identify so that it might form the basis of a simple wagering strategy. In the empirical work that follows we examine the possibility that a sequence of winning rides provides a precipitating event that ignites PM. How far into the sequence we need to go for this to happen, if it ever does, will depend on the jockey involved.
Iso-Ahola and Dotson (2014) draw attention to three further aspects involved in PM—frequency, duration, and intensity. Whether a sequence of wins acts as a precipitating event for a particular jockey may depend on how frequently this happens. A jockey who typically wins one race in five rides (a 20% strike rate) will find herself achieving a sequence of wins of any given length more frequently than a jockey with a lower (say 10%) strike rate. Other things equal, a jockey with a higher strike rate may require a longer sequence of wins to precipitate PM than a jockey with a lower strike rate.
The greater the intensity of the PM generated by the precipitating success, the greater the likelihood of subsequent success. Although we are unable to obtain a direct measure of a variable as idiosyncratic as the intensity of a jockey's PM, our estimates of its effects on the winning odds ratio provide an indirect measure that can be compared across jockeys. Finally, the intensity can contribute positively to the duration of the PM. In general, PM may be dissipated by a sequence of unsuccessful actions or by a period of inactivity for a contestant. For a jockey, this could be a sequence of losing rides or the end of the day's racing.
As noted above, we assume that the “precipitating event” for the creation of PM is a win in a sequence of winning rides. It could be the first, second, or even a later win in the sequence. Once a sequence of winning rides is observed, we can: (a) identify and estimate the marginal effect of an additional win (in a sequence) on the likelihood of a jockey winning on her next ride; and (b) identify and estimate the total effect of a sequence of wins on the likelihood of a jockey winning on her next ride. In terms of the discussion above: (a) gives us an indicator of which win in the sequence provides the precipitating event; while (b) provides an indication of the duration of PM—i.e., the point at which momentum ceases to have a significant effect on the likelihood of a further win. 4
It is possible of course, that the estimated marginal and total effects of a sequence of wins might be negative and significant. This would indicate that the jockey is less likely to win than otherwise on her next ride—a response opposite to that which leads to the “hot hand.” 5 Just as some jockeys may “look to their laurels” and exert extra effort on their next ride, others may “rest on their laurels” and relax a little on their next ride following a precipitating win. For the latter, a sequence of n winning rides is more likely to be followed by a loss, and they are less likely to have a sequence of n + 1 wins, other things equal.
We find that PM generated by a sequence of wins is present, but only for a minority of jockeys (42%) and for a limited number of rides. Among those jockeys who are PM prone, positive PM (looking to their laurels) is four times more common than negative PM (resting on their laurels). PM is more often precipitated by the first win in the sequence than later wins; and for nine out of ten PM-prone jockeys its duration is only a single ride. The later the precipitating win in the sequence the stronger the intensity of the PM it generates. We find no evidence that PM is related to age or gender. Nor does it appear to be related to riding ability, except that, among PM-prone jockeys, those with higher winning strike rates tend to have lower intensity momentum. The effects of PM on jockey prize money depend on whether the associated winning sequence extends across different race days.
A second objective of this paper is to test whether the effects of the PM we have identified are picked up in the Betting Market. Gambling on horse races is probably as old as racing itself and became an integral part of the racing industry. The industry has long recognized the wider interest generated if fans can gamble on race outcomes and facilitated this by encouraging on-track betting. Until the formation of professional sports leagues in the mid- to late nineteenth century, horse racing was the predominant type of sports gambling across Europe and North America. Initially, wagering occurred through bookmakers who set the odds, but this system was supplemented, and overtaken in some cases, by the development of pari-mutuel betting in the mid-nineteenth century. Under pari-mutuel betting, the odds are endogenously generated by the bettors through the volume of bets made on the various race contestants (Matheson, 2021).
Participants in any large betting market are interested in any information that might help them “pick a winner” and evidence of jockey winning momentum potentially provides such information. This gives rise to two related questions. Firstly, do the betting market odds appear to take full account of any momentum effects we uncover? We expect this market to take full account of the situational variables, but to what extent does it also take account of any momentum effects. Secondly, could our momentum estimates provide the basis for a profitable gambling strategy? A positive answer to the second question presupposes a negative answer to the first.
We find no evidence that momentum-prone jockeys yield a higher return on investment from betting than jockeys in general. What we do find, however, is that simple but selective wagering strategies exploit the knowledge of when jockey PM is in effect, which can generate a positive profit. These strategies use knowledge of the precipitating win and the intensity of the PM. Limiting bets to momentum-prone jockeys with precipitating wins beyond the first win in the sequence or with the intensity above the mean yields higher returns—but fewer betting opportunities.
In the following section, we discuss the literature surrounding the hot hand phenomenon with emphasis on studies that specifically include the influence of situational variables on the outcome. Section 3 discusses our data and Sections 4 and 5 present our results. Section 6 relates our estimated jockey momentum characteristics to other jockey attributes and explores the effects of PM on jockey prize money and betting returns. Finally, Section 7 presents a summary and our conclusions.
Literature
The likelihood of a jockey having won a randomly chosen race in her racing history is given by her (winning) strike rate. However, we know that all these horse races were not alike for our jockey. In some, she may have been riding the race favorite against relatively weak opposition over a race length that suited both her and the horse. In others, she may have been riding a longshot against strong opposition over a race length that suited neither her nor the horse. In the former case, her likelihood of winning was in fact higher than her strike rate, in the latter case it was lower. These changes in situational variables must be controlled for if we are to estimate momentum effects, at least in small to moderate samples. 6
The issue of dealing with changes in situational variables has long been recognized in the HH literature. A natural response has been to focus on sporting activities where their effects are likely to be minimal. Oskarsson et al. (2009) argue that HH will more readily emerge in sports where contexts are uniform (i.e., free from the influence of situational variables) and there is evidence that appears to support this view, from, for example, horseshoe pitching (Smith, 2003), bowling (Dorsey-Palmateer and Smith, 2004; Yaari and David, 2012) and darts (Otting et al., 2020). However, even if the “situation” is constant other issues remain. Yaari and David (2012) highlight the difficulty that can arise in identifying momentum effects over a period of time where they could be confounded by game-to-game or day-to-day fluctuations in an athlete's probability of success rather than momentum gained from recent successes. 7 The fleeting nature of some momentum effects is highlighted by Otting et al. (2020) who find a strong serial correlation for within-turn throws (involving three darts thrown within a matter of seconds), but inconclusive evidence across turns within a game (which lasts a matter of minutes). 8
Although HH is more likely to be detected in individual rather than team sports (Bar-Eli et al., 2006), there are individual activities within team games that can and have been used to test for their presence. Free-throw shooting in basketball (Yaari and Eisenmann, 2011), and penalty-taking or shot-blocking in other sports are cases in point. 9 Whether streakiness can be observed in an individual's performance in team sports more generally depends on the strength of any endogenous strategic responses, a point emphasized by Green and Zwiebel (2018). They argue that defensive moves in games like basketball (i.e., assigning greater defensive resources to guard the “better” shooters) will tend to even out player scoring success, thereby impeding our ability to detect HH even if it exists. They see baseball, where the scope for defensive moves by the fielding team is much more limited, as more fertile ground for identifying streaky performance. Green and Zwiebel (2018) combine individual batting data into a panel to increase the power of their tests but note that this requires that a distinction be made between a (temporarily) hot player and a (permanently) good player. They therefore control for the ability of the batter and the pitcher, as well as other situational variables. In their conclusions, they hypothesize that skilled activity will generally exhibit streakiness though this can only be observed if the activity does not permit an endogenous response likely to nullify its effects on the data. 10
Sometimes the momentum effect may be so strong that a large sample is not required for its presence to be detected. Such appears to be the case in professional tennis tournaments (Jackson and Mosurski, 1997; Klaassen and Magnus, 2001). In other settings, however, there is little alternative but to collect data on the relevant situational variables and directly control for their influence when conducting the analysis. An early example is Albright (1993), who drew on archival baseball data to see if batting streaks occur more often than would be considered as random. A player's batting outcome was assumed to vary from one at-bat to another depending on the situational variables and the player's recent batting success. From his estimates, Albright concluded that the evidence is more in line with a model of randomness and that there was no convincing evidence of wide-scale streakiness. Although some players exhibit significant streakiness over short periods (e.g., during a single season) this was consistent with the underlying process being random. 11
In a comment on Albright's work, Stern and Morris (1993) note that a logistic regression model has limited power to detect streak-hitting behavior unless the sample of at-bats is large or the effect size is substantial. Their conclusion is that streaks in sports should be assumed to occur at least until reasonably powerful approaches fail to reject plausible alternatives. Similarly, Arkes (2013), uses simulations to show that many of the earlier studies had little chance of detecting HH since the small sample size lacked the necessary statistical power. The infrequency of the occurrence of HH contributes to the understated estimates and the inability of tests to detect significance.
In summary, the discussion surrounding the HH phenomenon is clearly on-going and the literature reviewed has revealed several issues potentially relevant to our work. First, although a horse race involves other competitors, they have limited scope for adopting counter-strategies targeting a jockey perceived to have a momentum advantage. They are probably more likely to be keeping an eye on the race favorite. So, in principle at least, where PM is present we should be able to estimate it—provided we control for differences in situational variables. Second, PM is clearly an individual characteristic, but where the effects are small they may need a large sample to be estimated. Hence, there can be advantages to testing on data aggregated across individuals. But to do this we need to control for differences in jockey ability. 12 Third, since it is at the individual jockey level that PM occurs, that should be the best place to look for it, and if the momentum effect is strong enough it could emerge, even in moderately large samples. Finally, there is the potential for momentum effects to be confounded by day-to-day fluctuations in jockey ability that have nothing to do with recent performance. While we cannot test for these fluctuations directly, we are able to separate our winning sequences into those that occur wholly within a single race day (within-day sequences) and those that occur over more than one day (across-day sequences).
If contest outcomes can be significantly affected by the presence of contestant PM, then this is likely to be reflected in behavior in the betting market. How this happens depends on two main issues: firstly, the betting opportunities the market provides; and secondly, the way in which the betting odds are determined in that market. With regard to betting opportunities, we have noted that in many sports (e.g., darts, basketball) individual contestant PM appears to be generated by early success within the game, but to be quite fleeting and unlikely to continue beyond a particular game or contest. In such cases, the opportunities to identify and wager on an individual contestant's PM may be limited by the structure of the game (e.g., it would be difficult to insert a bet between throws at darts or free throws in basketball). Betting will be facilitated if the game has regular breaks (e.g., between sets in tennis or halves or quarters in other sports). Where team play is involved, there will be opportunities to bet on team momentum carried into the game as well as momentum created within the game itself. 13 Advances in communications technology have vastly expanded wagering opportunities in many sports, but it remains the case that most thoroughbred races have too many contestants and are over too quickly for within-race betting to be viable.
When bookmakers set the odds (or the point spread depending on the nature of the contest), the betting opportunities can depend on both the bettor and bookmaker’s perceptions of PM. If bookmakers act “passively” (i.e., set the odds to balance the bets on either side of a wager), then Camerer (1989) hypothesized that betting against teams on winning streaks could be profitable, as point spreads may reflect a mythical HH, while game outcomes may or may not reflect an actual HH effect. 14 Evidence was found to support this hypothesis from betting in the NBA (Paul and Weinbach, 2005), but not the NFL (Woodland and Woodland, 2000).
Alternatively, if bookmakers set odds to maximize profits, rather than just to balance bets, and bettors tend to have certain biases, then bookmakers can earn higher profits by becoming active participants in the market (Levitt, 2004). That they do this has been supported by research that has shown that the betting volume is not evenly balanced between favorites and underdogs in either the NFL (Paul & Weinbach, 2007) or the NBA (Paul & Weinbach, 2008). In most cases, bookmakers do not shade the odds to the more popular side of the betting proposition, but instead set them as a forecast of game outcomes producing considerable betting imbalances. 15 For profit-maximizing bookmakers in thoroughbred racing the possibility of jockey PM would be added to a list of known betting anomalies (favorite/longshot bias etc.) to be taken into account when setting the odds. An advantage of using the pari-mutuel odds is that they are free from such strategic bookmaker intervention and can therefore be taken to reflect the views of the general betting public. 16 We can then test whether the public views jockey PM as a factor determining race outcomes, using a wagering strategy based on our identification of the precipitation, duration, and intensity of the PM of PM-prone jockeys.
Data and Methodology
Our (downloaded) data covers all the thoroughbred horse races held at the 176 metropolitan, provincial, and country turf clubs in Australia between January 1, 2011, and December 31, 2016, for which pari-mutuel (tote) betting was available. This data includes information about jockeys, horses, and several race-specific features from 98,577 races involving just over 999,000 jockey rides. Other data on horse and jockey characteristics was obtained from various websites as described below. Our objective is to use this data to estimate the effects of a past sequence of wins on the odds of a jockey winning on their next ride.
Situational Variables
Each race consists of a number of racing combinations, each composed of a horse and a jockey. 17 A jockey can have several rides at a particular race meeting, but they will all be on different horses as thoroughbreds typically have a break of between one to four weeks between races. So, while a jockey may be competing with some of the same jockeys as on the previous ride, they will all be riding different horses. We use situational variables to control for these and other changes. The situational variables, listed in Table 1, are intended to capture the relative quality of the horse and jockey (relative to the other competitors in the field) as well as aspects of the race itself. 18
Summary of Variables.
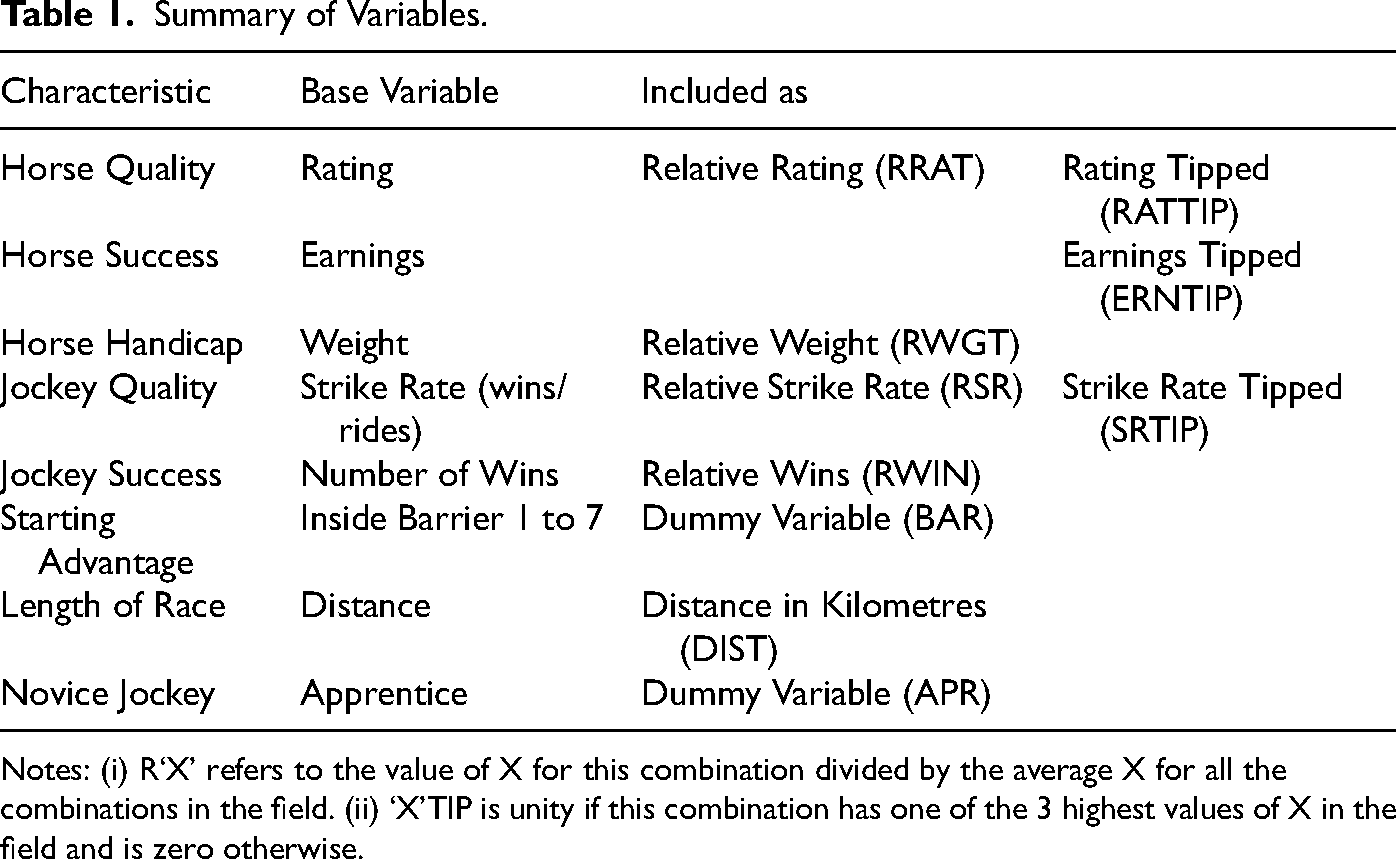
Notes: (i) R‘X’ refers to the value of X for this combination divided by the average X for all the combinations in the field. (ii) ‘X’TIP is unity if this combination has one of the 3 highest values of X in the field and is zero otherwise.
For horse characteristics, we include indicators of horse quality, horse success, and horse handicap. To control for thoroughbred quality we make use of the unitab rating system. Rating (RAT) is a numerical measure based on a horse's past performance calculated to provide information to bettors about the quality of each horse in an upcoming race. The higher the rating the “better” the horse's chances of winning (Australian Thoroughbred Directory.com.au). 19
Average prize money per race earned by the horse prior to the current race (ERN) is included in most thoroughbred wagering form guides. Its purpose is to inform bettors of a horse's previous performances (Winning Edge Investments), since if a horse has a high prizemoney per start, then the implication is that it has won or done well in good quality races in the past. Weight (WGT), the third horse quality characteristic, is the weight to be carried by a horse in the current race. Handicappers assign weights to each horse in a race with the objective of equalizing their chances of winning (Racing Australia). Handicappers use a horse's past performance and their professional judgment when assigning these weights, and they must be able to provide logical and reasoned explanations for the weights they assign each horse (racing.com). So, better-quality horses (according to the handicapper's criteria) will generally be assigned higher weights.
For jockey characteristics, we include measures of jockey success and jockey quality. Win (WIN) is the number of wins by a jockey prior to the current race and is used to measure jockey experience (of winning). Strike rate (SR) is the proportion of winning rides by a jockey prior to the current race ( RacingandSports ).
Barrier (BAR) is used as a specific race feature that provides information about the starting position of each combination in a race. BAR is a dummy variable taking the value 1 if this combination is allocated to one of the seven inside starting gates (barrier). It is considered to be an advantage if a horse is drawn closer to the running rail ( RacingandSports ). Distance (DIST) is the length of the current race (measured in kilometers). Some jockeys are considered to be exceptional at “rating a horse” (controlling a horse's speed) during a race. This skill becomes more important over longer races. For this reason, we include this variable to control for jockeys that are better suited to longer races.
Apprentice (APR) is a dummy variable taking the value one if the jockey is still an apprentice jockey at the time of the current race and zero otherwise. Other things equal, apprentice jockeys are less likely to win because of lack of experience and strength; but apprentices can also claim a weight allowance (which is appealing to the connections of the top-weighted horses) to compensate for this lack of experience. 20
Because it is the quality of the combination relative to its competitors in the field rather than its absolute quality that is likely to determine its success in the race, where relevant we transform our variables so that they capture the corresponding attribute of the combination relative to the average in the race field. This gives us a relative rating (RRAT) for the horse characteristics 21 and relative strike rate (RSR) and relative wins (RWIN) for the jockey characteristics. We also include relative weight (RWGT) on the grounds that it is the relative weight a horse carries in a race rather than the absolute weight penalty that matters.
Further, since we are looking for the “best” performance, it seems sensible that further emphasis should be given to those combinations that rank highest on each of the quality measures. We, therefore, include the rating tip (RATTIP), earnings tip (ERNTIP), strike rate tip (SRTIP), and win tip (WINTIP). These are dummy variables that take the value 1 if the combination is one of the top three with that relative attribute in the field, and zero otherwise. 22
Sequential Variables
We wish to estimate whether an immediate past sequence of K wins has a significant effect on the probability of a jockey winning on her next ride, other things being equal (including her strike rate). In order to obtain these estimates, we define the sequential variable
As Otting et al. (2020) note, two types of approach can be used to investigate general HH effects—(i) direct analysis of the serial correlation in outcomes; or (ii) analysis of the serial correlation in a latent variable constructed to measure the probability of success, where, after appropriate modeling, 23 the correlation coefficient would then be estimated from the racing outcomes. Stone (2012) showed that approach (i) may vastly underestimate the correlation success probabilities, which has led to (ii) becoming the preferred option in most cases.
We model a riding combination's probability of success as a (nonlinear) function of situational variables and (potential) jockey momentum effects relating to a sequence of past wins. We then transform this variable into the log of the winning-odds ratio which becomes linear in the situational and momentum variables. Estimation of this log-odds equation allows us to determine, inter alia, whether the jockey is momentum-prone following a sequence of wins and, if so, which is the precipitating win in the sequence, how long is the duration of the PM and what is its (relative) intensity.
Including both situational and sequential variables for each jockey, we write the probability that riding combination j wins race r 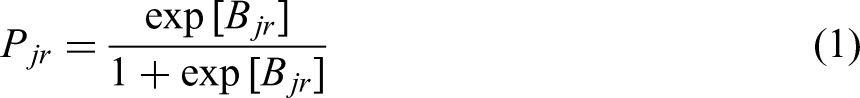

Note that if a jockey wins 2 races in a row, then both
For those jockeys who completed an apprenticeship within our sample period, we amend 
As noted earlier, the potential influence of jockey PM effects are widely cited by racing commentators and our main objective here is to determine whether PM effects related to a sequence of winning rides can be estimated from our data. A secondary objective is to determine whether they feature in the betting market's assessment of the likely race outcome, where a riding combination's market odds ratio
There are then two questions of interest. First, how is the market odds ratio related to our situational variables? We investigate this relationship by estimating:

Aggregate Results
PM is an individual characteristic and ideally, its effects would be investigated using individual jockey data. But where these effects are small their analysis may require a larger sample than is available for most jockeys. This implies that there can be advantages to estimating the data aggregated across individual jockeys, particularly where long sequences of wins are involved. In doing this the underlying assumption is that the PM effects are the same for all jockeys, which allows us to view these results as reflecting an “average jockey.” We therefore start by considering regressions on the full data set, controlling for differences in jockey ability and other attributes. The results of estimating these regressions are reported in Table 2.
Aggregate Results.
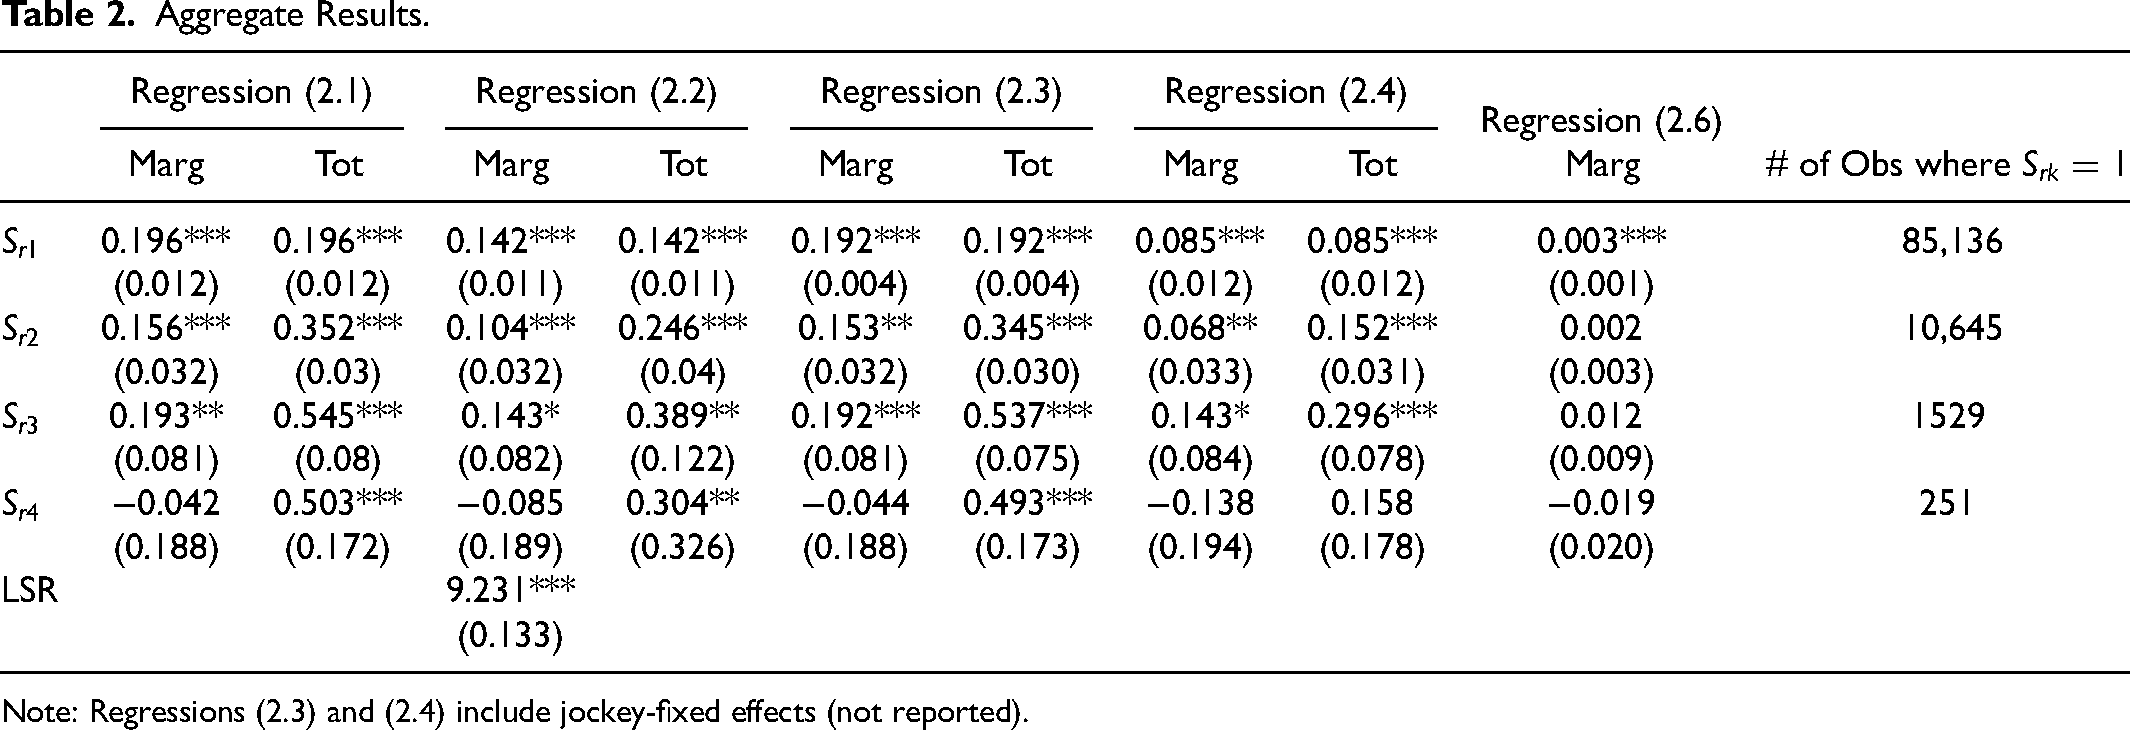
Note: Regressions (2.3) and (2.4) include jockey-fixed effects (not reported).
Since few jockeys have multiple observations of the longer winning streaks
In Table 2, regression (2.1) ignores situational variables and differences in jockey ability. The next two regressions take account of differences in jockey characteristics. In equation (2.2) we add a jockey lifetime strike rate variable
We first consider the regressions without the situational variables. If we ignore differences in jockey ability (2.1), we find positive and significant estimated marginal and total effects for one, two and three wins in a row, as is the total effect for the fourth win though its marginal effect is insignificant. We find that this pattern of signs and significance is maintained once we control for jockey ability through lifetime strike rate (2.2) or jockey fixed effects (2.3), but that the magnitudes of these estimated effects are generally reduced once jockey ability is accounted for. Overall, the broad impression from these results is that the average jockey feels encouraged to look to her laurels by a sequence of winning rides and is more likely than otherwise to win on her next ride. Adding the situational variables (2.4) weakens but does not negate these conclusions for sequences of up to three wins, but now both the marginal and total effects of the fourth win are insignificant.
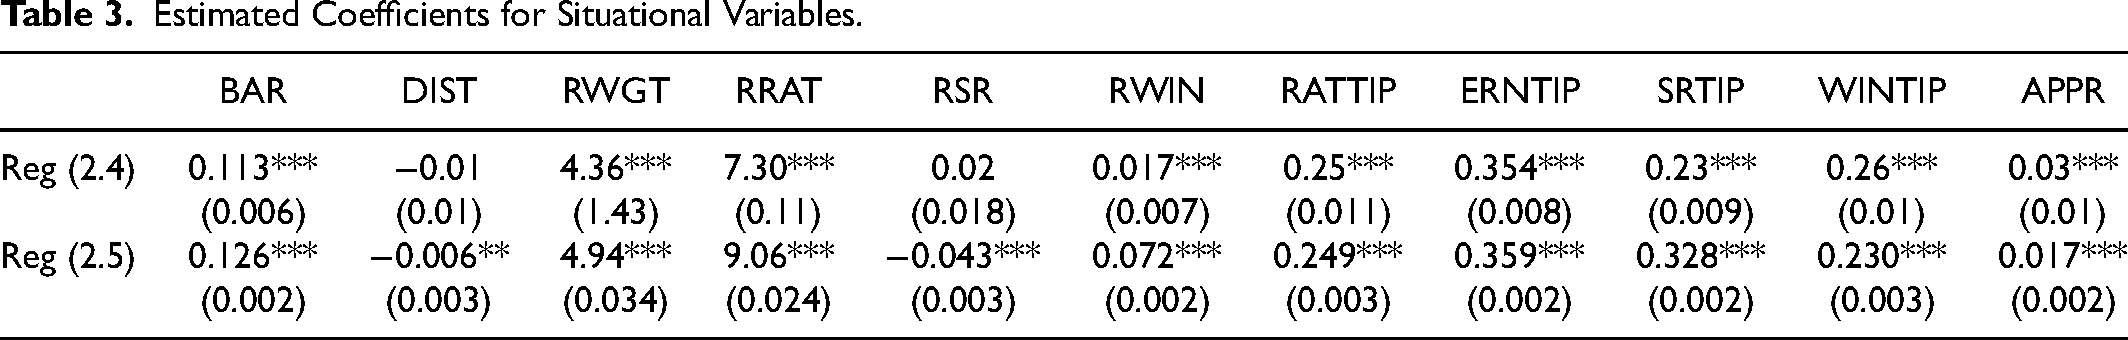
The estimated coefficients on the situational variables in equation (2.4), reported in row 3 of Table 3, indicate that the average jockey is more likely to win: from an inside barrier; if the horse is heavily handicapped, relatively highly rated or “tipped”; and if the jockey has a relatively greater winning experience, is “tipped” or is an apprentice. We discuss the situational variables in more detail when we consider the individual jockey results in the next section. Also reported in Table 3 are the estimated coefficients from regressing the market winning-odds ratio
Estimated Coefficients for Situational Variables.
To this point, we have assumed that the momentum stops when the sequence of wins stops (i.e., when the jockey loses on her next ride), although it may already have dissipated before then. But it has been argued that for some jockeys PM may also be affected by the end of the racing day, even if this occurs in the middle of a sequence of wins. As the literature reviewed above noted, an athlete's ability can vary from day-to-day for reasons unrelated to past performance. Thus, a sequence of wins spread over several racing days may have different momentum effects than a sequence of wins of the same length within a racing day. In order to allow for this possibility, we split our sequence variables into two categories—within-day sequences which are those corresponding to a prior sequence of i wins on the same day as race r
We then repeat the regressions estimated above including two sets of sequential variables so that equation (2) becomes equation (5) for example, with results shown in Table 4.
Within- and Across-Day Momentum Effects.
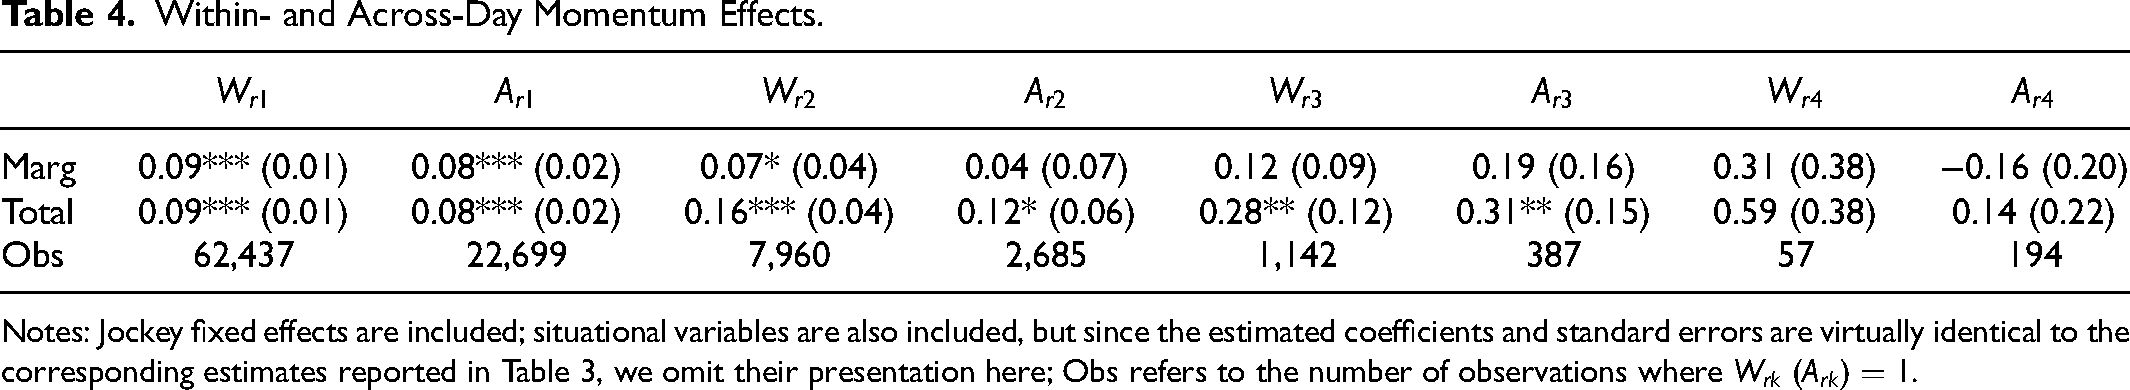
Notes: Jockey fixed effects are included; situational variables are also included, but since the estimated coefficients and standard errors are virtually identical to the corresponding estimates reported in Table 3, we omit their presentation here; Obs refers to the number of observations where
The results in Table 4 indicate that momentum effects are not confined to the racing day. But the within-day effects are likely to be more prevalent, as the number of across-day winning sequences of any given length is only about one-third of the corresponding within-day sequences. 27 The marginal (and total) effects of a win on the last ride on the same or a different race day are very similar in magnitude. The PM generated by a win on the last ride persists largely undiminished across race days. The marginal effects of further wins are only significant for a second win on the same day, however. Nonetheless, the intensity of those first wins is sufficiently strong to give positive and significant total effects up to three wins in a row for both types of sequences. We have no evidence of PM effects from a sequence of four wins of either type at the aggregate level.
How large are these momentum effects? Recall that we arbitrarily set the upper value of the winning odds ratio to unity when estimating the momentum coefficients. Had we chosen a value x% larger, then all the estimated coefficients would be x% larger in magnitude, though their signs and significance would be unchanged as noted earlier. While this arbitrariness in the absolute magnitudes of the coefficients implies that we cannot draw conclusions on the absolute intensity of the estimated momentum effects, we can draw conclusions concerning relative intensities, and we use this information in designing some of our wagering strategies below. Table 5 provides information on the intensity of PM of the kth win in the sequence, relative to the intensity of the first, precipitating, win.
Relative Intensities of Precipitating Wins in a Sequence.
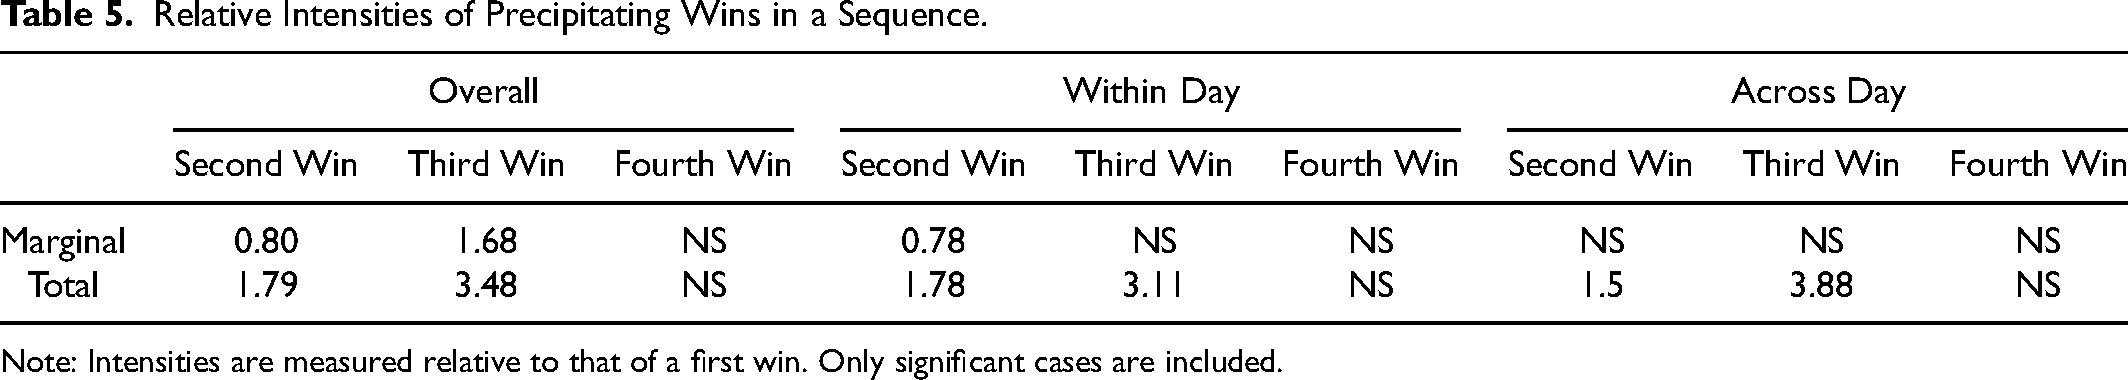
Note: Intensities are measured relative to that of a first win. Only significant cases are included.
In summary, if we assume that all jockeys have the same momentum characteristics, and control for other jockey characteristics through fixed effects, the regression results would lead us to conclude that the average jockey is momentum-prone and that this momentum is precipitated by the first win and is three consecutive wins in duration. The total intensity of the PM rises as the wins accumulate, before dissipating after the fourth win. These comments apply equally to both within-day and across-day sequences.
Individual Jockey Results
In this subsection, we discuss the results from estimating equation (5) for each individual jockey in our sample. As noted earlier, we limit
Situational Variables
Table 6 reports for each situational variable the percentage of jockeys with a significant coefficient. 28
Estimated Sign and Significance—Situational Variables.
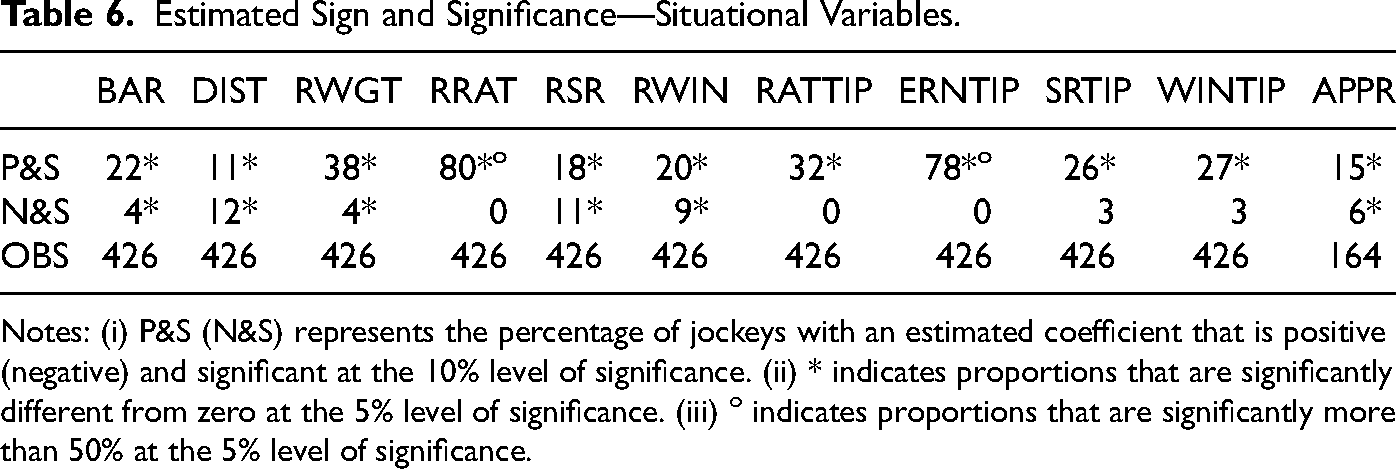
Notes: (i) P&S (N&S) represents the percentage of jockeys with an estimated coefficient that is positive (negative) and significant at the 10% level of significance. (ii) * indicates proportions that are significantly different from zero at the 5% level of significance. (iii) o indicates proportions that are significantly more than 50% at the 5% level of significance.
The estimates reveal that jockeys are not homogeneous in their responses to situational variables. We find significant positive and significant negative estimated coefficients for different jockeys for most of them. For the majority (74%) of jockeys, the barrier draw does not seem to significantly affect their chances of winning, although some (22%) are more likely to win if their mount draws an inside barrier and only a few (4%) have more success from the outside. The riding success of about the same share (76%) of jockeys is not significantly affected by the race distance. But distance does matter for the remaining 23% of jockeys, split about equally between those more likely to win on shorter races (11%) and those more likely to win on longer races (12%).
As noted, if the handicapping system worked perfectly, then the relative weights (RWGT) carried by the racing units should exactly offset the differences in horse ability, leaving the race outcomes to be determined by other factors, jockey ability in particular. For 58% of jockeys the relative weights assigned to their mounts have no significant effect on the jockey's odds of winning. However, our results suggest that riding a horse that has been assigned a higher weight does make a winning ride more likely for 38% of the jockeys (and less likely for only 4%). If relative weight is an indicator of horse quality, then other things being equal, these are the jockeys that should be riding the better horses.
Two of the measures of horse quality and success are found to have a positive and significant effect on the likelihood of success for the vast majority of jockeys. As Table 6 shows, riding a relatively highly rated horse (RRAT) or one of the top three earners in the race (ERNTIP), raises the chance of success for 80% and 78% of jockeys, respectively. At the same time, no jockey's prospects are being significantly harmed in these situations.
As previously noted, apprentice jockeys receive a weight allowance intended to compensate for their inexperience. The estimated coefficients on the apprentice (APR) variable suggest that, for the majority of jockeys (79%), their odds of winning are not significantly different before and after they complete their apprenticeships, other things equal. For 15% their likelihood of success is significantly higher post-apprenticeship and for 6% it is significantly lower.
Finally, we consider the indicators of jockey ability—strike rate (RSR, SRTIP) and winning experience (RWIN, WINTIP). Being tipped on either of these criteria improves their odds of winning for just over 26% of jockeys; but the odds of 71% are unaffected. Just being above average on these criteria has a significant positive effect for around 20% of jockeys, no significant effect for 70% and a significant negative effect for the remainder (10%). 29
Sequential Variables
As we shall see, we also find significant differences in the estimated effects of sequential variables across jockeys.
Marginal Effects
Table 7 gives the number of jockeys for which each of the marginal effects are statistically significant, along with the number for whom there are insufficient observations for the corresponding marginal effect to be estimated.
Estimated Marginal Effects by Wins in Sequence.
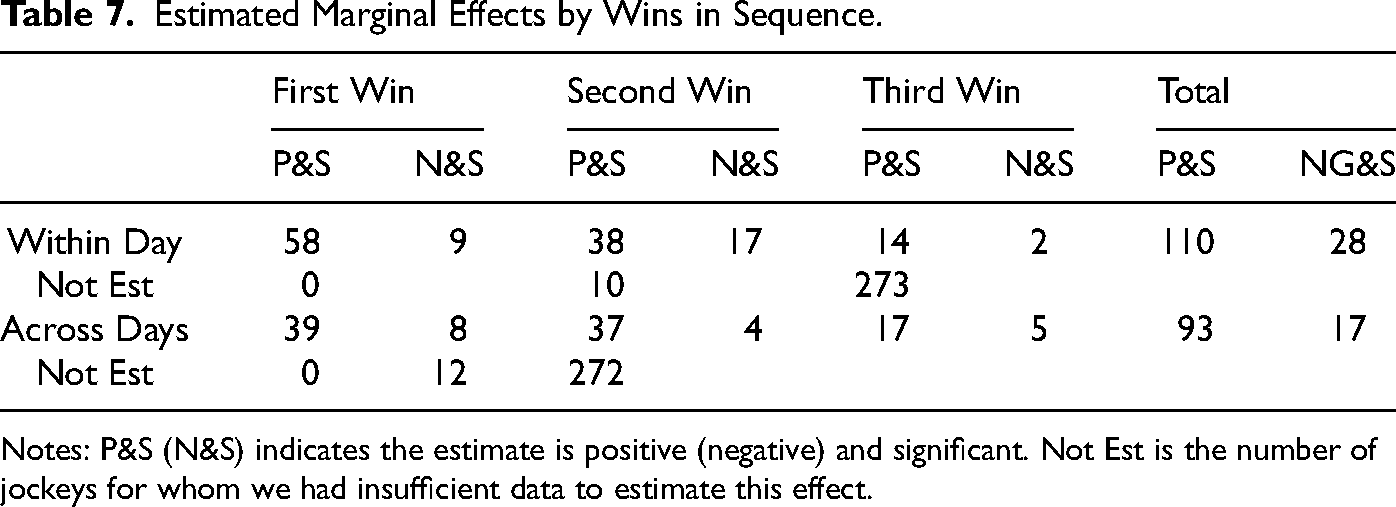
Notes: P&S (N&S) indicates the estimate is positive (negative) and significant. Not Est is the number of jockeys for whom we had insufficient data to estimate this effect.
From Table 7, we make the following observations. First, there are more statistically significant within (138) than across (110) day marginal effects. Second, a non-negligible minority of these estimates are negative (20% within, 15% across), indicating that some jockeys do tend to rest on their laurels after a sequence of wins. Third, while there are more significant within than across-day marginal effects overall, the main difference for the positive effects is on the first win and for the negative effects is on the second win.
The literature emphasizes that PM is temporary and can be fleeting (Iso-Ahola and Dotson, 2014). We can obtain some preliminary evidence on this when we compare the estimated marginal effects across a sequence of wins. Do subsequent wins tend to amplify or diminish the effects of previous wins? These comparisons are reported in Table 8.
Momentum Transition: Comparison of the Estimated Marginal Effects Across Wins in a Sequence.
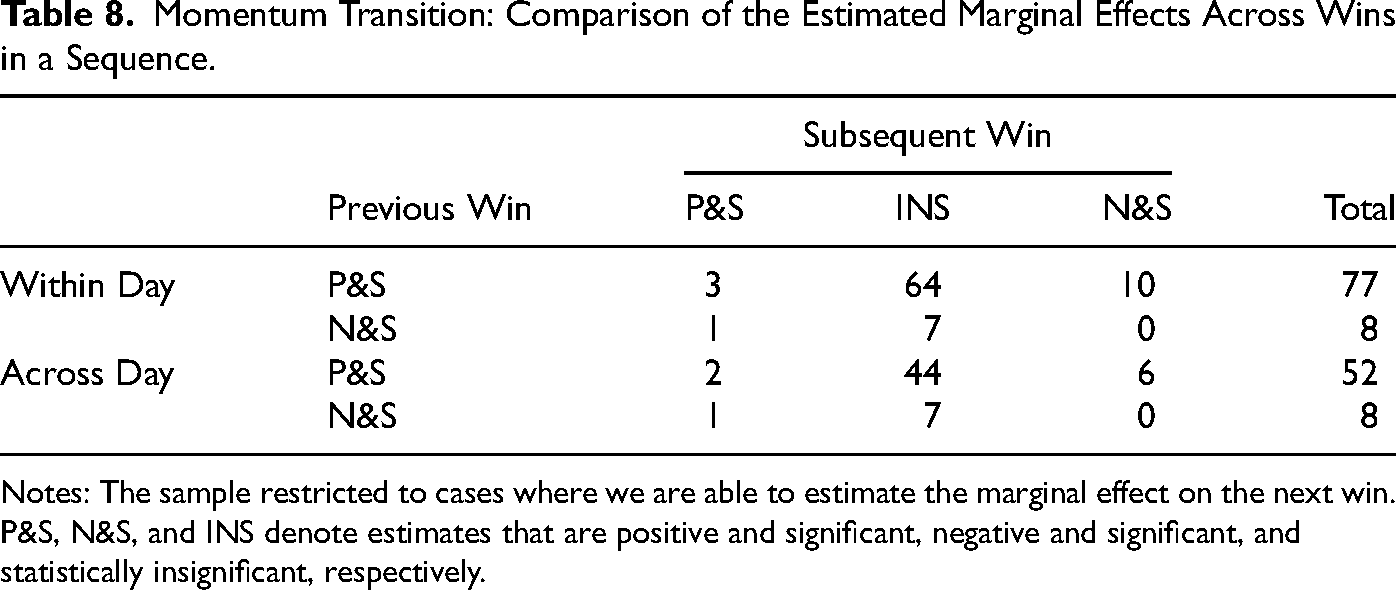
Notes: The sample restricted to cases where we are able to estimate the marginal effect on the next win. P&S, N&S, and INS denote estimates that are positive and significant, negative and significant, and statistically insignificant, respectively.
The numbers in Table 8 report for each win where the marginal effect is statistically significant whether the marginal effect on the next win is positive and significant, negative and significant or insignificant. Of the 77 cases where the estimated marginal effect on a win is positive and significant the estimated marginal effect on the next win in a within-day sequence is positive and significant in only 3 cases, is negative and significant in 10 cases and is insignificant in the remaining 64 cases. This turns out to be the common pattern. In the vast majority of cases (about 85% for both within- and across-day sequences), the subsequent marginal effect is insignificant rather than amplifying or diminishing, and in those few cases where either occurs, diminution is much more common than amplification, suggesting that PM is likely to be fleeting indeed. 30
Total Effects
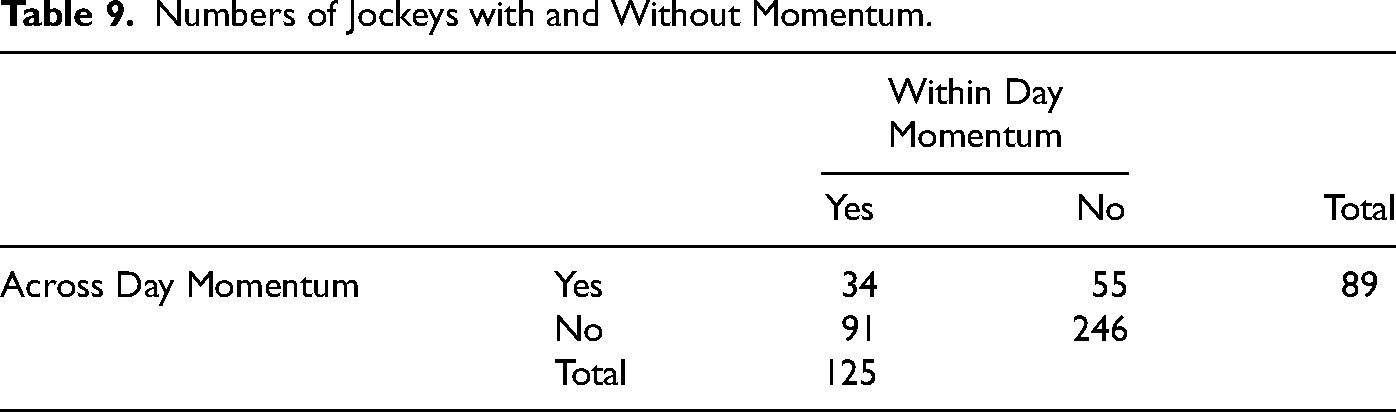
We next consider the total effects of a sequence of wins. While the marginal and total effects of the precipitating win are the same, the total effect of the next win in the sequence is equal to the sum of the marginal effects of the precipitating and subsequent wins, and could be positive or negative, and significant or insignificant depending on the relative magnitudes of its two components. The total effects indicate whether PM is present and the number of consecutive wins with total effects of the same sign and significance indicate the duration of the PM. The results for the presence of PM are reported in Table 9, while the details of the precipitating win and the duration of PM are provided in Table 10.
Numbers of Jockeys with and Without Momentum.
Precipitating Win and Duration of Momentum.
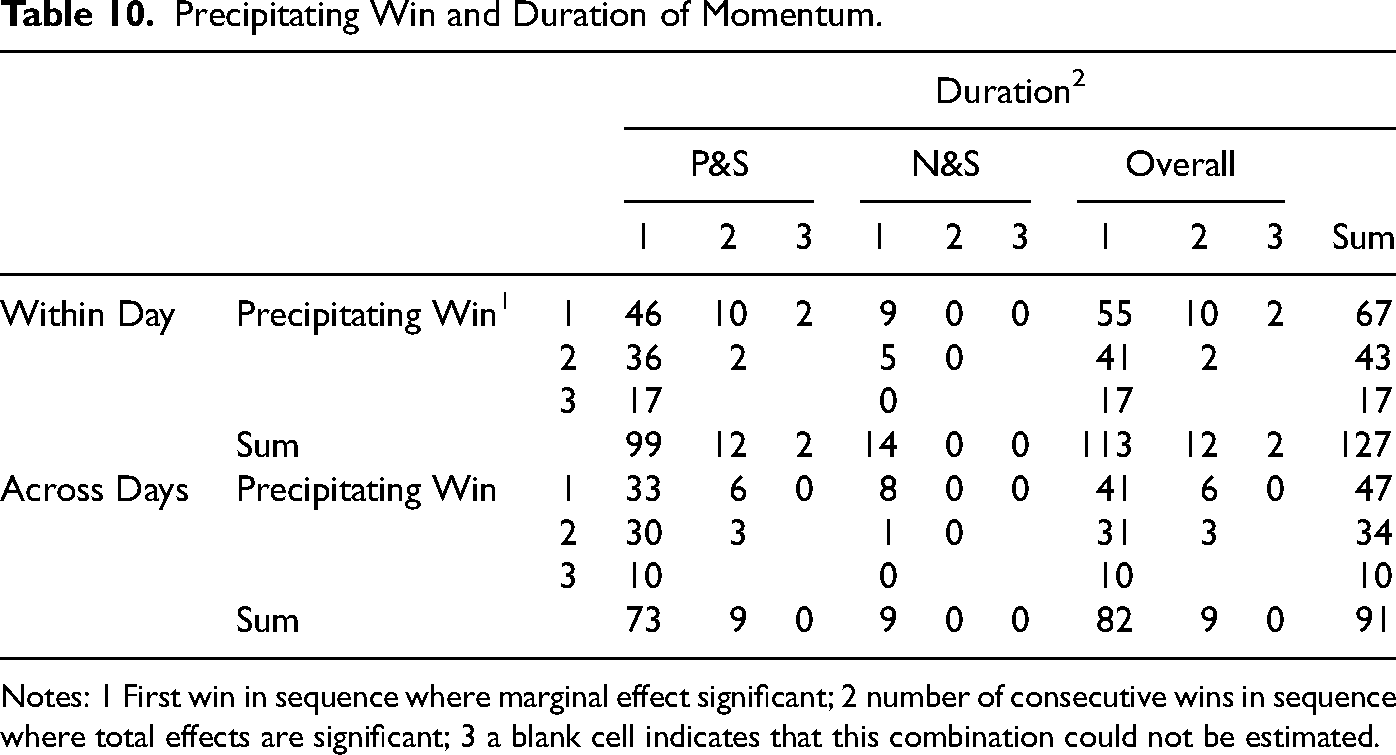
Notes: 1 First win in sequence where marginal effect significant; 2 number of consecutive wins in sequence where total effects are significant; 3 a blank cell indicates that this combination could not be estimated.
Table 9 reveals that 246 of 426 jockeys (58%) show no evidence of PM. Of the remaining 180, 91 (50%) show only within-day PM; 55 (31%) show only across-day PM; and 34 (20%) show both. The 34 jockeys that show both within- and across-day PM are split roughly equally between those for whom both types have the same precipitating win and duration and those for whom these characteristics are different. Within-day PM is more common than across-day PM (125 versus 89 jockeys), but both are significant.
Several conclusions can be drawn from the results summarized in Table 10. 31 First, within-day effects are more common than across-day effects at (almost) all win-duration combinations. Second, P&S effects are more common than N&S at (almost) all win-duration combinations, both within and across days. The majority of momentum-prone jockeys look to rather than rest on their laurels. Third, PM is more often precipitated by the first win in the sequence than the second win, though this result is more pronounced within than across days. Finally, in the vast majority of cases, the duration of PM is only a single ride (89% within; 90% across). This confirms that, for those jockeys who do show evidence of PM, momentum is fleeting.
Finally, we consider the relative intensity (or strength) of these PM estimates. Data on the estimated coefficients of the sequential variables are presented in Table 11. Recall that only the relative magnitudes of these numbers are meaningful, representing the relative strengths of the intensity of PM.
Intensity of PM.
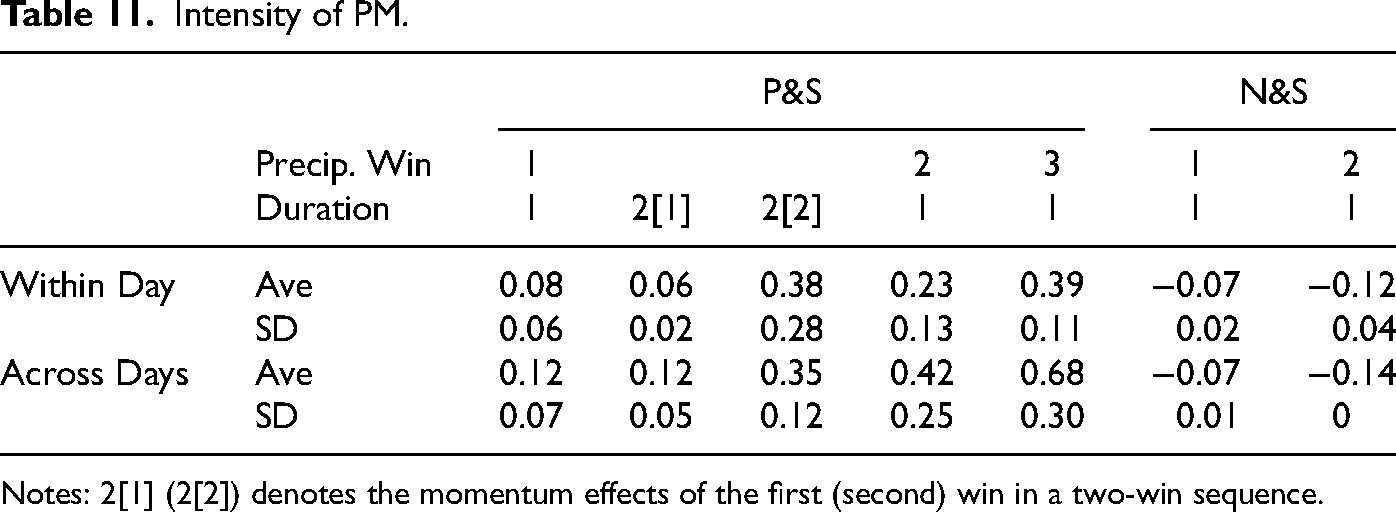
Notes: 2[1] (2[2]) denotes the momentum effects of the first (second) win in a two-win sequence.
For all precipitating win and duration combinations, the across-day average intensity is higher than the corresponding within-day average intensity. 32 While within-day momentum tends to be more common, it also tends to be a relatively weaker in intensity than across-day momentum. In both cases, the later the precipitating win in the sequence the stronger the intensity of the momentum it generates.
Prizemoney, Wagering and Jockey Momentum Characteristics
We begin this section by relating our estimated jockey momentum characteristics (presence of momentum, precipitating win, duration, and relative intensity of momentum) to other known jockey characteristics (age, gender, and ability). This is largely an exploratory exercise as we have no a priori hypotheses about the relationship between momentum and its characteristics with a jockey's age and gender, although WFR did find that HH appeared to be positively related to a jockey's experience (number of rides) and ability (strike rate), but to be unrelated to gender. While there is no obvious link between the presence of PM and a jockey's ability, the latter may have a role to play in the characteristics of the former when it does occur. Our earlier discussion of the frequency of winning and PM, suggested that momentum-prone jockeys with a higher strike rate may be more likely to require a longer sequence of wins to act as a precipitating event.
In regressions (1) and (2) of Table 12, we test whether any or all of our three jockey characteristics can explain whether a jockey is momentum-prone. The coefficient signs suggest PM is more likely if a jockey is older, male, and more able—but since none of these coefficients are statistically significant no firm conclusions should be drawn from this. This lack of statistical significance also characterizes our regressions explaining the precipitating win ((3) and (4)) and the duration ((5) and (6)) of momentum. The estimated coefficient signs vary with the type of momentum and estimation method. There is no evidence here that, within the group of momentum-prone jockeys, more able jockeys require a longer sequence of wins before PM is precipitated. However, we do find statistically significant evidence relating the relative intensity of PM to jockey ability. It seems that, among momentum-prone jockeys, the more able the jockey the lower the relative intensity of the momentum generated.
Momentum and Jockey Characteristic Regressions.
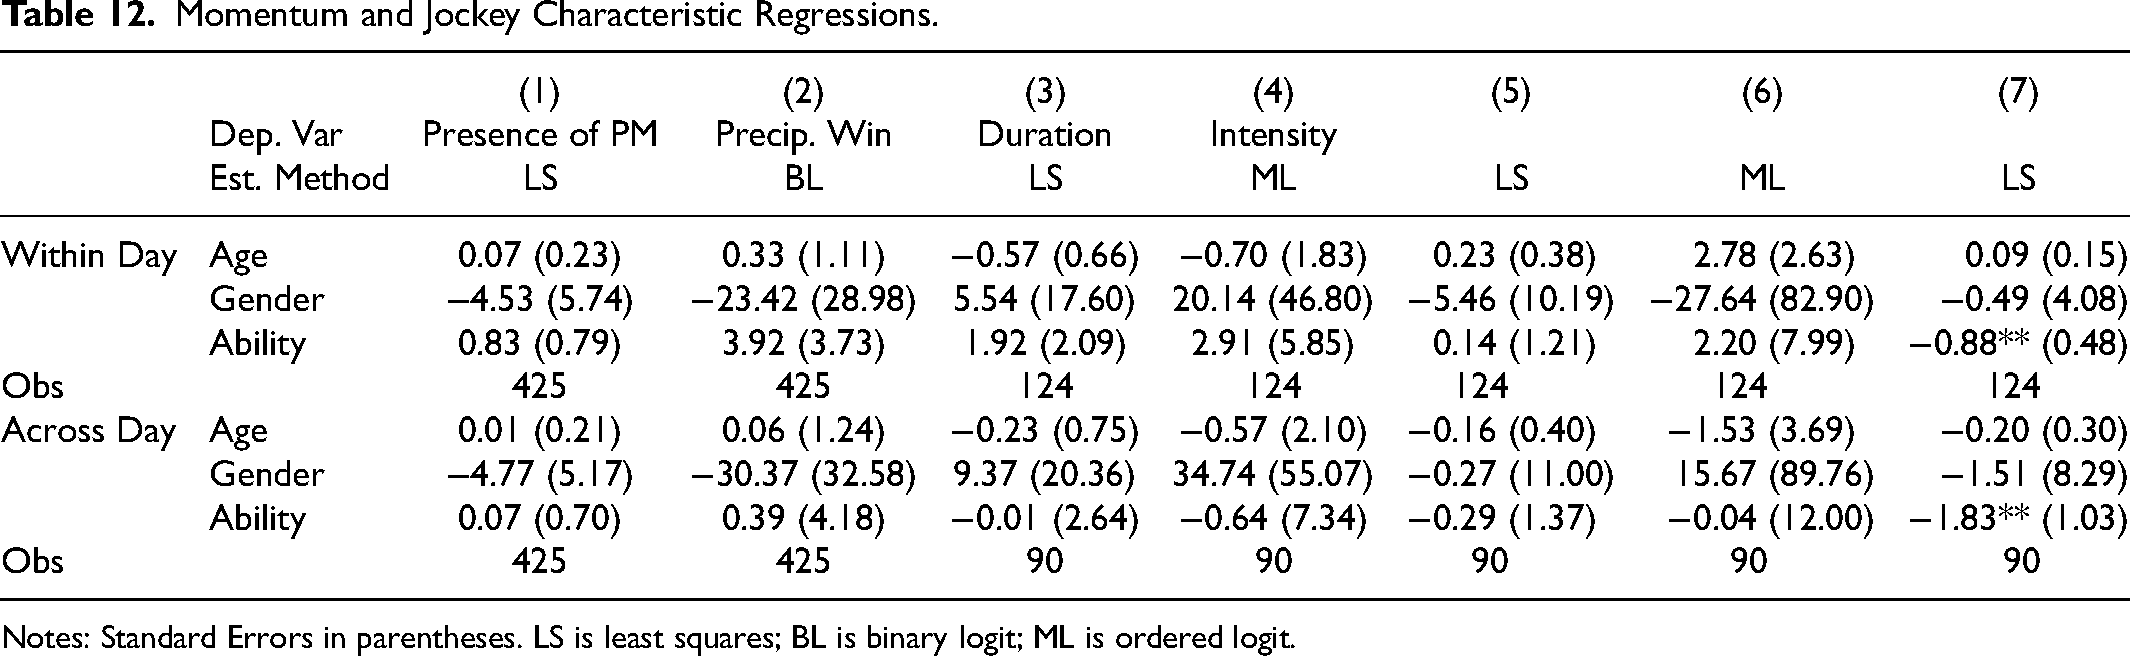
Notes: Standard Errors in parentheses. LS is least squares; BL is binary logit; ML is ordered logit.
What role, if any, does PM play in a jockey's financial impact on the racing industry? This impact occurs when a racing combination wins or places in a race and is felt through two channels. First, a prize money channel, where a successful result earns prize money of which 5% (10%) is paid to the jockey (trainer) under the Australian standard rates and the remainder goes to the horse's owners. Second, a wagering channel, where a successful result generates a “dividend” to those “investors” who backed the racing unit. We begin by considering the prize money channel.
Consider two jockeys with equal riding records in terms of wins and rides, and who therefore have the same strike rate, but who differ in that one is momentum-prone while the other is not. Then the only difference in their riding records will be that the wins of the momentum-prone jockey will be more clustered—i.e., the momentum-prone jockey is likely to have a larger number of winning sequences of any length. 33 At first glance, this would appear to have no obvious implications for the relative prize money earned by these two jockeys. There is no apparent reason why clustered wins should pay lower or higher prize money on average than randomly scattered wins. Our null hypothesis therefore is that PM has no significant effect on the jockey prize money.
We present the results of testing this hypothesis in Table 13, using data of jockey (lifetime) wins, rides, and prize money along with our estimated momentum characteristics. Other things being equal, we expect more able jockeys, as measured by their strike rates, to achieve higher prize money per ride. But we do need to qualify this somewhat. Not all races pay the same prize money and not all jockeys have the same mixture of race rides. The premier thoroughbred races in Australia, about 3% of the total, are categorized into four Groups (G1, G2, G3, and Listed) which differ by thoroughbred entry requirements and prize money (www.progroupracingcom.au). 34 For this reason, we include the share of wins in group and listed races along with overall strike rate and momentum characteristics in our prize money regressions. We expect both the winning strike rate (LSR) and group and listed win share (GLWS) to be positively related to jockey prize money.
Momentum and Prize Money.
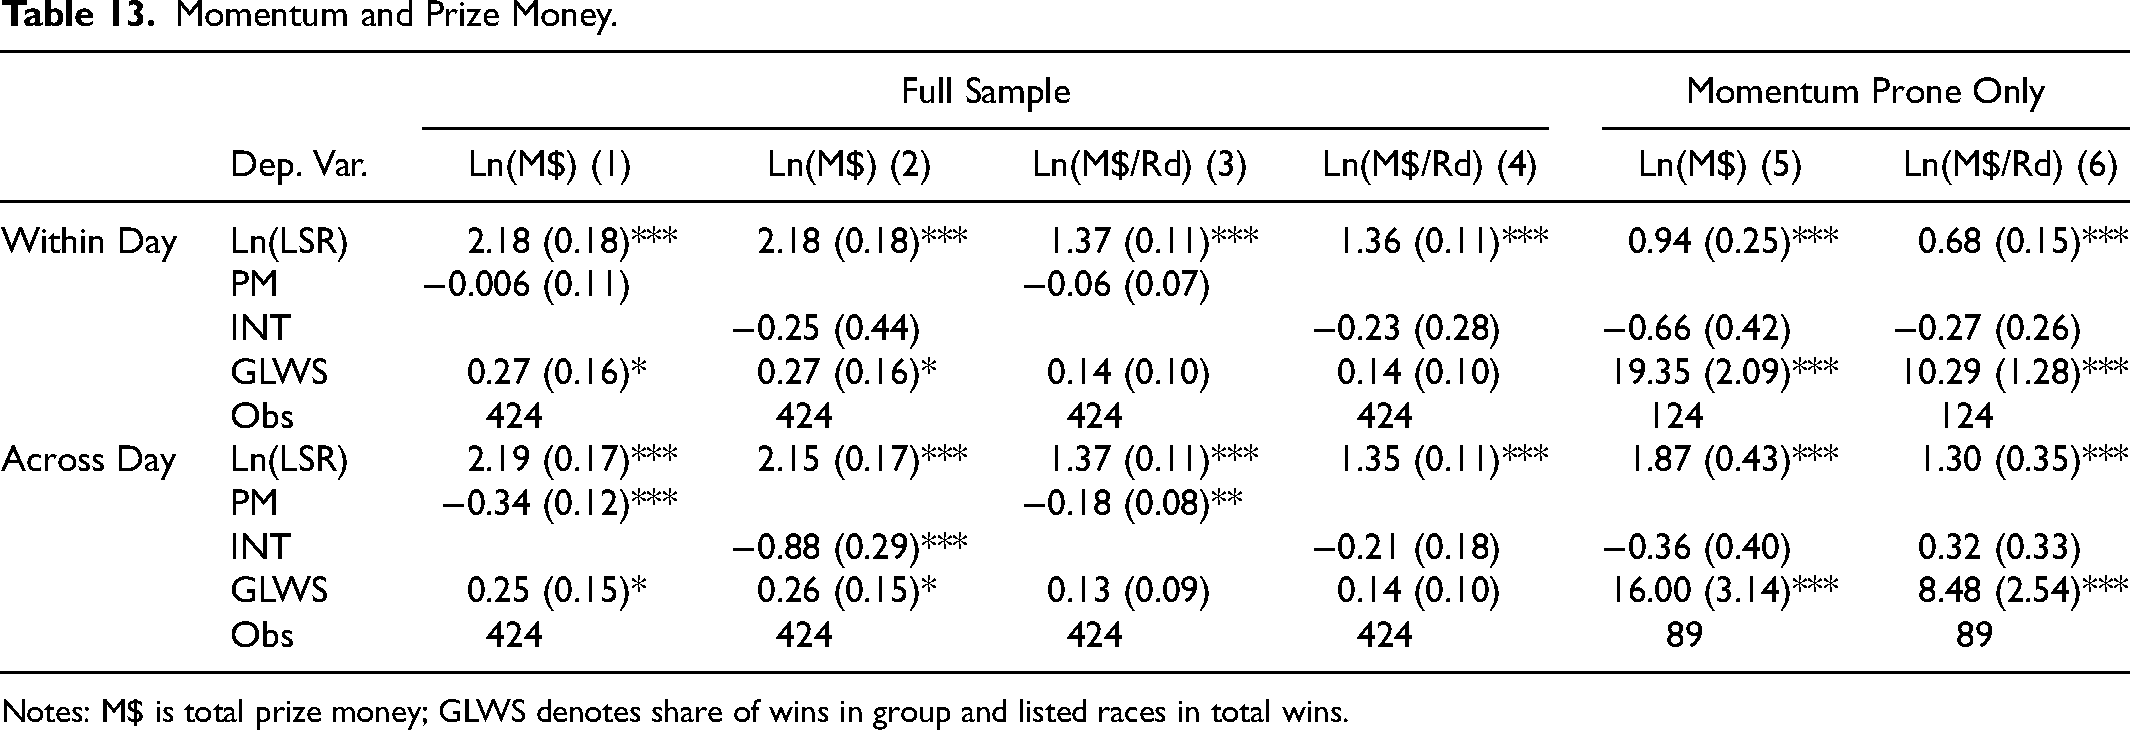
Notes: M$ is total prize money; GLWS denotes share of wins in group and listed races in total wins.
Regressions (1) to (4) involve our full sample, while regressions (5) and (6) are confined to the sample of momentum-prone jockeys. Two measures of prize money are used: total career prize money (as of July 2022) M$; and total prize money per ride M$/Rd. Our results on the full sample of jockeys show that prize money, measured either way, is not significantly affected by either the presence of within-day momentum or its intensity. The presence of across-day momentum, however, is estimated to have a significant negative effect on the prize money, as does its intensity, but only for the total prize money. Since these regressions control the jockey strike rate and win composition, the implication is that having wins clustered within a race day has no significant effect on the prize money, but having wins clustered across race days has a significant negative effect.
Recalling that our momentum duration is primarily one or two consecutive winning rides, an across-day winning sequence will then typically involve a win on one of the later rides on the previous day combined with a win on one of the earlier rides today. If races are late and early, a race card typically involves lower prize money than the average race, this would explain our result. When we restrict the sample to the momentum-prone jockeys, we find no evidence that more intense within-day or across-day momentum has any effect on the prize money.
We approach the wagering channel in two ways. First, we perform a similar regression analysis examining the effects of momentum on a jockey's return on investment (ROI)—i.e., the average return from a $1 bet on each ride by this jockey. The results are shown in Table 14. We find little evidence of significant momentum effects on a jockey's ROI. There are no significant estimates on within-day momentum and the presence of across-day momentum. The intensity of across-day momentum has a significant (at 10%) negative effect on the ROI in the full sample, but no significant effect within the momentum-prone sample. Interestingly the share of group and listed race wins in total wins has a significant negative effect on ROI, which suggests that bettors following a jockey are better off wagering on that jockey's rides in other races (though they still lose on average), other things equal.
Momentum and Wagering: Blanket Bets.
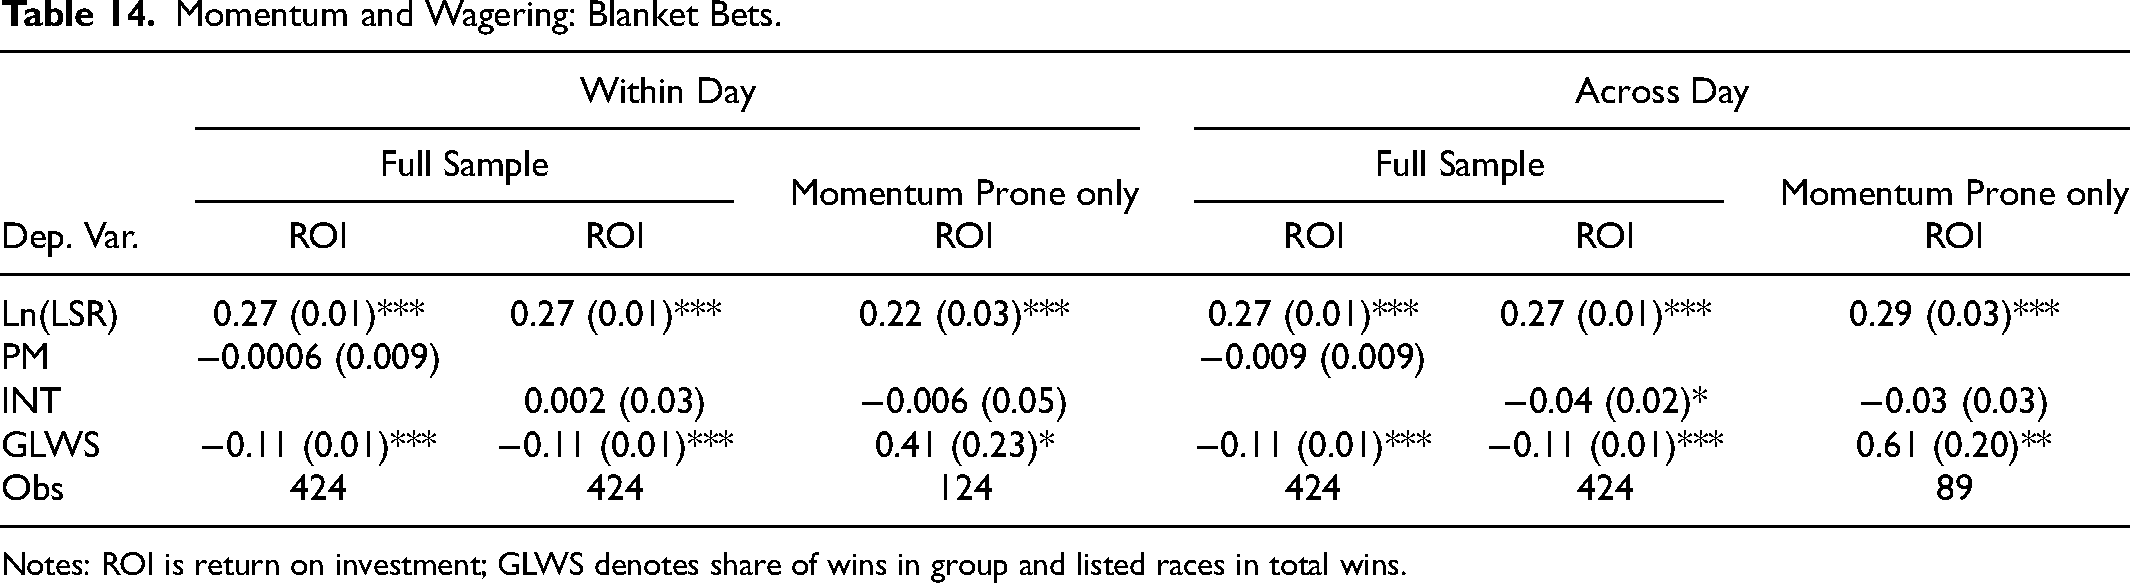
Notes: ROI is return on investment; GLWS denotes share of wins in group and listed races in total wins.
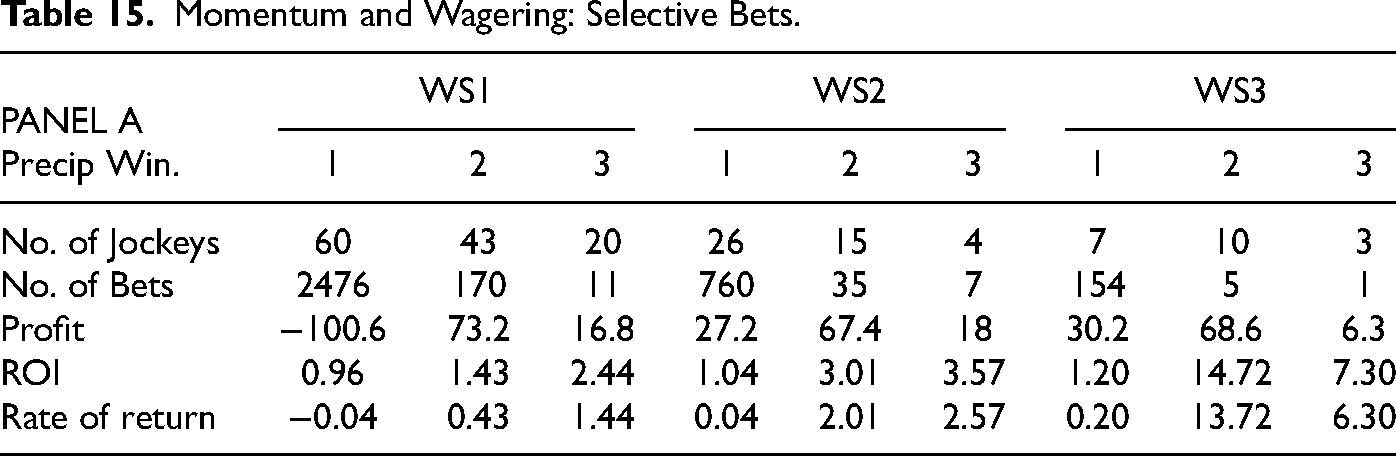
Our second approach to investigating the wagering channel is more selective in that we bet only on momentum-prone jockeys when they are estimated to be in a momentum state. In order to apply our wagering strategy to different races from those on which PM was estimated, we split our sample, re-estimating our momentum effects using only the first five years of our data (2011–2015), leaving the final year (2016) on which to apply our wagering strategy. This gave us as large a sample as possible of the longer sequences to identify the PM-prone jockeys, their precipitating win and the intensity of the PM generated by that win. Since we also wish to keep the wagering strategy reasonably simple to implement, we ignore the distinction between within- and across-day PM in these momentum re-estimations.
Our first wagering strategy (WS1) is to place a $1 bet to win on the next ride 35 following a precipitating win for each momentum-prone-jockey. The results are shown in Table 15. Sixty jockeys were estimated to have PM precipitated by a “first” win, which gave rise to 2,476 bets in 2016 yielding a net loss of $100.60 or a −4% rate of return. It seems that the betting market was not offering profit opportunities in this case. For comparison purposes, we also report, in Table 16, the returns from applying 2,000 replications of the same wagering strategy (i.e., betting $1 to win on the next ride following a win) to randomly drawn samples of 60 jockeys from the pool of non-momentum-prone jockeys. The rates of return on these samples ranged from −44% to +7%, with a mean of −20%. Although our wagering strategy based on PM does not return a profit in this case, it still appears to perform better than the expected return on a comparable strategy discounting PM altogether. When we apply WS1 to jockeys with PM precipitated by later wins in the sequence, we have better success. For PM precipitated by the second (or third) win there are 43 (20) jockeys to consider, leading to 170 (11) bets yielding a rate of return of +43% (+144%). This compares very favorably to the mean return on the corresponding control in Table 16 of −14% (−10%), although it is within its range of −75% to +276% (−100% to +373%).
Momentum and Wagering: Selective Bets.
Controls.
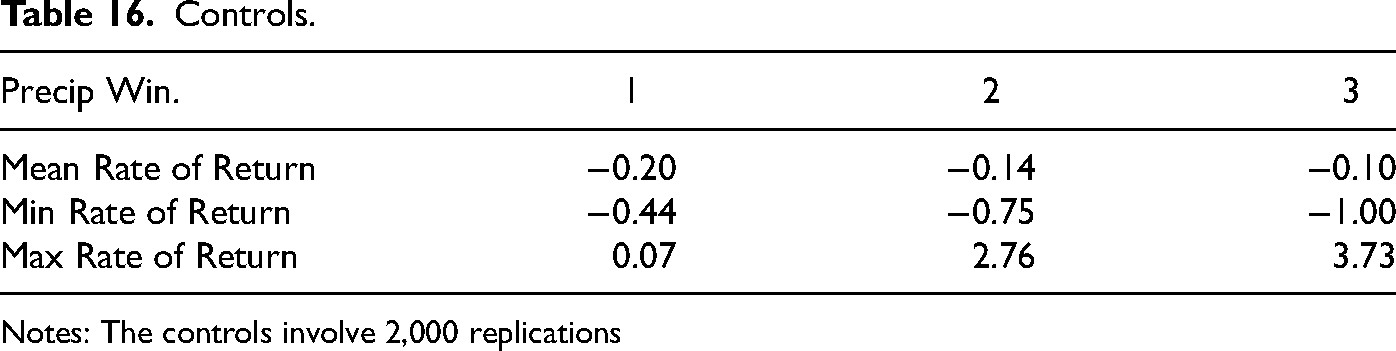
Notes: The controls involve 2,000 replications
The intensity of the PM was then used to construct two variations of this simple strategy, by imposing (relative) thresholds on the intensity of the jockey PM. In WS2 momentum-prone jockeys are only included if the intensity of their momentum is estimated to be above the average for that precipitating event. In WS3 they are required to be more than one standard deviation above that average. The results are also reported in Table 15. For each precipitating win, the numbers of jockeys and bets fall but the average rates of return increase. The latter are positive in all cases.
Overall, we conclude that the betting market did not seem to be fully aware of the effects of PM on the odds of these jockeys winning once a precipitating win had occurred, allowing a positive profit from appropriate betting strategies. 36
Conclusions
We used data on the riding outcomes for 426 jockeys drawn from horse races held in Australia over the period of 2011 to 2016 to investigate the hypothesis that a sequence of winning rides for a jockey can initiate psychological momentum that makes a win on the next ride more likely, other things equal. To do this, we estimated the effects of a past sequence of wins on the odds of a jockey winning on her next ride, taking into account situational variables intended to capture the quality of the horse and jockey (relative to the others in the field) and aspects of the race itself. We identified and estimated the marginal effect of an additional win (in a sequence) and the total effect of a sequence of wins on the likelihood of a jockey winning on her next ride. The estimated marginal effect indicated which win in the sequence, if any, precipitated PM, while the estimated total effect indicated its duration. Because of the potential for momentum effects to be confounded by day-to-day fluctuations in jockey ability that have nothing to do with recent performance, we separated our winning sequences into within-day sequences (those that occur wholly within a single race day) and across-day sequences (those that occur over more than one day).
We began our investigation using data aggregated across individual jockeys. In doing so we assumed that all jockeys had the same momentum characteristics and controlled for differences in other jockey characteristics (such as riding ability) through jockey-fixed effects. The results indicated that the average jockey was momentum-prone and that this momentum was precipitated by the first win in a sequence and was three wins in duration. The intensity of the PM rose as the wins accumulated, before dissipating after the fourth win. These momentum characteristics applied equally to both within-day and across-day sequences. These aggregated results may very well be the source of the broad public impression that jockeys are momentum-prone.
But it is at the individual jockey level that PM occurs, and that is where we next applied our analysis. The results revealed that jockeys are not homogeneous in their responses to situational variables. We find significant positive and significant negative estimated coefficients for different jockeys for most of them. Nor are they homogeneous in their momentum characteristics, indicating that conclusions drawn from the aggregated data could be quite misleading if applied to individual jockeys.
We found that 58% of jockeys showed no evidence of PM; 21% showed only within-day PM; 13% only across-day PM; and 8% showed both. Among the momentum-prone jockeys, more are inclined to look to their laurels than to rest on them at (almost) all win-duration combinations, both within and across days. Within-day PM was more common than across-day PM at (almost) all win-duration combinations. PM was more often precipitated by the first than the second (or third) win in the sequence, though this result was more pronounced within than across days. Finally, the duration of PM was only a single ride for the vast majority (90%) of momentum-prone jockeys. PM is as fleeting in thoroughbred racing as it is in other sports.
Given these results and the similar findings in WFR, it seems reasonable to conclude that PM is present, in some form or another, for a significant minority (about 40%) of the pool of Australian jockeys. This is not surprising. It is not difficult to imagine that for each jockey there is some event that would precipitate the heightened confidence etc. ascribed to PM, leading that jockey to bring home an otherwise unlikely winner. A win or a sequence of wins is an obvious candidate, as appears to be the case for many jockeys. But for others it might be more nuanced, say a win in a major race or a win on a longshot, and such cases may not have been picked up by our analysis. From this perspective, we are likely to be underreporting the presence of PM.
Since the dependent variable in our regressions was the log of the winning odds ratio, our estimates captured the effects of each win in the sequence on these odds and allowed us to interpret the coefficients as an indicator of the (relative) intensity of the PM. We found that, for all precipitating win and duration combinations, the across-day average intensity was higher than the corresponding within-day average intensity. In both cases, the later the precipitating win in the sequence the stronger the intensity of the momentum it generated.
When we related momentum characteristics to other observable jockey characteristics, we found no relation between momentum-proneness and a jockey's age or gender. Nor was there evidence that, within the group of momentum-prone jockeys, more able jockeys required a longer sequence of wins before PM was precipitated. However, we do find statistically significant evidence relating the (relative) intensity of PM to the jockey ability. It seems that, among momentum-prone jockeys, the more able the jockey the lower the intensity of the momentum generated. An unresolved issue is whether momentum proneness, when it occurs, is a permanent or temporary jockey characteristic. While our cross-section regressions indicated that PM is not confined to younger or older jockeys, it might still be the case that momentum proneness is related to age and experience for individual jockeys. However, investigating this would require the lifetime riding histories, complete with a full set of situational variables, for a reasonable sample of jockeys.
Finally, we looked at the financial implications of PM. Controlling for jockey strike rate and win composition, we found that jockey prize money was not significantly affected by either the presence of within-day momentum or its intensity. The presence and intensity of across-day momentum were estimated to have a significant negative effect on prize money, however. The implication was that having wins clustered within a race day has no significant effect on prize money, but having wins clustered across race days has a significant negative effect. We speculated that this may be related to the typical pattern of race prize money on the day's racing card.
We then asked whether momentum effects were both recognized and accounted for in the betting market. We found little evidence of significant momentum effects on a jockey's return on investment (the return from a $1 bet on every ride by a jockey). In contrast, more selective bets making use of our PM estimates did produce a significant (hypothetical) positive return. Overall, we concluded that the betting market was not fully aware of the effects of PM on the odds of these jockeys winning once a precipitating win had occurred, allowing a positive profit from appropriate betting strategies. These opportunities tend to be very infrequent, however, and possibly easily overlooked.
Supplemental Material
sj-docx-1-jse-10.1177_15270025241282315 - Supplemental material for Do Jockeys “Look to” or “Rest on” Their Laurels After a Sequence of Winning Rides?
Supplemental material, sj-docx-1-jse-10.1177_15270025241282315 for Do Jockeys “Look to” or “Rest on” Their Laurels After a Sequence of Winning Rides? by Rod Falvey, Gulasekaran Rajaguru and Robert Wrathall in Journal of Sports Economics
Footnotes
Acknowledgements
We thank two reviewers, Sukanto Bhattacharya, Roland Cheo, Gamini Pramachandra, and the participants of the Australian National University Research Series for their comments; and Mark Johnman for his valuable assistance in data collection.
Declaration of Conflicting Interests
The authors declared no potential conflicts of interest with respect to the research, authorship, and/or publication of this article.
Funding
The authors received no financial support for the research, authorship, and/or publication of this article.
Supplemental Material
Supplemental material for this article is available online.
Notes
Author Biographies
Appendix
To construct
Let
Then
Where
References
Supplementary Material
Please find the following supplemental material available below.
For Open Access articles published under a Creative Commons License, all supplemental material carries the same license as the article it is associated with.
For non-Open Access articles published, all supplemental material carries a non-exclusive license, and permission requests for re-use of supplemental material or any part of supplemental material shall be sent directly to the copyright owner as specified in the copyright notice associated with the article.