
Abstract
In the National Football League (NFL) annual draft, teams take turns selecting entering players. The draft is a market mechanism designed to promote competitive balance as the NFL assigns draft positions to teams in reverse order relative to last season's performance. Teams frequently trade draft picks for other picks and/or players. We use several market valuations of draft picks to define original draft currency as the total value of draft picks available before any trades and final draft currency as the total value of picks used after all trades. For the 2002–2021 period, we find that original draft currency does not affect the probability of reaching the playoffs, but final draft currency does. Usage of outdated market valuations of draft picks by most teams can help explain how the best team has used draft-pick trades to remain among the strongest teams over two decades thereby perpetuating competitive imbalance.
Keywords
Introduction
The Chart is an example of an especially interesting social phenomenon in which a bias or wrong belief becomes conventional wisdom and then, eventually, a norm. … the Chart appears both a symptom of biased judgment and also a self-perpetuating cause.
–Massey and Thaler (2013, p.1493)
The National Football League (NFL) has substantial economic impact. For example, by 2019 the NFL had grown to a $15 billion business generating more than $3.4 billion in operating income. The attendance for a single regular season game averages more than 65,000 fans. A Thursday night football game attracts over 15 million viewers, whereas the Super Bowl (the final game of the season) attracts as many as 100 million viewers. The annual value of TV broadcasting rights is estimated at $5.9 billion (Statista, 2022).
Competitive excitement, in particular the uncertainty of the outcome of a game and the uncertainty of a season, attracts fans (Fort, 2012). Competitive balance, meaning teams of equal strength, boosts outcome uncertainty. In 1936, the NFL instituted the draft for entering players (“rookies”) as a market mechanism to promote competitive balance. Other North American team sport leagues followed the NFL and based their draft systems on the NFL draft model (Maxcy, 2012). Currently, the NFL consists of 32 teams. After the conclusion of a season, the NFL creates a draft order assigning positions to teams in reverse order relative to last season's performance. The team with the worst win-loss record gets the number one position, and the Super Bowl champion gets the thirty-second position. The draft proceeds through seven rounds. In each round, each team owns the right to pick one player at their assigned position. The idea is to promote competitive balance as the worst team can pick the best available player. Drafted players can only sign a rookie contract (currently for four years) with the team that selected them. Nowadays, rookie contracts follow a rookie wage scale tied to their draft position. After a rookie contract expires, the player becomes a free agent and can sign with any team. In addition to 32 regular picks in each of the seven rounds, the NFL awards about 32 “compensatory picks” to teams based on players lost and gained in free agency. Compensatory picks are inserted in the draft at the end of rounds three through seven. Thus, the draft has about 256 picks. Teams can trade their assigned draft picks for other picks and/or players. From 2002 to 2021, only 61% of all draft picks were used by teams according to their assigned draft position. For the remaining 39% of draft picks, a different team selected a player because the picks were traded.
The NFL draft's goal of promoting competitive balance remains empirically ambiguous (Maxcy, 2012). Few prior papers have studied whether the draft improves competitive balance. Grier and Tollison (1994) find that a later average draft position in the last 5, 4, and 3 years has a negative relation with a team's win percentage controlling for last year's win percentage. While this finding is promising, there are several issues with the research design. First, win percentage is a problematic dependent variable as teams have different schedules facing opponents with different strengths. The standings at the end of the regular season determine which teams advance to the playoffs—the single-elimination tournament that culminates with the Super Bowl to determine the NFL champion. Teams might temporarily improve win percentage yet still miss the playoffs. Second, there might be a performance spillover effect longer than one year ago. Third, by design the model can only pick up a draft effect 5, 4, and 3 years ago and assumes the effect of each of these three years is equal. Fourth, using draft position assumes that the value of draft picks follows a linear decreasing function of draft position. Fifth, the model only considers original draft position ignoring draft-pick trades. We address all five issues in this paper.
Caporale and Collier (2015) build on Grier and Tollison (1994). The authors find that a later average draft position over the last five years has a negative relation with a team's win percentage controlling for last year's win percentage and strength of schedule computed by looking at a team's opponents win percentages from last year. The same concerns apply for win percentage as a dependent variable, only considering a performance spillover effect one year back, assuming draft-pick value follows a linear decreasing function of draft position, and only considering original draft position ignoring draft-pick trades. The different draft position variable (including all five last years) still assumes equal contribution from each draft year. Caporale and Collier (2015) do not find a significant effect for strength of schedule. Measuring opponents’ strength with last year's performance (as opposed to this year's performance) could explain the insignificance finding. In our analysis, we base strength of schedule on the current year.
In related work, Fort and Maxcy (2003) review prior literature on competitive balance. Papers have used measures summarizing competitive balance with a single number for a sports league in a single season such as the standard deviation of win percentages. For example, Larsen et al. (2006) find that free agency and the salary cap in the NFL promote competitive balance measured by Gini coefficients and deviations of the Herfindahl–Hirschman Index. With a different approach, Lee (2010) studies the impact of the 1993 collective bargaining agreement (CBA) between the NFL owners and players and competitive balance. In regressions for team win percentage, the author finds that the estimated coefficient for lagged win percentage is lower after the 1993 CBA. As we study the impact of the draft on competitive balance during the 2002–2021 period, our dataset naturally controls for the introduction of free agency, the salary cap, and the CBA.
In this paper, we empirically investigate whether the NFL draft promotes competitive balance. First, we review market valuations of NFL draft picks. Market valuations fall in three buckets: industry practice, empirical estimations based on observed trades, and evaluations of players picked at different draft positions. For each valuation scheme, we define (i) original draft currency as the total value of picks available before any draft trades, and (ii) final draft currency as the total value of picks used after all draft trades. To assess whether the draft promotes competitive balance, we address the following questions. Does higher original draft currency (before trading picks) lead to increased probability of reaching the playoffs? If so, after how many years? How does final draft currency (after trading picks) affect the probability of reaching the playoffs? What market valuation of draft picks best captures any reduction in competitive imbalance?
Market Value for NFL Draft Picks
In 1991, Mike McCoy, a petroleum engineer and minority owner of the Dallas Cowboys, used a subset of draft-pick trades from 1987 to 1990 to assign values to each draft pick (Massey & Thaler, 2013). McCoy's objective was to characterize past trading behavior rather than create a price list. However, McCoy's draft pick value chart (PVC), or “the Chart,” would revolutionize the NFL draft. Initially, owner Jerry Jones and coach Jimmy Johnson used the PVC extensively in the early 1990s, explaining why the PVC is frequently misattributed to Jimmy Johnson (Fortier, 2022). Subsequently, personnel from the Dallas Cowboys moved to other teams taking the PVC with them. Soon the PVC became the norm for negotiating draft-pick trades. In 2004, ESPN reported that “Before NFL general managers consider trading draft picks, they more often than not consult this value chart. The chart assigns each pick in the draft a point value, giving GMs an easy reference to compare the relative value of draft picks in different rounds.” (ESPN Insider, 2004). In Figure 1, the PVC graph is McCoy's chart rescaled relative to the number 1 pick.
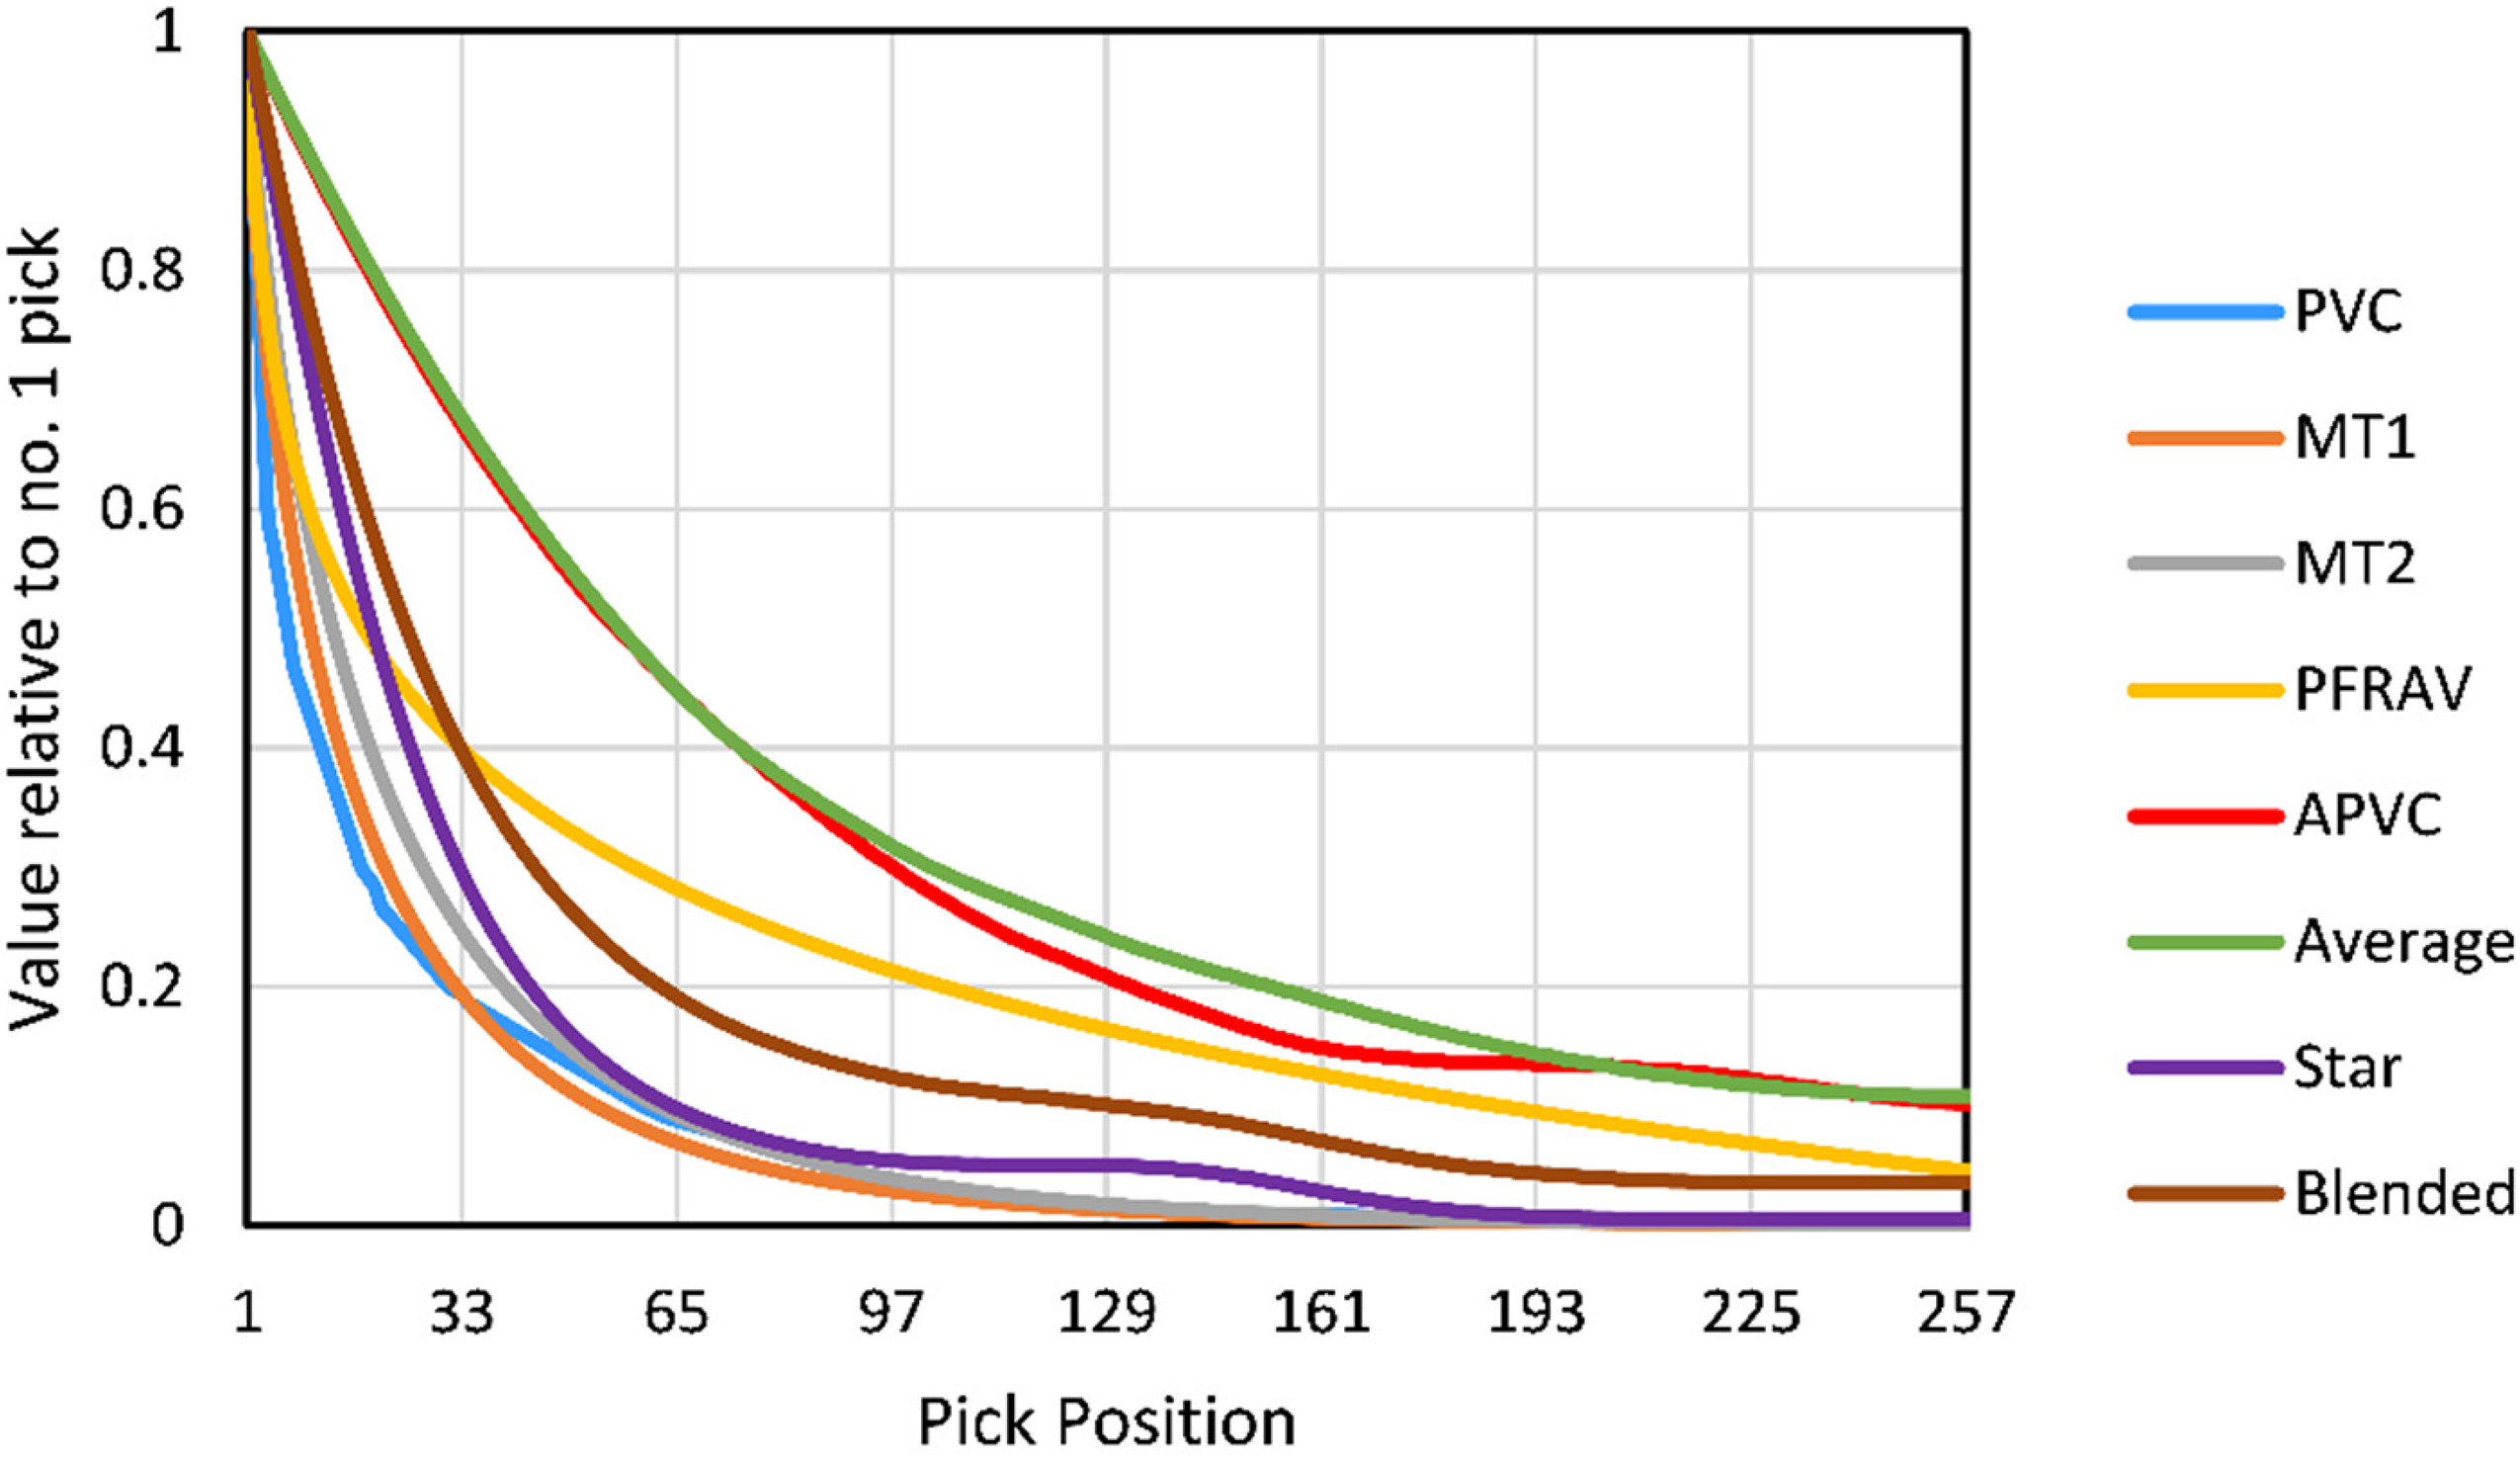
Draft-value curves. PVC: Original Pick Value Chart (PVC) introduced by McKoy which became the standard for NFL teams to use in negotiating draft trades. MT1: Implied draft position value estimated by Massey and Thaler (2013) using 1983–2008 data. MT2: Implied draft position value estimated by Massey and Thaler (2013) using 2001–2008 data. PFRAV: Draft curve from Pro Football Reference (PFR) based on the Approximate Value (AV) of players. APVC: Alternative Pick Value Chart (APVC) proposed by Schuckers (2011). Average, Star, Blended: Draft curves proposed by Lopez (2018).
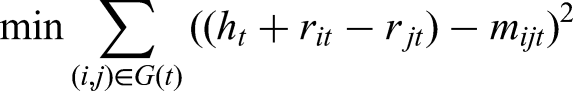
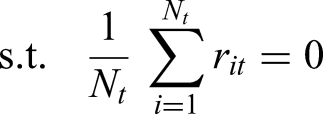
Massey and Thaler (2013) empirically estimate the value of draft picks using all trades involving only same-year draft picks. Let
Instead of assigning draft-pick values based on observed draft-pick trades, others have assigned values to
Michael Lopez, Senior Director of Football Data and Analytics at the NFL, suggested that teams might not be interested in drafting for average player performance, but instead prefer a shot at a superstar (Lopez, 2018). Figure 1 depicts three rescaled charts proposed by Lopez. Average is based on average career AV. Star is based on the probability of landing a superstar. Blended is a weighted average of the Average and Star curves. In the remainder of this paper, we investigate our research questions for each of the curves in Figure 1.
Data and Method
We collected and cross-checked data on the NFL drafts, and all NFL games played for the 1998 through 2021 seasons. Our primary data source, pro-football-reference.com, documents for each draft pick which team made the pick as well as any trade history for the pick. Pro-football-reference.com also documents the final score for each game as well as which teams reached the playoffs. We cross-checked our data with Wikipedia. NFL teams are assigned to either the American Football Conference or the National Football Conference. In each conference, teams are assigned to divisions. In 2002, the NFL expanded to 32 teams and realigned the divisions to its current organization. Instead of having three divisions with an unequal number of teams, each conference realigned to four divisions (East, North, South, and West) of four teams each. From 2002 onward, in each conference, all four division winners qualified for the playoffs as well as two wildcard teams (nondivision winners with the best record). So, 12 out of 32 NFL teams qualify for the playoffs. Starting in 2021, a third wildcard team also qualified in each conference. The 2002 realignment provides an opportunity to study the same set of 32 teams. Therefore, we focus on the 2002–2021 period. To include lagged variables of interest, we collect data back to 1998.
Variables
Our dependent variable is
To control for the strength of the teams each season, we use the least squares method to determine team ratings. The least squares method is commonly used to assess team strength when teams do not play all other teams (Albert et al., 2017; Lapré & Palazzolo, 2022; Winston et al., 2022). Because each NFL team plays a different subset of opponents, least squares ratings are better control variables for team strength compared to win percentages. A major advantage of least squares is the clear interpretation of the difference in ratings (Groll et al., 2020). Let
The forecasted margin for a game between home team i and away team j in season t is
Teams could perform worse when they have a new head coach. To control for a team changing head coaches, we define
Methodology
We use logistic regression to estimate the probability of reaching the playoffs as follows:
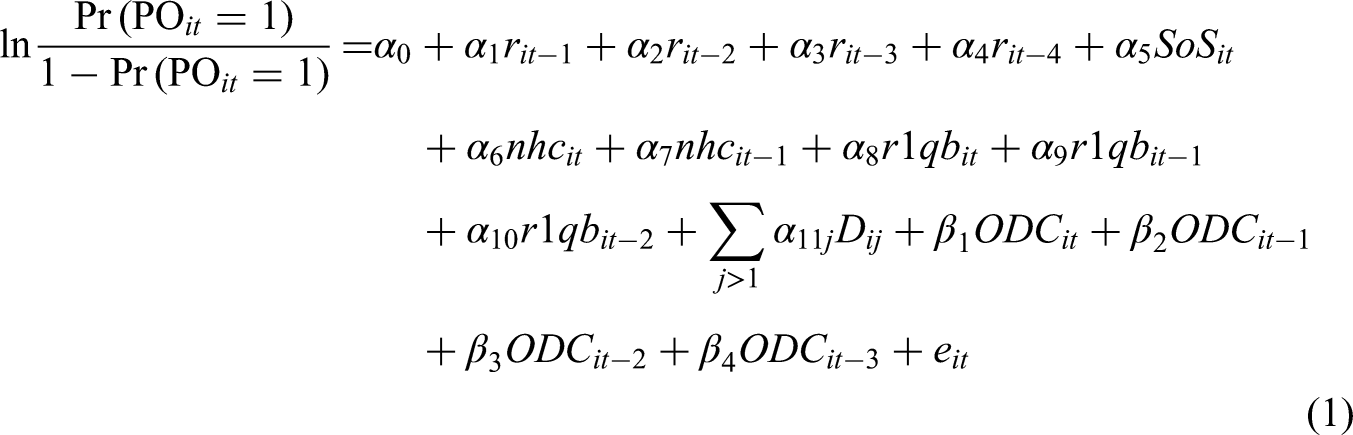
In the estimation, we fit random-effects models adjusting the standard errors for clustering observations by team. For the Cleveland Browns, we can calculate all lagged variables starting in 2003. For the Houston Texans, we can calculate all lagged variables starting in 2005. For the other 30 teams, we have all 20 observations for 2002–2021. Thus, the final dataset contains 635 observations. For logistic regression, Hosmer et al. (2013) recommend at least 10 events per independent variable to avoid overfitting. Thus, with 244 playoff appearances in our dataset, we should not include more than 24 independent variables. Equation (1) has 21 independent variables. So, overfitting is not a concern. The ultimate dependent variable would be winning the Superbowl, but with only 20 Superbowl champions in the dataset, we could have only 2 independent variables to avoid overfitting. Similarly, for any intermediate playoff success measures, the number of independent variables would be too small: conference champions (4), playing in the conference championship game (8), playing in the divisional round (16). In robustness tests, we also use win percentage in the regular season as a dependent variable.
Empirical Results
Table 1 shows the logistic regression estimates for reaching the playoffs with original draft currency. Model (1) is the base model with control variables only. The positive and statistically significant coefficients for ratings from the past two years indicate that higher team strength in the past two years enhances the probability of reaching the playoffs. Further back in time, the effect of team strength drops off. Ratings from three or four years ago are not statistically significant. The negative and statistically significant coefficient for strength of schedule indicates that playing tougher opponents reduces the probability of reaching the playoffs. The control variables for teams changing head coaches are not statistically significant, similar to prior findings in the literature (De Paola & Scoppa, 2012; Koning, 2003; Van Ours & Van Tuijl, 2016). First-round QBs contribute to reaching the playoffs in their second and third years, but not in their first year. None of the division dummies are significant. These significance findings are consistent across all models in Table 1.
Logistic Regression Models for Making the Playoffs in 2002–2021: Original Draft Currency.
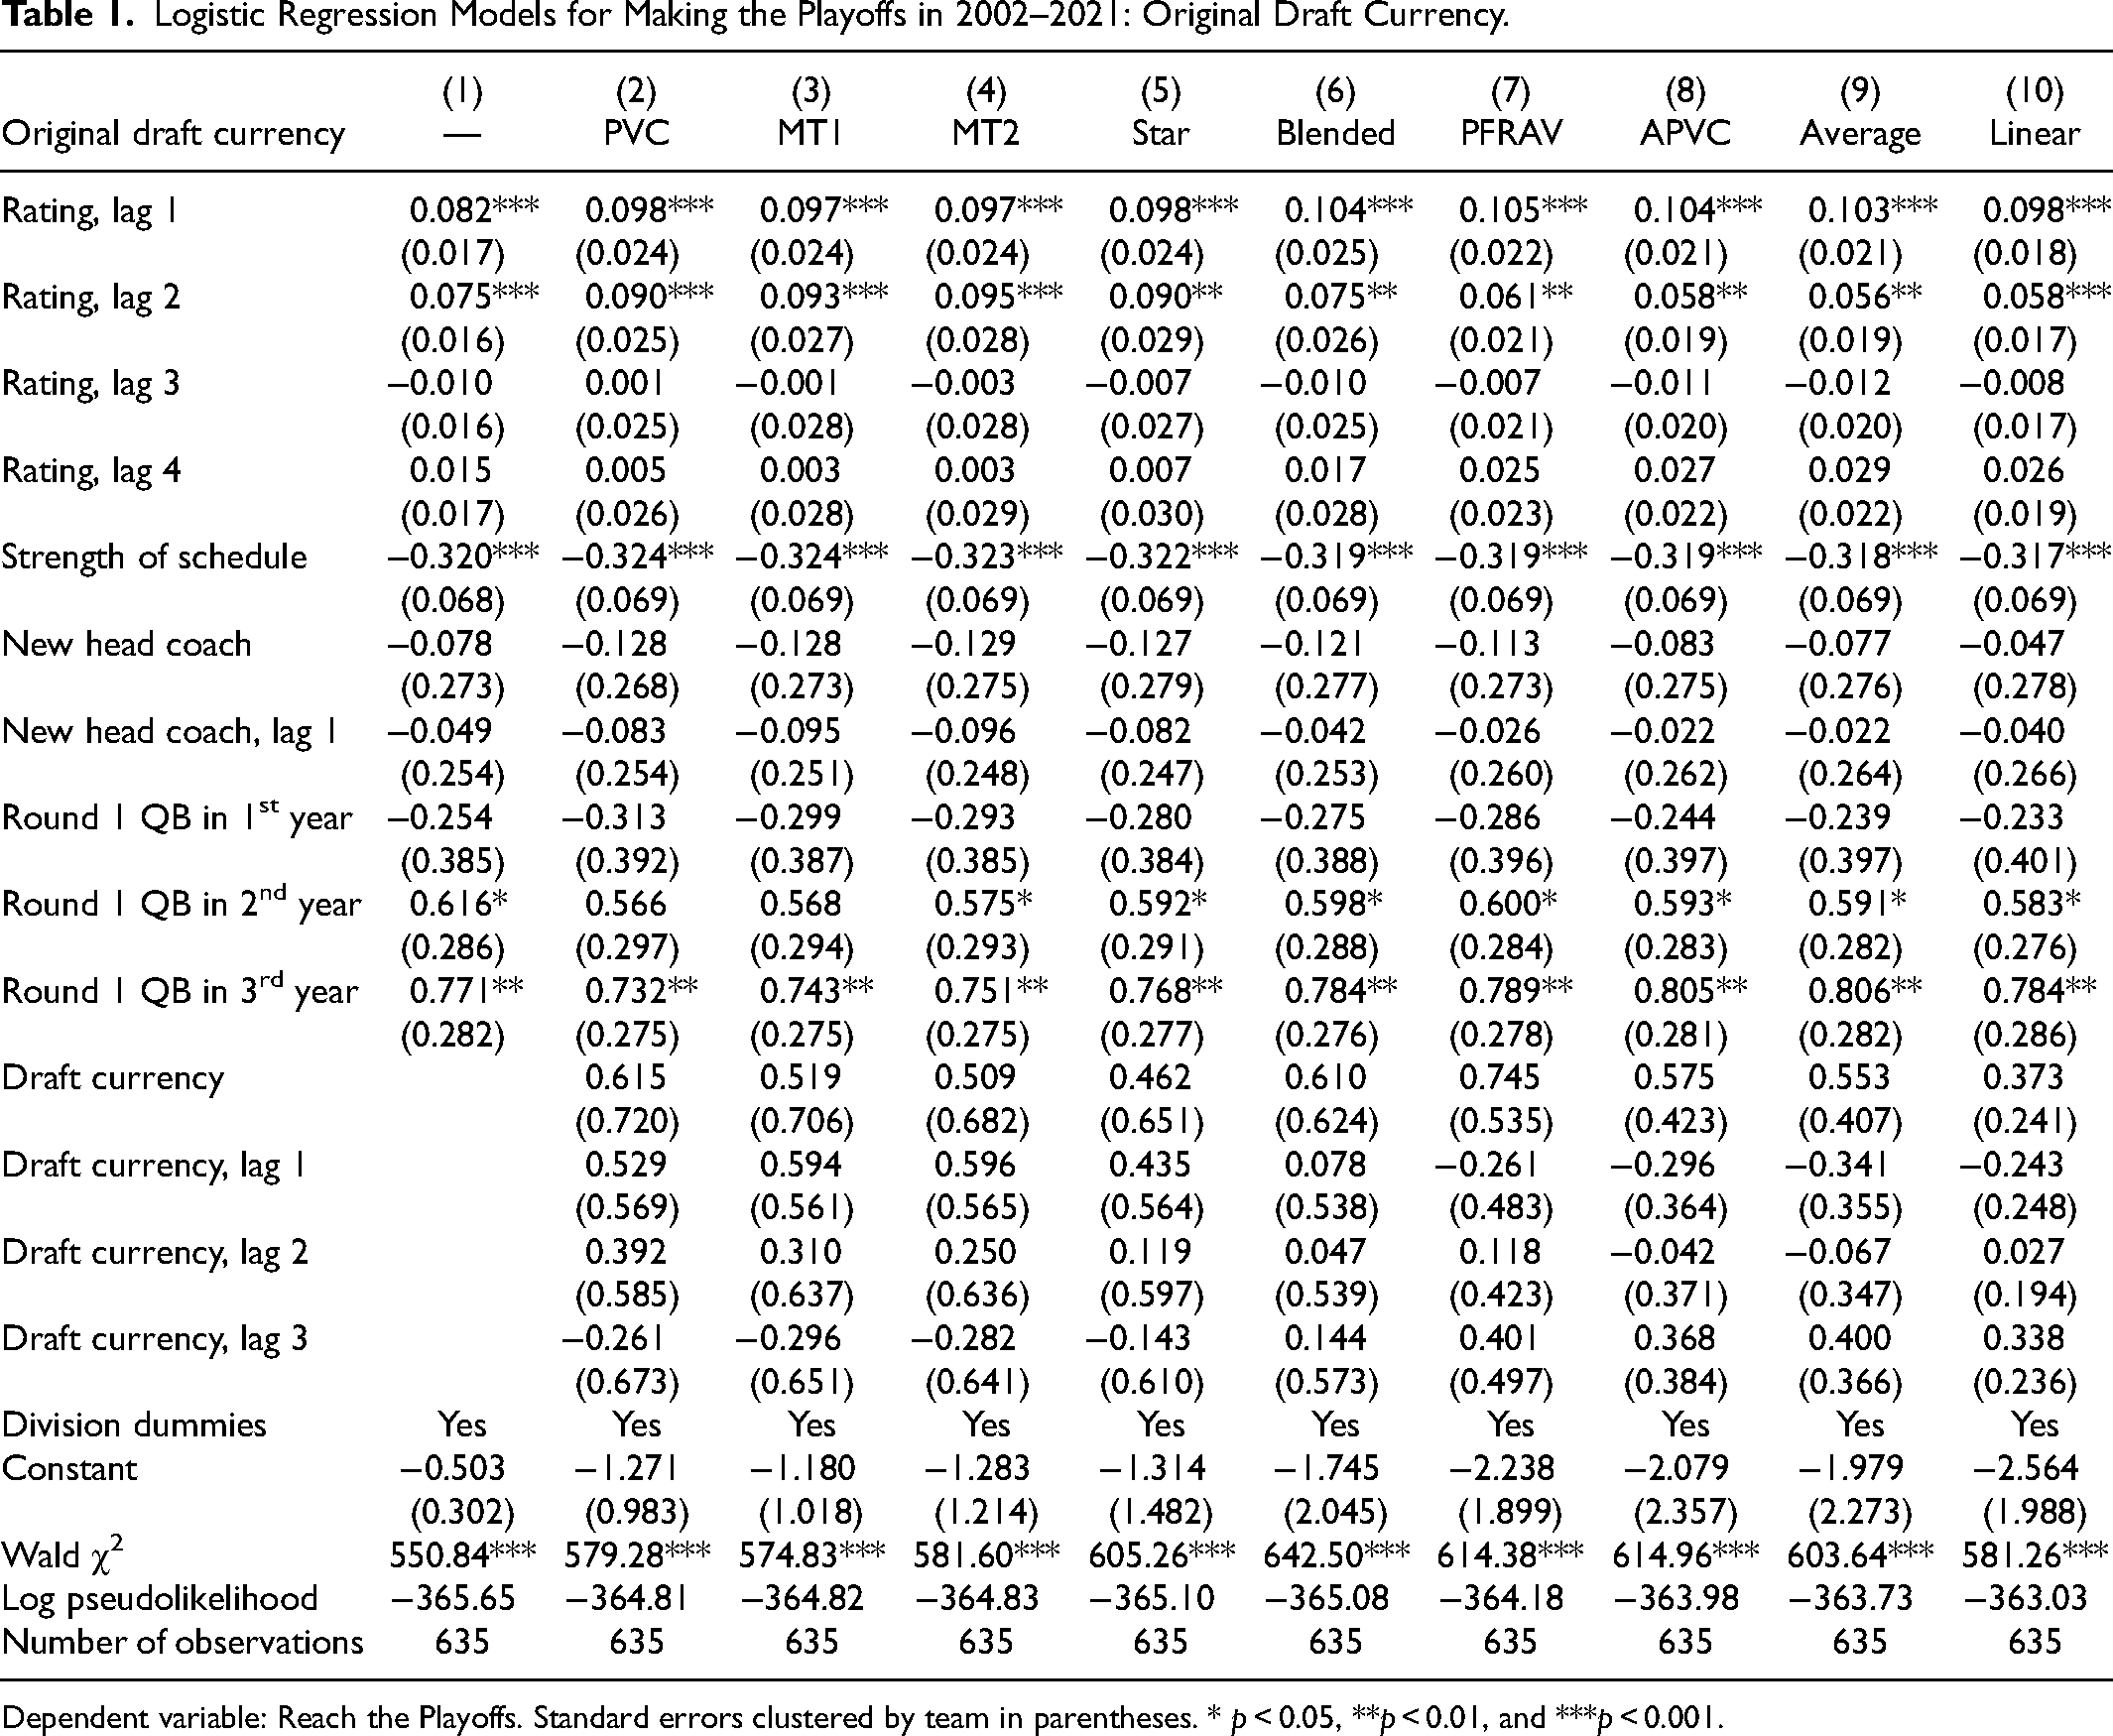
Dependent variable: Reach the Playoffs. Standard errors clustered by team in parentheses. * p < 0.05, **p < 0.01, and ***p < 0.001.
In Model (2), we add the original draft currency variables calculated with
Table 2 shows the logistic regression estimates for reaching the playoffs with final draft currency reflecting actual picks made after all draft trades. Again, the significant estimates for team ratings from the past two years and strength of schedule are consistent across all models. In Model (2) with the final draft currency variables calculated with
Logistic Regression Models for Making the Playoffs in 2002–2021: Final Draft Currency.
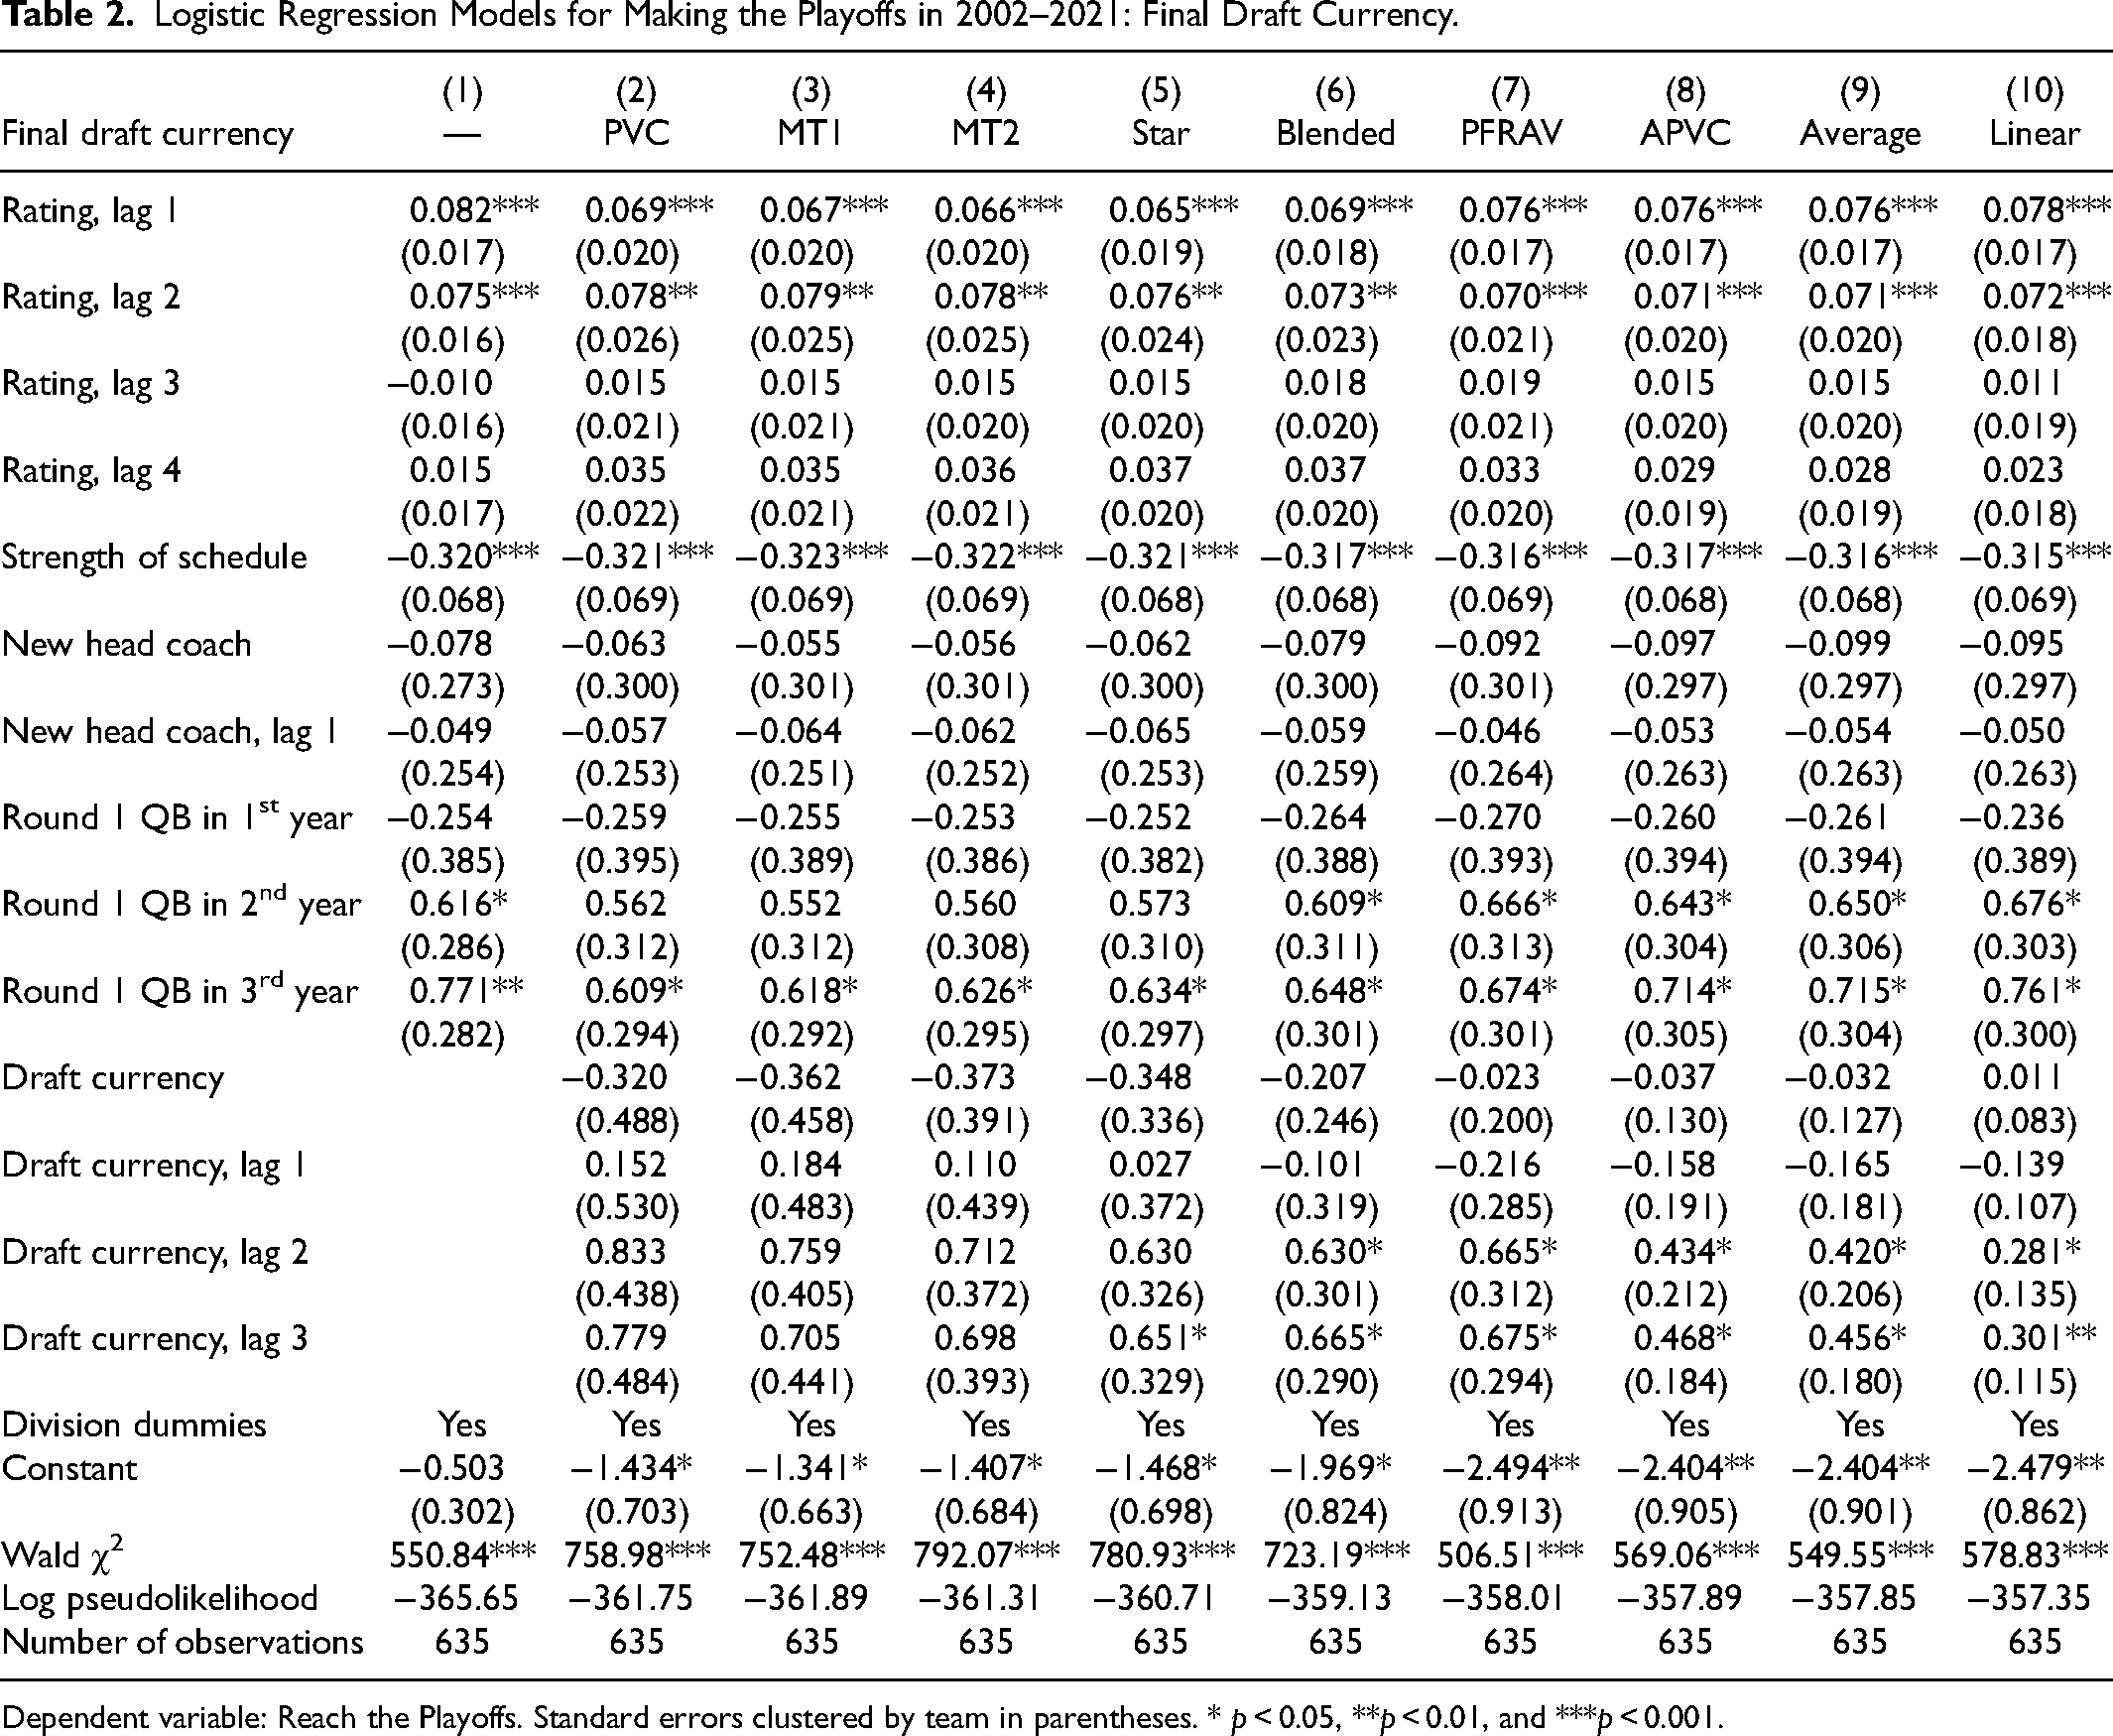
Dependent variable: Reach the Playoffs. Standard errors clustered by team in parentheses. * p < 0.05, **p < 0.01, and ***p < 0.001.
Teams can trade their original draft picks for other draft picks and/or veteran players. So, teams that end up with higher final draft currency compared to their original draft currency, might not only have traded picks but also traded away veteran players. While we fully incorporate gaining or losing draft picks, it is difficult to model gaining or losing veteran players. According to models with better model fit in Table 2, a team with a higher final draft currency has a higher probability of reaching the playoffs (with a delay). The benefit could be a combination of trading picks and trading away veteran talent. As a result, the coefficient estimates for final draft currency in Table 2 could be biased down, as the estimates might represent the net benefit of gaining draft currency and losing veteran talent. Therefore, it is possible that our results are understating the dynamics in the NFL, and the impact of final draft currency could be even bigger. Consequently, our finding—that final draft currency increases the probability of reaching the playoffs whereas original draft currency does not—is possibly even stronger.
We perform several robustness tests. First, we add an additional draft currency variable for the draft four years ago (
The results strongly suggest that original draft currency does not affect the probability of reaching the playoffs, but final draft currency does after a few years. So, it boils down to successfully trading draft picks rather than just picking in the original order. We formally verify this in a set of robustness tests. Let
Prior to 2017, teams were not allowed to trade compensatory picks. Starting in 2017, however, compensatory picks could be traded just like regular picks. We create alternative draft currency variables focusing on tradable picks only, that is, we omit compensatory picks prior to 2017. The results in Supplementary appendix Tables S6 and S7 show that (i) model fit is higher for PFRAV, APVC, Average, and Linear, and (ii) final draft currency from three years ago is positive and significant. These results further support our conclusion that final draft currency with a less steep decline increases the probability of reaching the playoffs with a delay.
Next, we investigate whether sample selection bias is a concern as it relates to the New England Patriots. The Patriots are by far the most successful team during the 2002–2021 period. They have 17 playoff appearances (compared to 7.6 for an average team), 8 Super Bowl appearances (compared to 3, 2, 1, or 0 for each of the other teams), and 5 Super Bowl wins (compared to just 2, 1, or 0 for each of the other teams). The Patriots also trade more of their draft picks (58%) compared to the league average (39%). Moreover, they tend to amass picks which are worth more in the APVC, Average, and Linear draft-value curves compared to the draft curves typically used by teams (PVC, MT1, MT2) in draft trades. So, the question arises whether the results are merely a Patriots effect. When we run our analysis omitting the Patriots observations, the results are similar to the results when we omit nontradable compensatory picks. None of the original draft currency variables are significant (Supplementary appendix Table S8), model fit is highest for final draft currency with APVC, Average, and Linear, and final draft currency from three years ago is positive and significant (Supplementary appendix Table S9). So, it is not merely a Patriots driven finding that final draft currency with a less steep decline increases the probability of reaching the playoffs with a delay. Appendix A shows that our findings are robust for other draft-value curves as well.
In a final set of robustness tests, we use win percentage in the regular season as an alternative dependent variable. Supplementary appendix Tables S10 and S11 report the results. The only significant (and positive) original draft currency variables are from one year ago for MT1 and MT2. However, the R2 for these two models is lower than for the base model and most other models. The only significant (and positive) final draft currency variables are from three years ago for PFRAV, APVC, Average, and Linear. These four models also have the highest R2 values among all models for win percentage in Supplementary appendix Tables S10 and S11. So, again, model fit is better for models with final draft currency with less steep decline in draft-pick value, and final draft currency contributes to success with a delay.
Discussion
The empirical results show that original draft currency does not affect the probability of reaching the playoffs. However, final draft currency does increase the probability of reaching the playoffs with a delay, and model fit is better for draft-value curves with a less steep decline, notably APVC, Average, and Linear. So, which teams end up with more final draft currency?
In Figure 2, we plot final draft currency against original draft currency. The horizontal (vertical) axis represents a team's original (final) draft currency averaged over 2002–2021. On the 45-degree line, the potential for promoting competitive balance is the highest as final draft currency equals original draft currency determined by the draft order. More deviation from the 45-degree line means more deviation from the perfect potential of promoting competitive balance. So, on average, a team above (below) the 45-degree line gained (lost) draft currency in trading picks. The scatterplot on the left based on PVC draft currency shows that teams are close to the 45-degree line suggesting that teams did indeed use the PVC when negotiating draft-pick trades. The scatterplot on the right based on APVC draft currency shows more variation around the 45-degree line. So, on average, teams with higher original draft currency (and thus earlier draft position) end up with higher final draft currency, but there is significant variation above and below the 45-degree line.
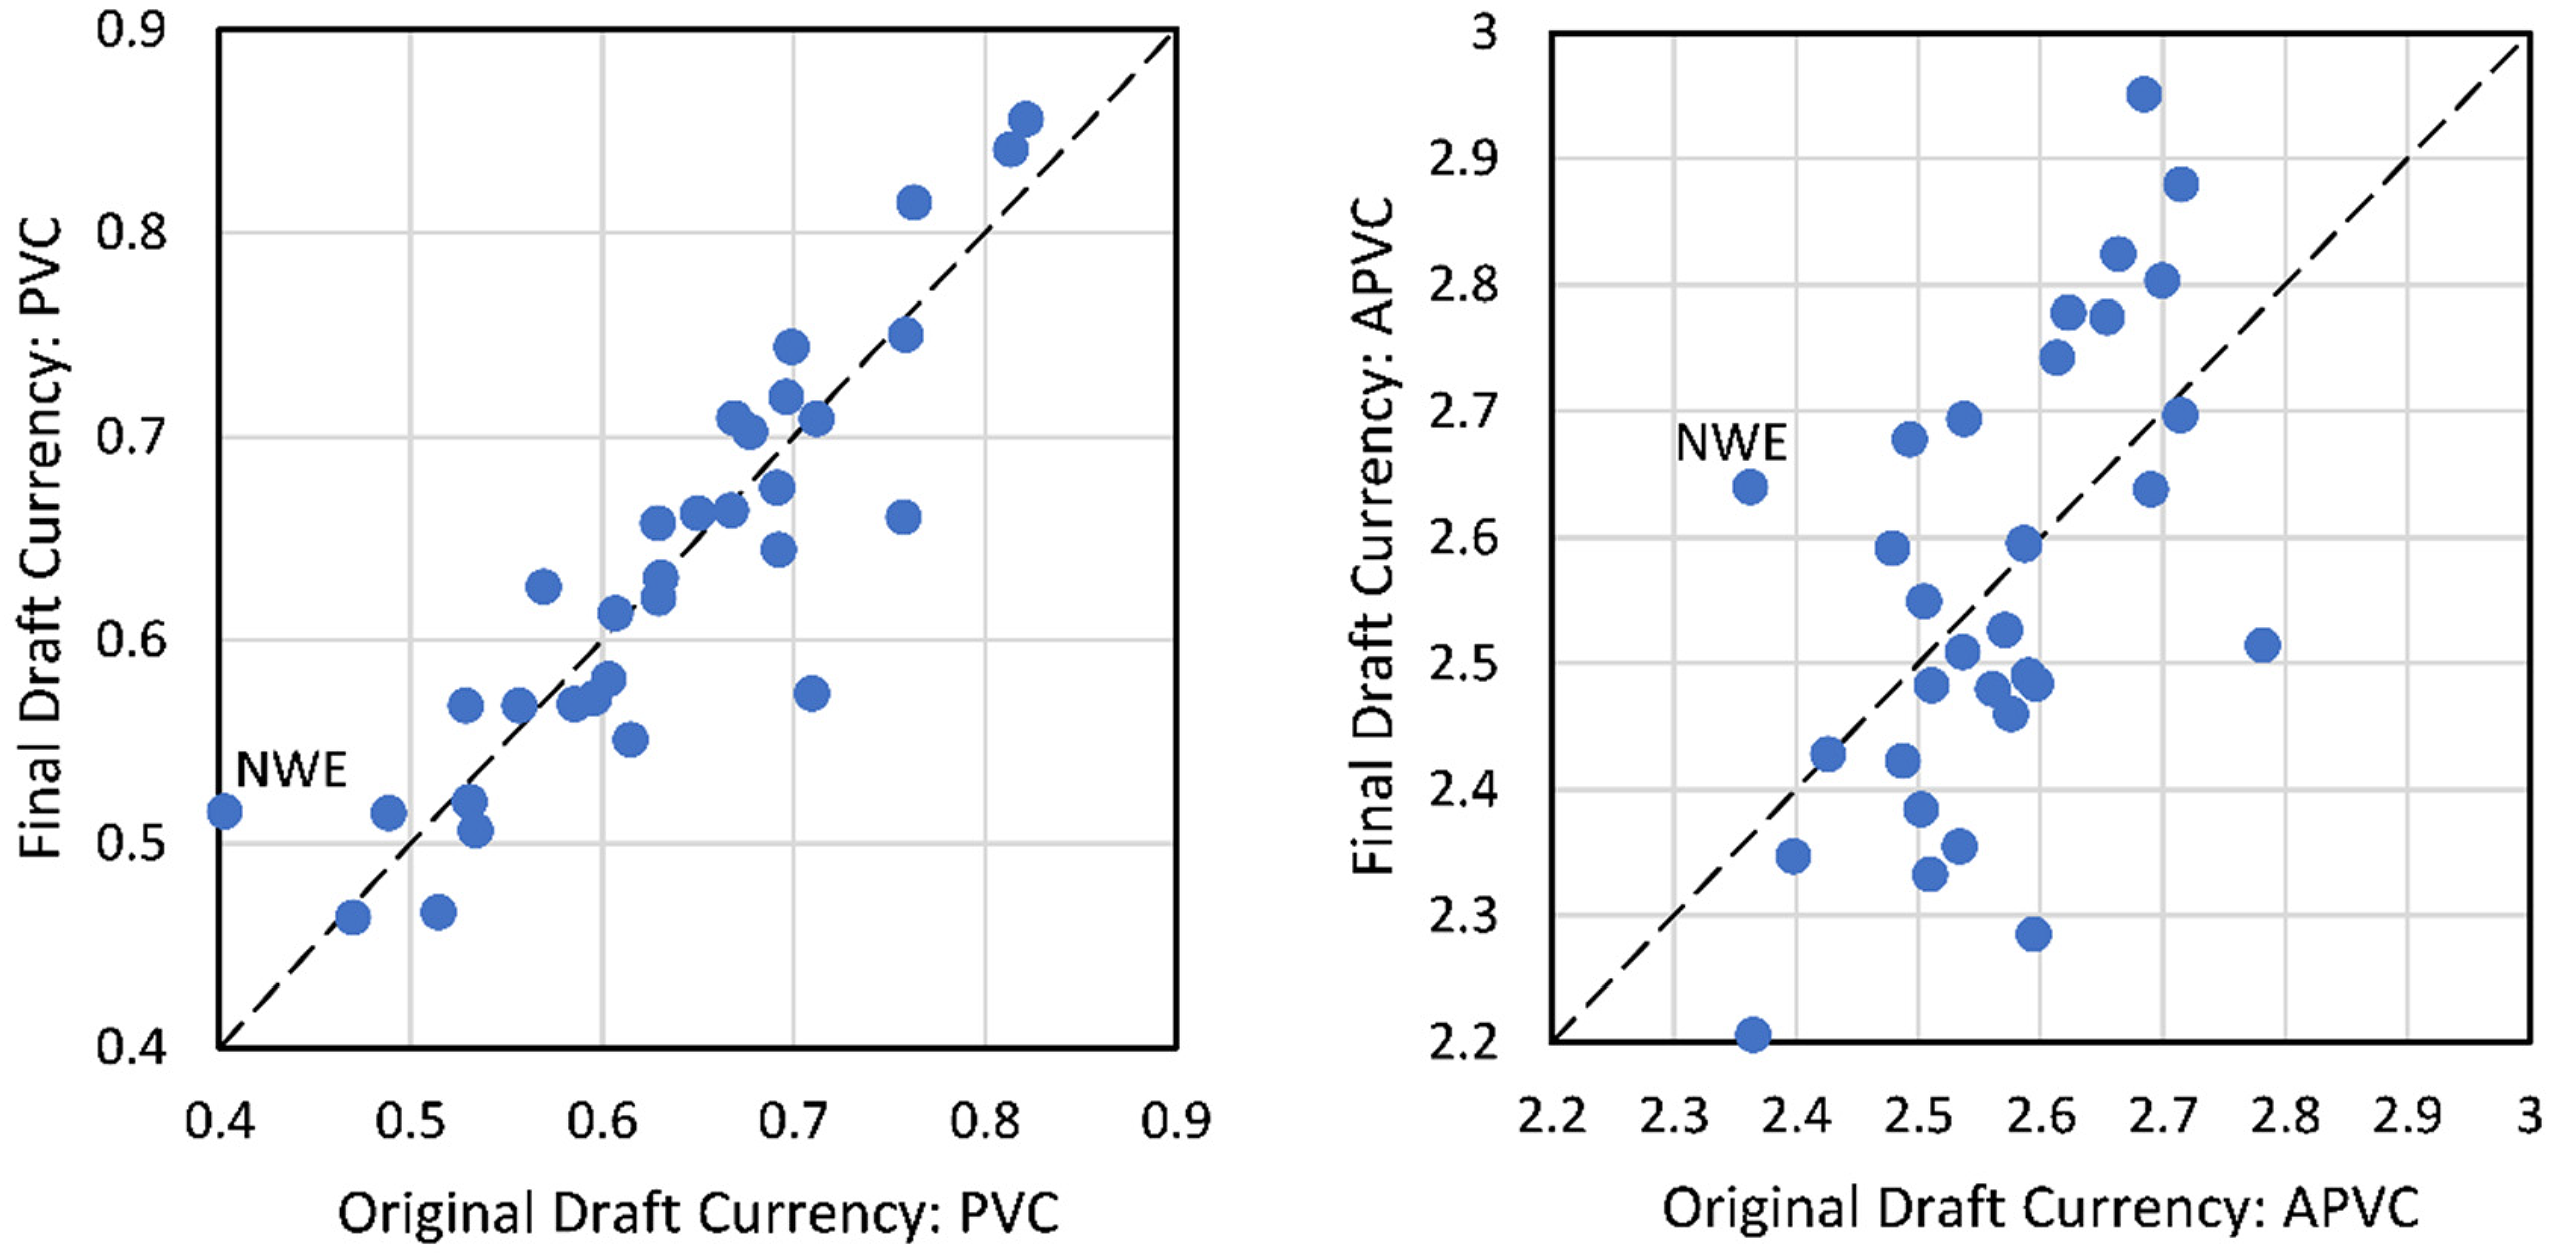
Team average draft currency comparisons 2002–2021: PVC and APVC. Each point represents a team's original draft currency and final draft currency averaged over 2002–2021. Points above (below) the dashed line are teams that ended up with more (less) currency because of their trades. In both charts, the New England Patriots (NWE) are the team on the far left with the least original draft currency. According to the PVC (APVC) valuation, the Patriots ended up with more currency than 4 (21) other teams on average.
We formally test the observations in Figure 2 by regressing final draft currency on original draft currency in Table 3:
Linear Regression Models for Final Draft Currency: 2002–2021.
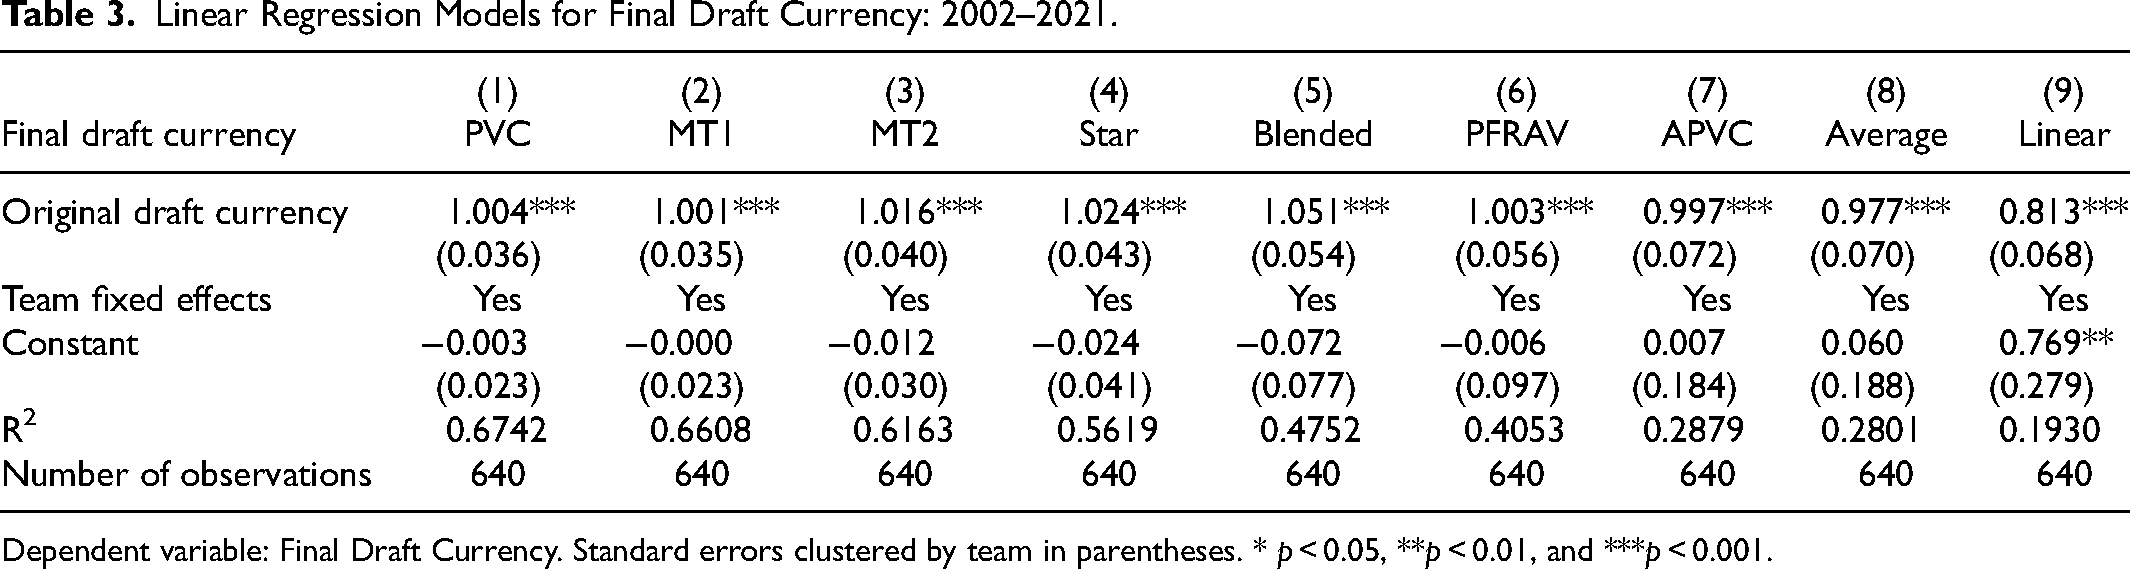
Dependent variable: Final Draft Currency. Standard errors clustered by team in parentheses. * p < 0.05, **p < 0.01, and ***p < 0.001.
In Figure 2, the New England Patriots are the team farthest to the left. As the strongest team on average, they had the least original draft currency. Trading picks they ended up with more final draft currency—measured by PVC—than four other teams. Measured by APVC, the Patriots ended up with more final draft currency than 21 other teams. By cleverly trading picks, the Patriots acquired draft picks undervalued by other teams which allowed the Patriots to remain among the strongest teams over a 20-year period thereby negating the intent of the draft. The mechanism of the draft is not necessarily flawed. Instead, other teams’ perceived value of draft picks perpetuates competitive imbalance.
Bill Belichick, head coach and de facto general manager of the New England Patriots since 2000, commented on the rule change in 2017 allowing teams to trade compensatory picks: “In the past [compensatory] picks really, I wouldn’t say don’t have any value, but they didn’t have much value because you couldn’t do anything with them other than pick a player at that spot. Now that those picks are tradeable, that changes things a little bit because they are capital to move up, move back, or you could move into those spots or trade them for other players.” (Hill, 2018).
To quantify the impact of improving final draft currency on the probability of making the playoffs, consider an average team (with a rating of 0 by construction) playing an average schedule (with a strength of schedule of 0) which has not drafted a QB in the first round in the past three years, with an average final draft currency according to the APVC of 2.6. We reestimated the logistic-regression model from Table 2 for final draft currency with the APVC leaving out nonsignificant variables. With these estimates, we determine that the estimated probability of making the playoffs for this average team is 0.338. If this average team were to make the draft trades the New England Patriots made, the improved final draft currency of 2.9 would change the estimated probability of making the playoffs to 0.389, an increase of 15%.
Conclusion
The intent of the NFL draft is to enhance competitive balance, yet empirical evidence to that effect has been empirically ambiguous (Maxcy, 2012). Our results provide novel insights by studying the probability of reaching the playoffs since the NFL realigned itself in 2002. We study a wide range of draft-value curves covering the highly nonlinear decline in draft-pick value of McCoy's PVC to a linear decline in draft value. Regardless of the draft-value curve we use to calculate original draft currency before any trades, we consistently find that original draft currency does not affect the probability of reaching the playoffs. Interestingly, after a few years, final draft currency after trades does increase the probability of reaching the playoffs. Since the total amount of original draft currency is a fixed pie each year, some teams gain draft currency at the expense of other teams. We find that teams that “out-trade” other teams increase their chances of reaching the playoffs. The impact of final draft currency happens with a delay; it takes at least until the third season after a draft before the impact on access to the playoffs can be expected. We find that model fit is better for draft curves with a less steep decline in draft-pick value than McCoy's PVC. Draft curves such as APVC, Average, and Linear provide better model fit. Some teams gained more draft currency valued by these less steep draft curves than other teams. In particular, the New England Patriots with the least original draft currency ended up with more draft currency valued by the APVC than 21 other teams allowing the Patriots to remain among the strongest teams over a 20-year period.
In our analysis, we could not control for different player positions. Future research should investigate how teams adjust their positional priorities based on recent success. Another fruitful avenue for future research would be to extend our analysis to include player-roster management considering both the depth in the draft for specific player positions and alternatives in free agency.
Supplemental Material
sj-docx-1-jse-10.1177_15270025241264238 - Supplemental material for Does Draft Currency Promote Competitive Balance? An Empirical Investigation of the National Football League 2002–2021
Supplemental material, sj-docx-1-jse-10.1177_15270025241264238 for Does Draft Currency Promote Competitive Balance? An Empirical Investigation of the National Football League 2002–2021 by Michael A. Lapré and Elizabeth M. Palazzolo in Journal of Sports Economics
Footnotes
Acknowledgments
The authors gratefully acknowledge Zoe Segal for research assistance. The authors thank the Associate Editor and two anonymous reviewers for the thoughtful and constructive feedback during the review process. The authors also thank Yasin Alan, Megan Lawrence, Brian McCann, participants at the 10th MathSport International 2023 Conference, the INFORMS 2023 Annual Meeting, as well as seminar participants at Vanderbilt University for helpful comments.
Declaration of Conflicting Interests
The author(s) declared no potential conflicts of interest with respect to the research, authorship, and/or publication of this article.
Funding
The author(s) received no financial support for the research, authorship, and/or publication of this article.
Supplemental Material
Supplemental material for this article is available online.
Author Biographies
Appendix
References
Supplementary Material
Please find the following supplemental material available below.
For Open Access articles published under a Creative Commons License, all supplemental material carries the same license as the article it is associated with.
For non-Open Access articles published, all supplemental material carries a non-exclusive license, and permission requests for re-use of supplemental material or any part of supplemental material shall be sent directly to the copyright owner as specified in the copyright notice associated with the article.