
Abstract
The phenomenon of nontransitivity in outcomes, typically observed in noneffort games with predetermined probabilities and immediate clarity, extends to team-based, time-consuming games requiring effort that unfold over a long period of time. This study explores this aspect through an empirical analysis of professional football matches in the Netherlands involving three prominent teams: Feyenoord, Ajax, and PSV. Contrary to conventional expectations, the results reveal a nontransitive pattern over more than three decades, indicating that Feyenoord is more likely to triumph over PSV, PSV over Ajax, and Ajax over Feyenoord than the reverse scenarios.
Introduction
Many binary relations demonstrate transitivity, particularly when comparing objective measures. For example, if person A is taller than person B, who is taller than person C, then logically, A is taller than C. Similarly, transitivity often applies to game outcomes. If player A consistently defeats player B in chess matches, and player B consistently defeats player C, it is reasonable to expect that player A would also likely defeat player C. However, this principle is not universal in the realm of game outcomes. Various factors such as players’ form or fitness, environmental conditions (like heat or pollution), luck, and coincidence can influence results. Moreover, players might be experimenting with new strategies, introducing an element of unpredictability. As a result, instances of nontransitivity are regularly observed in sports match outcomes, where in a particular season or tournament Team A beats Team B, Team B beats Team C, and Team C beats Team A.
The current article is on nontransitivity of outcomes of football matches between three teams that unfolded over several decades. The analysis focuses on three teams that were consistently competing in the highest tier of professional football in the Netherlands: Feyenoord, PSV, and Ajax. Over an extended period of time, the results of matches between these clubs exhibited nontransitivity: Feyenoord defeated PSV, PSV defeated Ajax, and Ajax defeated Feyenoord more frequently than the reverse scenarios. This nontransitive order persists regardless of conditions and becomes even more pronounced when considering differences in the relative strengths of the teams. While factors such as form, luck, strategy, and quality differences may influence individual matches, none of these elements can fully account for the nontransitivity of match outcomes over more than three decades.
The assertion of nontransitivity in certain sports match outcomes is not groundbreaking, as previous studies have identified evidence of nontransitivity in matches between individual players in sports like tennis (Bozóki et al., 2016; Temesi et al., 2024) and chess (Hankin, 2020; Poddiakov, 2022), as well as between teams in baseball (Spearing et al., 2023) and association football (Smead, 2019), and races between Formula I drivers (Kaiser, 2019). Moreover, demonstrating nontransitivity over a short period, such as a single sports season, is not particularly remarkable. In round-robin setups, where within a season three teams play against each other six times, randomness can easily lead to nontransitive outcomes. The current article adds to the literature the establishment of nontransitivity over an extended duration. This extended time frame distinguishes it from previous studies, as it underscores the persistence of nontransitivity beyond the confines of a single season or tournament. Nontransitivity of match outcomes between three teams occurring in a particular season due to coincidence is very small. 1 Finding nontransitivity over more than three decades is unique and unprecedented.
The main contribution of this article to the sports economics literature is threefold. Firstly, it demonstrates that nontransitivity in match outcomes among three teams persisted over an extended period. Secondly, it highlights that the phenomenon of nontransitivity is not reflected in the market’s expectations. In fact, when considering match outcome expectations, nontransitivity becomes more pronounced. Thirdly, the article illustrates that employing a betting strategy that exploits nontransitivity can be profitable.
The article is structured as follows. The “Nontransitivity in Games” section discusses previous studies on nontransitivity in games in general and more in particular in sports matches. The “Setting the Stage: Professional Football” section provides an overview of match outcomes between the three teams since the inception of professional football in the Netherlands in 1956. The “Measuring Nontransitivity of Match Outcomes” section introduces a measure of nontransitivity in match outcomes. This measure calculates the sum of the results of three pairs of matches to determine the presence of transitivity or nontransitivity. If the sum equals zero, transitivity is observed; otherwise, if the sum differs from zero, nontransitivity of match outcomes exists. In the “Parameter Estimates Pairwise Comparisons” section, the paper quantifies the relationships between the three clubs estimating ordered logit models of match outcomes in terms of home win, draw, and away win. The parameter estimates validate the existence of nontransitivity in match outcomes. The “Expected Outcomes and Match Surprises” section expands the analysis of nontransitivity to expected match outcomes and match surprises. The “Against the Odds: Nontransitive Gambling” section explores the implications of nontransitivity on potential earnings from the betting market. The “What About Other European Leagues?” section discusses other major European football leagues and focuses on nontransitivity in match outcomes in the Portuguese league. Finally, the “What About Other European Leagues?” section provides the main conclusions drawn from the analysis.
Nontransitivity in Games
There are several simple games illustrating the existence of nontransitivity. A well-known example is the game of rock-paper-scissors (RPS), commonly played by children. In one-on-one matches, players use their hand to signal either rock, scissors, or paper. Choices are revealed simultaneously, and the outcome becomes immediately apparent. Rock defeats scissors, scissors defeat paper, and paper defeats rock. The result is either a win or a loss, or a draw if both players make the same choice. The children’s game RPS has garnered significant attention in studies. According to Cason et al. (2014), the game is iconic due to its simple illustration of nontransitive dominance, where outcomes occur with equal probabilities. Simple as it may be, the game is popular. There are RPS championship competitions worldwide and since 2002 there is a World Rock Paper Scissors Society (You, 2021). Outcomes of RPS games are also studied to understand human behavior. Batzilis et al. (2019) analyzed Facebook data concerning the outcomes of hundreds of thousands of players engaging in the RPS game, with varying levels of information about previous player behavior. Their findings indicated that more experienced players utilized this information to their advantage.
Another example of nontransitivity is demonstrated by a two-player game where participants select one of three colored dice and then proceed to roll them. The dice have two identical series of numbers. The red die features the numbers 2-4-9, the green die has 1-6-8, and the blue die contains the numbers 3-5-7. In each roll, the die with the highest number is considered the winner. The outcome of the game depends on the number of wins accumulated over multiple rolls. Over time, the blue die prevails over the red die, the red die prevails over the green die, and the green die prevails over the blue die. If the first player selects a specific die, the second player can then choose the die that ensures victory in the game. Draw outcomes are impossible since no two numbers on the dice are identical. 2 Nontransitive dice sets have been studied from a theoretical point of view. For example, Bozóki (2014) presents a more general discussion of nontransitive dice sets extending the number of simultaneous players to more than two and indicating that there are three-player nontransitive dice sets such that if two players pick a die the third player can pick a die that beats both opponents’ dice.
Nontransitivity may occur in pairwise comparisons of outcomes of matches between sports teams. Smead (2019) provides a real-life example of nontransitivity in international football during the 1994 FIFA World Cup Group E, where Ireland defeated Italy, Italy defeated Norway, Norway defeated Mexico, and Mexico defeated Ireland. 3 Kaiser (2019), investigating the sensitivity of point systems in determining the final ranking in Formula 1 Drivers seasons, showed that in the 2007 season there was nontransitivity among the top three drivers: Räikkönen defeated Alonso 11 races to six, Alonso defeated Hamilton 10 races to seven, and Hamilton defeated Räikkönen 10 races to seven. These examples of nontransitivity were likely caused by the small number of matches, as luck is a determinant of match outcomes. Furthermore, Formula 1 races are between many racers simultaneously and not pairwise like in football.
Bozóki et al. (2016) used results from tennis matches to rank male tennis players; Temesi et al. (2024) did the same for female tennis players. Players are sometimes ranked even if they have never played against each other. Both studies find that nontransitivity in match outcomes between three players occurred frequently. Poddiakov (2022) mentioned that nontransitivity not only occurs in stochastic real-world games but also in deterministic positional games in chess and checkers in terms of nontransitive players’ positions. Finally, Spearing et al. (2023) studied nontransitivity in baseball using data from nine seasons of American League Baseball. 4 The main finding was that, by allowing for nontransitivity, prediction of match outcomes can be improved.
Setting the Stage: Professional Football
Professional football is a game played according to the same rules in competitions all over the world. Two teams of 11 players compete against each other in a match that lasts two halves of 45 min each, with a break of 15 min in between. Most competitions are organized as round-robin tournaments, where each team faces every other team twice, once at home and once away. The team scoring the most goals in a match wins and earns three points. In the event of a draw, both teams receive one point. The team with the highest number of points at the end of the season wins the championship. Whether a team wins a particular match depends on the relative quality of the teams, the abilities of the coaches, luck, referee decisions, and chance occurrences. In the long run, the quality of the team is the primary determinant of success. However, disparities in quality may not be adequate to ensure a clear hierarchy of teams in every game; thus, match outcomes are uncertain. Indeed, without this uncertainty, football would not be as exciting to watch.
The top tier of professional football in the Netherlands (Eredivisie) started in 1956. In the 67 seasons since then, three clubs have consistently played in the top league: Feyenoord, PSV, and Ajax. 5 Feyenoord and PSV have always played in the same stadiums which were renovated a couple of times but not renewed. Ajax moved to a new stadium in 1996 with a substantial larger capacity. 6
The 2019/20 season was partly canceled due to Covid-19. 7 When the Eredivisie was put to a standstill in March 2020, Ajax and AZ were on top with the same number of points (56). On the basis of goal difference the Dutch football association declared Ajax to have ended top of the league though not as champion. 8 In the other 66 seasons, Ajax won 28 championships, PSV 21, Feyenoord 11, and other clubs won a total of six times. The three clubs are often referred to as the “big three” of Dutch professional football. Throughout all seasons, Ajax won 67% of all its league matches, PSV 61%, and Feyenoord 57%.
Table 1 displays the match outcomes in terms of the total number of points obtained during all seasons. 9 As shown in the first column, over all matches they played against each other, Feyenoord obtained 24 more points than PSV indicating that overall, Feyenoord was stronger than PSV. The second column shows that PSV acquired nine more points than Ajax when they played against each other, demonstrating overall slight superiority of PSV over Ajax. In the first half of the sample period Ajax dominated PSV, in the second half it was the other way around. The third column demonstrates that Ajax accumulated 96 points more than Feyenoord when they played against each other, showcasing Ajax’s superiority over Feyenoord.
Match Outcomes in Points Obtained; 1956/57-2022/23.
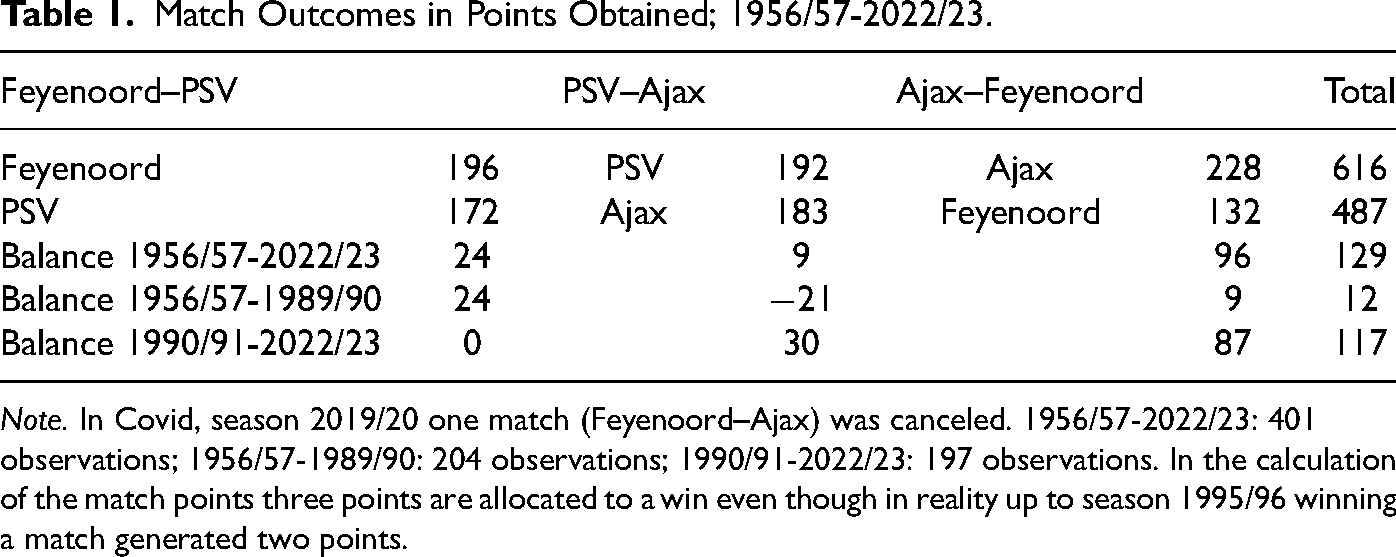
Note. In Covid, season 2019/20 one match (Feyenoord–Ajax) was canceled. 1956/57-2022/23: 401 observations; 1956/57-1989/90: 204 observations; 1990/91-2022/23: 197 observations. In the calculation of the match points three points are allocated to a win even though in reality up to season 1995/96 winning a match generated two points.
The bottom part of Table 1 shows the points balance is the sample period is roughly split-up in two: from 1956/57 to 1989/90 and from 1990/91 to 2022/23. From this, it appears that the dominance of Feyenoord over PSV was present mainly in the first half of the sample period. The dominance of PSV over Ajax and of Ajax over Feyenoord occurred in the second half of the sample period. Using the sum of the number of points obtained in pairwise matches nontransitivity is evident: Feyenoord was stronger than PSV, which was stronger than Ajax, which, in turn, was stronger than Feyenoord. This nontransitivity is clearly related to the second half of the sample period. 10
Figure 1 illustrates the evolution of the balance of the cumulative points obtained in pairwise matches. The trajectories of the cumulative points are not linear. The gap in cumulative points between Feyenoord and PSV increased until the early 1970s, remaining relatively stable thereafter. The cumulative points difference between PSV and Ajax initially decreased, then increased, and has remained relatively constant over the past 20 years. The cumulative points difference between Ajax and Feyenoord was steady until the mid-1980s and then increased steadily.
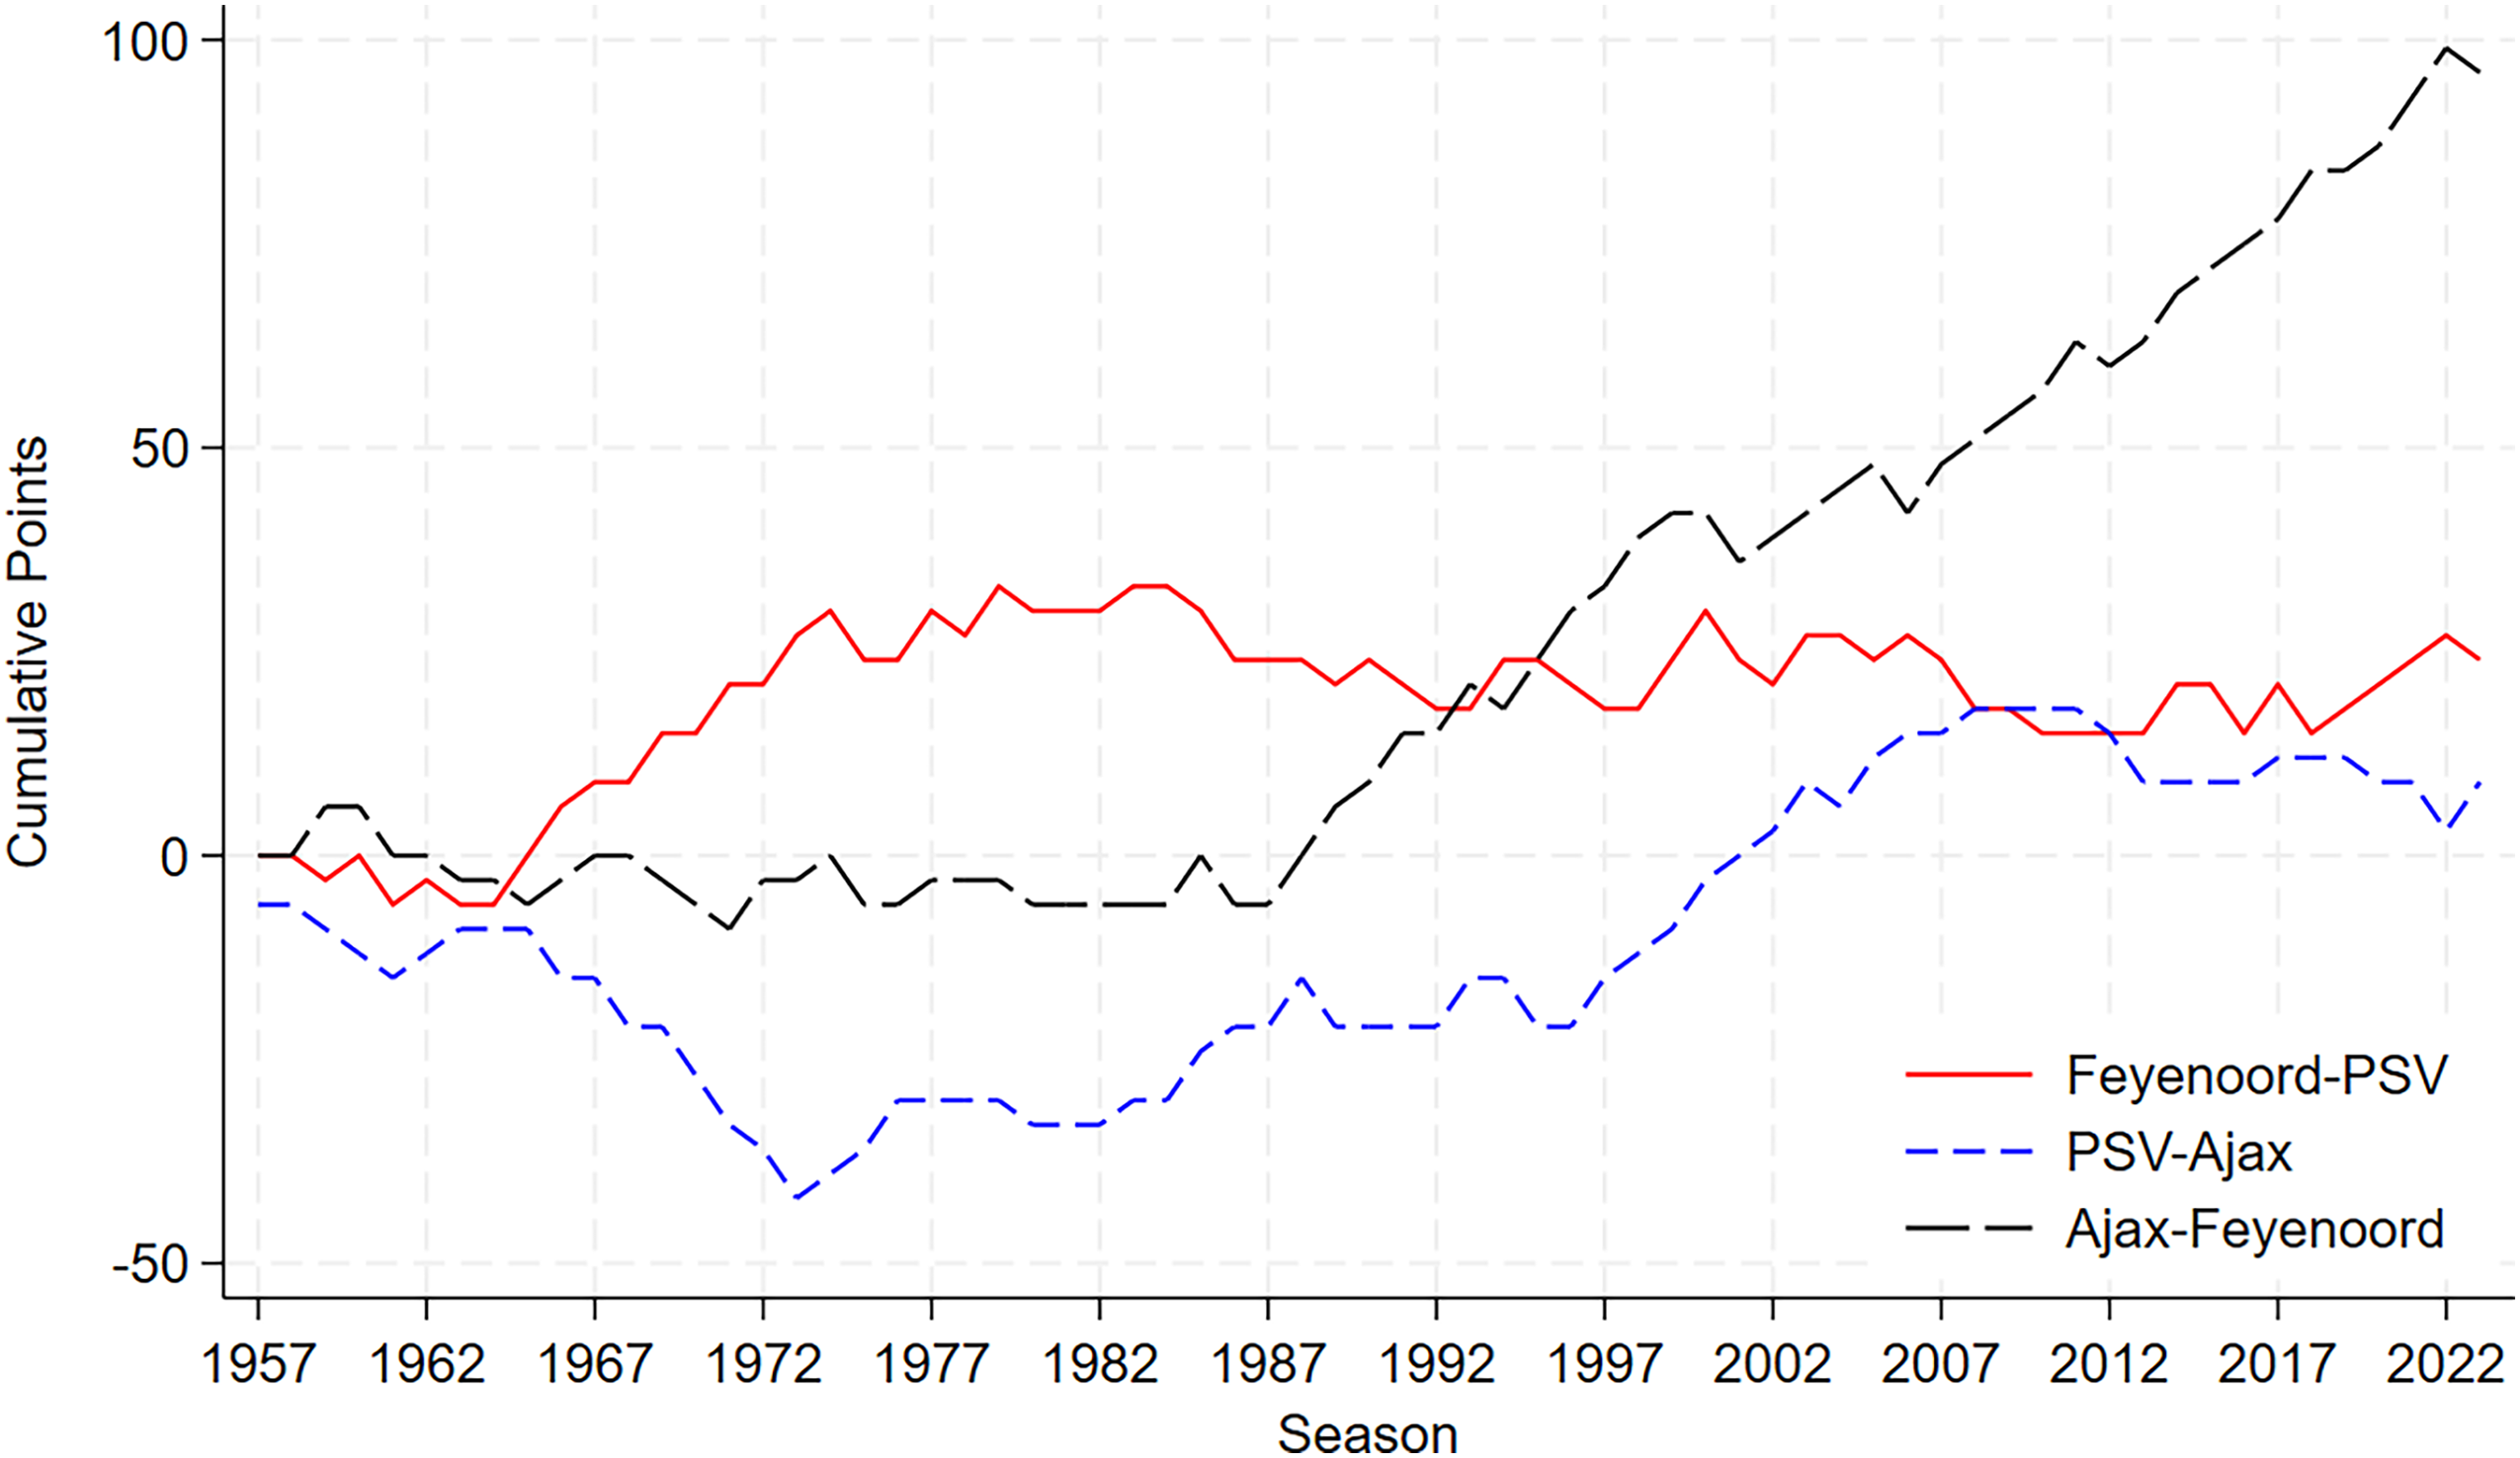
Cumulative balance in points pairwise matches; 1956/57-2022/23. Note. The differences are calculated for the first team for each match pair.
Measuring Nontransitivity of Match Outcomes
The outcome of a match, 


Figure 2 displays the developments of the cumulative nontransitivity indicator with
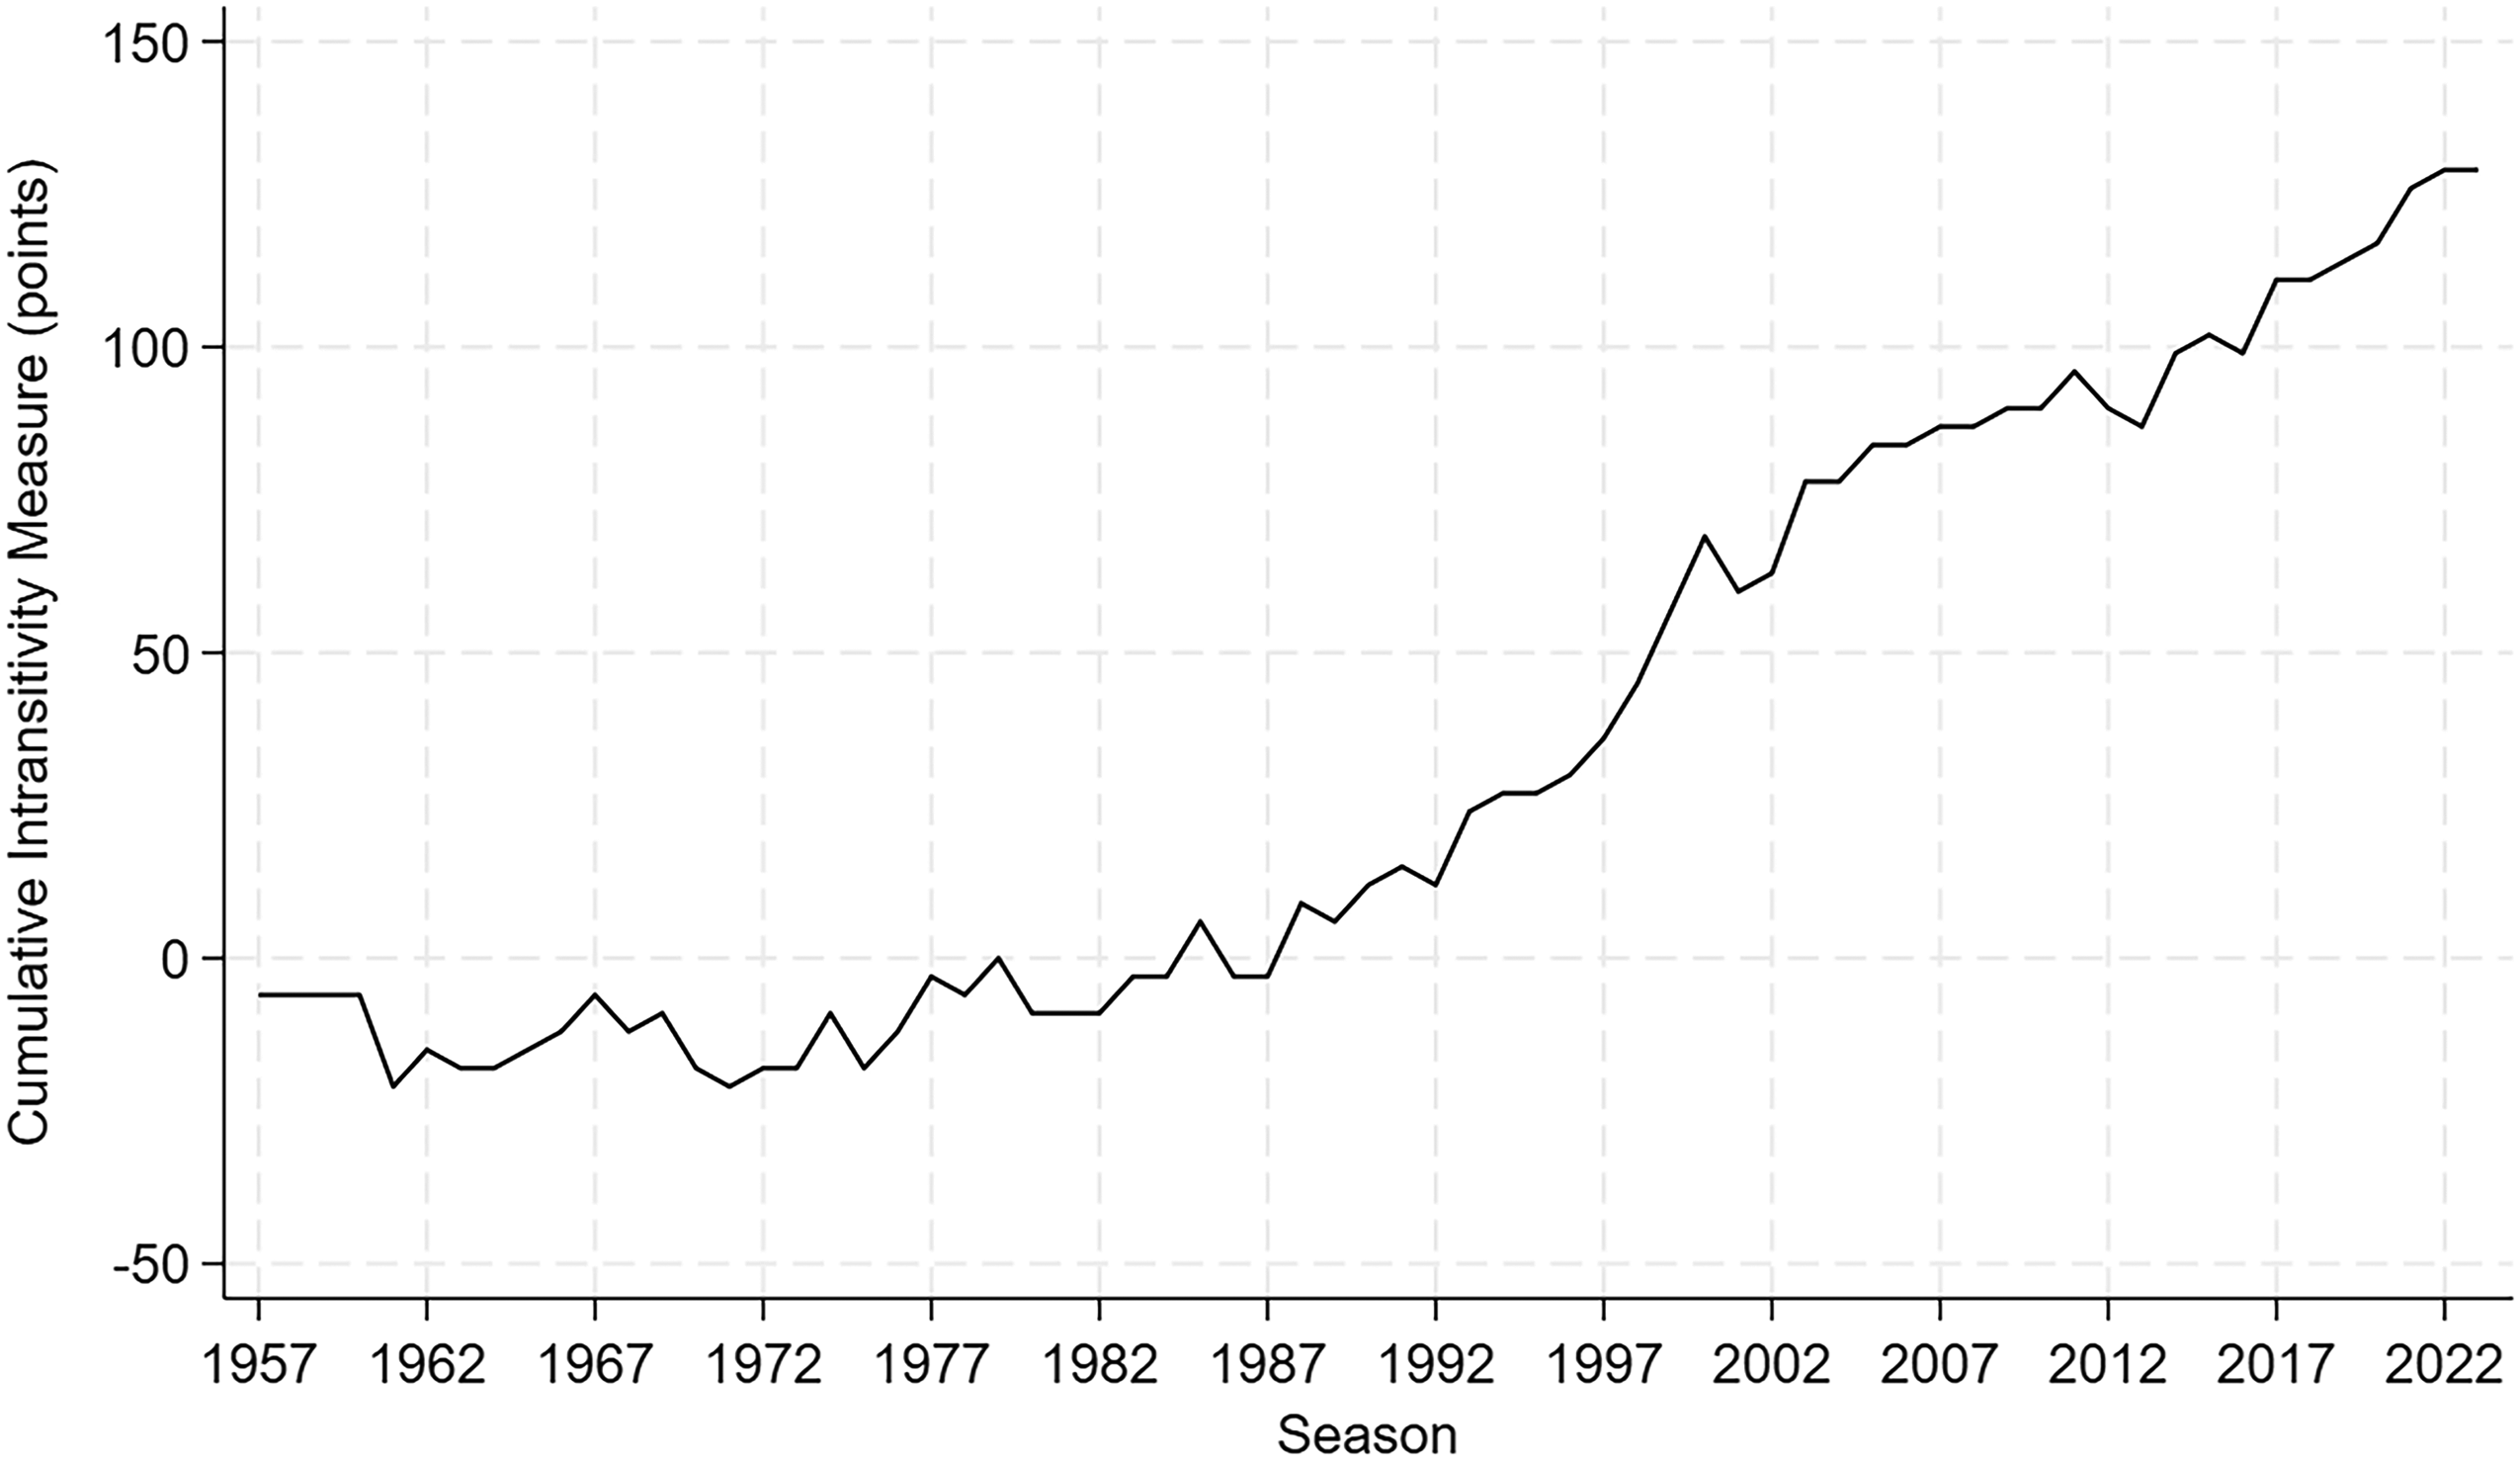
Cumulative nontransitivity; 1956/57-2023/24. Note. Nontransitivity of Feyenoord dominating PSV, PSV dominating Ajax, and Ajax dominating Feyenoord.
Parameter Estimates Pairwise Comparisons
The Bradley & Terry (1952) model is the seminal model for ranking on the basis of pairwise comparisons. In terms of match outcomes, the probability that one team beats another team depends on the difference in skills or quality they possess. The model is transitive, meaning that if team 

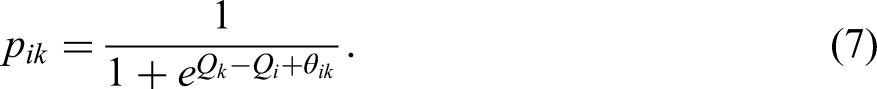
As mentioned in the “Nontransitivity in Games” section, Spearing et al. (2023) applied this model to the outcomes of baseball matches. They did not allow for draws to occur and they ignored home advantage, indicating that this can be included by introducing a parameter
Table 2 presents the relevant parameter estimates when an ordered logit model is used for pairwise ranking, allowing for the probability of a draw and for the potential effect of playing at home. 13 The ordering is threefold: loss, draw, and win. For identification, the effect quality for Feyenoord is normalized to zero so the parameter estimates for quality of PSV and Ajax are quality relative to Feyenoord.
Parameter Estimates Match Outcomes Ordered Logit Models.
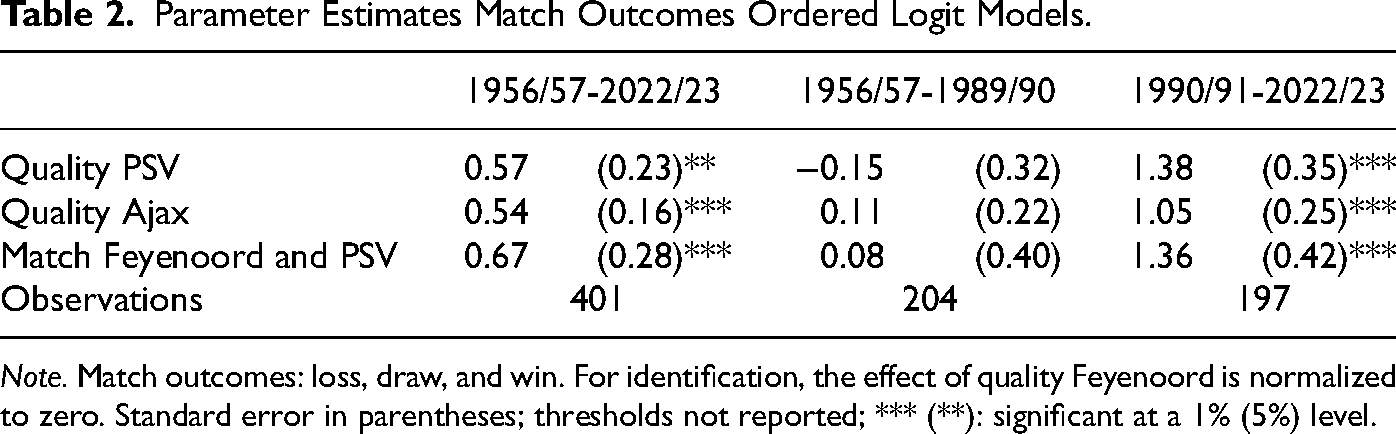
Note. Match outcomes: loss, draw, and win. For identification, the effect of quality Feyenoord is normalized to zero. Standard error in parentheses; thresholds not reported; *** (**): significant at a 1% (5%) level.
The first column of Table 2 shows the parameter estimates over the full sample period, confirming the existence of quality differences between on the one hand, Feyenoord and on the other hand, Ajax and PSV. There is also an evidence of nontransitivity as the match-specific effect of Feyenoord playing against PSV is positive and significantly different from zero. This indicates that the match outcomes between Feyenoord and PSV are different than expected based on the ranking in quality. Conditional on the differences in quality, Feyenoord is more likely to obtain points when playing against PSV, which in itself is a sign of the existence of nontransitivity.
The second column presents the estimates for the first 34 seasons. 14 The quality indicators are insignificantly different from zero, as is the match-specific effect for Feyenoord playing against PSV. Apparently, there is no systematic difference in outcomes between the various matches, and there is no evidence of nontransitivity occurring.
The third column of Table 2 shows the parameter estimates for the second period of 33 seasons, from 1990 onward. Now the quality indicators are positive and significantly different from zero, although not significantly different from each other. This indicates that both PSV and Ajax were of approximately equal strength, and both were stronger teams than Feyenoord. The match-specific effect of Feyenoord and PSV playing against each other is also significantly different from zero, confirming the existence of nontransitivity in match outcomes.
Expected Outcomes and Match Surprises
Match outcomes may be influenced by the relative strengths of the teams. Stronger teams are more likely to win. One way to account for these differences is by using differences in Elo ratings. Originally, Elo ratings were used to indicate the relative strength of chess players (Elo, 1978) but nowadays they are used in many sports to predict match outcomes. Lasek et al. (2013), for example, presented an analysis of national team football match outcomes in the period 2006-2012. They investigated the predictive power of various ranking systems using as a benchmark the official ranking of FIFA, the world football association. The ranking systems are used to generate predictions and by comparing with actual match outcomes to assess the accuracy of the predictions. The main conclusion was that an Elo rating-based system outperforms the then-used FIFA ranking method. In the meantime, since 2018, FIFA started using an Elo approach for their ranking of countries (FIFA, 2018). Similarly, Csató (2024) advocates replacing UEFA club coefficients, currently used to measure the strength of European football teams, by a new Elo rating-based system.
Hvattum & Arntzen (2010) studied whether rating systems of football teams based on their past performance are helpful in predicting match outcomes. The authors concluded that using Elo ratings as a measure of team strength is justified. Arntzen & Hvattum (2021) is a related study showing that Elo ratings of football teams perform well when used as a basis for predicting match outcomes in professional football in England. The predictions are improved when individual player valuations are also taken into account.
When two teams play against each other, their Elo ratings are adjusted depending on the match’s outcome. Winning increases a team’s rating, while losing decreases it. Teams with a history of good results have higher Elo ratings, while those with poor results have lower ones. The differences in Elo ratings before a match are used to predict match outcomes in terms of home win probabilities, draw probabilities, and away win probabilities. 15
Panel a of Table 3 indicates that in terms of expected points based on predicted outcomes based on Elo ratings, there was a transitive relationship between the three clubs: Ajax was stronger than PSV, which was stronger than Feyenoord. The expected points serve as an indicator of the team’s strength but does not reveal the origin of that strength. Considering the relative strength of the teams, it is unsurprising that Ajax wins more often against Feyenoord than the other way around. However, it is surprising that Feyenoord wins more often against PSV and PSV wins more often against Ajax. To explore this further, the difference between the expected result and the actual result of a match, termed the match surprise, are also analyzed.
Expected Points and Surprise Points; 1956/57-2022/23.
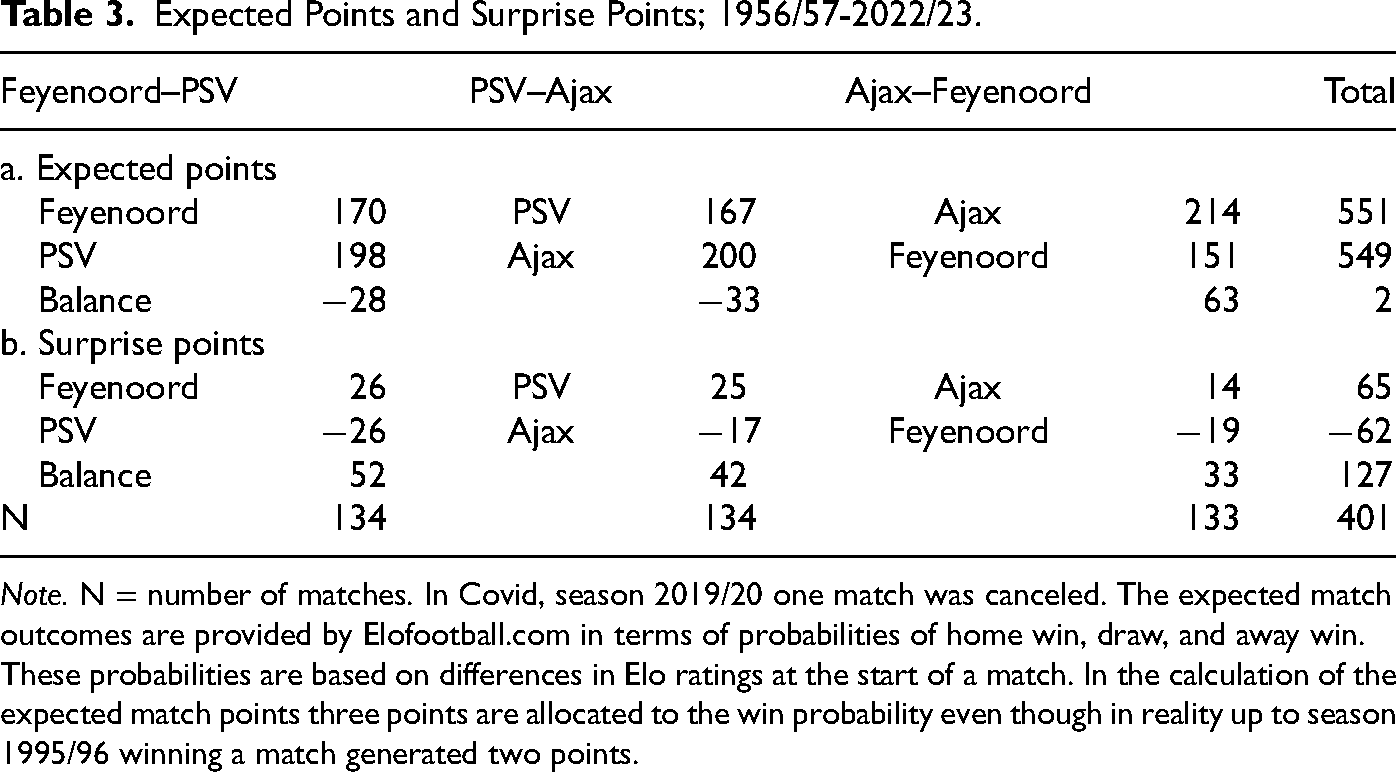
Note. N = number of matches. In Covid, season 2019/20 one match was canceled. The expected match outcomes are provided by Elofootball.com in terms of probabilities of home win, draw, and away win. These probabilities are based on differences in Elo ratings at the start of a match. In the calculation of the expected match points three points are allocated to the win probability even though in reality up to season 1995/96 winning a match generated two points.
An example of the calculation of a match surprise is as follows: on January 27, 2019, Feyenoord played a home game against Ajax. Based on the differences in Elo rating, Feyenoord had a win probability of 24%, while Ajax had a win probability of 49%.
16
The probability of a draw was 27%. The expected number of points for Feyenoord was calculated as
Panel b of Table 3 displays the cumulative surprises for the pairs of matches between the three clubs. Feyenoord had a positive surprise of 26 points, PSV had a negative surprise of 26 points, resulting in an overall positive surprise of 52 points for Feyenoord when playing against PSV. PSV had a positive cumulative surprise of 25 points when playing against Ajax, and Ajax had a positive cumulative surprise of 14 points in their matches against Feyenoord. Once again, there is nontransitivity observed: Feyenoord dominated PSV, which dominated Ajax, which, in turn, dominated Feyenoord. 17
The last column of Table 3 presents the overall balance of the various indicators. For expected points, the sum was close to zero, as was to be expected. However, for points differences, the balance was quite large, reflecting the nontransitivity of the cumulative match surprises.
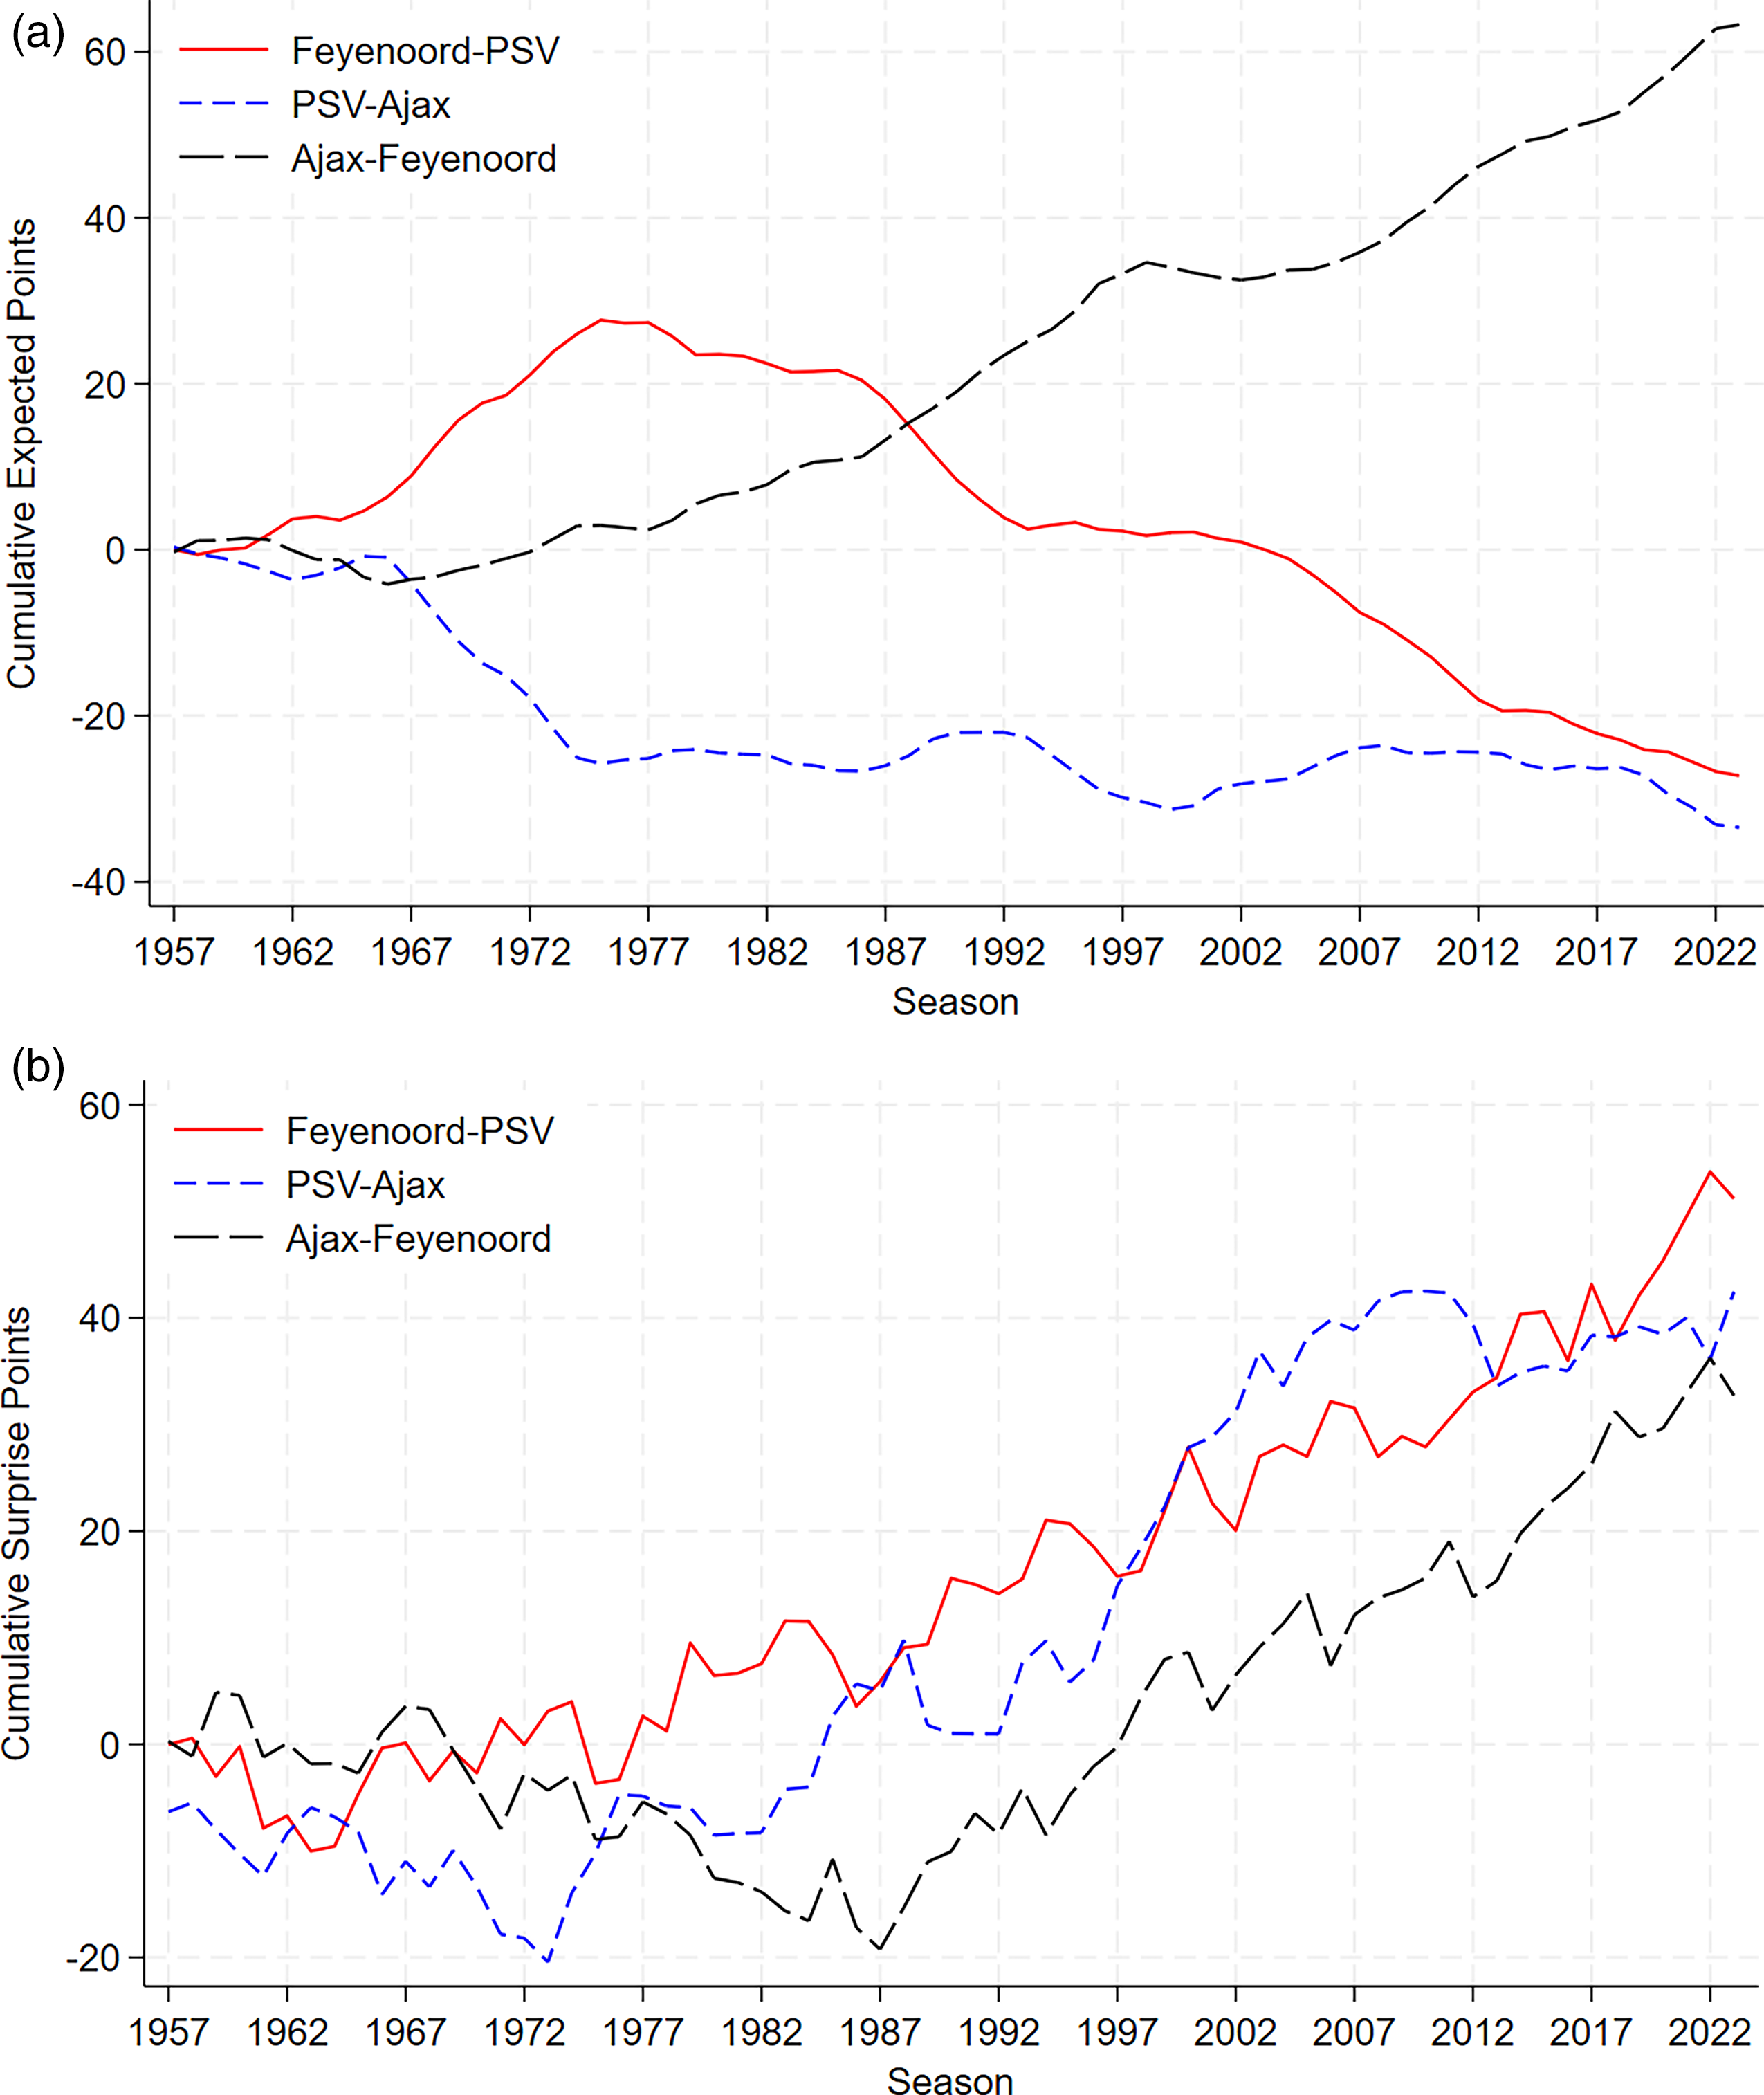
Cumulative expected and surprise points; 1956/57-2022/23. (a) Cumulative expected points and (b) cumulative surprise points. Note. The differences are calculated for the first team for each match pair.
Panel a of Figure 3 depicts the evolution of cumulative expected points. Until the late 1970s, Feyenoord obtained more expected points than PSV in their matches. However, from then on, the situation reversed, indicating that initially Feyenoord was considered stronger than PSV, while later on PSV was considered stronger than Feyenoord. From the late 1970s onward, PSV was roughly as strong as Ajax.
Panel b of Figure 3 presents the development of cumulative surprise points for the three match pairs. It is evident that the upward-sloping trend for each pair of teams was not present from the beginning. However, from the late 1980s onward, all curves began to slope upward.
Against the Odds: Nontransitive Gambling
Odds Based on Elo Ratings
The nontransitivity of match outcomes implies that Feyenoord won more often against PSV than one would expect based on the match outcomes between Feyenoord and Ajax, and between PSV and Ajax. To illustrate the consequences of this bias in expected results, the potential profits from a hypothetical nontransitive betting strategy are calculated. The assumption is that the odds derived from differences in Elo ratings are equivalent to betting odds. 18 The calculations of the earnings are based on betting 1 euro for a win for every home match and every away match on the first team in the pairs Feyenoord–PSV, PSV–Ajax, and Ajax–Feyenoord. If a win did not occur, the loss was 1 euro; if the win materialized, the pay-out was according to the betting odds. The cumulative outcomes of these hypothetical betting examples are shown in Figure 4a. Betting on a win of Feyenoord against PSV would have been profitable with a cumulative profit of about 24 euro (investing 134 euro). The cumulative profits would have fluctuated over time. For instance, in 2007, the cumulative profits from 50 years of investment would have been approximately 10 euro (investing 100 euro). The increase from 10 to 24 euro would have occurred in the last decade. Betting on a win of PSV against Ajax would have generated a cumulative profit of about 26 euro, but this would have been obtained already at the start of the 21st century. However, betting on a win of Ajax against Feyenoord would not have been profitable. The cumulative losses would have been about 5 euro. In the early 1980s, the cumulative loss would have been around 15 euro, so there would have been an improvement since then.
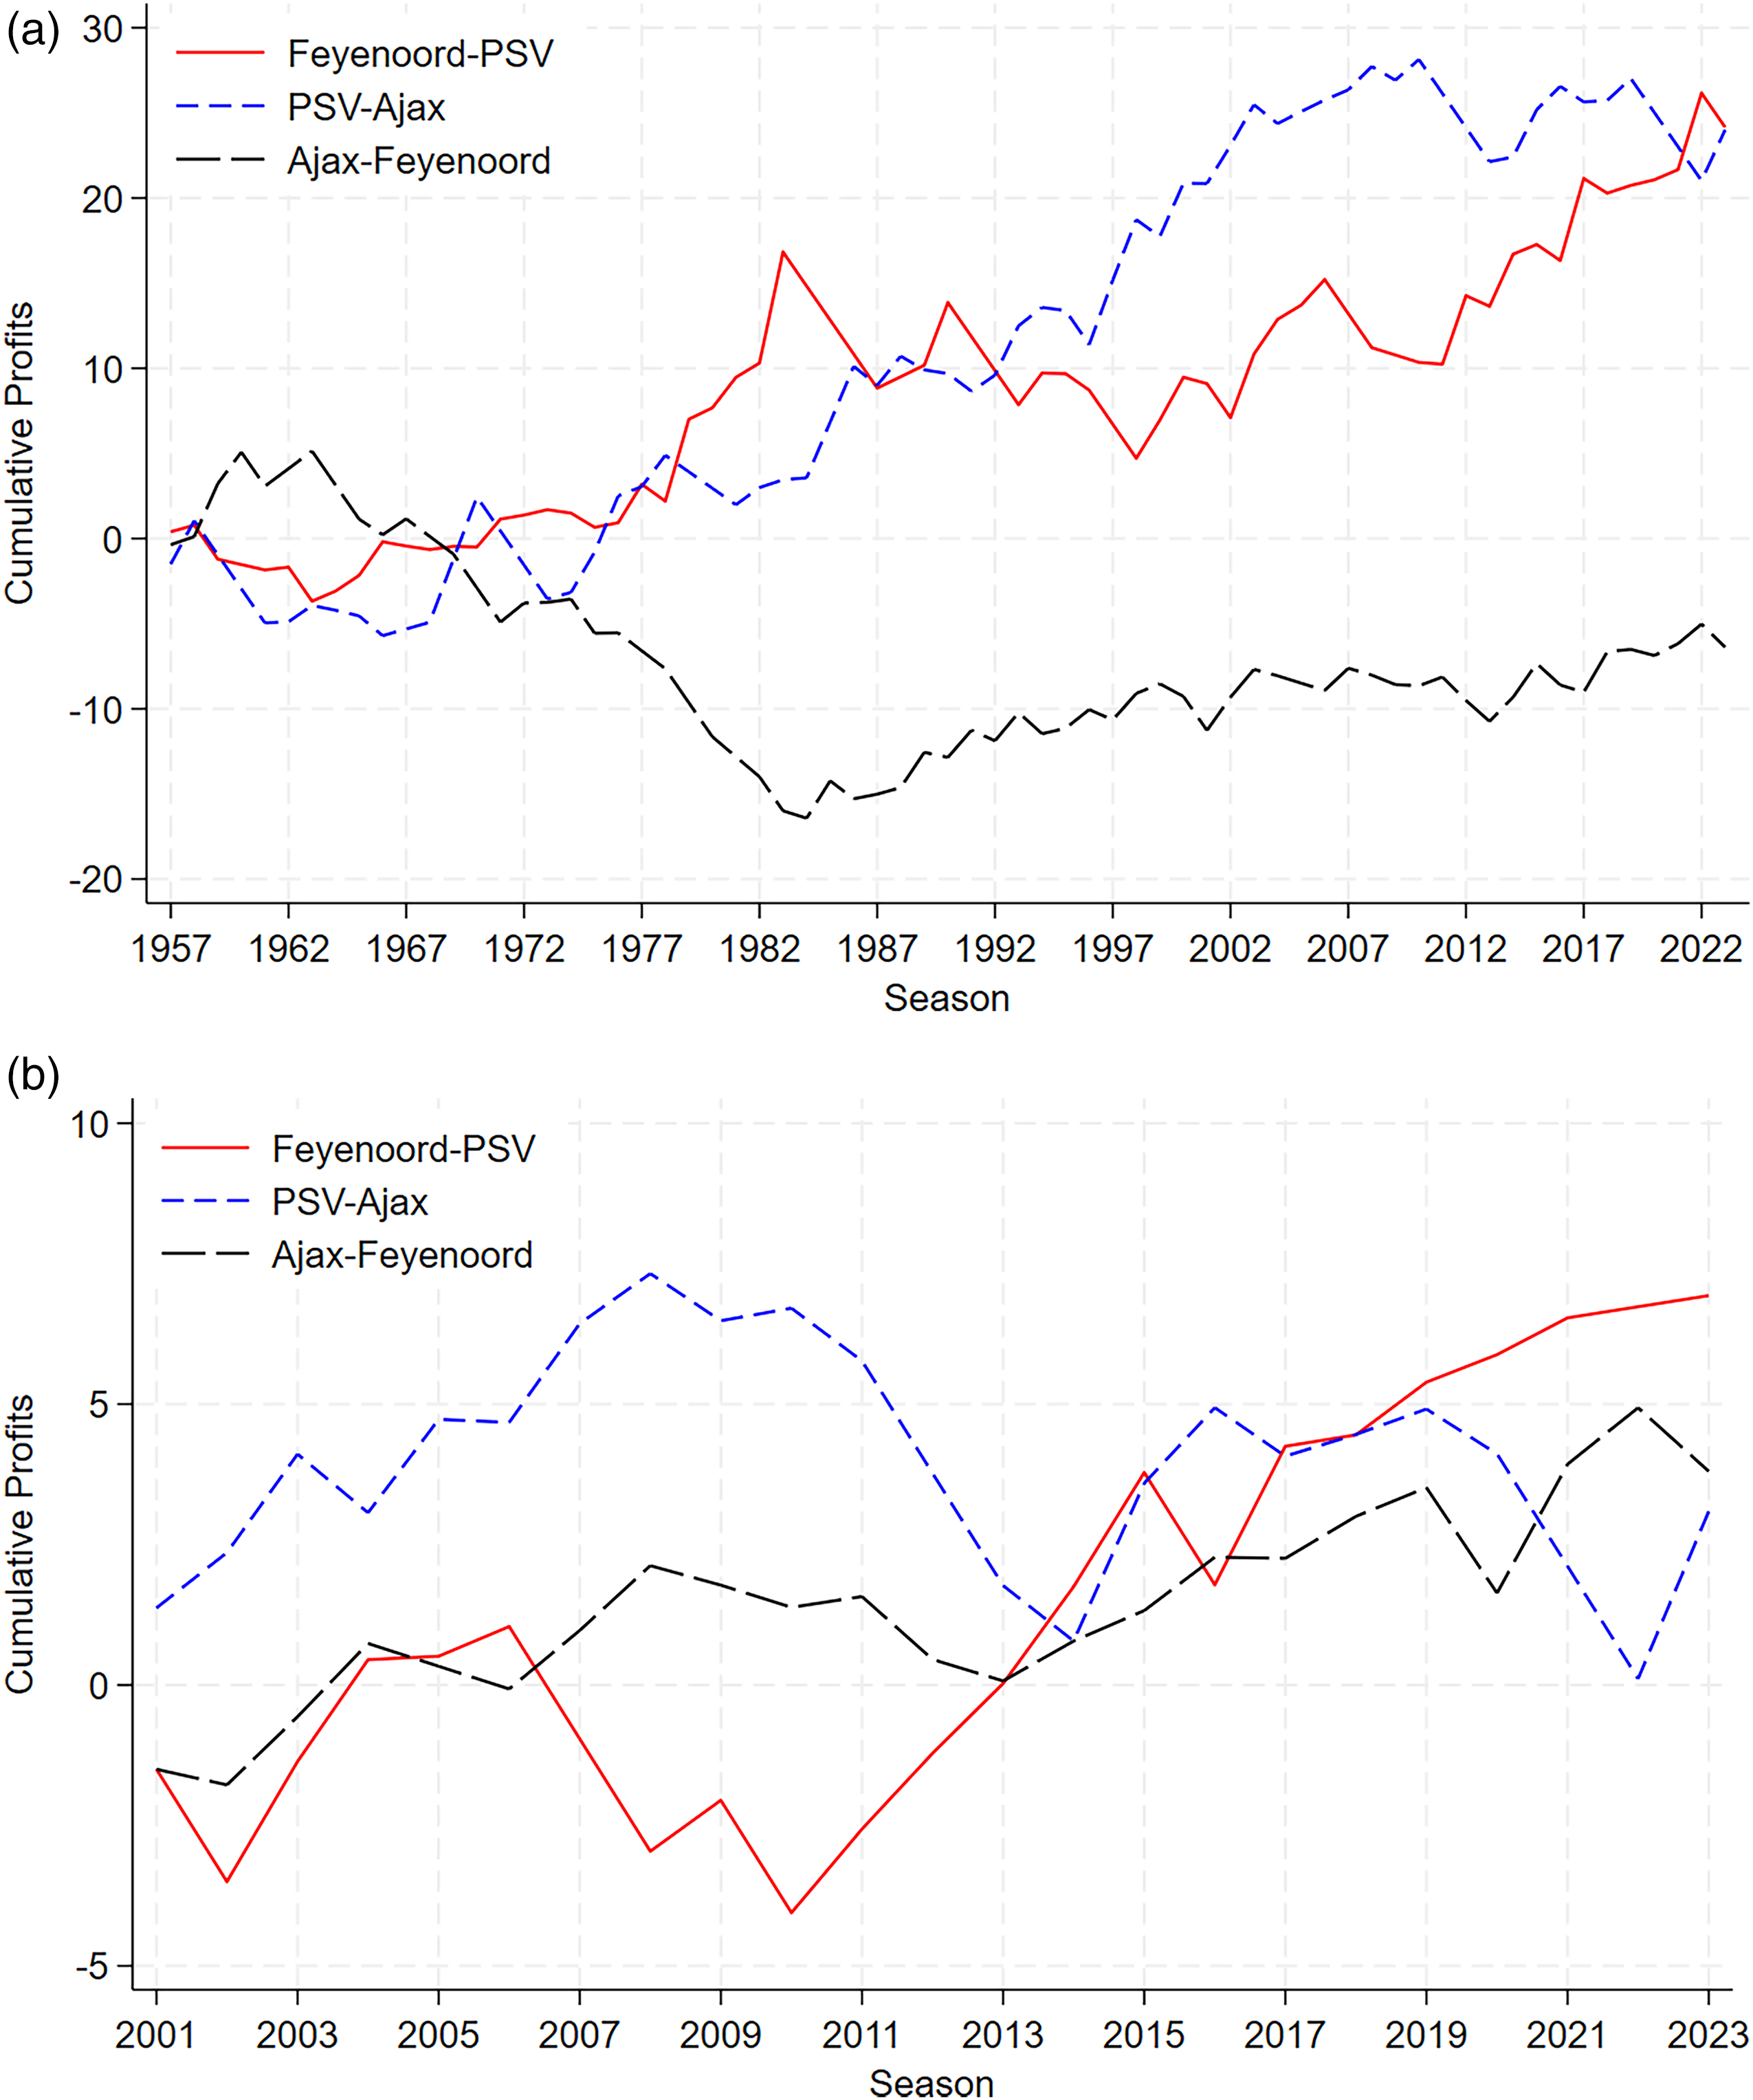
Cumulative profits from betting on the first team in the pair; (a) 1956/57-2022/23 and (b) 2000/01-2022/23 (euro). Note. The line “Feyenoord–PSV” shows the cumulative profits of betting 1 euro on a Feyenoord win every match they played against PSV. Same for betting on a PSV win for PSV–Ajax and betting on an Ajax win for Ajax–Feyenoord. The betting odds in panel a are calculated using estimated win-draw-loss probabilities according to differences in Elo ratings (Elofootball.com). The betting odds in panel b are from bookmakers Interwetten (Football-data.co.uk).
Bookmaker Data
Instead of expected match outcomes as related to Elo ratings actual bookmaker data can be used. 19 Figure 4b shows the hypothetical cumulative profits from betting 1 euro every match on the first team mentioned in each pair. If one would have done this over a period of 22 seasons profits would have been made. The total profit of betting 6 euro every year would have been 15 euro based on bookmaker odds.
What About Other European Leagues?
Top Seven European Football Leagues
According to the UEFA-ranking the current big seven European leagues are England, Spain, Italy, Germany, France, Netherlands, and Portugal. To explore whether the main findings of nontransitivity in match outcomes between the top three teams is a peculiarity of the Netherlands, this section presents an exploratory analysis of the other six leagues in the big seven European leagues. In the past 25 seasons (1998/99-2022/23), the situation has been as follows.
In the English Premier League, Manchester United won nine championships, Manchester City seven, Chelsea five, and other teams won twice (Arsenal) or once (Liverpool, Leicester City). Although this is suggestive of a top three dominating the league, this is, actually not the case over the full time period of 25 seasons. The nine championships of Manchester United were prior to 2014, the seven championships of Manchester City are from 2012 onward. In fact, in the first four of the 25 seasons Manchester City was not yet in the Premier League. In the Spanish La Liga, Barcelona won 12 championships, Real Madrid eight, Valencia and Atletico Madrid two, and Deportivo one. So, Spain has more of a top two than a top three. In the Italian Serie A, Juventus won 11 championships, Inter Milan six, AC Milan four, AS Roma, Lazio Roma, and Napoli one, while in the season 2004/05 no championship was awarded; original winner Juventus was stripped from the title due to the so-called “Calciopoli” sports scandal (see Buraimo et al. (2016) for details). This scandal also implied that for the season 2005/06, the championship title was transferred from Juventus to Inter Milan. And, in 2006, Juventus was forced to relegate played in Serie B in the season 2006/07.
In the German Bundesliga, there is at most a top two but since Bayern München won 19 championships this could also be referred to as a top one. Borussia Dortmund won three championships and other teams, Werder Bremen, Stuttgart, and Wolfsburg one. The French Ligue 1 had nine championships of Paris Saint Germain (PSG), seven of Olympique Lyon (OL) while other teams won twice (Bordeaux, Monaco, and Lille) or once (Nantes, Marseille, and Montpellier). Similar to England, the top two were not competing throughout the full time period. The nine championships of PSG are from 2013 onward, the seven championships of OL are before 2009. In the Portuguese Primeira Liga, Porto won the championship 13 times, Benfica eight, and Sporting CP three while Boavista won once.
The Italian league and the Portuguese league are comparable to the Dutch league in terms of big three teams competing over a long period of time. However, the Italian league has been in somewhat of a distress in recent decades. Since the size and ranking of the league is comparable to the Dutch league, the analysis in the next section is on the Portuguese league.
The Case of Portugal
Table 4 shows the outcomes of the three pairs of matches over the past 25 years in the Dutch Eredivisie and the Portuguese Primeira Liga. There is a clear difference between the two leagues in terms of matches between the big three. In the Eredivisie, PSV outperformed Ajax but while Ajax outperformed Feyenoord, PSV, and Feyenoord were approximately balanced. A clear example of nontransitivity.
Match Results Dutch Eredivisie and Portuguese Primeira Liga: 25 Seasons; 1998/99-2022/23.
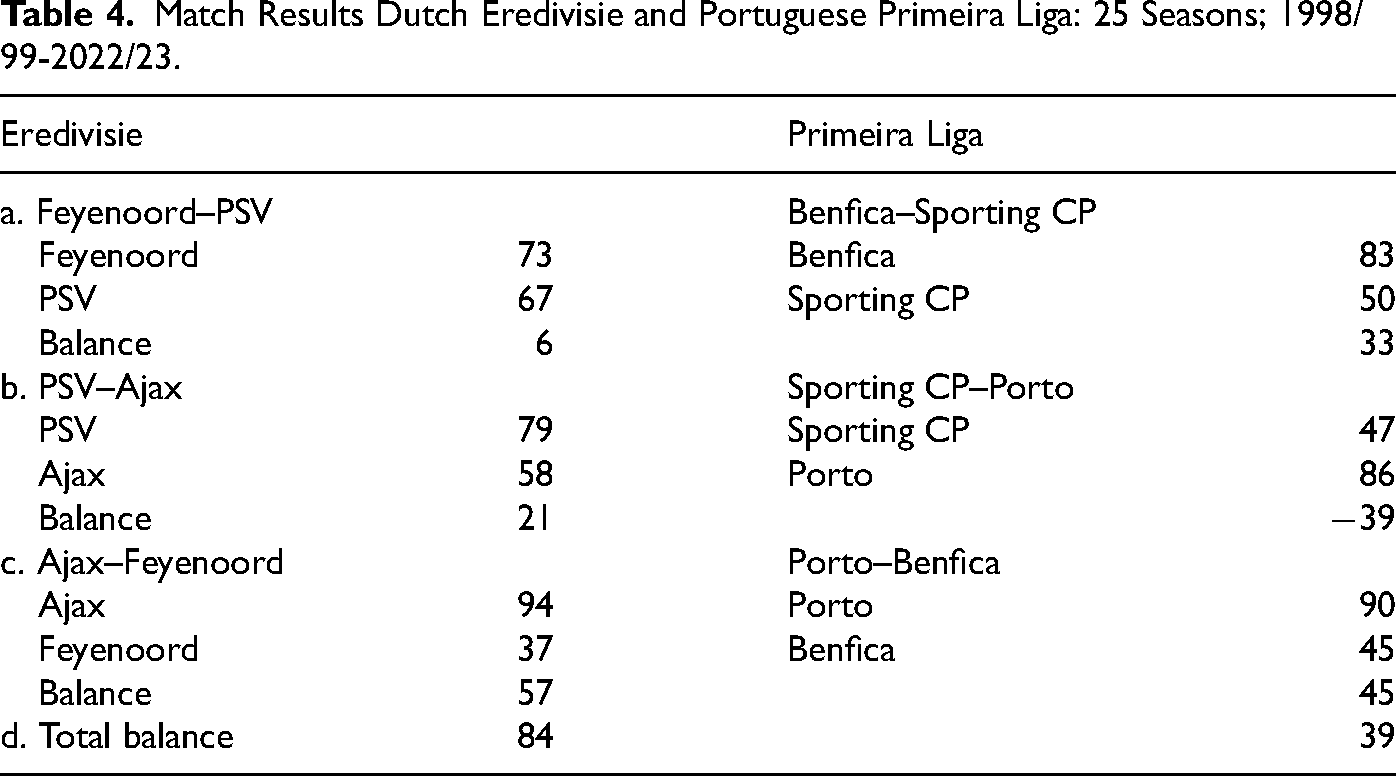
In the Primeira Liga, Porto was stronger than both Benfica and Sporting CP while the point difference between Porto and Sporting CP was about the same as the point difference between Benfica and Sporting CP. Nevertheless, Benfica outperformed Sporting CP when playing against them. This is also suggestive of nontransitivity but less clear as in the Dutch top league. Porto dominated Benfica that dominated Sporting CP. However, Sporting CP did not dominate Porto. Therefore, a nontransitive betting strategy is unlikely to be profitable.
Table 5 shows the parameter estimates of ordered logit models over the past 25 seasons for both leagues. For the Dutch league, the results shown in panel a are very similar to those presented in Table 2. The qualities of PSV and Ajax are significantly higher than the quality of Feyenoord while there is evidence of nontransitivity since the variable match Feyenoord–PSV has a significant positive effect. Panel b of Table 5 shows that the quality of Porto is significantly larger than the quality of Sporting CP but the quality of Benfica is not significantly different. The variable match Benfica–Sporting CP has a large effect but this is not significantly different from zero. If the quality of Benfica is imposed to be zero—equal to the quality of Sporting CP—the match effect becomes different from zero at a 10%-level of significance. The conclusion is that also in Portugal there is nontransitivity of match outcomes for the three main clubs but not as strong as in the Netherlands.
Parameter Estimates Match Outcomes Ordered Logit Models 25 Seasons Dutch Eredivise and Portuguese Primeira Liga; 1998/99-2022/23.
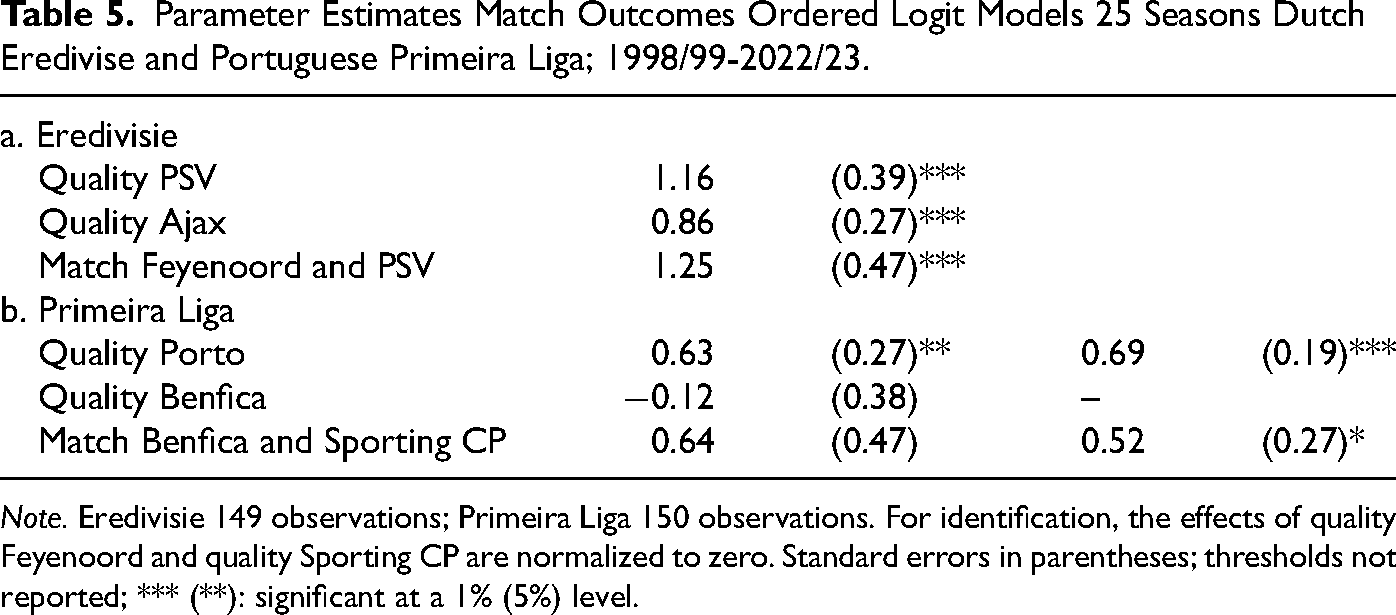
Note. Eredivisie 149 observations; Primeira Liga 150 observations. For identification, the effects of quality Feyenoord and quality Sporting CP are normalized to zero. Standard errors in parentheses; thresholds not reported; *** (**): significant at a 1% (5%) level.
Conclusions
The current paper shows that nontransitive outcomes may occur in real-life games that require time, skills, coordination, and effort. The paper presents an empirical analysis of professional football matches between the top-three clubs in the Netherlands: Feyenoord, PSV, and Ajax. The surprising finding is that for these three clubs, nontransitivity of outcomes occurred over more than three decades. Despite frequent changes in team composition, coaches, and possibly the average ability of the teams, Feyenoord has beaten PSV, PSV has beaten Ajax, and Ajax has beaten Feyenoord more often than the other way around. When considering matches between Feyenoord and PSV, and PSV and Ajax, the prediction would be that Feyenoord is likely to win matches against Ajax, but, in reality, it is the opposite. This nontransitive ordering persists over time and is even stronger when the relative strengths of the teams are taken into account. An exploratory analysis of the Portuguese Primeira Liga shows that also here there is evidence of nontransitivity of match outcomes between the three top teams though not as strong as in the Netherlands.
The origin of the nontransitivity of outcomes between the three long-term football rivals is not clear. Since the nontransitive relations are present over several decades, it cannot be solely attributed to team composition or the preference of a particular coach for a certain style of play. It likely has something to do with the playing style preferred by the management of the club, coaches, players, and supporters. Developing a playing style requires time and is difficult to adjust at will over a short period. While having an identity in terms of playing style is advantageous for players to anticipate each others’ behavior, it also carries the risk that opposing teams will anticipate and adjust their own style accordingly. Perhaps, this is a risk that the three teams are willing to take, considering they play only a few matches against each other. Alternatively, it could be that there is a psychological explanation of nontransitivity. Consciously or unconsciously, players are influenced by past results even though they were not responsible for these results.
Previous studies have shown that nontransitivity may occur in sports outcomes, but the current paper adds to this evidence by demonstrating that nontransitivity may persist over a long time. This finding may be surprising and highlights the importance of considering nontransitive outcomes in forecasting economic events and outcomes. Firms, for example, may encounter unexpected nontransitivity in competition with their main rivals, affecting their strategic decisions. If firm A dominates firm B, which in turn dominates firm C, and then firm C dominates firm A, it creates a complex competitive landscape. In such cases, firm A might choose not to directly engage in competition with firm C, recognizing the likelihood of losing. Similarly, direct confrontation with firm B may not be desirable for firm A’s strategic interests. Instead, firm A may strategically delay its competition with firm B until after firm B has weakened firm C. This strategic approach allows firm A to enter the competition with firm B at a more opportune moment, increasing its chances of success. Even if the origin is unclear, understanding that nontransitivity may exist can be crucial in making informed decisions in competitive industries.
This article shows that nontransitivity in match outcomes is not taken into account when calculating expected outcomes. Betting against the odds based on the nontransitivity of match outcomes would have been profitable. Bookmakers are supposed to use all available information when setting odds but the nontransitivity of match outcomes is a phenomenon that is ignored.
Footnotes
Acknowledgments
The author thanks Martijn Quist for excellent research assistance and Otto Swank, Peter Wakker, seminar participants at LEM (Lille) and two anonymous reviewers for critical and helpfull comments on previous versions of the paper.
Declaration of Conflicting Interests
The author declared no potential conflicts of interest with respect to the research, authorship, and/or publication of this article.
Funding
The author received no financial support for the research, authorship and/or publication of this article.
Notes
Author Biography
J
Appendix A. Nontransitivity in Match Outcomes
To illustrate how nontransitive outcomes may occur this appendix provides two types of examples. The first one is with a fixed distribution of goal scoring; the second one is based on differences in defense, midfield, and attack.
Appendix B. Nontransitivity by Coincidence
To illustrate how nontransitivity of match outcomes may occur by coincidence this appendix provides a numerical example. The website Elofootball.com translates differences in Elo ratings into home win, away win, and draw probabilities. These translations are based on historical match outcomes of matches with the same difference in Elo ratings. For the matches between Feyenoord, Ajax and PSV, these match probabilities, averaged over a period of 25 seasons are given in panel a of Table B1. As shown, the average win probability of Feyenoord playing against PSV was 36% in a home match and 19% in an away match.
Within a season, the probability that Feyenoord obtains more points than PSV is equal to the probability of Feyenoord winning twice (0.36*0.19) and the probability of Feyenoord winning once and drawing once
Panel c of Table B1 shows the probability that by coincidence nontransitivity occurs. For example, the probability that Feyenoord
Appendix C. Bookmaker Data and Elo-Based Match Outcome Expectations
Bookmaker data on football matches are available from season 2000/01 onward. Table C1 provides the descriptive statistics. The first column gives the actual results in terms of cumulative points. Columns (2) and (3) summarize the match predictions according to Elo ratings and bookmaker odds. The last two columns present the surprise points, that is, the difference between actual points and expected points.