
Abstract
This paper investigates the presence of compensating tendencies in the awarding of free shots in hurling. Probit models are estimated to examine whether free shots awarded are determined by the score margin, net free count, and net card count at the time. In addition, the effect of large attendances and home games on these compensating tendencies is captured using interaction effects. Clear evidence of compensating tendency effects if the team is behind on the score margin or behind on the free count are found. When the game is played in front of large attendances, compensating tendencies based on the score margin are amplified. In contrast, there is no evidence of a home team bias in compensating tendencies based on the subset of games played at nonneutral venues. Although efforts should be made to minimize the compensating tendencies identified, administrators should tread carefully because the direction of the compensating tendencies are procompetition.
Introduction
The empirical literature on disciplinary sanctions in sporting contests has demonstrated that there are statistical relationships between sanctions and nonrule factors such as home team bias (Price et al., 2012), added time bias (Dohmen & Sauermann, 2016), and favoritism toward high-status clubs (Bose et al., 2022). This literature has grown substantially since 2020 because of the natural experiment provided by the Covid-pandemic and the absence of spectators from venues (Leitner et al., 2023, and the references therein). Within the non-Covid strand of literature, there is evidence that officials display compensating tendencies, such as adjudicating in favor of the individuals or teams behind on the scoreboard (Moskowitz & Wertheim, 2011; Noecker & Roback, 2012; Price et al., 2012). There is also evidence that officials compensate for their own previous calls (Anderson & Pierce, 2009; Chen et al., 2016; Schwarz, 2011). As with the literature concerning the absence or presence of crowds, the rules do not specify that sanctions should be determined by in-game dynamics such as the state of the scoreboard, but the empirical literature finds evidence that this is not the case.
The primary purpose of this paper is to add to the empirical literature on the relationship between disciplinary sanctions and nonrule factors using data from hurling. Hurling is the national sport in Ireland and is one of the world's fastest field sports (Collins et al., 2022). It is a sport that is predominantly played in Ireland although participation and interest extend to many other parts of the world. This paper utilizes data collected from all 75 hurling games across three seasons, 2016-2018, of the All-Ireland Senior Hurling Championship. To explore the evidence on compensating tendencies, this paper examines the relationship between the awarding of a free shot at a given point in the game by the referee and the difference in the score margin, net free shots, and net disciplinary cards up to that point.
Using hurling to examine compensating tendencies can add to the existing literature in a number of ways. The game is characterized by a large volume of scoring, with a substantial proportion coming from free shots. Thus, the awarding of a free shot is of more importance in hurling relative to other sports. In 2022, the average number of total points per game was 53.5, and 28.6% of this number came from free shots. In comparison to basketball, where similar research questions have been examined (Anderson & Pierce, 2009; Noecker & Roback, 2012), only 16% of scores came from the free throw line in 2022-2023. Furthermore, as a consequence of the high volume of scoring in hurling, the relative position of the teams on the scoreboard (ahead/tied/behind) also changes frequently. These features can lead to a richer data set for examining the presence of compensating tendencies, particularly with respect to the scoreboard.
The fluidity of the game and frequency of scoreboard changes reflects other respects that provide a useful setting for explaining compensating tendencies. Turnovers of possession in hurling for example occur on a much more regular basis in comparison to other sports. In 2022, there was an average of 126 (re)starts per game across a 70-min period, the duration of a hurling game. Additionally, hurling is unlike many other sports which are characterized by offensive and defensive passages of play, and where it is common to have a nondiscretionary turnover rule of position, such as a shot clock in basketball or downs in American Football or tackles in rugby league. In contrast, in hurling, players can perform offensive and defensive roles within the same passage of play. Furthermore, for much of the game the ball is in-flight with few extended stoppages. The only break in the game is for half time (after 35 min plus injury time). There are no time outs to allow for coaches to communicate tactics within each half of the game. The speed, fluidity, and unstructured nature of the game therefore means that the one referee and 30 players (15 players on each team) are likely to experience little difference in the in-game dynamics other than the scoreboard.
In addition to examining evidence of compensating tendencies in a novel sporting context, this paper provides other important contributions. First, the set of games that will be examined allows one to cast a different light on the issue of home bias in explaining disciplinary outcomes. This is possible because approximately half of the games in our data set are played at neutral venues. Thus, a comparison of nonrule explanations of free shot awards between neutral and nonneutral venues can be carried out. This stands in contrast with virtually all of the literature that examine the relationship between sporting contests and disciplinary sanctions, that is based on data where one team is at home, for example, American football, baseball, basketball, rugby, and soccer. Second, as the data set has information on attendances, it provides for a different perspective to be put forward on the mass psychology explanation (Garicano et al., 2005; Ponzo and Scoppa, 2018; Reade et al., 2022), postulated to cause these compensating tendencies. Third, the question of whether there is a bias toward stronger teams can also be investigated (Bose et al., 2022), given that the data set also has a variable which measures the relative strength of the hurling teams.
Literature on Compensating Tendencies in Sports Officials
Some sports generate natural field experimental settings where it is easier to identify the compensating tendencies in the decisions of officials. Baseball and cricket are two good examples because the decisions are primarily about the position or trajectory of the ball and player behavior is not important. In recent decades, the introduction of technology has made it possible to identify errors in the decisions of the officials. Moskowitz and Wertheim (2011) examine 1.15 million called Major League Baseball pitches. They establish a base error rate of 14.4%. They then show a range of systematic statistical deviations from this error rate, including two compensating tendencies. One is the finding that the errors made by umpires favor the player behind in the count. The second compensating tendency is where umpires are more likely to make errors in favor of a team that had a number of recent calls go against them. In a separate study, Chen et al. (2016) also find compensating tendencies in the decisions made by baseball umpires, as well as by asylum judges and loan officers. Sacheti et al. (2015) used data from Leg-Before-Wicket (LBW) calls in 1,000 test cricket matches to examine whether umpires favor home teams in their decisions. The results pointed to evidence to suggest that this was the case and furthermore, that the bias was eliminated with the introduction of neutral umpires. A similar approach to measuring errors and establishing biases can be found in Adie et al. (2020). The authors find that cricket umpires err on not ending a player's time at the crease in LBW calls.
Research on compensating tendencies is also common in basketball. Price et al. (2012) use play-by-play data on five seasons of NBA and compare the rate at which the referee decides the ball must be turned over (mainly traveling violations and offensive fouls) with the rate of turnover by players (mainly bad passes and lost balls). They find that the difference between the former and the latter turnovers favor the home team. They also find additional compensating tendencies in that the difference favors the team behind in the game and the team behind in a playoff series. They group all these biases under the term proleague bias and attribute them to the officials. Anderson and Pierce (2009) examine the pattern of foul calls for 365 NCAA basketball games during the 2004-2005 season. They find that officials are more likely to even out foul calls during the game as well as displaying a bias against visiting teams and leading teams in calling fouls. Noecker and Roback (2012) distinguish between the types of fouls, that is, offensive, personal, and shooting. They argue that offensive fouls are hardest to call and therefore allow the referee greater discretion. They find evidence to support a relationship between foul type and foul differential, that is, there is a tendency to compensate for teams that are behind in the foul count. They also found that the rate at which fouls are called, on the away team, diminishes as the lead of the home team increases.
There is some research on compensating tendencies in other sports. Examining awarded penalty kicks from over 40 seasons of data from the German Bundesliga, Schwarz (2011) finds evidence of a compensating tendency in that there are more games with two penalties, where one is awarded to each side, than is forecast to happen by chance. Schwarz compared the actual awards against a Poisson distribution that characterizes the awarding of penalties but did not consider decisions not to award penalty kicks because the data were not available. Graham and Mayberry (2016) examined the case of water polo and find a bias against the winning team in calling fouls. The magnitude of this bias also tended to increase over the course of a game. Like Noecker and Roback (2012), the authors distinguish between foul types. They find that losing teams in water polo benefitted by an increase of up to one-third in defensive foul rates but not in offensive foul rates. They also find that fouling rates differ by the type of competition, a result that Adie et al. (2020) similarly found in cricket.
There is a strand of literature on home-bias in soccer that examines compensating tendencies in time keeping. The decision involves the time that is added at the end of each half of a game for exceptional stoppages during normal time and the subsequent amount of added-time that is awarded at the discretion of the referee (Garicano et al., 2005; Butler & Butler, 2017; Dohmen & Sauermann, 2016). The rules of the game specify that the referee should add time for injuries, substitutions, and disciplinary issues (red and yellow cards) but it does not specify the amount of time to be added for each item. Controlling for these events, the literature occasionally finds that referees add more time when the home team is behind at the end of normal time (when the referee is deciding how much time to add). This bias tends to be labeled home bias and grouped with a range of literature that shows that the home teams receive other types of favorable treatment from officials, for example, they are less penalized for fouls, or given less yellow or red cards (Downward & Jones, 2007). It is explained in social and psychological terms (Garicano et al., 2005; Ponzo & Scoppa, 2018; Van de Ven, 2011), with social pressure coming from the volume of home fans. This literature expanded with the advent of the Covid-pandemic where fans were excluded from venues. Regarding disciplinary outcomes, the literature found the gap between home and away team sanctions to decline in the absence of crowds (Reade et al., 2022). This literature does not however examine compensating tendencies per se.
The introduction of technology for in-game and post-game monitoring of refereeing decisions has been a recent phenomenon. Some of these efforts, Video Assistant Referee (VAR) and Last Two-Minute (L2M) reports, are worth examining as they illustrate the difficulties involved for sports administrators and researchers. Video Assistant Referee facilitates in-game identification of clear and obvious errors by the on-field officials in particular situations, that is, potential and actual penalty kicks and for dismissal offences anywhere on the field. Video Assistant Referee does not make a judgment call on every decision by the officials. Allowing for these limitations, the advent of VAR has allowed researchers to question conventional wisdom that was based on evidence from the pre-VAR era. A recent study from Holder et al. (2022) finds no difference between the distributions of correctly awarded penalty kicks to home and away teams and the distribution of VAR prompted reversed penalty kicks decisions. The home team gets more correctly awarded penalty kicks, but they also get more incorrectly awarded penalty kicks that are subsequently overturned. This suggests there is no referee bias. Bose et al. (2022) use post-game monitoring data collected by a private company examining refereeing decisions on goals and penalties in the German Football League. Each decision is classified as correct, incorrectly awarded (type I error), or incorrectly denied (type II error). They find that referees exhibit a bias toward higher status clubs through fewer type II errors.
Last Two-Minute reports in basketball provide a similar partial analysis of the calls of the officials. In the case of L2M reports, the monitoring is limited to the last 2 min of a game using recorded footage of the game. These reports cast an expert opinion on every call, and many noncalls, 1 in the last 2 min. Where these errors are related to nonrule factors then official bias is said to exist. Mocan and Osborne-Christenson (2022) examine the relationship between these errors and unchanging player and official characteristics such as skin color. Pelechrinis (2023) also tests for racial bias and “star” player status but primarily examines the changing team and player characteristics of home versus away using pre-Covid data. Gong (2022) examines the extent of potential home-bias using L2M reports including data from the Covid period where fans were absent from venues. Both Pelechrinis (2023) and Gong (2022) note the importance of the “correctness” of the data in L2M reports. Only in different subsets of errors do Gong (2022) and Pelechrinis (2023) find home bias, that is, loose-ball noncalls and technical personal fouls, respectively. Gong (2022) finds almost no evidence that the decisions are related to the scoreboard. They point out that while the limited evidence of no referee bias toward home teams is contrary to most prior studies, some of these prior studies did find that such bias was reduced in the fourth quarter, for example, Price et al. (2012). The use of different foul types can also be used with L2M reports as illustrated by Gong (2022) and Pelechrinis (2023). In all cases, the justification is that there is a different level of referee discretion in the calling of some fouls and that this discretion facilitates greater scope for biases to operate.
Dawson et al. (2020) find that the introduction of Television Match Officials in Rugby Union has increased the number of yellow cards given to away teams. They suggest that the finding might be explained as a previous tendency by on-field referees to compensate for potential home bias. This finding is similar to that of Shivakumar (2018) for cricket, who finds that the introduction of technology to cricket has diminished the traditional benefit of the doubt given to batsmen. It is possible that increased monitoring reduced the scope for biases to operate.
To summarize, there is a strand of literature that finds compensating tendencies in the decisions of officials in a variety of sports. In baseball, umpires show a bias toward the player behind in the count. Similar results hold for cricket. Traditionally, the literature on basketball and soccer suggested that there are compensating tendencies in the decisions of the officials. In basketball, there is evidence that teams behind in the free count and score margin, or behind in a series, are favored in fouls where the officials have greater discretion. In soccer, there is evidence of compensating tendencies in the awarding of penalty kicks. There is also evidence that in-game decisions on added-time is influenced by the scoreboard. More recent literature, aided by changes in the way the decisions of officials are monitored and the associated data, casts some doubt on these earlier findings. The primary advantage of recent developments such as VAR and L2M reports is that they allow for the identification of noncalls by officials. A disadvantage, particularly for identifying compensating tendencies, is that the coverage is partial, for example, 2 min from a 60-min game, and therefore cannot identify why the compensation might be occurring.
As can be seen from the above literature review, the research on compensating tendencies comes from a relatively narrow range of sports. Investigating its presence in other sports, for example, hurling, would widen the evidence base in the area. The high volume of scoring, prevalence of frees and rate at which the relative position of the teams on the scoreboard changes in the game of hurling, also make this an interesting experimental setting. This research paper also represents the first attempt to examine official decisions in the game of hurling. Most research using data from this sport has predominantly been on the prevalence of injuries and the development of performance indicators (Collins et al., 2022).
A final recurring theme, in the traditional and newer literatures, is the role of official discretion, or “epistemological privilege” in the words of Collins (2010). Much of the literature cited above distinguishes between the types of official decisions on the grounds that the greater the scope for discretion then the greater the scope for biases to manifest. In hurling the awarding of free shots remains fully within the discretion of the referee, where the referee does not have to explain the reason for the award, and none of the decisions to award a free shot can be overruled by another official. The now general widespread use of technology in sports to review decisions made by the referees makes hurling, which still retains a high level of “epistemological privilege,” an interesting case study.
Data and Methods
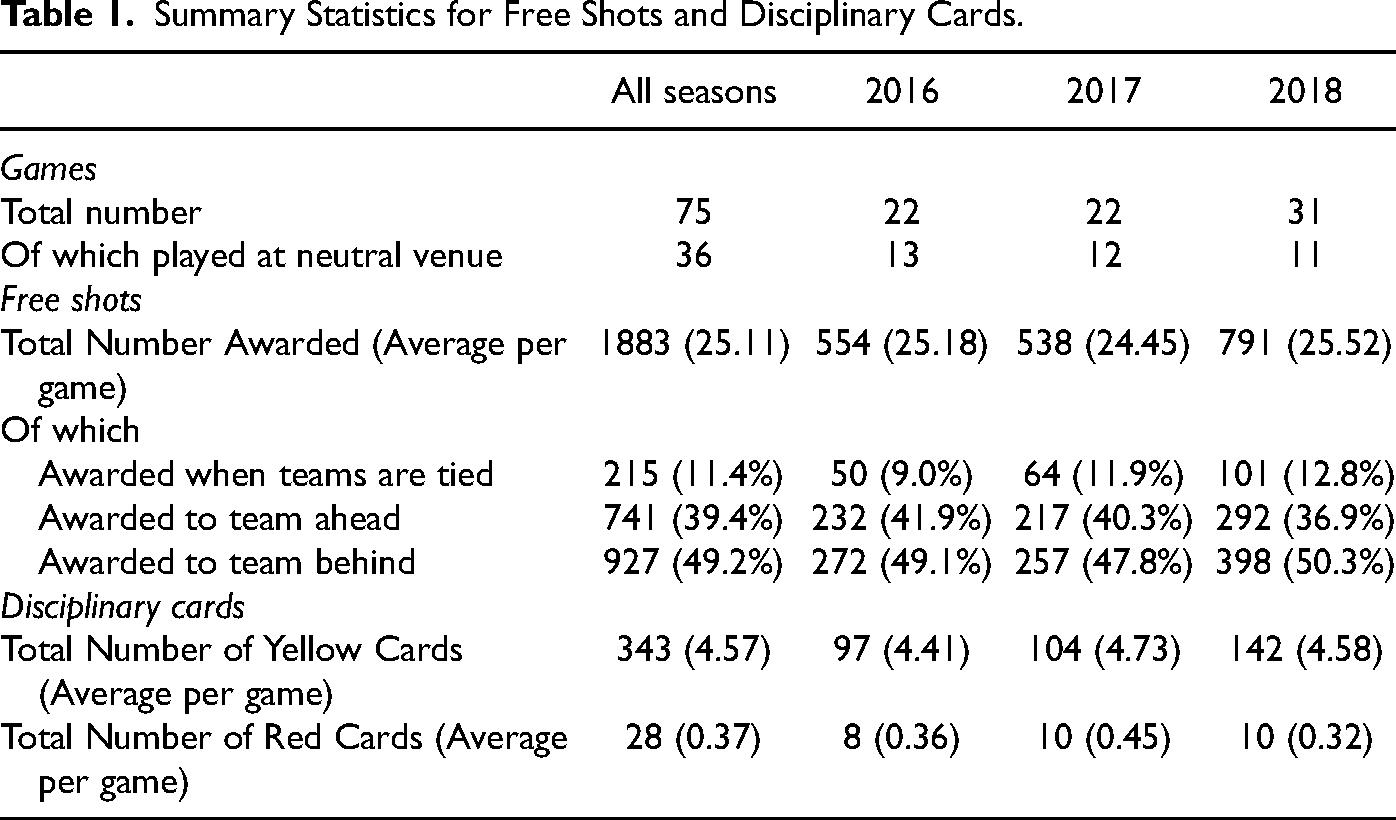
This study examines evidence of compensating tendencies in the game of hurling. Hurling is governed by the Gaelic Athletic Association (GAA), an amateur sporting and cultural organization within Ireland. The highest level of the game involves county hurling teams, a geographical unit within Ireland, competing for the All-Ireland Senior Hurling Championship title. The data that are used in the analysis are based on all of the games played in the All-Ireland Senior Hurling Championship across three seasons, 2016-2018. A total of 75 games were played in these three seasons (see Table 1). There are no officially collected data available for Gaelic games and consequently the data were collected by viewing the recorded footage of each game that was made available through the GAA. The data are therefore novel and are not available from other sources.
Summary Statistics for Free Shots and Disciplinary Cards.
The primary focus of analysis is on the awarding of free shots for foul play, decisions which are made by the referee under GAA Official Guide Part 2, Rules of Control, 1.2 Duties of the Referee, (vii). As the rules do not require the referee to explain the type of foul, or the player that they are penalizing, this information is not available. Additionally, as previously stated, the referee's decision is final, with no official routes to overturn the awarding of a free shot, for example, reviews or official challenges. There are other officials who assist the referee in a game by signaling when the ball leaves the field of play. One at each side of the longer sides of a rectangular field (linespeople) and two at each end of the field where the scoring zone is located (umpires). In the awarding of a free shot, the referee may consult with these officials, but it is a rare occurrence, and it is not required by rule.
The referee for each game is selected from a panel of 10–15 referees. The panel is selected by the National Referee Development Committee. These referees are deemed to be the best referees in Ireland. The pathway for progression to the national panel requires the individuals to have a prerequisite number of games at a range of regional levels of the game. National referees will have previously taken control of intercounty games at provincial level. Provincial referees will have previously taken control of club games within their county. Referees are also subject to annual assessments of their knowledge of the rules and their level of physical fitness. The panel is supported by the provision of seminars and review meetings. At an individual level, each referee has a mentor and an advisor who provides feedback on the referee's performance in each game.
The data set captures a number of in-game variables. Much of the research on official decisions analyses data at aggregate game level (e.g., Dawson et al., 2020; Ponzo & Scoppa, 2018) but using in-game information has the advantage of capturing the presence of compensating tendency behavior in a dynamic way as game factors change (Buraimo et al., 2010). In addition to when a free is awarded, the other in-game information that was collected, includes the time of free awarded, the score differential between the two teams when the free was awarded (i.e., the margin), when a yellow or red card is awarded to either team and the time a yellow or red card was awarded. In every case, it was possible to unambiguously identify, from the recording, the team awarded the free shot and the time it was awarded. In nearly all the cases, the disciplinary cards were also identified. However, for a small number of cards it was not possible to unambiguously establish some element of the sanction because (1) very occasionally the recording does not follow the referee to record off-the-ball activity, and (2) it can be difficult to unambiguously determine visually the exact players that had cards brandished in their direction. Therefore, the official referees’ reports were consulted to ensure consistency of the information.
Table 1 provides descriptive statistics for the data collected. The total number of observations, that is, the total number of free shots awarded by the referee, is 1,883 across 75 games. This is every free from every game in the 2016-2018 championships. The number of matches, and thus the number of frees, in 2018 is higher because of a change in the structure of the provincial competitions (Munster and Leinster hurling championships) from “open-draw” single-game elimination format to round-robin format. 2 Even with this change, the data show a remarkable consistency in the average number of frees, yellow cards and to a lesser extent red cards across the seasons examined. Overall, there is approximately a 10% difference between the free shots awarded to the team that is behind on the scoreboard and the team that is ahead on the scoreboard. Excluding the free shots awarded when teams are level makes this gap larger. In each of the three years, the number of free shots awarded to the team behind on the scoreboard is at least 7% greater than the number awarded to the team ahead on the scoreboard.
Almost half of the games are played at neutral venues, that is, a venue which is not located in either of the counties playing in the match. The proportion is slightly smaller in 2018 because of the move to a round-robin format. Data from games played at neutral grounds facilitates the control of any potential home field advantage effect. A total of 14 different referees officiated these 75 games. The largest number of games covered by one referee is 12, and the smallest number of games is 1. The median number of games covered is 5. Similarly, the sample of 75 games is spread across 14 different venues, with 23 games taking place in one venue, 12 in another and between 1 and 5 games in other venues.
To test for compensating tendencies, the paper will begin by examining the hypothesis that a team has a higher probability of being awarded a free if it is behind on the scoreboard at the time. Probit models can be estimated relating the probability of a team being awarded a foul to the score margin at the time. In previous studies using similar methodologies, the two teams were classified on a home and away basis (Anderson & Pierce, 2009; Noecker & Roback, 2012). As a significant number of games in our data set are played at neutral venues, this classification cannot be used. Instead, the teams are categorized using relative team rating Elo scores (Elo, 1978; Reilly, 2022), which are updated at the beginning of each game.
3
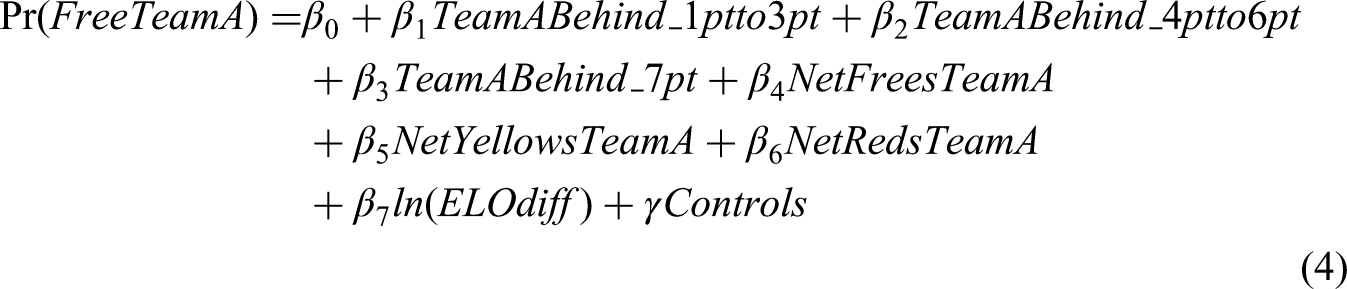
This variable has previously been used by Kneafsey and Müller (2018) in their analysis of the factors affecting the probability of the favorite team winning a GAA Senior Hurling or Senior Gaelic Football game, where the favorite is based on pregame Elo ratings. In our study, the team with the better Elo rating is defined as Team A and the other team as Team B. The margin is then defined as Team A score minus Team B score at the time a free shot is awarded. This definition is applied consistently across all the games in the sample. The basic estimation model is thus as follows:
Summary Statistics of Model Variables.
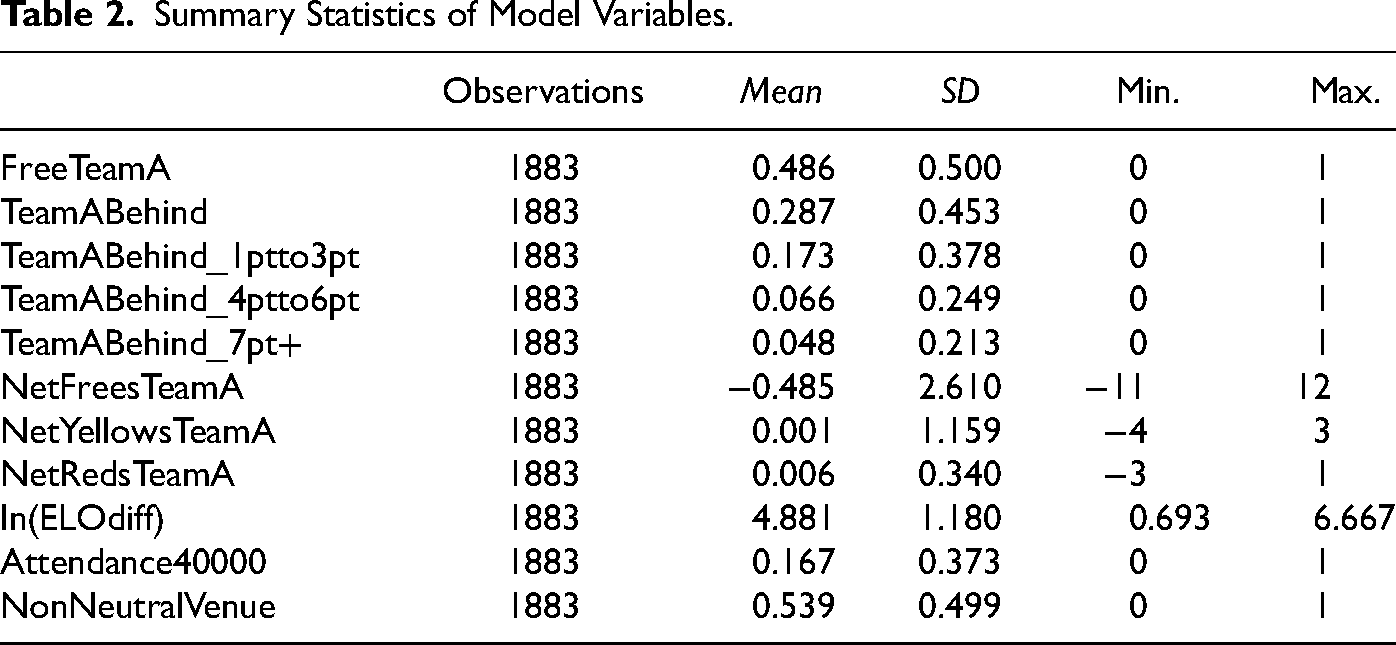
Equation (1) examines the simple compensating tendency hypothesis that being behind on the scoreboard increases the probability of being awarded the next free. A further hypothesis that could be examined is whether this effect (if present) is nonlinear, that is, if it differs by the actual margin which Team A is behind by. Table 2 displays descriptive statistics for dummy variables if Team A is behind by between 1 point and 3 points, between 4 points and 6 points or 7 points or more. These values were chosen based on the scoring rules in hurling and particularly the fact that a goal in hurling is worth 3 points. One might expect that a bigger margin will have a greater positive effect on the probability of a team being awarded the next free, relative to a smaller margin. The estimation model in this instance is given as follows: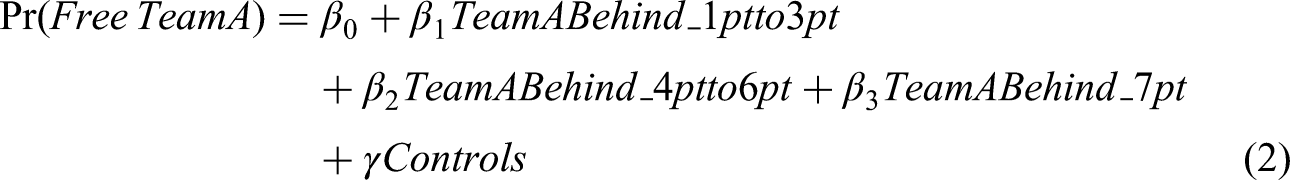
A similar logic can be applied to the awarding of yellow and red cards, that is, the relative disciplinary scoreboard. It is plausible that the cumulative net difference in yellow (NetYellowsTeamA) or red cards (NetRedsTeamA) could influence the decision to award a free as the game progresses. Although the positive mean values in Table 2 suggest that referees tend to award more yellow and red cards on average to the stronger team, in both cases, the values are not statistically significantly different from zero (t = 0.01, p = .992 for yellow cards and t = 0.20, p = .844 for red cards).
The variables described above can be considered dynamic in-game measures as they change as the game progresses. Other static measures can be included to control for game effects, that is, they change for the 75 matches in the sample but not during the match. To account for the possibility that the relative strength of the teams might have an effect on referees decisions, for example, in awarding more frees to the weaker team, the natural log of the difference in ELO ratings (ln(ELOdiff)) is included as a control (Kneafsey & Müller, 2018). The extended models based on equations (1) and (2) can therefore be written as follows: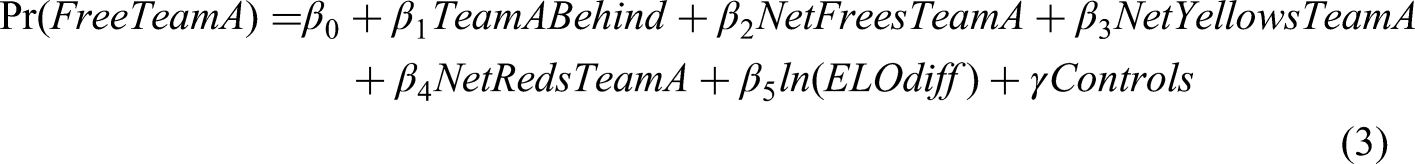
One can also test for the partisan influence of crowds by examining whether differences exist between neutral and nonneutral venues. The influence of home support on referees’ decisions is well-documented as already outlined in the literature section. Similar to above, differences in compensating tendencies between neutral and nonneutral venues can be tested by including an additional interaction variable to equation (3), βTeamABehind*NonNeutralVenue. A significant coefficient on this variable would suggest a significant difference exists, with a positive and significant coefficient implying that being in a nonneutral or home venue (for one of the teams playing) amplifies the compensating tendency effect.
Given that slightly less than half of our games in our sample are staged at nonneutral venues, it is instructive to present descriptive statistics for this subset of data. Of the 1,015 frees awarded in the 39 nonneutral games, 51.2% were awarded to home team and 48.8% to the away team, although this difference is not statistically significant (z = 0.96, p = .339). The mean cumulative net difference in frees for the 39 nonneutral games is equal to 0.175, indicating that the net difference in frees over the course of a game favors the home team, although again the effect is not statistically significantly different from zero (t = 0.53, p = .597). The corresponding statistics for the mean cumulative net difference in yellow and red cards are −0.281 (t = −1.84, p = .073) and −0.004 (t = −0.08, p = .936), respectively. With both mean values being negative, this suggests that over the course of the game, the cumulative net difference in cards is greater for the away team, although the effect is only statistically significant for yellow cards.
Results
Equations (1)–(4) are estimated using probit models. All the models were estimated using cluster robust standard errors with each match defined as the cluster (Bose et al., 2022). Controls (referee, venue, and year fixed effects) were included in each model estimation but in almost all cases, they were insignificant and are therefore not reported. The possibility that the estimated values differed by each half of a match was also investigated but the results did not change in any discernible way. Similarly, additional models were estimated excluding a number of minutes at the beginning and end of the match (5 min and 10 min) but the results remained robust to these alternative data sets. 5
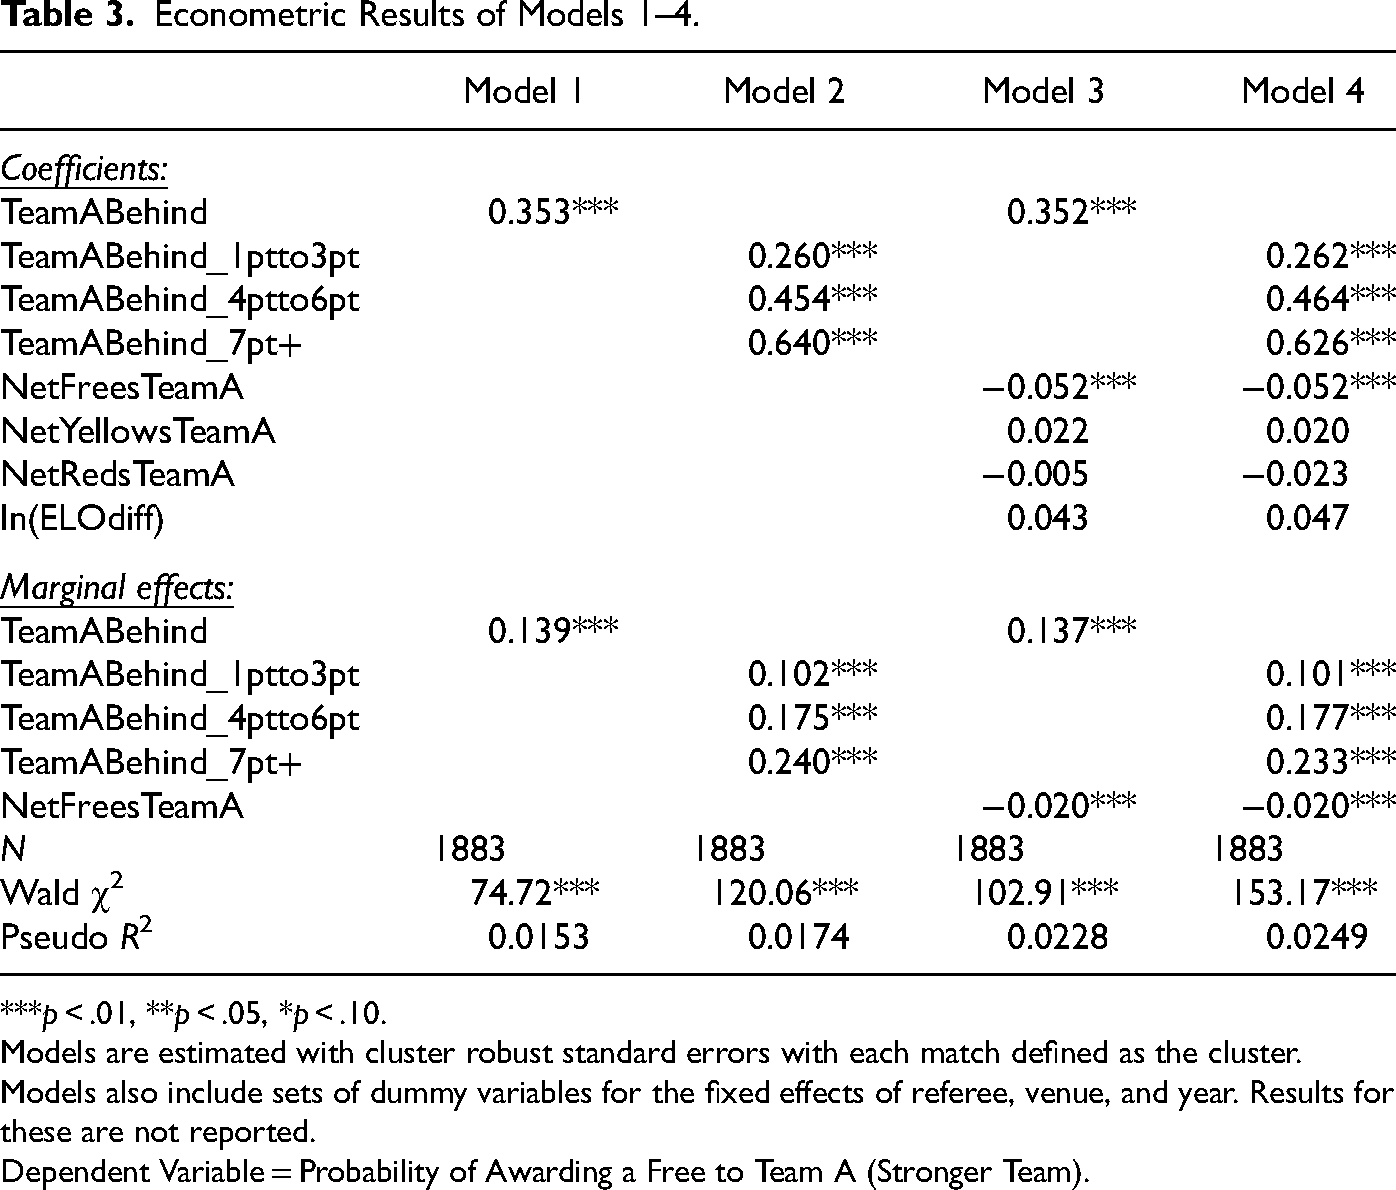
Table 3 reports the estimated coefficients and marginal effects (ME) for significant coefficients from each of the models. The estimates confirm the hypothesis that there exists a positive relationship between the probability of being awarded a free and being behind on the scoreboard at the time. The effect is also consistent, in terms of sign, significance, and magnitude, across all four models as given by the coefficients and MEs. This supports previous research on the presence of this compensating tendency (Graham & Mayberry, 2016; Moskowitz & Wertheim, 2011; Noecker & Roback, 2012; Price et al., 2012). The estimates from models 2 and 4 suggest that bigger the margin on the scoreboard (in terms of Team A being behind), the larger the probability of being awarded the next free, suggesting that the compensating tendency to award frees when a team is behind increases as the margin increases. Such an effect was also found by Price et al. (2012) in their study, while in contrast Graham and Mayberry (2016) found the magnitude of the losing team bias was not affected by the size of the lead. 6
Econometric Results of Models 1–4.
***p < .01, **p < .05, *p < .10.
Models are estimated with cluster robust standard errors with each match defined as the cluster.
Models also include sets of dummy variables for the fixed effects of referee, venue, and year. Results for these are not reported.
Dependent Variable = Probability of Awarding a Free to Team A (Stronger Team).
The coefficient and ME for the cumulative net difference in frees awarded variable is negative and significant, indicating that as the cumulative difference in fouls awarded between Team A and Team B increases, it is less likely that Team A will be awarded the next free. Based on the relative size of the MEs however, the compensating tendency to award frees based on the score differential is much stronger than based on the foul differential. Interestingly, this contrasts with the results from studies using basketball data (Anderson & Pierce, 2009; Noecker & Roback, 2012). This may be because in hurling the scoreboard (and thus score differential) is visible, but the foul differential is not. In basketball, information about the foul differential as well as the score differential is likely to be more salient to the decision makers within a game.
The effect of the cumulative net difference in yellow cards and red cards is insignificant across all models, suggesting that there is no evidence that a free is awarded based on the yellow or red card differential. This may be because yellow or red cards occur on a less frequent basis in hurling matches relative to changes in the foul differential and scoreboard and thus have less of an impact during the game. The relative strength of the teams at the beginning of the match also has no statistical effect on the probability of awarding a free during a match to the stronger team.
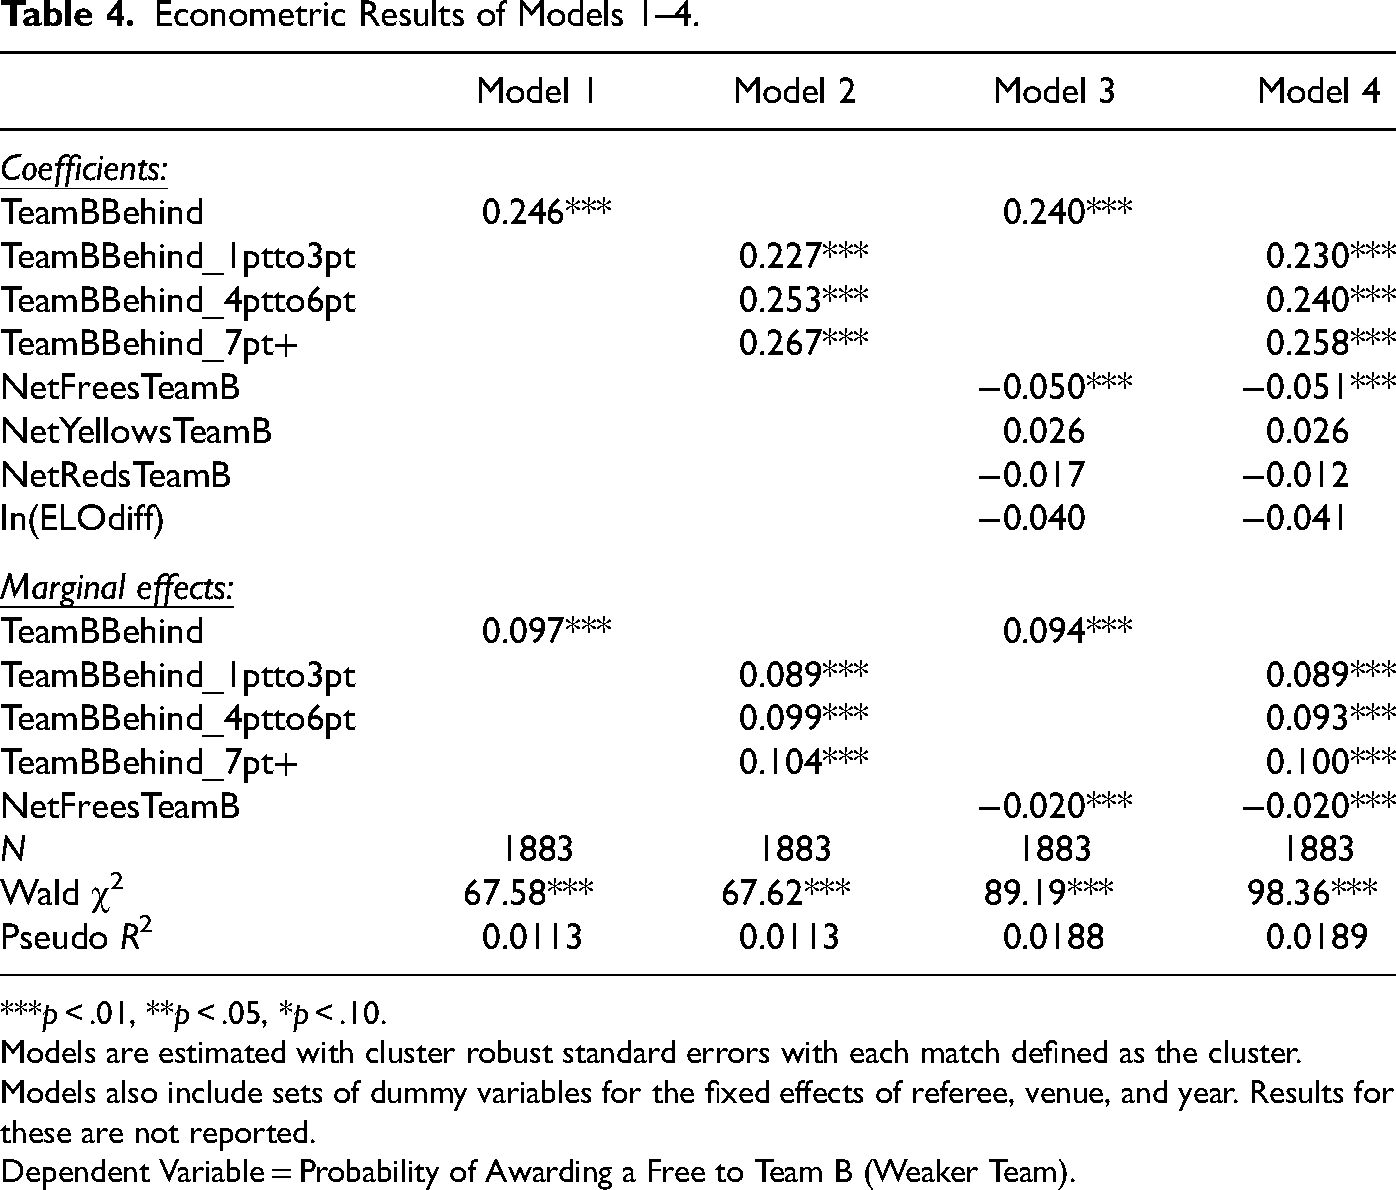
To examine the robustness of the results given in Table 3, each of the models was reestimated from the perspective of Team B, that is the weaker team. The results are given in Table 4. As can be seen, the effects are consistent to those given in Table 3 with positive and significant coefficients and MEs for the team being behind variable and a negative and significant coefficient and ME for the cumulative net difference in frees awarded variable. In models 2 and 4, the compensating tendency to award frees again increases as the margin increases.
Econometric Results of Models 1–4.
***p < .01, **p < .05, *p < .10.
Models are estimated with cluster robust standard errors with each match defined as the cluster.
Models also include sets of dummy variables for the fixed effects of referee, venue, and year. Results for these are not reported.
Dependent Variable = Probability of Awarding a Free to Team B (Weaker Team).
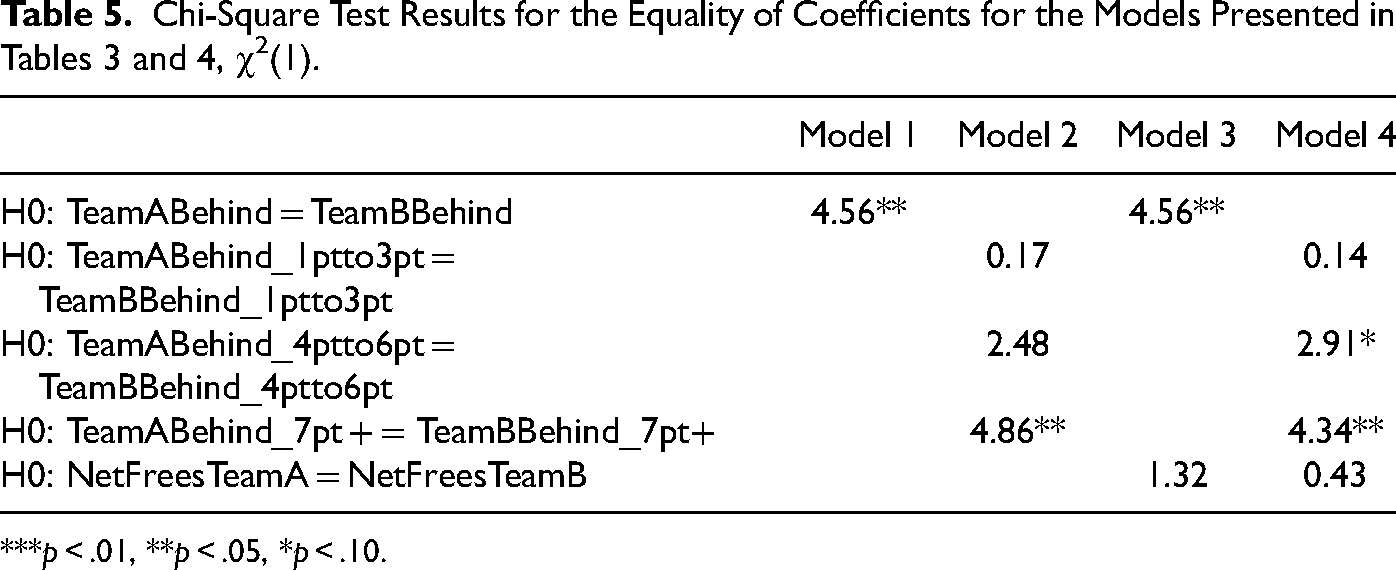
One noticeable difference is the smaller coefficients and MEs in Table 4 for the team being behind variable. Table 5 shows the results from applying a chi-square test of equality between the respective coefficients. These confirm that a statistical difference is present although the underlying effect appears to be only when the stronger team is behind by a large margin (i.e., 7pt+). In contrast, no statistical difference exists in the tendency to award the next free to the team with cumulatively less frees. The evidence in the literature on whether stronger teams are given preferential treatment is mixed (Bose et al., 2022; Butler & Butler, 2017). The research here presents evidence of compensating tendencies toward both stronger and weaker teams, albeit with a slightly larger effect for stronger teams when behind by bigger margins.
Chi-Square Test Results for the Equality of Coefficients for the Models Presented in Tables 3 and 4, χ2(1).
***p < .01, **p < .05, *p < .10.
In summary, there is evidence of a compensating tendency to award frees when a team is behind in the game of hurling. This occurs for both stronger teams and weaker teams, with a slightly larger effect for stronger teams at bigger score margins. In addition to this compensating tendency, the team that has been awarded cumulatively less frees is also more likely to be awarded the next free. These results are generally consistent with the literature with some additional insights on the relative size of the score versus foul differential compensating tendency, the effect that score differential plays as it get larger and how the relative strength of the two teams contributes to the compensating tendencies identified.
By confirming the presence of compensating tendencies in the game of hurling, this paper broadens the range of sports to display these biases. Examining the attribution of the channel of human agency presents greater challenges. As Graham and Mayberry (2016) note, the explanation could lie with the players rather than the referee. The majority of the research is this area attributes the biases to the referee, with the exception of Polman et al. (2020) who found that offensive NFL players foul more when their team is losing and defensive NFL players foul more when their team is winning. Graham and Mayberry (2016) identify the attribution channel by including player state controls based on offensive and defensive plays in their models and found compensating tendency effects to still be present suggesting attribution must be due to the officials. Price et al. (2012) also attribute the biases identified in their paper to the referees. They differentiate between discretionary (or referee) turnovers and nondiscretionary (or player) turnovers. The biases are reflected in the discretionary turnovers and can thus be attributed to the referee.
The methods used by Price et al. (2012), Graham and Mayberry (2016), and Polman et al. (2020) rely on having data that can be accurately parsed for comparisons of subsets of disciplinary sanctions or data that includes player choice information on different positions. Neither is possible to collect in hurling. There is no official statistics on disciplinary sanctions (with data collected manually by the authors for this paper as described above) and the referee does not have to articulate the reason for the awarding of a free shot. Player choice variables for offensive and defensive plays cannot be generated in hurling as it is a fast fluid game with many changes in possession rather than structured offensive and defensive set plays.
It can be argued that the attribution channel is more likely to come through the referee in the game of hurling, because a referee's primary task is to adjudicate. Given the speed of the game, volume of scoring, the frequency of ahead/behind/tied positions, and with players playing uninterrupted 35-min halves focusing on the objectives of the game (scoring, distributing, winning possession, dispossessing, defending), the mental burden for players is relatively high. This makes it more difficult to claim that they are fouling in a manner which is consistent with the compensating tendency identified. Another argument that can be put forward is the GAA, such as many other sports organizations, sell competition, and a revenue maximizing organization will not explicitly discourage officials who promote competitive balance with decisions that lie within their discretion, subject to the condition that they do not undermine the integrity of the sport. A final argument, which applies to most sports as well as hurling, is that referees might have a desire to build goodwill with (losing) teams as they may be refereeing them again in the future (Price et al., 2012).
The results also point to a referee rather than player explanation. For example, although the score differential is displayed at the venue, and thus arguably known to a similar extent by the players and the referee, the foul differential is not. The referee would have more knowledge of this than the players; therefore, the channel of this compensating tendency is more likely to come through them. The results for the size of the losing margin also favor a referee explanation than a player explanation. A decrease in the tendency for winning teams/players to commit fouls as their winning margin gets smaller is perhaps a less plausible hypothesis to explain this result, in comparison to a reduction in the tendency on the referees part to award a free to the losing team as the margin gets closer.
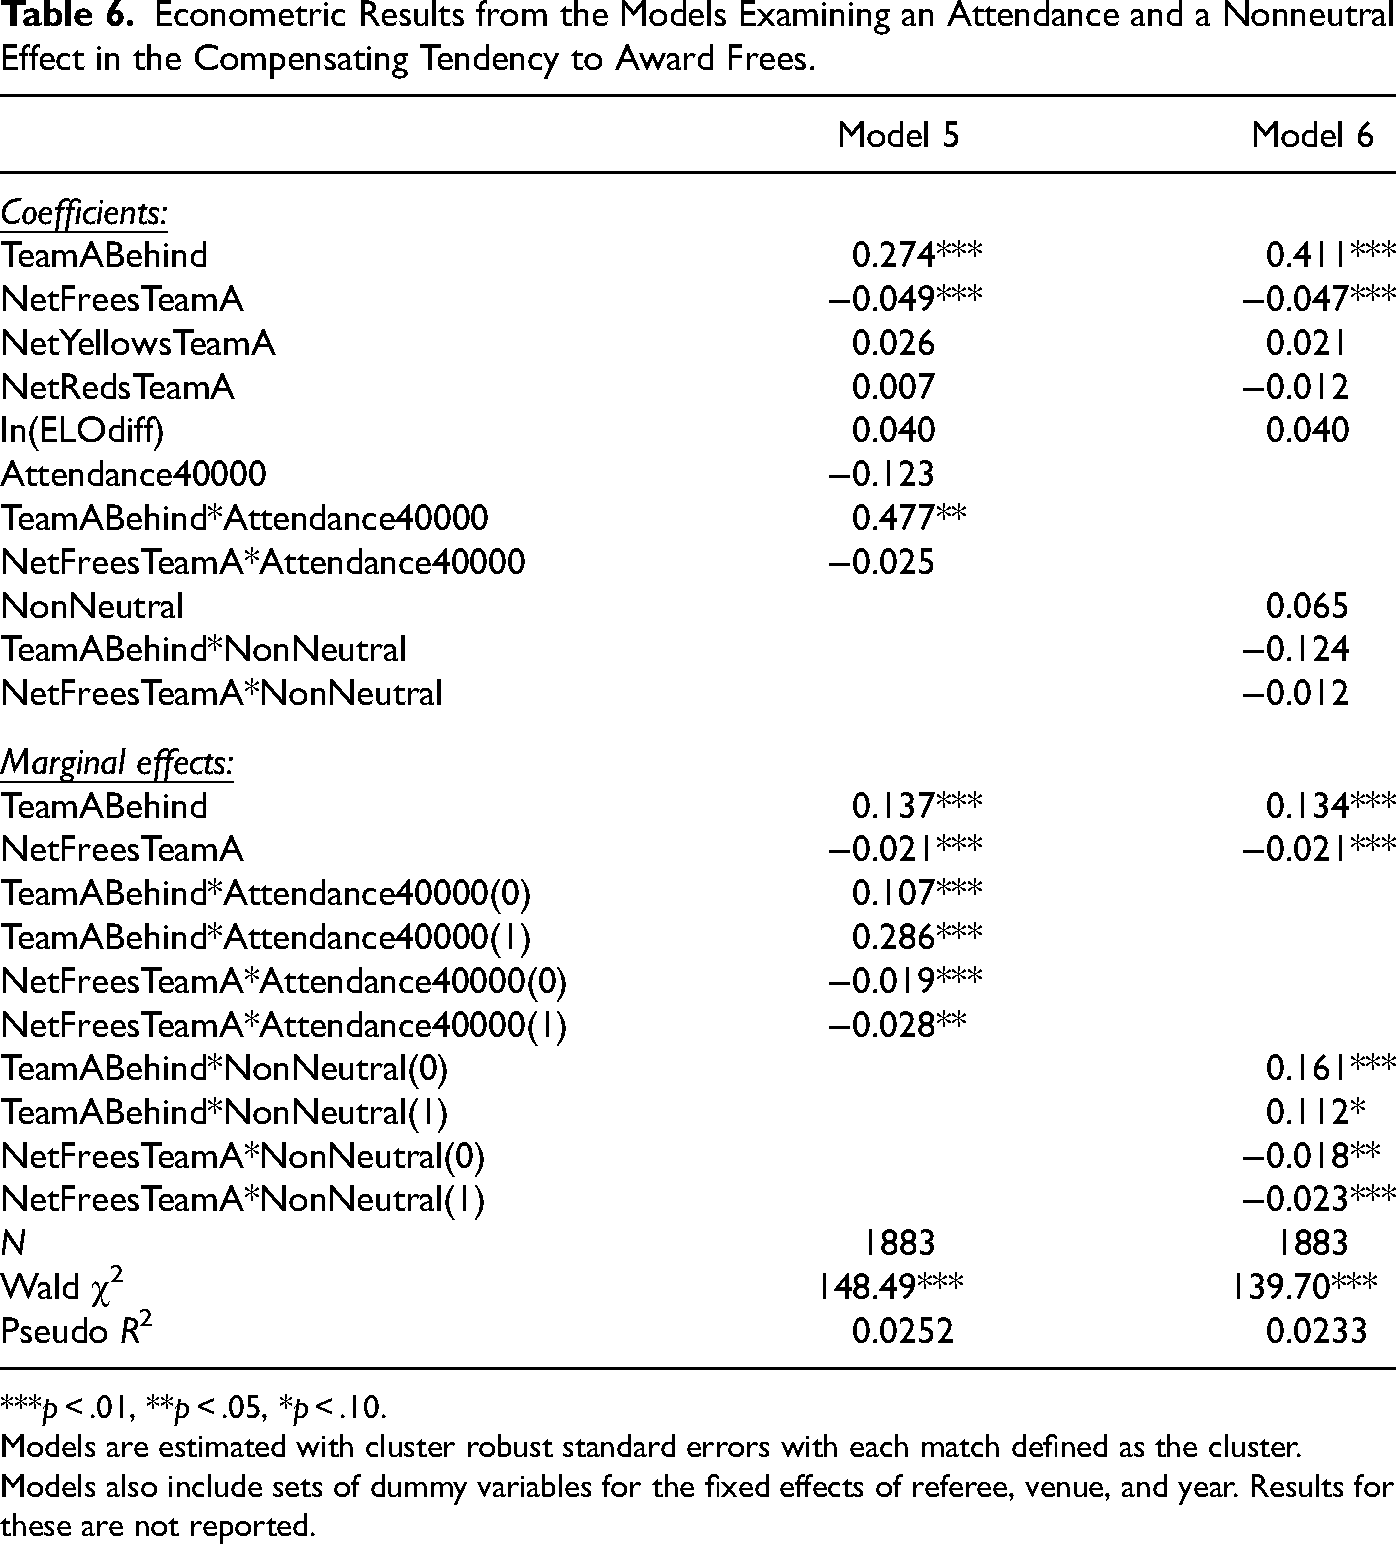
Table 6 presents the results from the models where interaction effects are included to see if differences occur in these compensating tendencies 7 for smaller versus larger attended games, that is, above 40,000 spectators, (Model 5) and for neutral versus nonneutral or home games (Model 6). Firstly, the coefficients and MEs in these specifications are consistent with the estimates in Tables 3 and 4 with both positive and significant coefficients and MEs for the TeamABehind and NetFreesTeamA variables.
Econometric Results from the Models Examining an Attendance and a Nonneutral Effect in the Compensating Tendency to Award Frees.
***p < .01, **p < .05, *p < .10.
Models are estimated with cluster robust standard errors with each match defined as the cluster.
Models also include sets of dummy variables for the fixed effects of referee, venue, and year. Results for these are not reported.
The coefficient on the interaction variable in Model 5 is positive and significant. Therefore, there is evidence to suggest that if a match is played in front of a large attendance, it further increases the probability of a team being awarded a free when they are behind on the scoreboard, versus a match being played in front of a smaller attendance. Thus, a crowd size impact on the in-game decisions may be present with large attendances exaggerating the compensating tendency to award frees when behind on the scoreboard. This finding contrasts to some extent with Downward and Jones (2007). There is no evidence to suggest that there are differences in the compensating tendency to award frees when behind on the free count by attendance level.
The coefficient on the interaction variable in Model 6 is insignificant, implying that if a match is played at a nonneutral or home venue, it has no statistical effect on the probability of a Team being awarded a free when they are behind, versus a match being played at a neutral venue. This suggests that there is no evidence of a difference in the compensating tendency to award frees when a team is behind on the scoreboard between neutral and nonneutral or home venues. Similarly, there is no evidence of a difference in the compensating tendency to award frees when a team is behind on the free count between neutral and nonneutral or home venues. 8
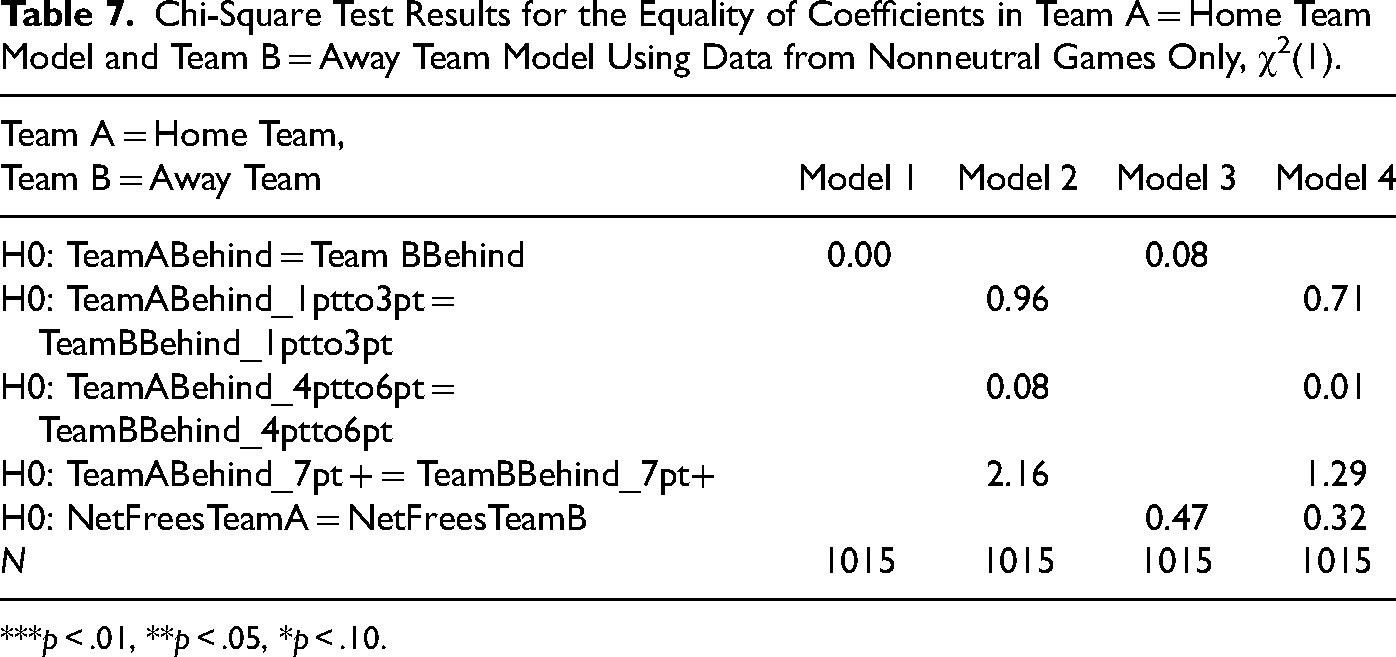
It can be concluded from Model 6 in Table 6 there is no evidence of home advantage in disciplinary outcomes. One can further test this hypothesis using the subsample of matches played at nonneutral venues only. By repeating the results in Table 4 using frees awarded from nonneutral games only (n = 1,015) and designating Team A as the home team and Team B as the away team, one can compare the coefficients from the respective models to see if a difference in the compensating tendency to award frees exists (in a similar way to examining differences in the compensating tendency to award frees between stronger and weaker teams presented in Table 4). Table 7 presents the chi-square test results for the equality of coefficients in both models, with the actual probit estimates excluded for brevity.
Chi-Square Test Results for the Equality of Coefficients in Team A = Home Team Model and Team B = Away Team Model Using Data from Nonneutral Games Only, χ2(1).
***p < .01, **p < .05, *p < .10.
Based on the test statistics in the table, we cannot reject the null hypothesis in all cases, suggesting that the coefficients from the “home team” model are equal to the coefficients from the “away team” model. This provides further support for the finding of no difference in the compensating tendency to award frees when a team is behind if the team is either the home or away team. There is also no difference in the compensating tendency to award frees to the team that has cumulatively less frees if the team is either the home or away team. The fact that a home team bias is not found in this study is in contrast with many of the findings from previous research (Dawson et al., 2020; Ponzo & Scoppa, 2018) although it does support recent research findings from Gong (2022). It could be due to the sport that is being examined, hurling, which may not have the same home team advantages as in other sports. Kneafsey and Müller (2018) did find that home advantage increased the likelihood of a stronger team in winning games in GAA sports, although this analysis was not carried out in relation to disciplinary sanctions. This leads to an alternative conclusion that it is possibly due to the different ways in which home field advantage is evaluated in previous research.
Summary and Conclusions
Using a novel data set constructed from all 75 games across three seasons of the All-Ireland Senior Hurling Championship, this paper investigates whether compensating tendencies are present in the awarding of free shots. More specifically, we examine whether the awarding of frees is related to a team being behind on the scoreboard, the net cumulative number of frees awarded at the time, and the net cumulative number of yellow and red cards awarded at the time. Our results show that the probability of a team being awarded a free shot in hurling increases if the team is behind on the scoreboard and behind in the free count. There is no evidence to suggest that the yellow or red card count has an effect on the probability of a team being awarded a free shot. If a team is behind by a large margin on the scoreboard, the compensating tendency effect is amplified. These compensating tendencies might help explain why approximately one-third of games in hurling are decided by one score or less. This paper argues that the attribution is more likely to come from referees (consciously or subconsciously) rather than players.
The effects are consistent across different model specifications. They are also consistent in terms of sign and significance if the team being examined is the stronger team or the weaker team. There is, however, some evidence that the compensating tendency to award frees is statistically greater for stronger teams especially when they are behind on the scoreboard by a large margin.
When the game is played in front of large attendances the probability of a team being awarded a free shot if the team is behind on the scoreboard increases suggesting a crowd effect reinforces this compensating tendency. In contrast, there are no observable differences in compensating tendencies when games are played at neutral or nonneutral venues. Interestingly, we also find that no evidence of a home team bias in compensating tendencies when examining the subset of games that are played at nonneutral venues. This would suggest that the home bias effect may be a multifaceted phenomenon, its existence depending on the type of decisions or outcomes that are examined. Our findings are more consistent with recent literature showing that the on-field referee may not be the primary source of home advantage in disciplinary outcomes (Dawson et al., 2020; Holder et al., 2022).
These findings on the presence and nature of compensating tendencies in free shot awards in hurling have important implications. Scores from free shots account for between one-quarter and one-third of all scores in hurling. Therefore, any potential biases in the awarding of these free shots can have a sizable impact on the outcome. While we would agree with potential changes that might help reduce this bias, we would suggest that the biases are in the correct direction provided they do not undermine the perception of the fairness. Using the Rawlsian philosophical concept of a “veil of ignorance” one could argue that competitors, who are ignorant of the position that they are likely to find themselves in, would support giving the benefit of the doubt to the team behind in the competition at that point in time. Using the competition (antitrust) law concept of minimizing the cost of errors, it is also possible to argue that compensating tendencies operate in the correct direction. On balance, the cost of an error to the team behind on the score is larger than cost to the team ahead on the scoreboard. Therefore, the benefit of the doubt should go to the team behind in the count. An acceptance of the position that the benefit of the doubt should go to the competitors behind in the count, combined with our finding, might make the job of officials more rewarding. This is crucial to maintaining the delivery of competitions (Giel & Breuer, 2023). Our findings show that the benefit of the doubt is not partisan and, at the same time, errs in favor of keeping the contest competitive.
Supplemental Material
sj-docx-1-jse-10.1177_15270025241245640 - Supplemental material for Compensating Tendencies in Disciplinary Sanctions: The Case of Hurling
Supplemental material, sj-docx-1-jse-10.1177_15270025241245640 for Compensating Tendencies in Disciplinary Sanctions: The Case of Hurling by John Considine, John Eakins, Peter Horgan and Conor Weir in Journal of Sports Economics
Footnotes
Declaration of Conflicting Interests
The author(s) declared no potential conflicts of interest with respect to the research, authorship, and/or publication of this article.
Funding
The author(s) received no financial support for the research, authorship, and/or publication of this article.
Supplemental Material
Supplemental material for this article is available online.
Notes
Author Biographies
References
Supplementary Material
Please find the following supplemental material available below.
For Open Access articles published under a Creative Commons License, all supplemental material carries the same license as the article it is associated with.
For non-Open Access articles published, all supplemental material carries a non-exclusive license, and permission requests for re-use of supplemental material or any part of supplemental material shall be sent directly to the copyright owner as specified in the copyright notice associated with the article.