
Abstract
This paper contributes to the literature examining the impact of large-scale sport events (LSEs) on international tourist inflows from 1995 to 2019. Our proposed method involves the calculation of tourist potential and the analysis of actual-to-potential ratios before and after the event. This approach allows us to measure the effect of LSE on a particular hosting country rather than its average effect. Our findings demonstrate a strong “crowding-out” effect for international tourists, with only four out of 18 LSEs resulting in a positive effect on tourist arrivals in the host country.
Keywords
Introduction
Countries are investing billions of dollars into large-scale sport events (LSEs). 1 For instance, the 2008 Summer Olympics in Beijing cost $42 billion, 2 the 2014 Winter Olympics in Sochi $51 billion, 3 and the 2022 FIFA World Cup in Qatar approximately $220 billion. 4
There is an ongoing debate in the economic literature about the potential positive and negative effects of LSEs on the host country. Although these events are often associated with substantial economic losses, the long-term benefits are the main argument in favor of hosting them. These benefits include the development of material and soft infrastructure, increased awareness of the region/nation as an attractive place for sport and cultural events, an enhanced entrepreneurial climate, and a better public image of the host area (Jakobsen et al., 2013). However, in four out of five cases, the Olympics and the World Cup ran a deficit (Müller et al., 2022).
The benefits of hosting LSEs are often accompanied by potential negative effects, such as increased tax burdens, low government investment effectiveness, high construction costs, and the costs of running facilities after the event (Gursoy et al., 2011; Lorde et al., 2011). Additionally, these events can generate negative social impacts on host communities, including noise, pollution, and damage to the environment. Furthermore, the quality of life in a host community may also be disrupted during the event due to increasing criminal activity and potential conflicts between citizens and visitors (Gursoy et al., 2017).
A common feature of the economics of large-scale events is that ex-ante expectations are more optimistic than ex-post evaluations. Typically, expenditure tends to exceed the original budget, while the revenue-side indicators (such as number of visitors) are rarely achieved (Allmers & Maennig, 2009; Fourie & Santana-Gallego, 2017).
This paper aims to empirically assess the effects of hosting LSEs on international tourist inflows. The importance of foreign tourist arrivals in the context of hosting LSEs is twofold. First, tourist arrivals from abroad can compensate for government expenses associated with creating infrastructure, organizing venues, and providing security. Additionally, tourist spending within the country during an event such as the Olympics or the World Cup creates the export of services, thereby increasing both gross domestic product (GDP) and budget revenues (Fourie, 2011). Second, it is expected that the effects of hosting an LSE on tourist inflows may extend beyond the year of the event, producing a long-term, positive influence due to the area's increased attractiveness (Song, 2010).
When analyzing the effect of hosting large-scale events on tourist inflows, it is important to take into consideration both the positive and negative components of the overall effect. While positive effects may be associated with LSE visitors, negative effects may arise when “regular” tourists refuse to visit due to the event. Potential reasons for this include overloaded infrastructure, sharp increases in accommodation costs, and inconveniences associated with overcrowding or fans’ misbehavior (e.g., noise, crime, and violence). Negative effects can be significant, as demonstrated in relation to the France World Cup in 1998 (Allmers & Maennig, 2009), the Greece Summer Olympics in 2004 (Chasapopoulos et al., 2014), and the Brazil Summer Olympics in 2016 (Rojas-Méndez et al., 2019). Rojas-Mendez et al. provide an additional explanation of the negative influence of hosting LSEs on tourist inflows, citing the declining image of the host country due to media influencing international public opinion (e.g., reporting about insecurity and poverty) as a potential factor that negatively affects intentions to visit the host country.
In this paper, we utilize a comprehensive dataset on bilateral tourist arrivals, which includes data from 100 world's largest destination and origin countries between 1995 and 2019. This dataset allows for an assessment of the impact of hosting large-scale events on tourist inflows, including the Russian World Cup and South Korea Winter Olympics held in 2018.
Due to the abundance of zeroes in the database, we have opted to estimate the augmented gravity-type econometric model with the Poisson pseudo maximum likelihood method (PPML) to obtain an unbiased result. Although the PPML estimation technique is widely used in gravity models of international trade and foreign direct investment, applications to international tourist flows are less frequent. Our estimation results demonstrate a heterogeneous effect of hosting LSEs on tourist inflows.
This paper contributes to the existing literature by applying the concept of potentials to analyze the impact of large-scale events on tourist inflows. Through a comparison of predicted values from the estimated econometric model with the actual figures, this technique enables the calculation of the effect of LSEs on tourist inflows for each LSE individually. This provides more insight into the heterogeneity of the effect of LSEs on tourist inflows as compared to the standard approach, which is to include LSE dummies in the econometric model and thereby estimate the average effect.
This study supports the notion that the positive effect of hosting LSEs on tourist inflows is, at best, moderate. This finding is consistent for both short-term (year of the event) and medium-term (four years starting with the year before the event) effects. While it is true that many tourists visit FIFA World Cups and Olympic games, our research suggests that the “crowding-out” effect of “regular” tourists is strong and often underestimated.
We argue that a net increase in tourist flows due to hosting an LSE is possible, but it is not guaranteed and should be accompanied by effective government policy to attract tourists in the long run.
Related Literature
To date, a substantial number of papers have focused on international tourist inflows in the context of LSEs. A few of these papers have conducted multicountry analyses of the effect of LSEs on tourist arrivals. Song (2010) used a rich panel of 196 countries covering the period 1950–2008, finding that the Summer Olympics have a positive impact on foreign tourist inflows. Analyzing different time intervals before and after the event, Song showed that the impact of LSEs on tourism is immediate but not long-lasting, being limited to four years before and after the event. Fourie and Santana-Gallego (2011), basing their work on the gravity model of tourist flows between 200 countries during 1995–2006, argued that mega-sport events promote tourism, but the gains vary depending on the type of mega-event, the participating countries, and the season in which the event is held. Vierhaus (2019) came to a similar conclusion, showing that the Summer Olympics had a positive effect on tourist arrivals, while FIFA World Cups had a limited influence and the Winter Olympics had no significance in terms of tourist attraction. Rabadi et al. (2016) asserted that tourism gains are most likely realized in the year prior to the event and in the year of the event. Furthermore, they suggest that hosting LSEs during the off-season would not reduce the inflow of regular tourists but bring in an increased number of new tourists associated with the mega-event. Using an extensive dataset of countries, events, and years, as well as advanced methods for providing unbiased results, Fourie and Santana-Gallego (2022) contend that developing countries benefit more from hosting large-scale events. A significant finding from their study was that most of the gain comes from countries in the same region as the host.
A larger set of papers have analyzed the impact of a particular event on tourist inflows. Chasapopoulos et al. (2014) proposed that the 2004 Olympic Games in Athens had a detrimental effect on foreign tourist inflows, attributing this to a crowding-out effect, whereby tourists who had previously gone to Greece did not wish to visit during a time of increased demand. Allmers and Maennig (2009) conducted an analysis of tourist inflows in the context of the France 1998 and Germany 2006 FIFA World Cups and concluded that there is no short-term positive impact from these and comparable events on tourism.
Bondonio and Guala (2011) suggest that the 2006 Winter Olympic Games helped to transform Turin's industrial image and make it an attractive area for tourists. Peeters et al. (2014) report a net positive effect for the 2010 FIFA World Cup in South Africa. Fourie and Spronk (2011) found a significant increase in foreign tourist inflow to South Africa as a result of hosting a sport mega-event, though the ex-ante expectations of the organizers were more optimistic than the ex-post analysis. Fourie and Santana-Gallego (2017) also note that the net effect of the World Cup on the number of tourists depends on the countries that qualify. Baade and Matheson (2016) report that the 2014 FIFA World Cup in Brazil attracted around one million visitors, with a quarter of this increase attributed to the Argentine national team playing in the final match. Baade and Matheson stress that the number and origin of the tourists are greatly affected by the play-off games during World Cups. Rojas-Méndez et al. (2019) observe that the growth in international tourists to Brazil between 2013 and 2016 was slower than the average in South America for the same period.
Nishio (2013) reported a positive effect on tourist inflows for New Zealand, which hosted a range of international sport events between 1983 and 2005, such as the 1990 Commonwealth Games, the 2000 Yachting America's Cup, and the 2005 Rugby British and Irish Lions Tour. Singh and Zhou (2016) utilized the 2008 Beijing Summer Olympics as an example of effective strategy implementation, leveraging rising tourist attractiveness due to improvements in transportation systems and accessibility, increased hospitality, a new image strategy, and new business opportunities, which helped Beijing to experience long-term growth in international tourist arrivals from 2008. Leeds (2008) investigated the city-level spillover effects of the 2002 Winter Olympics in Salt Lake City, finding that while the hosting ski resort faced displacement of tourists, the revenue of neighboring resorts increased in the year of the event.
The literature on the effects of hosting large-scale events on tourist inflows has thus yielded mixed results. Most studies have concentrated on particular cases rather than generalizing the effect across different countries. This paper seeks to contribute to the existing literature by proposing and applying a method based on comparing actual and potential tourist inflows to assess the impact of LSEs for each particular country and event.
Method
This paper proposes to evaluate the effect of hosting large-scale events on tourist inflows by applying the concept of calculating potentials, first used in the context of international trade flows (Brenton & Di Mauro, 1999; Egger, 2002) and later in foreign direct investment (Greaney & Kiyota, 2020; Mariev et al., 2016). Potential, or counterfactual, tourist flows are calculated as the predicted level of the dependent variable of the constructed and estimated econometric model. A positive difference between potential and actual tourist inflows is interpreted as a country's untapped potential to attract more tourists. Conversely, if a country's actual tourist inflow surpasses its potential, this is interpreted as the country's specific features that enable it to attract more tourists than the world average (e.g., a country has a world-famous sea resort or regularly attracts a large number of pilgrims from abroad).
Two papers have applied counterfactual analysis to tourist flows with different research objectives. Fourie et al. (2011) used predicted values of tourist flows to estimate tourist displacement in South Africa during the Indian Premier League cricket tournament and the British and Irish Lions rugby tour. Fourie and Santana-Gallego (2017) consider alternative results of past matches and calculate the effect on tourist arrivals if another (counterfactual) team wins the match.
To isolate the effect of hosting large-scale events from other country-specific factors that may affect the inflow of international tourists, we excluded observations on tourist inflows for the hosting countries in the year of the event, as well as one year before and two years after the event, when calculating potential tourist numbers. We then studied the actual-to-potential ratios (APRs) for each country hosting the event by comparing APRs a few years prior to the LSE with APRs at the year of LSE (short-term effect) and a few years around LSE (midterm effect). Increases in this ratio in the year of the event and/or close years are interpreted as the short- and/or medium-term positive effects of LSEs on tourist arrivals.
We construct an econometric model of bilateral tourist flows based on the gravity approach, first applied by Tinbergen (1962) in economics and since then commonly used for the econometric modeling of international trade (Anderson & Van Wincoop, 2003; Carrere, 2006; Savin et al., 2020), foreign direct investment (Bénassy-Quéré et al., 2007; Kleinert, 2010), and migration flows (Beine et al., 2016; Kim & Cohen, 2010). The gravity approach in explaining international tourist flows is supported both theoretically (Morley et al., 2014) and empirically (e.g., Fourie & Santana-Gallego, 2011; Khadaroo, 2008; Keum, 2010; Song, 2010; Vierhaus, 2019).
The dependent variable, TOUR ijt , in the econometric model, represents the tourist flow from country j to country i in year t. As the gravity model suggests, the level of bilateral tourist flows is expected to be positively influenced by the economic size of both origin and destination countries (GDP jt and GDP it , respectively) and negatively impacted by the distance between them (DIST ij ).
Building on the work of Turner and Witt (2001) and Santana-Gallego et al. (2011), we anticipate a positive influence of trade flows on international tourism. The underlying logic behind this is twofold: first, international trade can stimulate business travel and facilitate networking at the individual, business, and national levels; second, international trade can raise the exposure of products and create awareness of both the product and its country of origin. Additionally, international trade can incentivize a country to develop the necessary infrastructure, such as transportation and communication systems, that can be advantageous in attracting tourists (Chaisumpunsakul & Pholphirul, 2018). In this paper, we consider indicators of the trade-to-GDP ratio of the origin and destination countries in year t (TRADE it and TRADE jt , respectively).
Two control dummies are used in the regression model: a contiguity variable (contig
ij
) to indicate whether two countries share a common border and a dummy variable (rta
ijt
), which is equal to 1 if there is a regional trade agreement between the two countries in year t. Regional trade agreements are interpreted as indicators of a certain level of economic integration between the countries, which is expected to accelerate business activities and increase mutual tourist arrivals. Furthermore, Aki (1998) suggests that tourist flows to a country should be sensitive to the cost of consumer goods; thus, a relative price indicator (RP
ijt
) is included in the model:
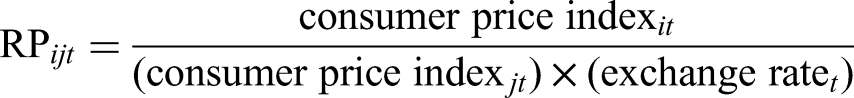
Consequently, the regression equation has the following form:
A specific feature of bilateral tourist flows is the presence of a large proportion of zero observations (approximately 20% in our database). Taking the log of the dependent variable results in these observations being dropped, leading to an estimation bias in the sample. Replacing the zeros with a small constant (e.g., 1 + TOUR) is only a partial solution, as ordinary least squares (OLS) will not provide unbiased estimates due to the nonnormal distribution of the dependent variable. Additionally, heteroskedasticity and serial correlation must be taken into account. To address these issues, we employ the Poisson pseudo maximum likelihood method to derive unbiased estimates, first applied to gravity data by Silva and Tenreyro (2006, 2010). This method is robust in terms of data with a large proportion of zero observations and heteroskedastic errors. Currently, applying the PPML method is considered to be the best solution for gravity-type models (Savin et al., 2020; Silva & Tenreyro, 2022).
Multilateral resistance terms (MRTs) are considered essential components of gravity models. Anderson and Van Wincoop (2003) first provided the microeconomic foundations for the gravity model of international trade, whereby multilateral resistance captures the costs associated with trading with all other partners in the world when considering imports/exports between two countries. To control for unobserved MRTs, a simple approach is to include origin and destination country fixed effects in the gravity model. Further developments in gravity model estimation approaches have provided arguments in favor of introducing year, exporter-year, importer-year, and/or country-pair fixed effects (see Yotov et al., 2016 for a comprehensive analysis).
The literature on MRTs for bilateral tourist flows has been captured in various ways, such as by introducing origin and destination fixed effects, origin-year and destination-year fixed effects, and country-pair fixed effects (Fourie & Santana-Gallego, 2022; Harb & Bassil, 2018; Neumayer & Plümper, 2016; Santana-Gallego & Paniagua, 2022). Taking this into account, the “Results” section provides estimates from different alternative models and proposes a measure to select the most suitable model for this research's objectives.
Data
Gravity variables (GDP and distance) and bilateral trade data were derived from the open-access CEPII database (www.cepii.fr), while components for the relative price—consumer price indices and exchange rates—were gathered from the World Bank (www.data.worldbank.org). Their descriptive statistics are reported in Table 1.
Descriptive Statistics of the Variables Included in the Econometric Model.
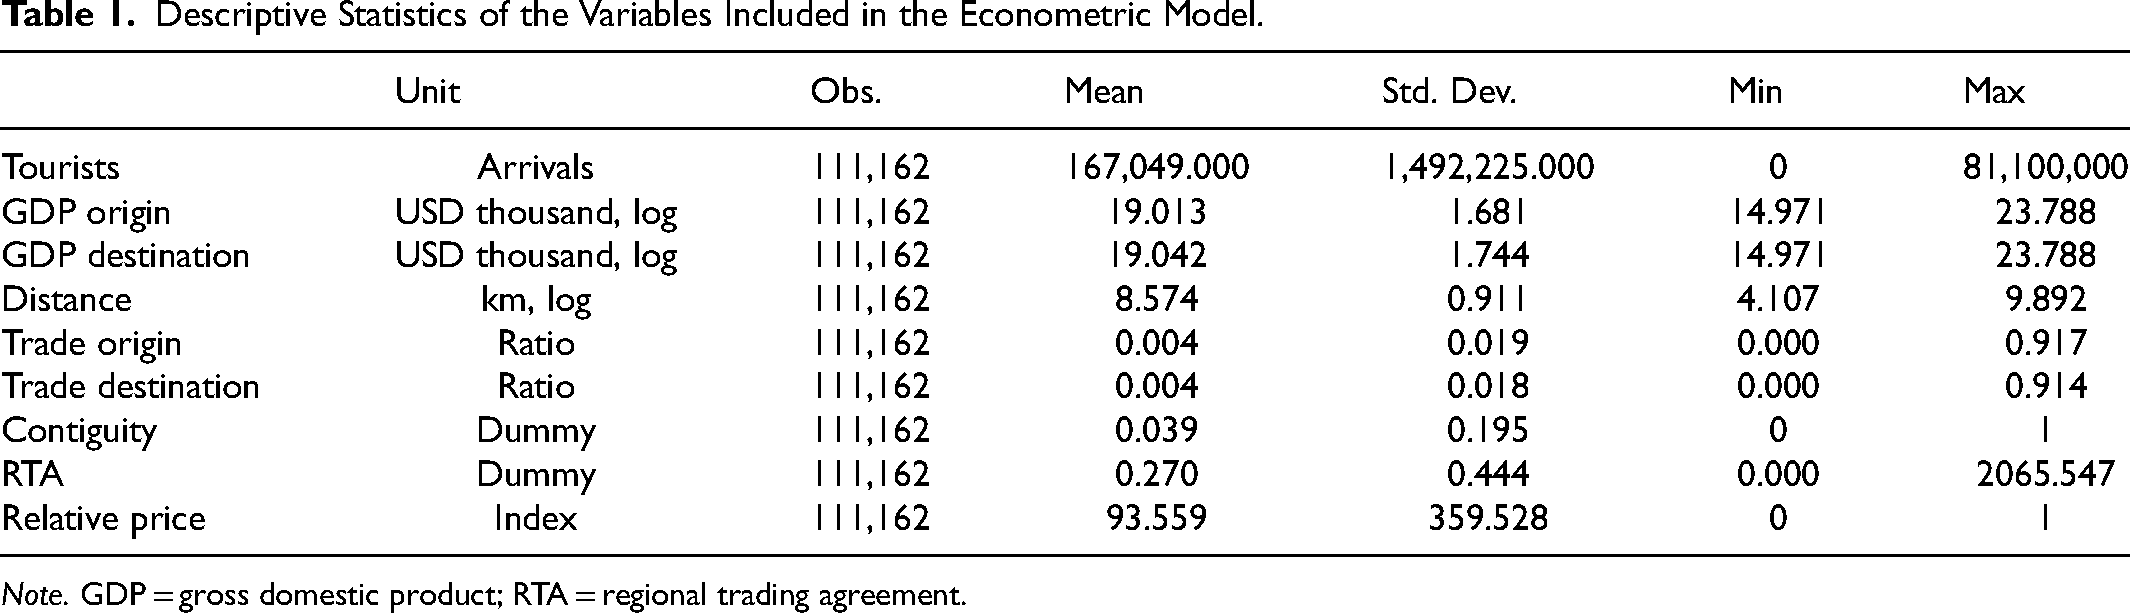
Note. GDP = gross domestic product; RTA = regional trading agreement.
The United Nations World Trade Organization (UNWTO) is a rich data source on international tourist arrivals, but it also includes a substantial number of missing data. The literature does not provide a conventional approach to address this feature. Some authors treat missing values as zeros (Khalid et al., 2021; Okafor et al., 2021; Saayman et al., 2016), while others drop missing values and estimate positive tourist flows (Czaika & Neumayer, 2020; Neumayer & Plümper, 2016; Santana-Gallego & Paniagua, 2022).
We see disadvantages in both approaches, as they may lead to an estimation of a biased dataset. We agree that missing values are more likely to be zero or close to zero than to admit that the UNWTO database has a significant share of tourist inflows that have not been reported.
In this paper, we follow the former approach, but consider the latter one as a robustness check in the “Robustness Checks” section. Our estimations indicate that the results are not significantly different, which suggests that this problem is not as critical as initially thought. Therefore, the estimated database is an unbalanced panel with 111,162 observations on international tourist flows, including 22,056 zeros.
Results
The model developed in the “Method” section is estimated using the PPML technique. The estimates are obtained both with and without fixed effects (see Table 2). As there are several approaches to incorporating multilateral resistance into the gravity model (as discussed in the “Method” section), we present estimates with different fixed effects: for country-pairs (Models 2 and 3), origin and destination countries (Model 4), country-pairs and year (Models 5 and 6), origin and destination countries and year (Model 7), and year only (Model 8).
Alternative Models to Estimate the Gravity Model of Tourist Arrivals.
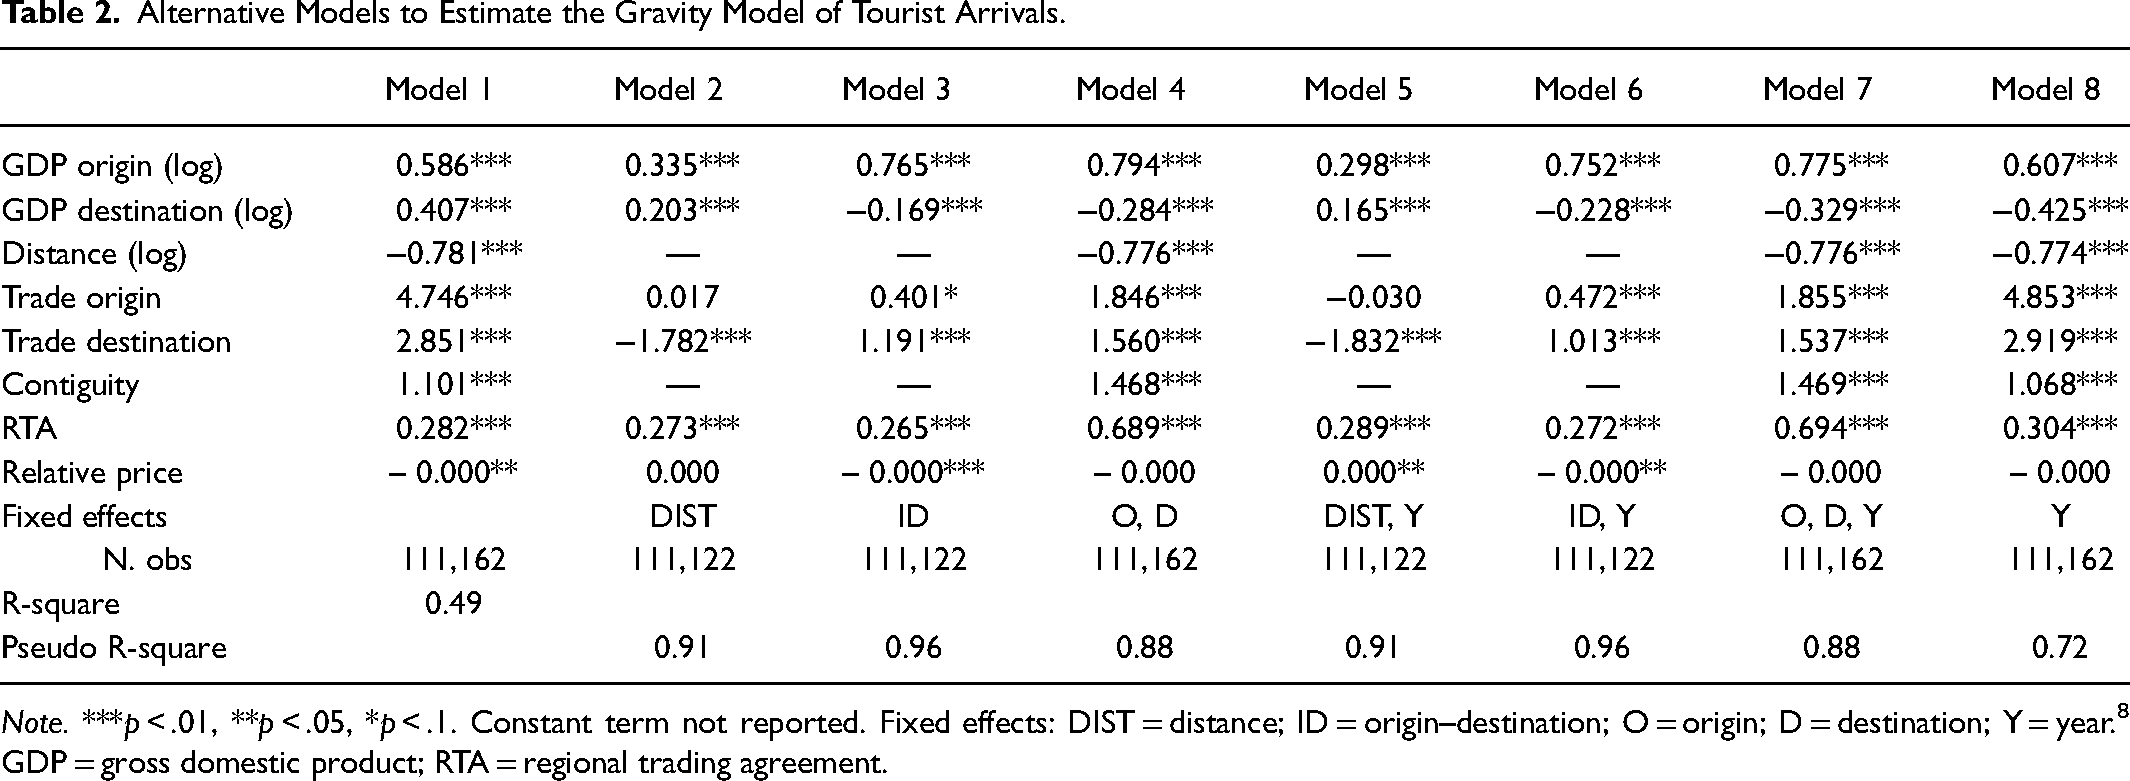
Note. ***p < .01, **p < .05, *p < .1. Constant term not reported. Fixed effects: DIST = distance; ID = origin–destination; O = origin; D = destination; Y = year. 8 GDP = gross domestic product; RTA = regional trading agreement.
To choose the optimal model for further analysis, we selected the model with the highest predictive power. To evaluate the predictive power of each model, we used the sum of predicted squared errors (Pindyck & Rubinfeld, 1991, pp. 516–535: Savin & Winker, 2013). First, we estimated the regression coefficients of Models 1–8 (Table 2) for the period 1995–2015 6 and then generated the predicted values for each model for the period 2016–2019. By comparing the predicted values with the actual values, we could assess the predictive power of each model. Lastly, we calculated the predicted squared errors for each observation in each model and selected the model with the lowest sum of predicted squared errors. According to the results presented in Table A1, Model 6, which includes country-pair (ID) and year (Y) fixed effects, has the highest predictive ability. As we discuss in the “Discussion” section, the results from Model 6 are also in line with the literature that focuses on the impacts of particular events on tourist flows.
We aim to reexamine the impact of LSEs on tourist arrivals using a traditional approach (calculating the average effect through dummy variables), employing PPML with ID and Y fixed effects. A dummy variable is equal to 1 in the year an event takes place in a particular country and 0 otherwise. Dummy variables are included in four different ways: without distinguishing the type of event (Model 1 in Table 3) and testing each type of event separately (see Table 3, Models 2–4). Additionally, the hypothesis of the midterm effect of LSEs on tourist inflows is tested (see Table 3, Models 5–8). In this case, the LSE dummy variables are equal to 1 for four years: starting one year prior to the event and ending two years after the event.
Estimations of One-Year and Four-Year Effects of LSE on Tourist Arrivals.
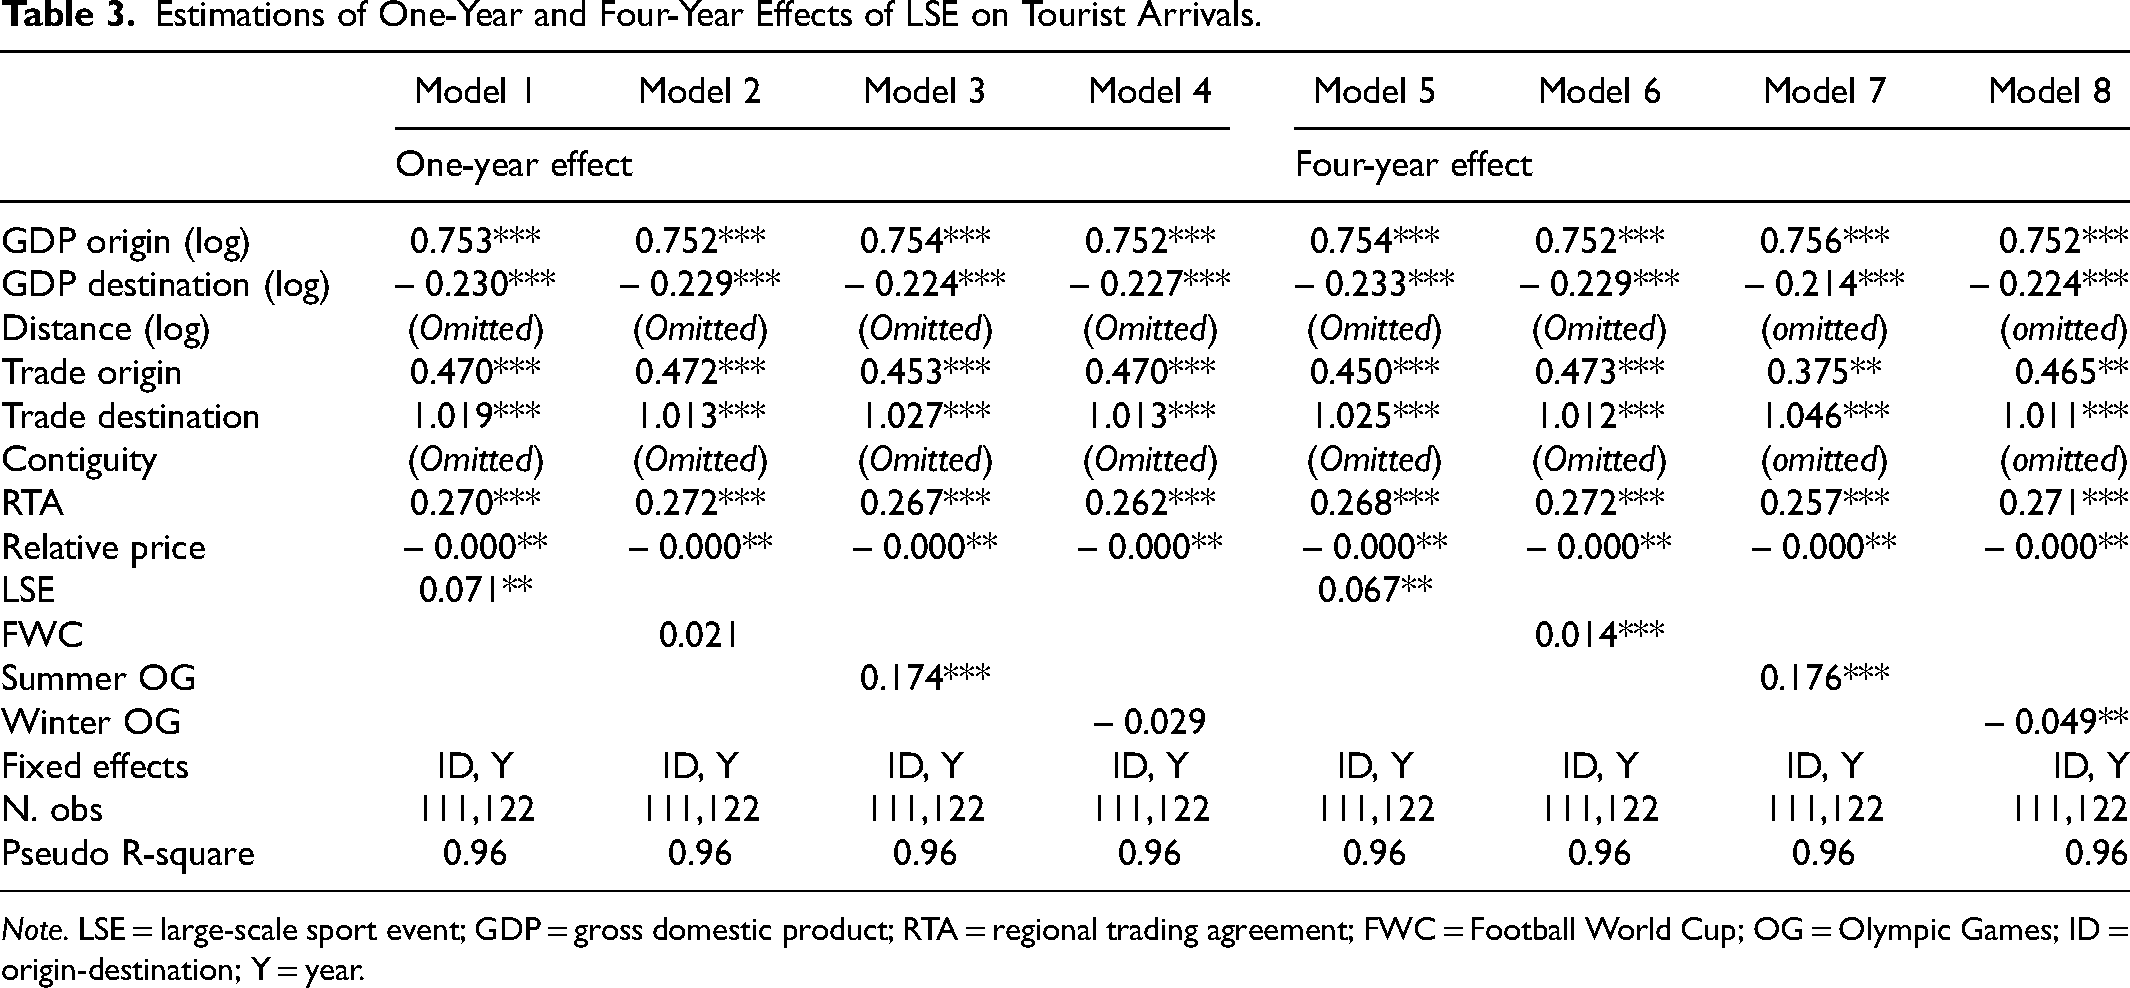
Note. LSE = large-scale sport event; GDP = gross domestic product; RTA = regional trading agreement; FWC = Football World Cup; OG = Olympic Games; ID = origin-destination; Y = year.
The results of the study indicate that the overall influence of large-scale events on tourist arrivals is positive and statistically significant in both the short-term (the year of the event) and midterm (four years including the year of the event). A similar outcome was found for the Summer Olympics. However, the influence of Football World Cups and the Winter Olympics is insignificant in the year of the event. When a midterm effect is taken into consideration, the influence of the World Cups is found to be positive and significant, while the coefficient for the Winter Olympics is negatively significant.
These findings are consistent with the previous research (e.g., Fourie & Santana-Gallego, 2011, 2022; Rabadi et al., 2016), which suggests a positive aggregate effect of large-scale events for tourist arrivals and that smaller sports events attract fewer foreign tourists.
In this section, we apply the proposed method to calculate potential levels of tourist inflows and compare them with actual levels. The objective of this exercise is to assess the heterogeneous impact of LSEs on international tourist arrivals across different countries. To isolate the potential effect of sport mega-events when estimating potentials, we excluded observations from the year in which the country hosted the event, as well as the year before and two years after, reducing the number of observations from 111,162 to 105,808. After obtaining the regression coefficients, we calculated the potential tourist arrivals for the entire dataset, that is, for 111,162 observations. 7 We want to emphasize here that we use a model without LSE dummies to calculate tourist potentials.
When calculating the potential number of tourist arrivals, the APR indicator was constructed. The Appendix displays the dynamics of the APR of a given country before and after the event, plotted separately for each LSE (Figures A1–A3) for the year of the event (t) and the eight years prior and after it. As expected, some countries have, on average, actual levels of tourist inflows higher than the potential (e.g., Australia, China, and South Africa), while others have lower than the potential (e.g., Germany, Japan, and Russia).
To identify the effect of hosting LSE on a particular country, as we described at the beginning of the “Method” section, we compared the APR of a country before the event (calculated as average for three years prior to the event, period t − 4, …, t − 2) with (a) APR in the year of the event; (b) four years neighboring the event (period t − 1, …, t + 2). The former comparison is associated with a short-term (one-year) effect and the latter—with a midterm (four-year effect) effect. If the APR is increased by more than 3% during the year of the event, then it is considered a positive effect, whereas a decrease of more than 3% is deemed a negative effect. Moderate fluctuations (within 3%) are considered as neutral effects.
The results from Table 4 and Figures A1–A3 indicate that the effects of LSEs vary across host countries. The World Cup in Japan in 2002 and South Africa in 2010 were associated with a clear increase in tourist arrivals, whereas all other results were either neutral or negative, except for a slight positive effect on tourist arrivals in Korea in 2002.
The Effects of LSEs on Tourist Arrivals.
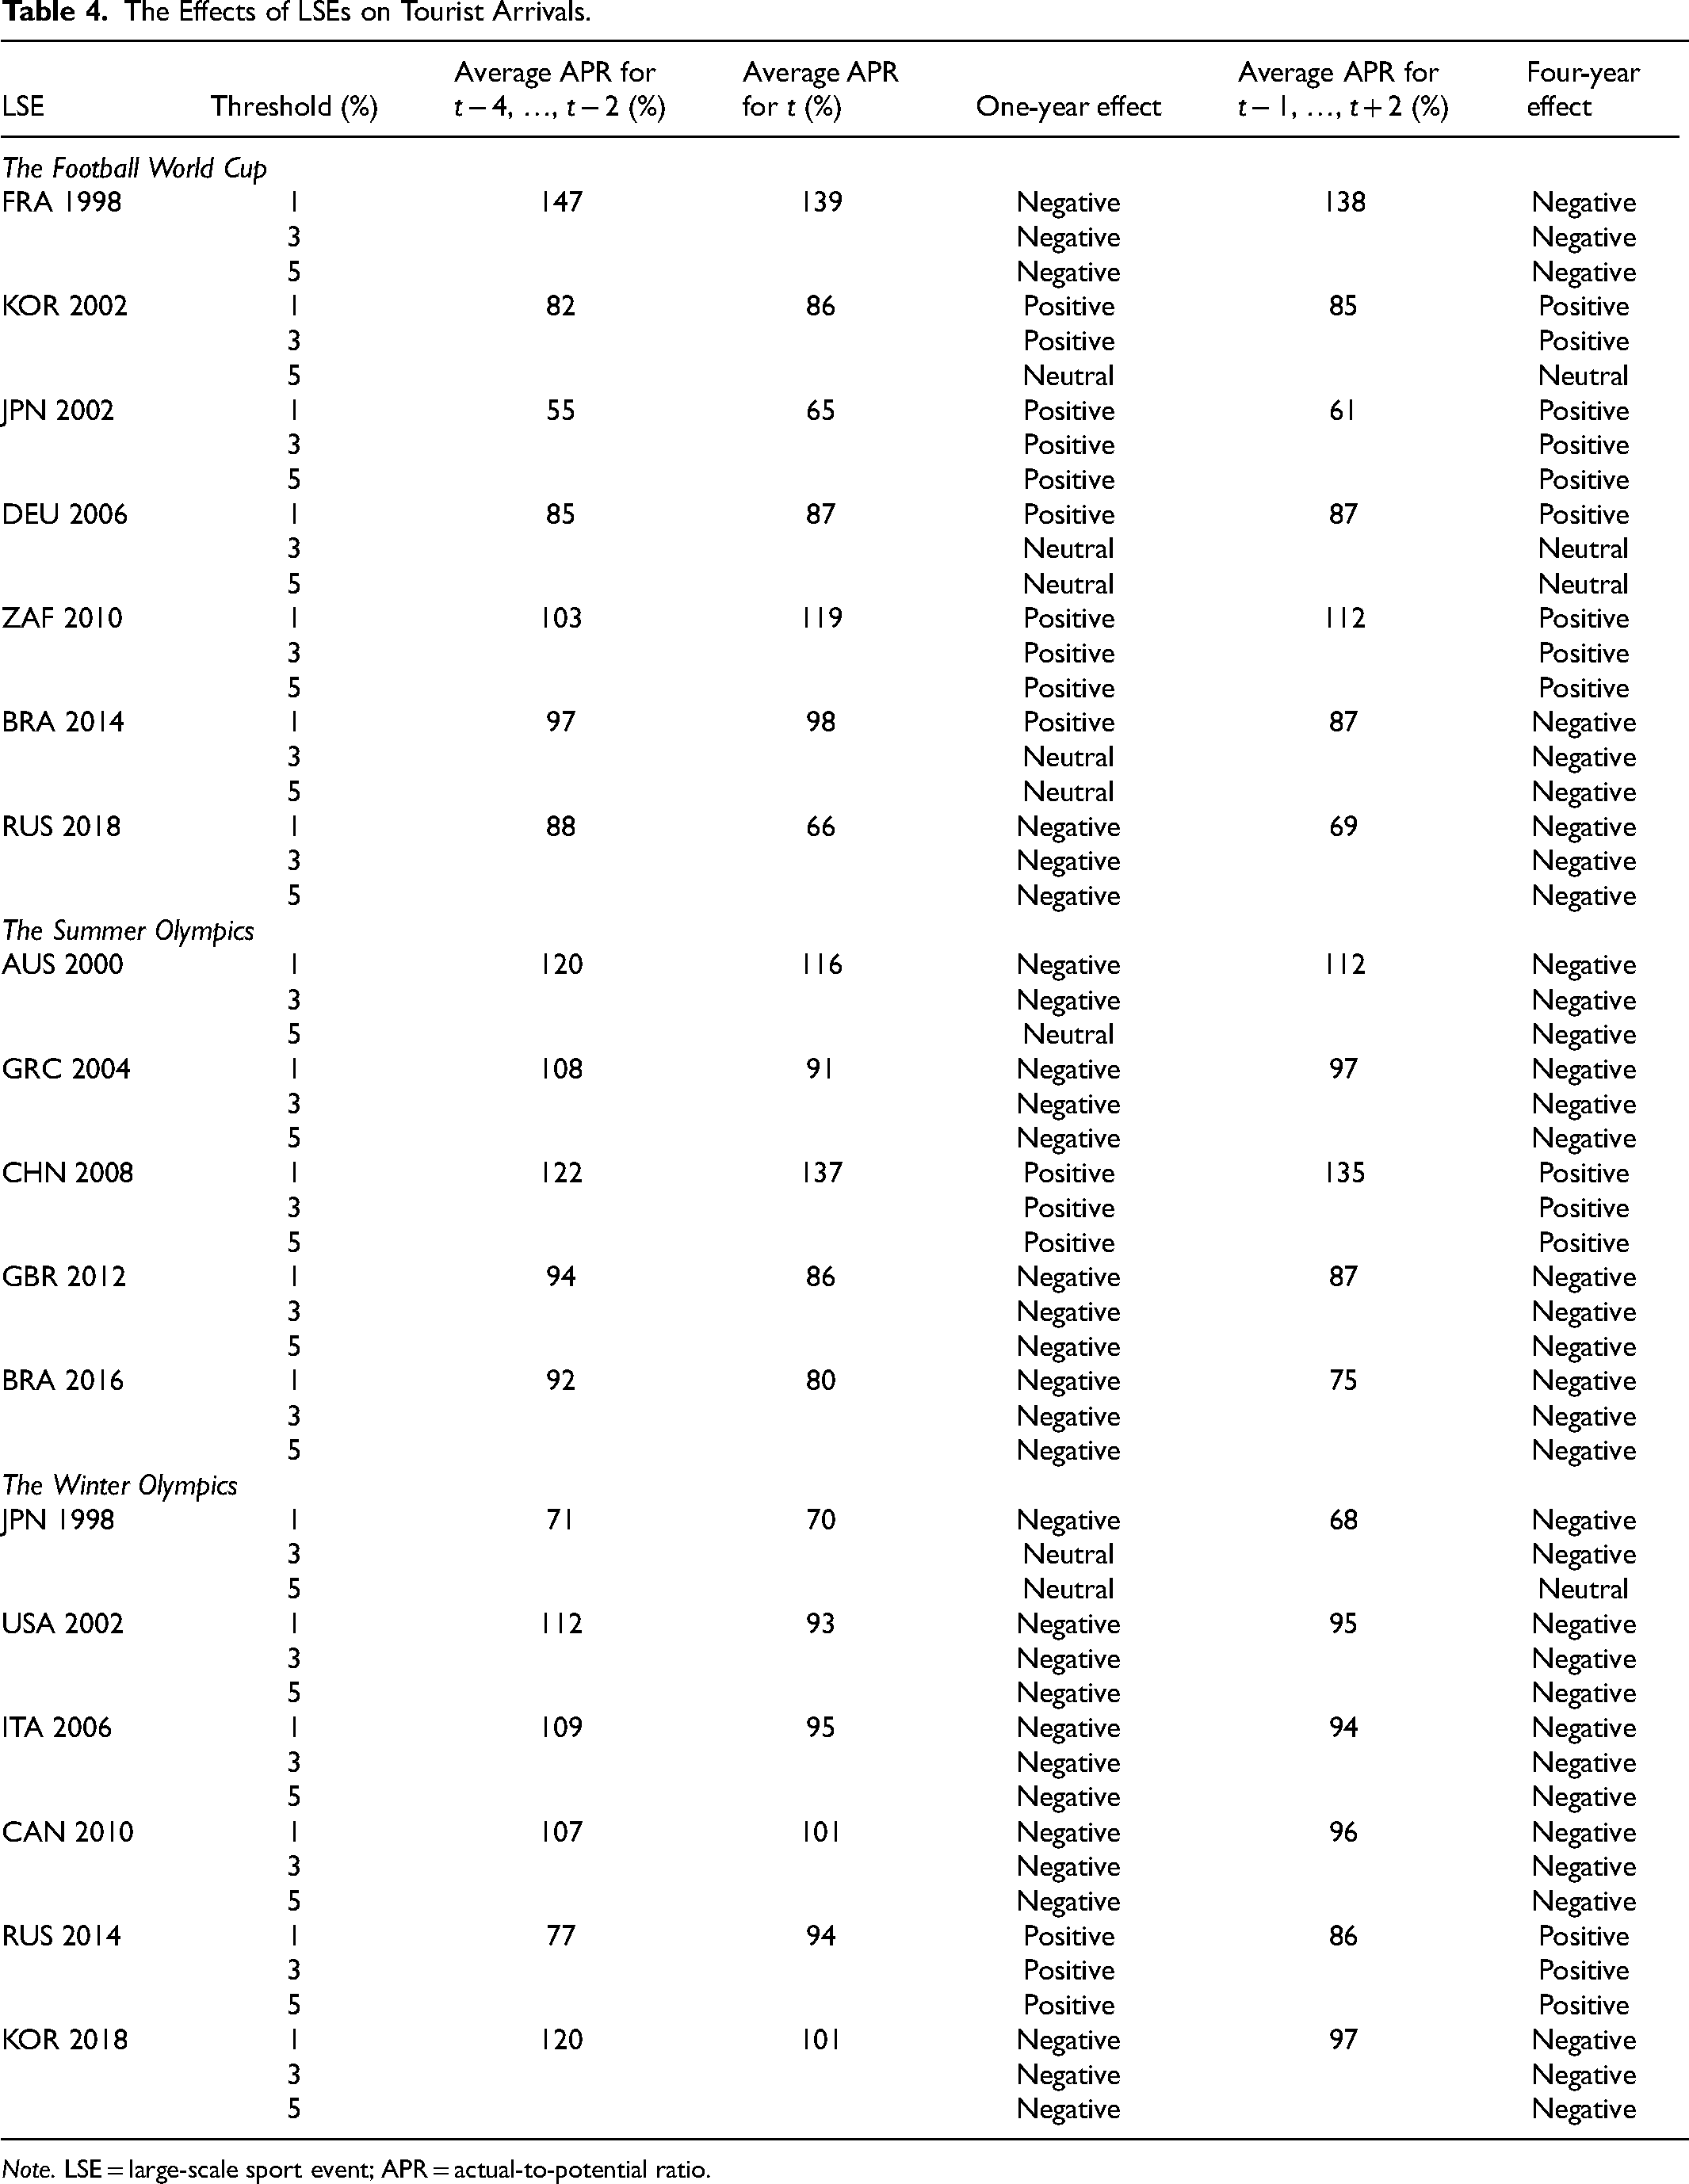
Note. LSE = large-scale sport event; APR = actual-to-potential ratio.
Our analysis indicates that China 2008 is the only country that experienced a significant positive effect on tourist inflows due to the Summer Olympics. The effects of the other four events (Australia 2000, Greece 2004, Great Britain 2012, and Brazil 2016) were found to be negative in the short- and medium-term.
Regarding the Winter Olympics, one country had a positive effect (Russia 2014). The remaining five events had a negative impact except for a one-year neutral effect for Japan in 1998.
Our findings reveal that the negative effects of LSEs on tourist inflows are predominant in the host countries. Out of the 18 hosting countries studied, 11 experienced a decline in tourist inflows (measured in terms of APR) over four years, and three did not experience a significant change in tourist inflows.
We used 1% and 5% benchmarks as two alternatives to distinguish between negative, neutral, and positive effects. As expected, using a higher threshold will change some negative and positive effects into neutral, while smaller thresholds will turn neutral effects into negative or positive. The calculation results are presented in Tables 4 and A2 and clearly demonstrate that the results in general are robust. For example, a 1% threshold indicates 12 negative, 0 neutral, and 6 positive four-year LSE effects (compared to 12 negative, 1 neutral, and 5 positive four-year effects when a 3% threshold is used). Alternatively, a 5% threshold delivers 11 negative, 3 neutral, and 4 positive four-year effects. Thus, 75% (27 out of 36) effects calculated in Table 4 do not change whether 1%, 3%, or 5% benchmark is used.
Robustness Checks
This section addresses potential concerns related to the results presented above. All the models in this section were estimated using the PPML technique with country-pair and year-fixed effects (the model with the highest predictive power, as discussed in the “Results” section).
The first concern is related to the country sample in the database. It could be argued that countries that apply to host LSEs are likely to have untapped tourist potential. Countries that are either overloaded by tourists or have a weak competitive advantage in the global tourist market are unlikely to apply to host LSEs. Therefore, it may be reasonable to estimate the model and calculate tourist potentials only among countries that have applied to host LSEs (see Model 1 in Table A3 for the estimation results).
Alternatively, reducing the sample size to the 100 largest origin and destination countries may cause bias, as countries with low GDPs may have a nonnegligible share of the international tourist market. Model 2 in Table A3 presents estimates for the total sample size of 221,035 observations in the UNWTO database.
As discussed in the “Data” section, one of the limitations of the UNWTO data on bilateral tourist flows is that it does not differentiate between zeros and missing values. As our sample may be biased due to treating missing values as zeros, we provide estimation results when zero tourist flows are excluded from the database. As Model 3 in Table A3 shows, the results do not differ substantially from those provided by the basic model.
As evidenced by de Vita, G. (2014) and Santeramo and Morelli (2016), the gravity model of bilateral tourist flows may be constructed using the GDP per capita and population of the origin and destination countries (Model 4 in Table A3). Furthermore, Balli et al. (2016) and Ghalia et al. (2019) have demonstrated that the level of social development in both origin and destination countries also influences the number of people traveling. Specifically, a higher level of social development in the destination country is associated with better hospitality, lower levels of crime, and more comfortable living conditions. Consequently, people in countries with higher social development are more likely to travel abroad due to their higher well-being and broader social protection. To incorporate this modification, the human development index, provided by the United Nations Development Programme, is used (GDP per capita is excluded, as it is a constituent part of the former): see the results in Model 5 in Table A3.
The overall results of robustness checks shown in Table A3 indicate that the control variables used in the basic model are stable across different model specifications, and in general, retain their significance.
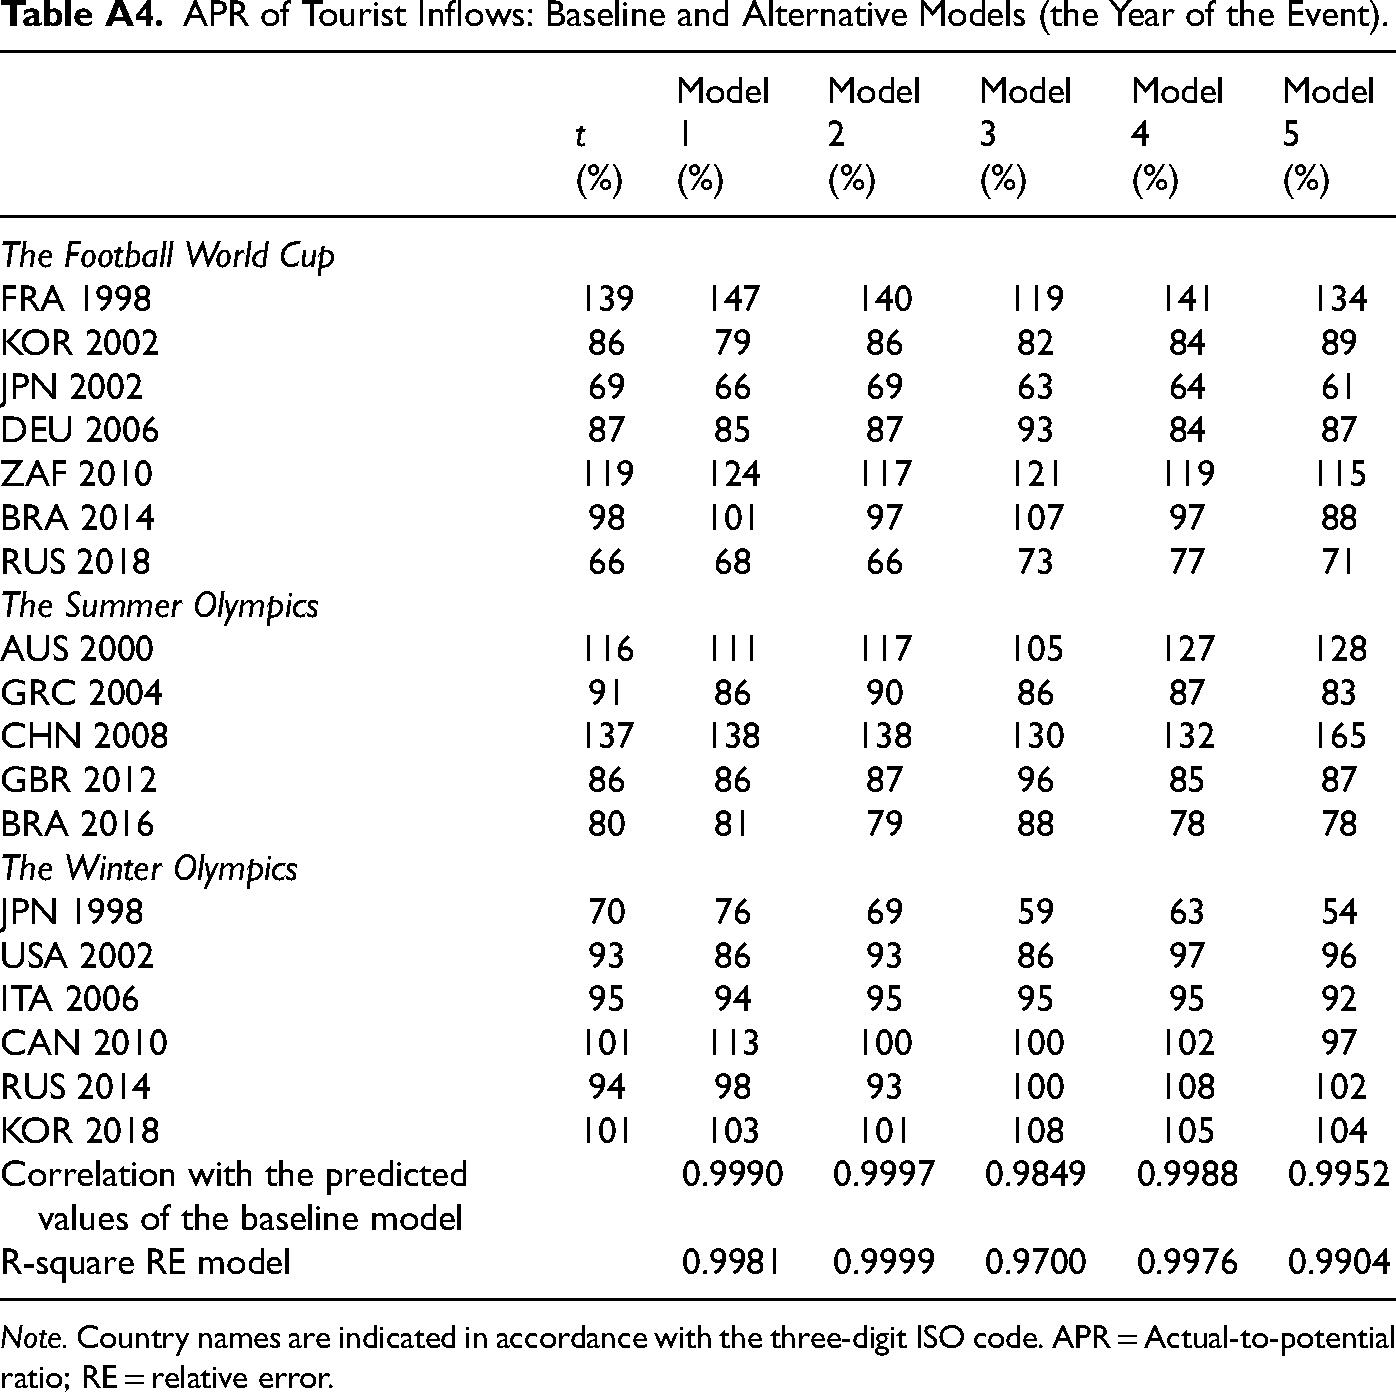
To further assess the robustness of the results presented in the preceding section, we calculated the APR for Models 1–5 (Table A3) and compared them to the APR of the baseline model (Model 6 in Table 3). The results for year t (the year of the event) are presented in Table A4. As expected, the APR varied across the different models; however, 93% of the ratios from the alternative models fell within 10% of the APR of the baseline model, and 99% lay within a 20% interval. In terms of resilience, it is more important to look at the dynamics of the APR across the models. For brevity, we have not reported the APRs for all alternative models for all years; however, at the bottom of Table 4, we have reported the correlation coefficient of the APRs between the baseline model and alternative models. The correlation coefficients (0.9849–0.9990) and R-squared values (0.9904–0.9999) show no major difference between the models. Therefore, we can conclude that the alternative models do not contain results that contradict the baseline model.
Discussion
The results presented in the previous section suggest that the impact of hosting large-scale events on tourist inflows is heterogeneous across hosting countries. Our results thus shed new light on evidence in the previous literature. In particular, the approach proposed in this paper provides an opportunity to separate the effect of LSEs on tourist flows from other determinants. Table 4 reports the summary of the effects and is consistent with most of the previous findings in the literature. For example, positive effects were observed on tourist arrivals in South Africa in 2010 (Fourie & Spronk, 2011; Peeters et al., 2014) and China in 2008 (Singh & Zhou, 2016). Conversely, we found no short-term positive impacts for the World Cups in France in 1998 and Germany in 2006 (Allmers & Maennig, 2009) and negative effects in Greece in 2004 (Chasapopoulos et al., 2014). These results are in line with Baade and Matheson (2016) and Rojas-Méndez et al. (2019), which call into question the positive effects of the Brazil 2014 World Cup on tourist arrivals. However, our results contrast with those of Bondonio and Guala, (2011), which indicate negative tourist effects for Italy 2006. In our opinion, the problem of the results derived in many previous papers (e.g., Bondonio & Guala, 2011) is associated with the difficulties of using noneconometric analysis to separate the direct effect of large-scale events on tourist arrivals from other efforts of the authorities to attract tourists.
We hypothesized that the effect of LSEs on tourist inflows might depend on the level of the APR of the host country in question. However, our results do not support this idea, as we observed positive gains in both “overperforming” South Africa (2010) and China (2008) and “underperforming” Japan (2002) and Russia (2014). Negative effects were seen in France in 1998 with a high level of APR and in Brazil in 2016 with a low level. Additionally, the results reported in Table 4 do not support the idea that the effect of LSEs on tourist inflows depends on the type of the event; in fact, negative effects dominated both World Cups and the Summer and Winter Olympics. This does not support the results reported by Fourie and Santana-Gallego (2011) regarding the less negative influence of the Winter Olympics due to its shorter duration and organization outside the capital during the off-season.
Our results remain consistent regardless of whether short-term (one year) or midterm (four years) effects are considered. There are only two exceptions: South Korea 2002 changes from a positive short-term to a neutral midterm effect, while Brazil 2014 changes from a neutral short-term to a negative midterm effect. Contrary to Song (2010), this finding does not support the idea that large-scale events have a consistently positive effect on tourist inflows in hosting countries.
In conclusion, it can be stated that tourists visiting a country due to hosting an LSE typically have a significant negative effect on tourists visiting the country for other reasons. The long-term positive increase in tourist arrivals expected in a host country should be adjusted to account for the number of tourists who decide not to visit the country for the same reason. Thus, efforts to attract tourists to a country should be accompanied by efforts to retain them. The type, period, and location of the event are important factors in determining the nature and magnitude of the net effect.
Conclusion
The existing literature on the effect of hosting large-scale events on tourist inflows either focuses on a particular event or estimates the average effect across all host countries, controlling for a set of variables. This paper proposes and applies a method based on a constructed econometric model that allows for the unveiling of the net effect of LSEs on tourist inflows for a particular country. This is achieved through actual–counterfactual analysis derived from the literature studying bilateral trade and investment flows in the world economy.
To determine the effect of hosting large-scale events on tourist inflows, one must control for other factors influencing the level of tourist arrivals into the country, as well as consider the number of “regular” tourists that refused to visit said country due to the event. The analysis conducted in this paper suggests that the dynamics of tourist arrivals in most countries were insignificantly affected by LSEs. Only four out of the 19 LSEs considered experienced a positive effect on tourist arrivals. In some cases, hosting LSEs did not prevent the country from experiencing a decline in tourist inflows.
It may appear that the results in this paper are not significantly different from those obtained in previous studies. However, the way in which these results were derived is distinct. While prior studies estimated the average effect for a particular time period/event/group of countries, our study determined the effect for each country and then generalized the results. We believe that the proposed approach has important advantages and will further advance the current state of the art.
Our findings support the widely accepted notion that ex-ante expectations of the benefits of hosting LSEs for a country tend to be overly optimistic compared to ex-post analyses. It is evident that while these events can bring a variety of benefits, there are also negative externalities associated with them. Therefore, large-scale events should be considered as part of a long-term policy for promoting a territory to tourists rather than a standalone solution.
Footnotes
Acknowledgements
The authors thank the two anonymous reviewers and the editor for their careful reading of the manuscript and their insightful comments and suggestions. The authors gratefully acknowledge the UNWTO for providing the data on bilateral tourist flows.
Declaration of Conflicting Interests
The authors declared no potential conflicts of interest with respect to the research, authorship, and/or publication of this article.
Funding
The authors disclosed receipt of the following financial support for the research, authorship, and/or publication of this article: This work was supported by the Russian Science Foundation (grant number 19-18-00262).
Notes
Author Biographies
Appendix
APR of Tourist Inflows: Baseline and Alternative Models (the Year of the Event).
| t (%) | Model 1 (%) | Model 2 (%) | Model 3 (%) | Model 4 (%) | Model 5 (%) | |
|---|---|---|---|---|---|---|
| The Football World Cup | ||||||
| FRA 1998 | 139 | 147 | 140 | 119 | 141 | 134 |
| KOR 2002 | 86 | 79 | 86 | 82 | 84 | 89 |
| JPN 2002 | 69 | 66 | 69 | 63 | 64 | 61 |
| DEU 2006 | 87 | 85 | 87 | 93 | 84 | 87 |
| ZAF 2010 | 119 | 124 | 117 | 121 | 119 | 115 |
| BRA 2014 | 98 | 101 | 97 | 107 | 97 | 88 |
| RUS 2018 | 66 | 68 | 66 | 73 | 77 | 71 |
| The Summer Olympics | ||||||
| AUS 2000 | 116 | 111 | 117 | 105 | 127 | 128 |
| GRC 2004 | 91 | 86 | 90 | 86 | 87 | 83 |
| CHN 2008 | 137 | 138 | 138 | 130 | 132 | 165 |
| GBR 2012 | 86 | 86 | 87 | 96 | 85 | 87 |
| BRA 2016 | 80 | 81 | 79 | 88 | 78 | 78 |
| The Winter Olympics | ||||||
| JPN 1998 | 70 | 76 | 69 | 59 | 63 | 54 |
| USA 2002 | 93 | 86 | 93 | 86 | 97 | 96 |
| ITA 2006 | 95 | 94 | 95 | 95 | 95 | 92 |
| CAN 2010 | 101 | 113 | 100 | 100 | 102 | 97 |
| RUS 2014 | 94 | 98 | 93 | 100 | 108 | 102 |
| KOR 2018 | 101 | 103 | 101 | 108 | 105 | 104 |
| Correlation with the predicted values of the baseline model | 0.9990 | 0.9997 | 0.9849 | 0.9988 | 0.9952 | |
| R-square RE model | 0.9981 | 0.9999 | 0.9700 | 0.9976 | 0.9904 | |
Note. Country names are indicated in accordance with the three-digit ISO code. APR = Actual-to-potential ratio; RE = relative error.