
Abstract
The existence of a home-court advantage is one of the most durable empirical patterns in all of sports. Yet, the mechanisms explaining its strength and persistence remain a mystery in large part because of well-known challenges with statistical identification. We use attendance restrictions in place during the 2020–2021 National Basketball Association regular season as an instrument in order to identify the effect of fans and crowd size on home-court advantage. We show that home teams win by
Introduction
The existence of a home-court advantage is one of the most durable empirical patterns in all of sports. Yet, the mechanisms explaining its strength and persistence remain a mystery in large part because of well-known challenges with statistical identification. Attempts to measure the effect of the presence of home fans on home-court advantage, for example, are plagued by concerns about reverse causality. If a positive correlation between crowd size and home team performance is observed in the data, the analyst cannot easily distinguish between the claim that fans cause the home team to play better and the alternative that more successful home teams cause more fans to be in attendance.
Identifying this mere effect of fans on home-court advantage requires an instrument, that is, a variable that is correlated with the presence of fans but unrelated to the quality of the home team. In this paper, we use COVID-19-related attendance restrictions in place during the 2020-2021 National Basketball Association (NBA) regular season as such an instrument in order to overcome potential reverse causality and estimate the effect of the presence of fans on home-court advantage. Our empirical setting is especially well-suited to test the hypothesis because the season schedule was determined without knowledge about when and where fans would be permitted to be in attendance, rules for in-game play did not vary with local health conditions, off-court player behavior was centrally regulated by the league, and arena reopening decisions were largely controlled by government officials primarily concerned with protecting public health.
These unique characteristics of our setting also ameliorate many of the empirical concerns that afflict other studies that leverage pandemic-related attendance restrictions to examine similar questions. In particular, our setting has both within-team and cross-sectional variation in the stringency of attendance restrictions, which permits us to both control for unobservable stable characteristics of the home-court (e.g., the maximum noise level in a stadium) and time-varying variables that affect the home-court advantage of all teams (e.g., the nationwide intensity of the pandemic). A constraint of our setting, however, is that all games were played in arenas at considerably less than full capacity. Our ability to estimate the impact of the first few thousand fans in an arena, then, comes at the cost of being able to generalize to settings in which the home team has a near-full stadium and consequently to compare our results with prior studies that compare empty or nearly empty arenas to full or nearly full arenas.
We show that home teams win by
Background and Hypotheses
Home-court advantage is a pervasive phenomenon across all professional sports. However, challenges with statistical identification impede clear inference about the various plausible mechanisms and diverse causal pathways that could explain why home teams tend to outperform away teams (see Jamieson, 2010: For a review). Prior studies explaining home-court advantage emphasize the home team’s familiarity with their arena (Loughead et al., 2003) and the physical impact of distant travel on away players (McHill & Chinoy, 2020; Pace & Carron, 1992). Further, in certain sports, crowd noise itself may interfere with on-the-field strategy (Nevill & Holder, 1999) or impact the referee’s ability to officiate the game fairly (Dohmen & Sauermann, 2016; Garicano et al., 2005; Guèrette et al., 2021; Unkelbach & Memmert, 2010). While prior studies demonstrate a relationship between fan attendance and home team performance (Moore & Brylinski, 1993; Smith & Groetzinger, 2010), statistical identification of the impact of fan attendance on home-court advantage is complicated by well-known concerns related to reverse causality. If better teams draw more fans, then regressions demonstrating a positive effect of fans on home-court advantage could be an artifact of fans preferring to attend games when their favorite team is likely to win. Consistent estimation of the impact of fans on home team performance requires an instrument that is correlated with the number of fans in attendance but is uncorrelated with the quality of the home team or other omitted variables that are correlated with both crowd size and home team performance.
Restrictions on fan attendance caused by the COVID-19 pandemic during the 2020–2021 NBA regular season provide an unusual opportunity to evaluate the impact of fan attendance on home-court advantage. Prior to the start of the season in 2020 and through the rest of the regular season in 2021, local governments imposed restrictions on the maximum sizes of indoor and outdoor gatherings in order to limit the spread of COVID-19, therefore affecting attendance at NBA games. While some local governments were more cautious and imposed tighter restrictions on maximum allowable attendance, others relaxed restrictions faster and allowed more fans into arenas. Because the phased reopening of arenas for fans was constrained by local government officials and was related to the perceived relative health risks of large gatherings, variability in fan attendance restrictions in this context is independent of characteristics of the home team or the competitiveness of the specific game. Furthermore, on-court competition and off-court player behavior remained centrally regulated by the league. The same health and safety protocols applied to players whether or not fans were present. These features make the maximum number of fans allowed at a game a strong instrument for the actual number of fans at the game in a statistical model predicting the impact of fans on home-court advantage.
Our empirical setting also permits us to emphasize certain fan-driven mechanisms explaining home-court advantage and deemphasize others. All of the games in our study had very low attendance by usual standards. The defending champions, the Los Angeles Lakers, for example, limited attendance to two thousand fans in a twenty thousand-seat arena. The largest crowd in the sample is 8,359 in the final regular-season game for the Phoenix Suns, which is less than
One possible reason that home teams outperform away teams is spillover effects from the fans themselves. In interviews during the 2020–2021 NBA season, players overwhelmingly emphasize the positive spillovers of the presence of home fans on the home team’s players. Portland Trail Blazers point guard Damian Lillard described how even a sparsely attended game impacted him emotionally: When they told use it was going to be 10 percent [capacity], I was like, I don’t know how much difference it’s going to make in such a huge building. But man, I guess we didn’t realize how bad an empty building was because that felt like a normal game. As soon as we came out to warm up and the fans, you could feel how excited they were to be there. There was chanting before the first layup in the layup line. It was a major, major difference (Holdahl, 2021).
Former Chicago Bulls and current Orlando Magic center Wendell Carter, Jr., similarly, reported that “we just kind of feed off the fans sometimes” and that empty arenas required that home teams “find ways to find energy” (Songco, 2020). Philadelphia 76ers center Dwight Howard echoed the notion that energy from the fans is contagious but also emphasized that fans make the players accountable: “When I get to the court, I gotta’ hold myself to a higher standard because all the fans, they’re looking at me to come out and play with energy and effort every night” (Grasso, 2021). Golden State Warriors Head Coach Steve Kerr also noticed the difference between playing in partially full away arenas and empty home arenas: “What I’ve noticed is that, even if it’s 2,500 fans, the energy is entirely different. We played the Knicks in the first game that fans were allowed in (Madison Square) Garden probably three, four weeks ago, and it was awesome. Those 2,500 fans were so excited to be at a game. They made their presence felt” (Letourneau, 2021).
In contrast, relatively empty arenas with fans kept socially distant from players constrain the potential impact of crowd noise on on-court communication by the away team. Prior research similarly indicates that the impact of fans on referee behavior is mediated by crowd noise and size (Dohmen & Sauermann, 2016; Garicano et al., 2005; Guèrette et al., 2021; Unkelbach & Memmert, 2010). Thus, the potential for referee bias to explain home-court advantage is muted in this context (see also Gong, 2022). In supplemental analyses, we also empirically examine the impact of fan attendance on referee bias in terms of fouls called and find a minuscule, statistically insignificant effect. Our study, which compares empty arenas to games with sparse attendance, is thus an important complement to existing research examining the effects of additional fans in near-full arenas, where these alternative mechanisms are likely to be more powerful (see, e.g., Belchior, 2020).
These features of our empirical setting also distinguish our study from other recent research that uses COVID-19 restrictions on fan attendance to explore similar research questions. Bryson et al. (2021) and Wunderlich et al. (2021) examine how soccer matches in front of empty and nearly empty stadiums compares with matches played in stadiums with unrestricted attendance and find evidence of reduced referee bias, but an insignificant effect of empty stadiums on goals scored or match outcomes. Sors et al. (2020), in contrast, compare soccer matches played in empty stadiums in 2020 to matches played during the 2016–2019 seasons and finds support for of a weakened home field advantage in games without fans, with similar results identified in Cross & Uhrig (2022) and Scoppa (2021) for European soccer and Arboix-Alió et al. (2022) for European rink hockey. Further muddying the mixed evidence in the professional soccer and rink hockey contexts is the fact that these studies rely almost exclusively on comparisons of matches played prior to and subsequent to the widespread COVID-19 pandemic lockdowns, making it impossible to differentiate the impact of empty stadiums from the impact of the pandemic itself. In European soccer leagues for games played during the pandemic, for example, home team players were required to quarantine in local hotels prior to matches instead of staying at their homes and coaches were permitted five substitutions instead of the usual three (Hill & Van Yperen, 2022).
In our setting, in contrast, all games were played in the shadow of the pandemic. Further, the NBA imposed extensive health and safety protocols on top of local public health regulations that regulated on-the-court and off-the-court behavior. The protocols, for example, forbid all players “from going to bars, lounges or clubs, from attending live entertainment or sports events, from using gyms, spas or pools, or from participating in social gatherings with more than 15 people” (Aschburner, 2020). While we cannot entirely rule out the possibility that unobserved local variability in the intensity of the pandemic is an omitted variable that explains some of the impact of the presence of fans, the risk of such a bias is considerably reduced relative to these other settings. Furthermore, as discussed in the next section, observed coefficients on time-varying measures of pandemic intensity are near-zero and do not approach statistical significance. The time-varying nature of the reopening decisions, their exogeneity with respect to team quality, and the league-wide controls on player behavior thus make our setting as close to an experimental ideal as could be hoped for given the pandemic environment.
Data and Models
Our primary analyses bring together in-game data from the 2020 to 2021 NBA regular season with news reports on limits to fan attendance in each arena. Data for each game are collected from basketball-reference.com and official NBA game summaries. Supplemental analyses also use data from the 2014–2015 through 2019–2020 and 2021–2022 NBA regular seasons, also collected from basketball-reference.com. Note, in the 2019–2020 season, we only include regular season games through March 10, 2020, one day before the postponement of the season due to the COVID-19 outbreak. Subsequent games were played at a neutral venue.
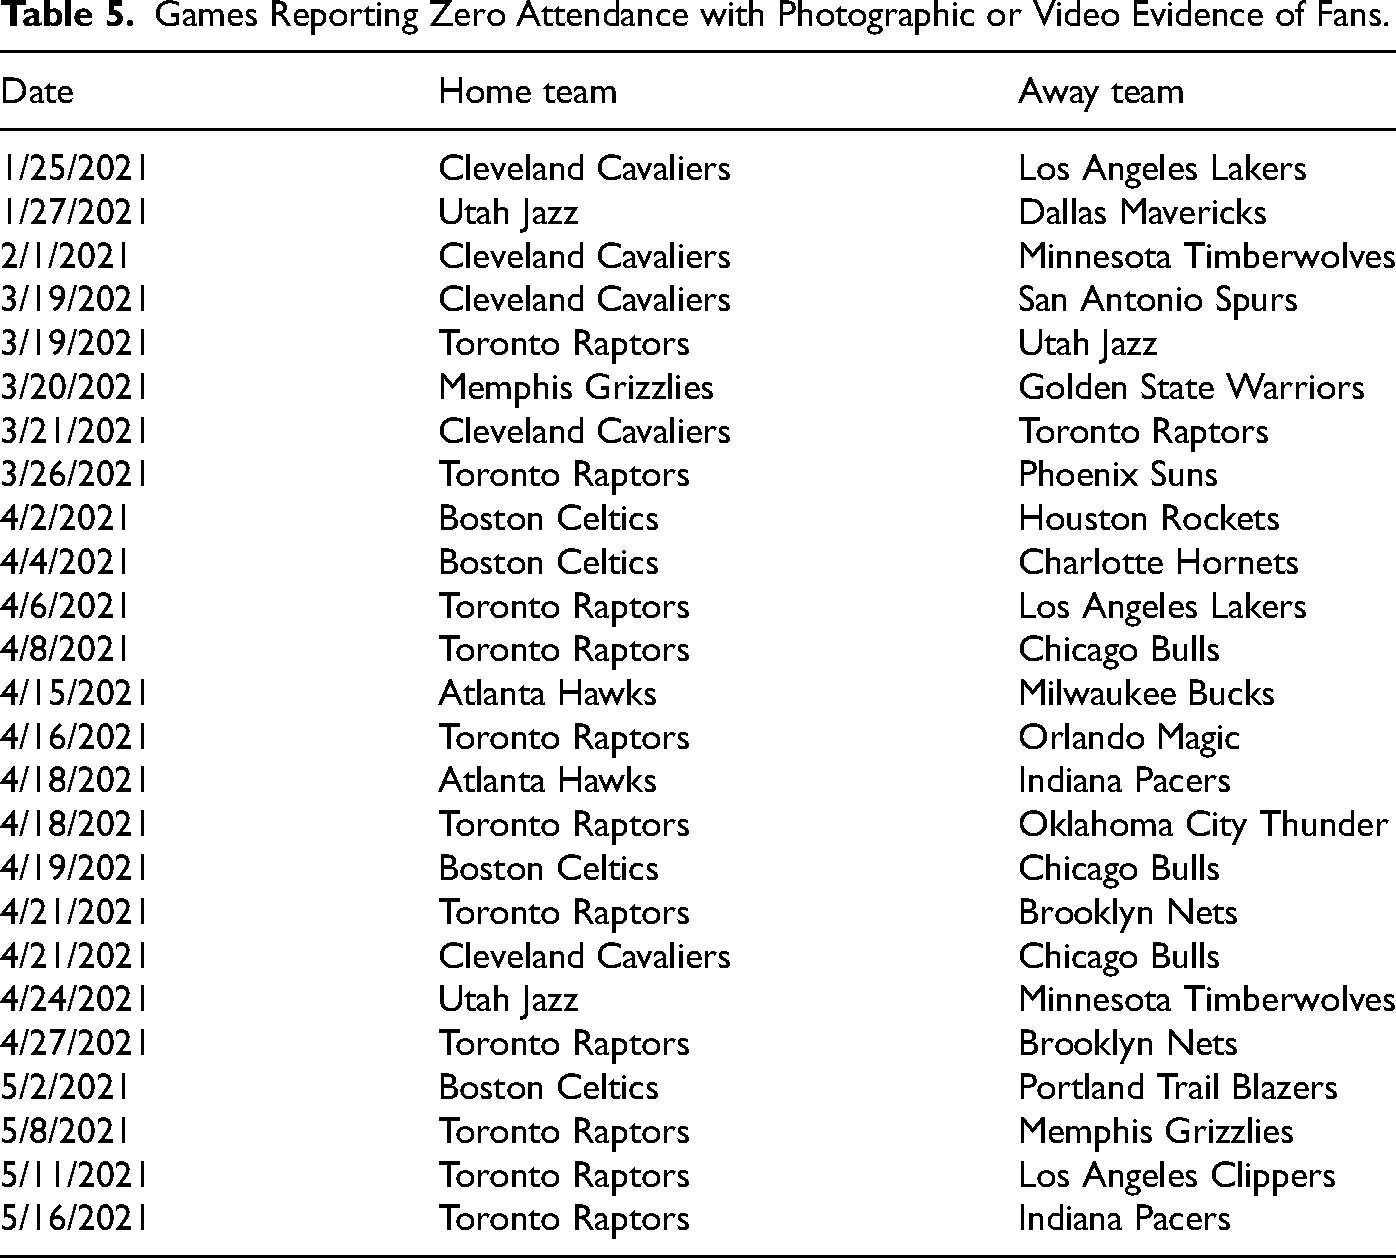
We make changes to the attendance data in order to correct obvious errors. Specifically, we remove 25 games from our analysis in which basketball-reference.com and the official NBA game summary report zero attendance, yet there exists photographic, video, or other documentary evidence of fans at the game. These 25 games are listed in the Appendix in Table 5. Either the Toronto Raptors or the Cleveland Cavaliers were the home team in 16 out of the 25 games removed. Second, home games for the Indiana Pacers, Miami Heat, and Sacramento Kings are not included in the regression analyses because these teams continued to report zero attendance once their arenas reopened. 1
We rely on news sources to determine attendance limits because there is no official NBA source documenting stadium reopening dates or capacity restrictions throughout this period. A list of news sources reporting attendance limits is included in the Appendix in Table 6. We only include sources that report future changes to attendance limits, rather than those that identify changes to limits ex post to ameliorate the risk that the source is inferring attendance limits from observed attendance, which would generate a potential violation of the exclusion restriction. In practice, this means that certain games report attendance that exceeds the maximum permitted capacity. While this implies that the attendance limit is measured with some error, the first-stage regression using attendance limits to predict observed attendance remains very strong and there is no reason to believe that measurement error in the attendance limit is correlated with the disturbances in the model predicting home team performance.
We also include a control for the positive COVID-19 case rate in the county in the two weeks prior to the game taking place in our regression models in order to account for the potential for time-varying local pandemic intensity impacting home-court advantage. These data are collected from the New York Times 2 . We further control for the recent performance of the home team and the away team to account for the possible correlation between the recent play of the home or away team and the attendance or attendance limit for a focal game.
Our main analyses are fixed effects instrumental variables regression models of the following form:

The attendance variable is endogenous, driven by the potential for better home teams to also draw larger crowds in the arena. In the instrumental variables regression models, we use the maximum allowable capacity as a instrument for observed attendance, which permits consistent estimation of
Second, maximum allowable capacity does not have a direct effect on the outcome of the game, only an indirect effect through changes in attendance, our variable of interest. In our setting, changes in maximum capacity had no effect on how the game was played or how both the home and away teams prepared for games. As previously discussed, on-court competition and player health and safety protocols remained centrally regulated by the league. News reports and interviews with team and league officials consistently indicate that the primary constraints to larger crowds during the season were local government officials and state and local public health regulations. For example, the Philadelphia 76ers invited fans to return to the arena at 15% capacity on March 14, 2021, which was their first home game after local officials began permitting 15% capacity attendance at indoor entertainment events state-wide on March 1. On April 4, the local government permitted maximum attendance to increase to 20% of arena capacity, and the 76ers responded by immediately increasing the number of tickets sold. In other cases, arena reopening plans involved special approvals by local public health officials. For example, the Washington Wizards were granted a waiver from the Washington, DC city government to permit 10% of fans into their home arena on April 10 and were granted a second waiver on May 10 to increase maximum attendance to 25% of capacity.
While there are selected examples of teams that restricted attendance to a greater extent than local regulations—for example, the Dallas Mavericks continued to play in an empty arena after a professional hockey team that shares their home arena had begun to permit 5,000 fans—none of the public reports used to determine capacity limits, which are listed in Table 6, indicate that these attendance restrictions were correlated with the time-varying considerations about the quality of the home team or with considerations relating to a specific game. For example, based on the announcement dates of arena re-openings for the
All data and analysis code is available in the “NBA-home-court-advantage” GitHub repository and can be accessed at https://github.com/kieran-allsop/NBA-home-court-advantage.
We also present a series of supplemental analyses. First, we examine the possibility that the presence of fans impacts referee bias by re-estimating the models previously described with the difference in the number of fouls called for the home and away teams as the dependent variable. Second, we explore whether the marginal effect of fans on home-court advantage varies with the number of fans in attendance by estimating fixed effects models in which the capacity is treated as a categorical variable. Finally, we estimate fixed effects models on all data collected from 2014–2015 to 2021–2022, which provides additional insight on whether our effect is localized to relatively small crowds or also applies to games with near-full arenas.
Results
We begin by displaying the means and
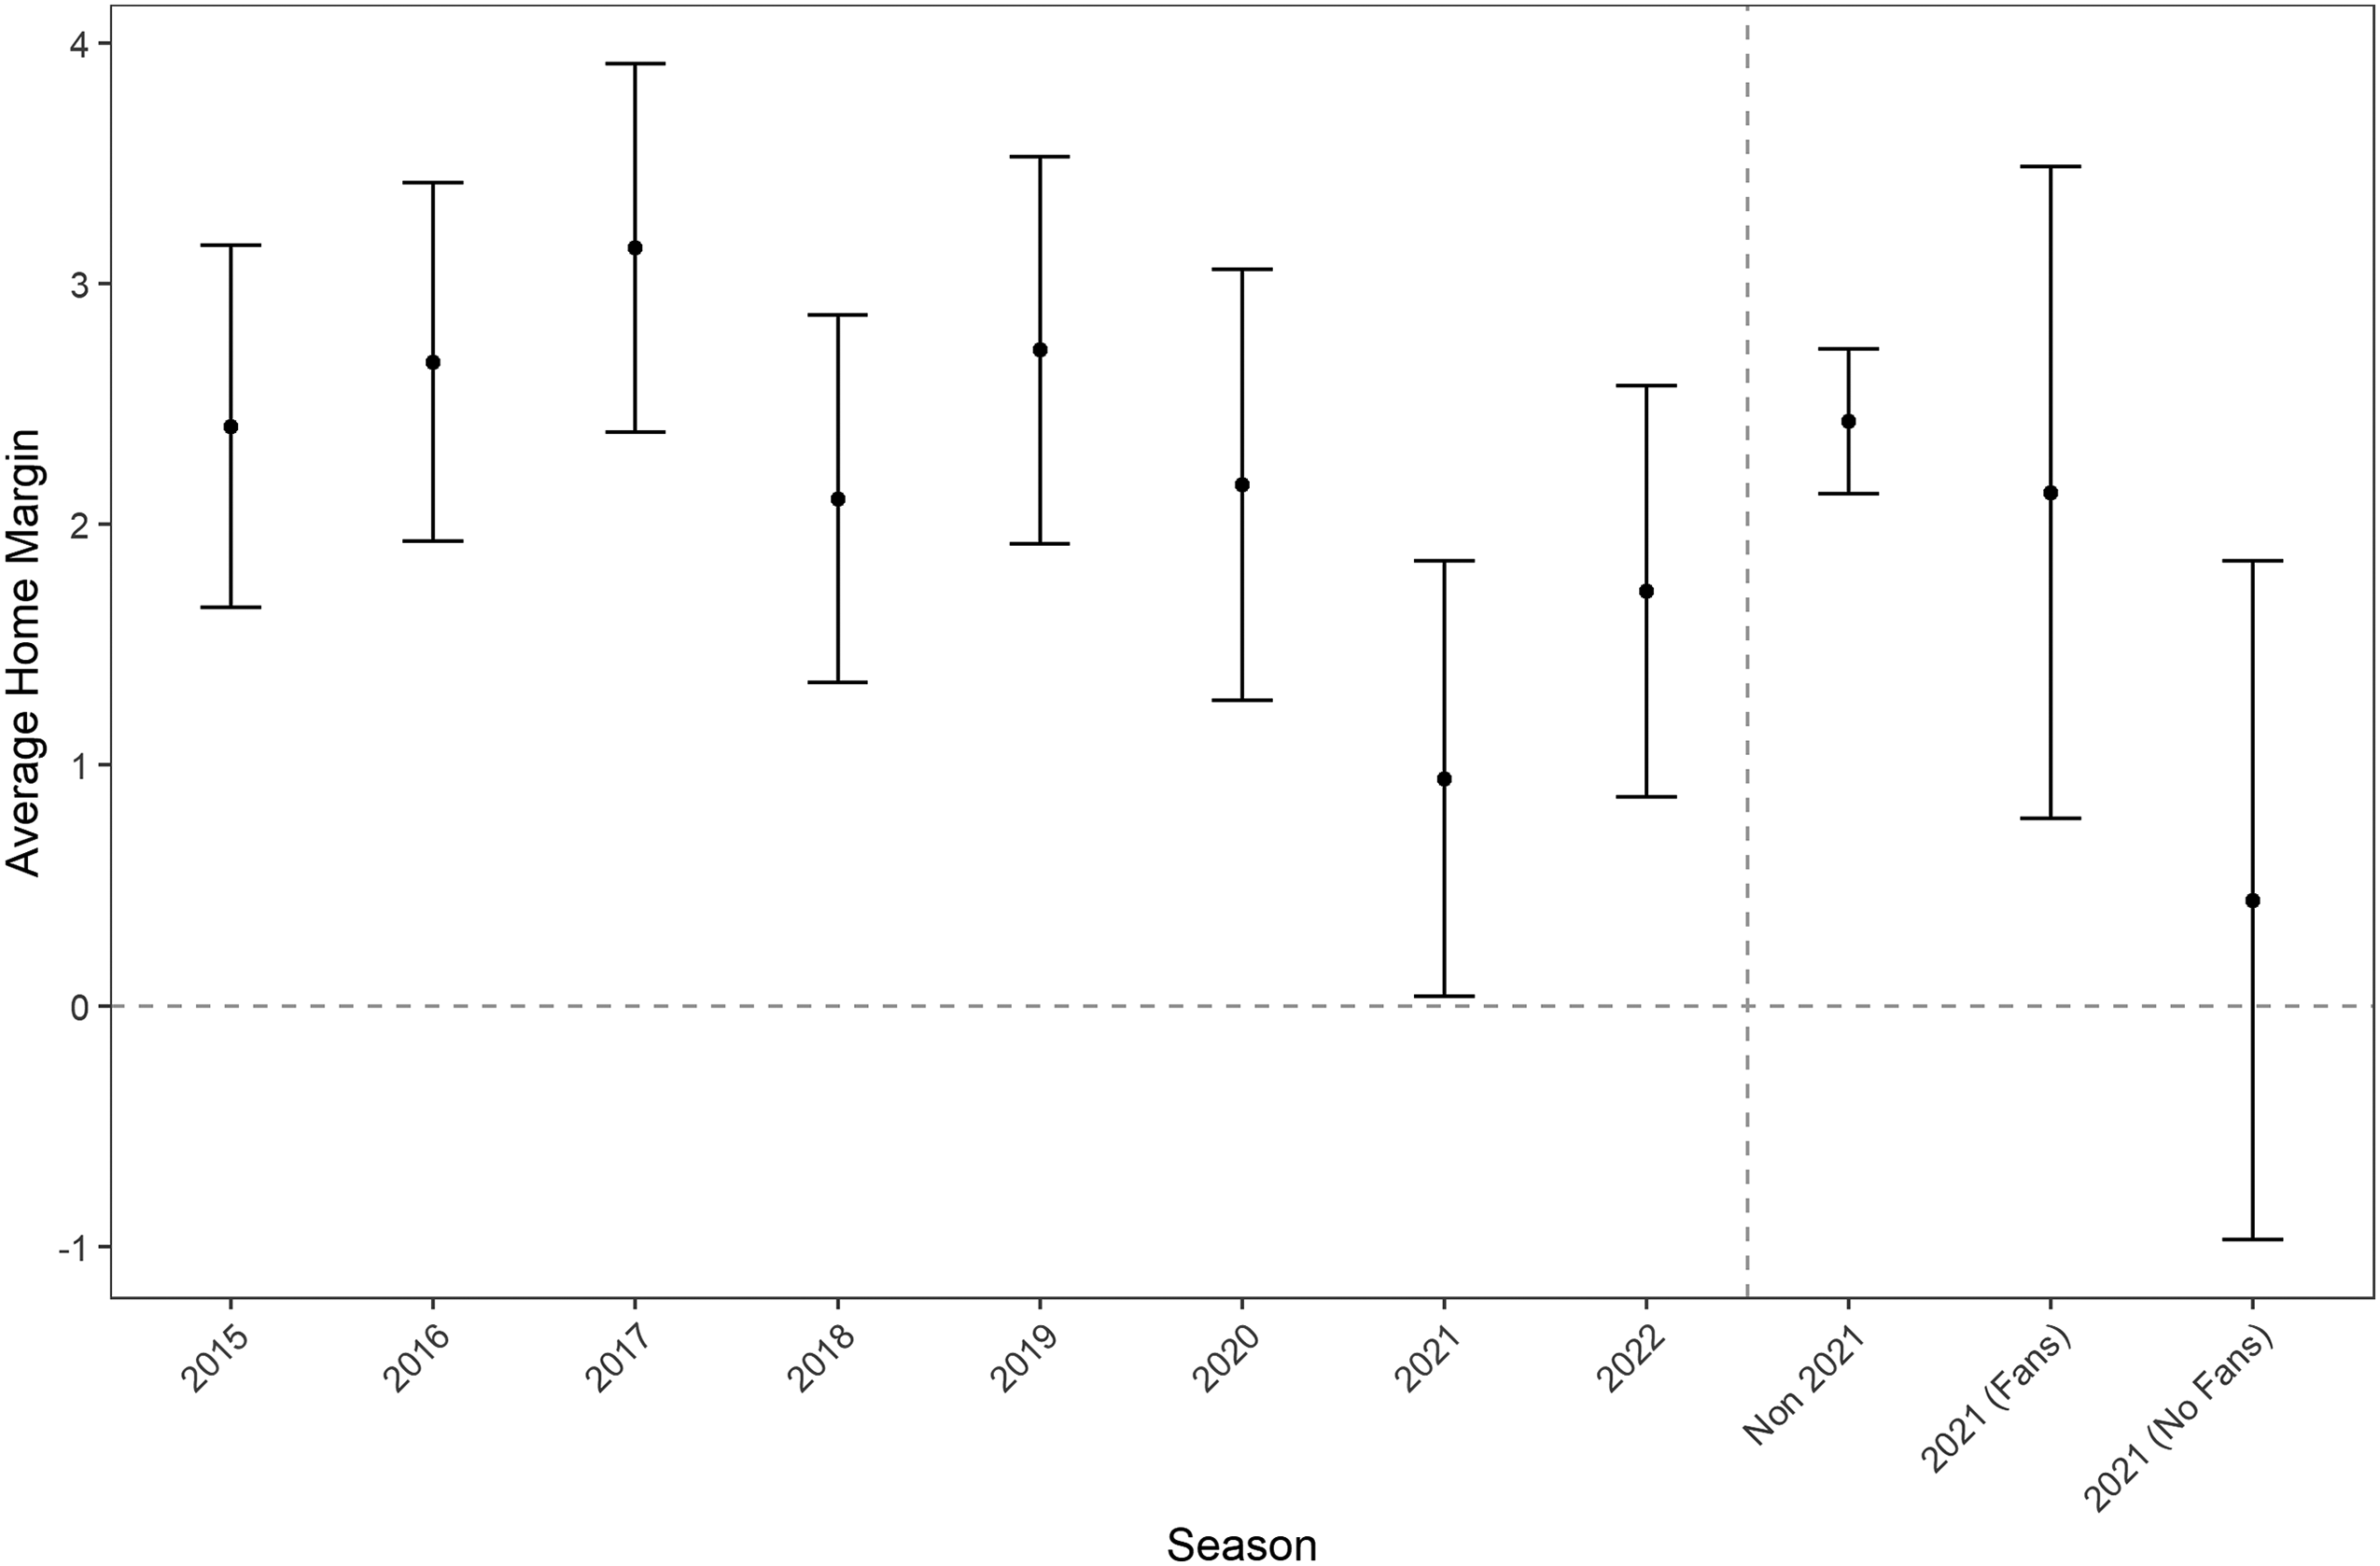
Average home point margin—2014–2015 to 2021–2022 National Basketball Association (NBA) regular seasons.
We next display the distributions of our key independent variables prior to reporting regression results. Figure 2 displays a histogram of fan attendance by game for the 2020–2021 regular season. Figure 3 displays a similar histogram of maximum allowable capacity. Figure 4 plots the bivariate relationship between fan attendance and maximum allowable capacity for games where the capacity was greater than zero. They are correlated at the
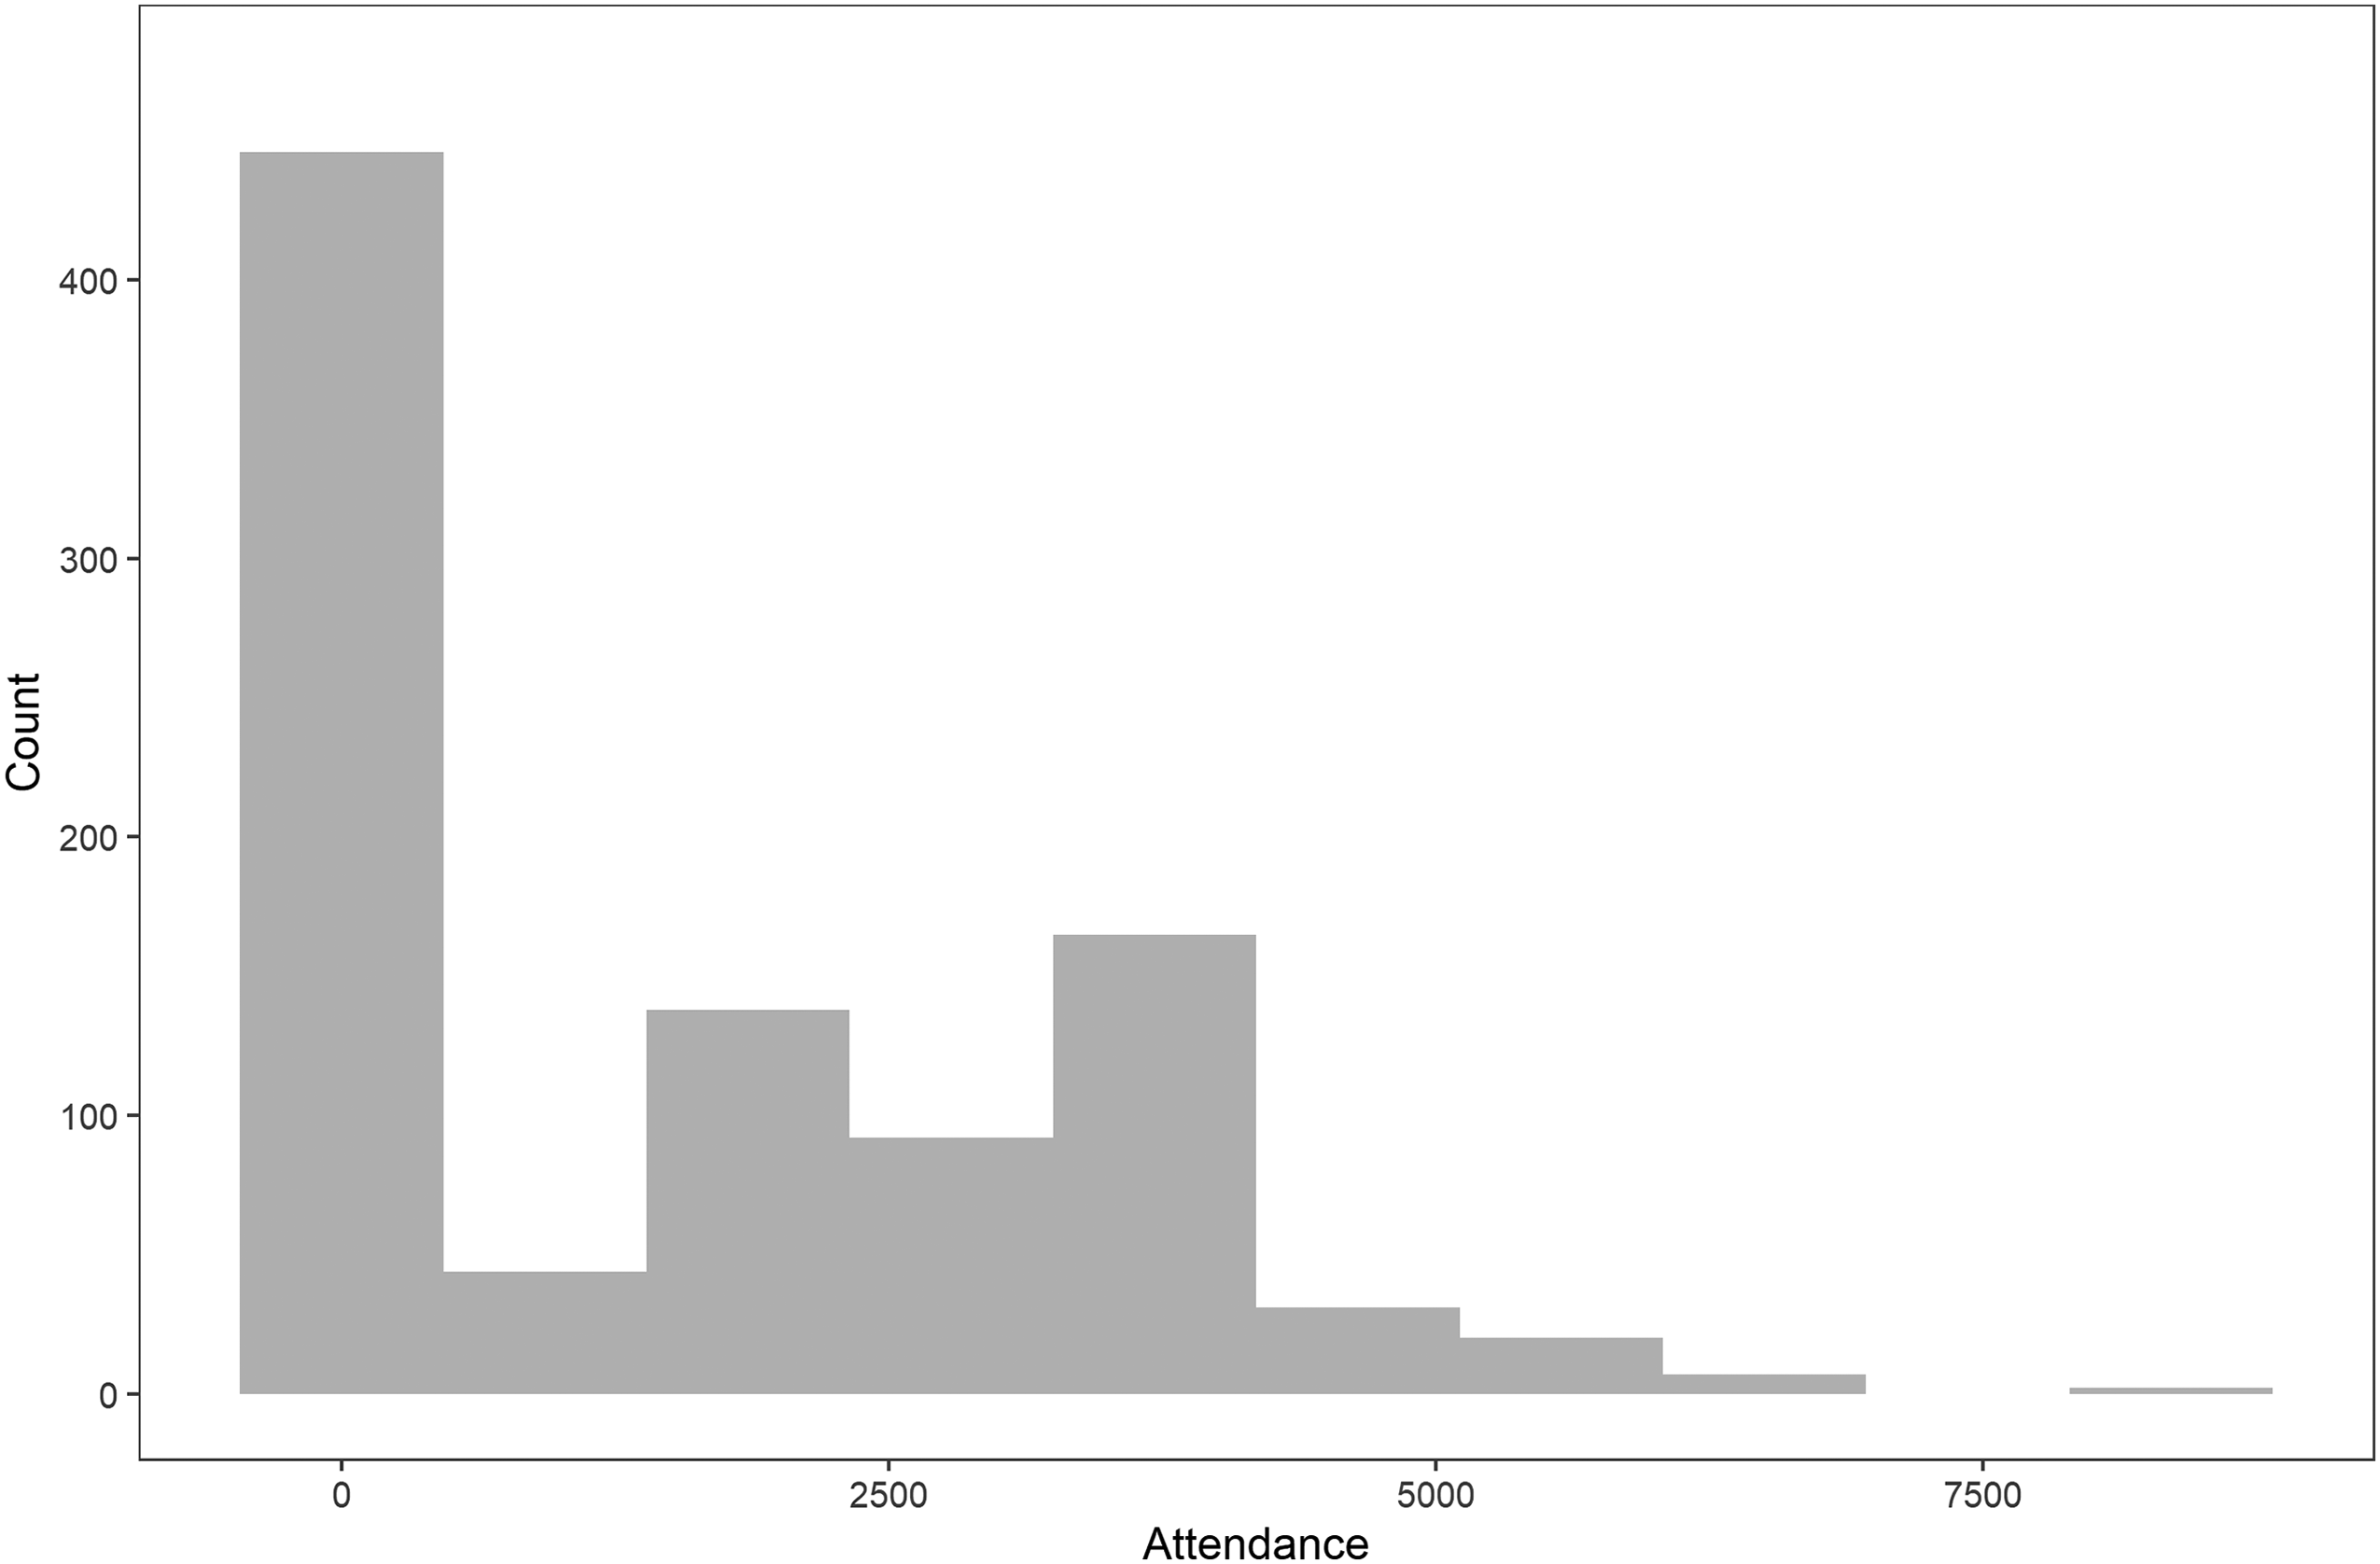
Histogram of attendance—2020–2021 National Basketball Association (NBA) regular season.
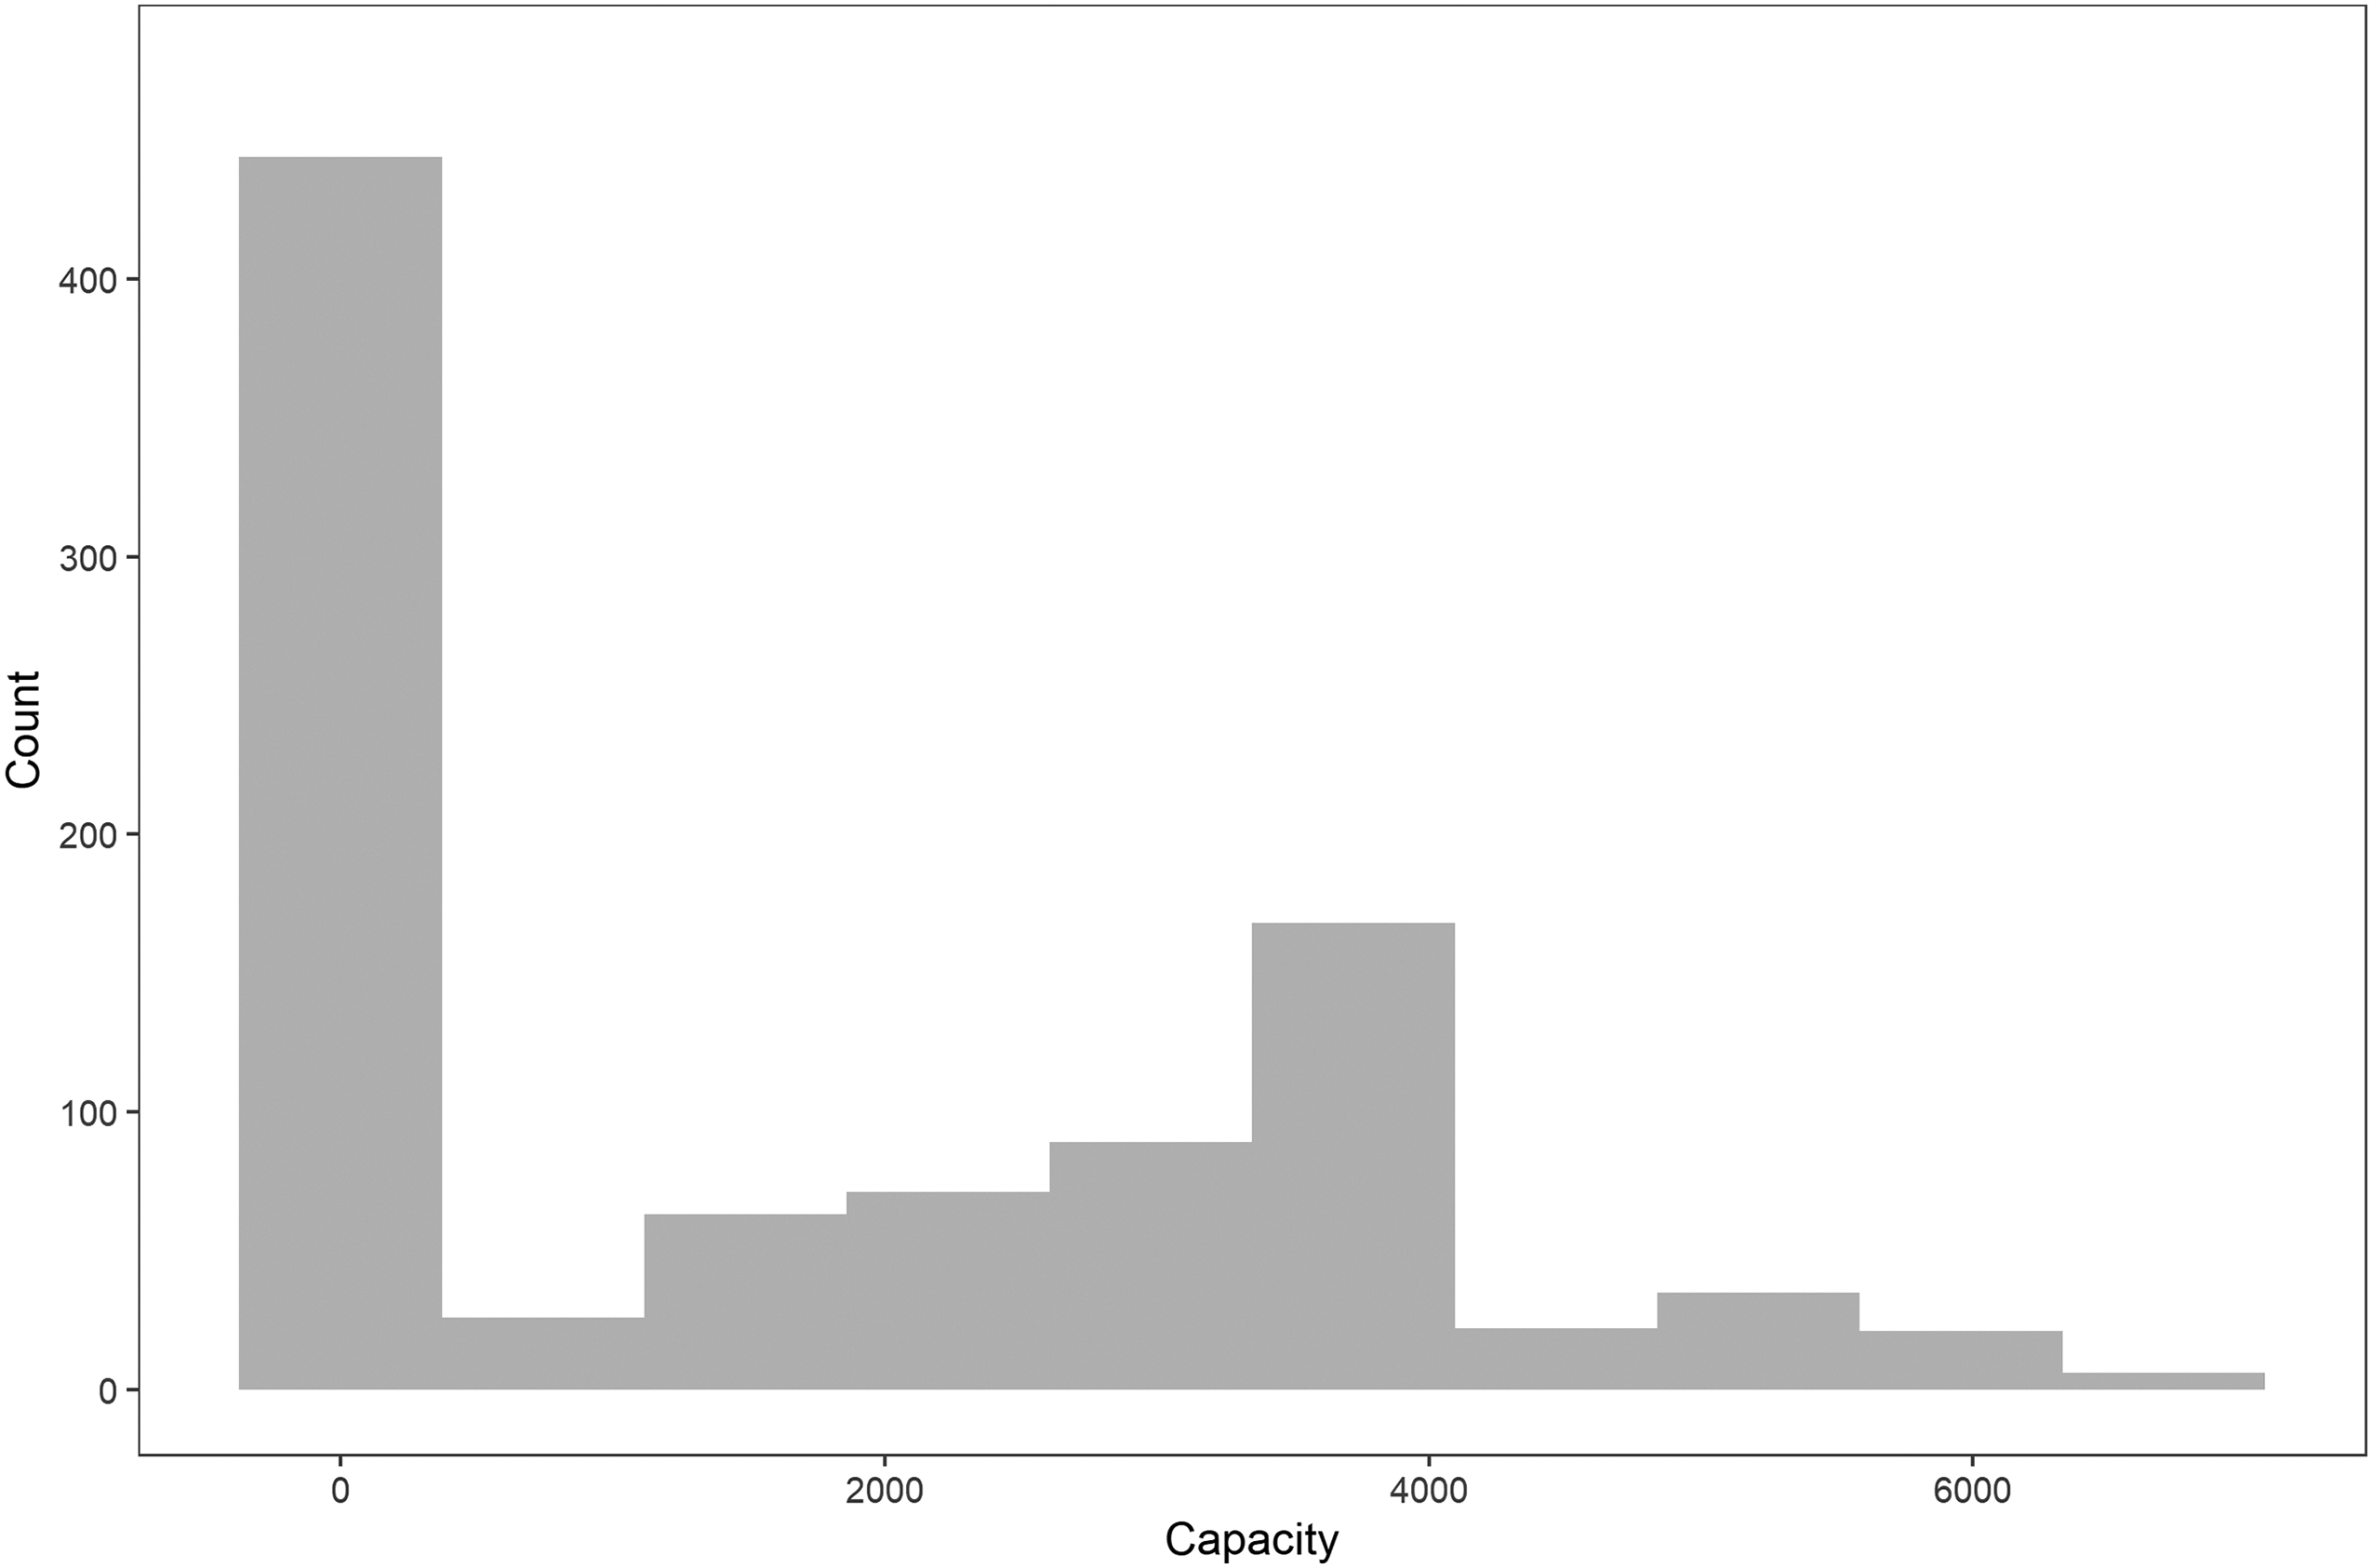
Histogram of maximum allowable capacity—2020–2021 National Basketball Association (NBA) regular season
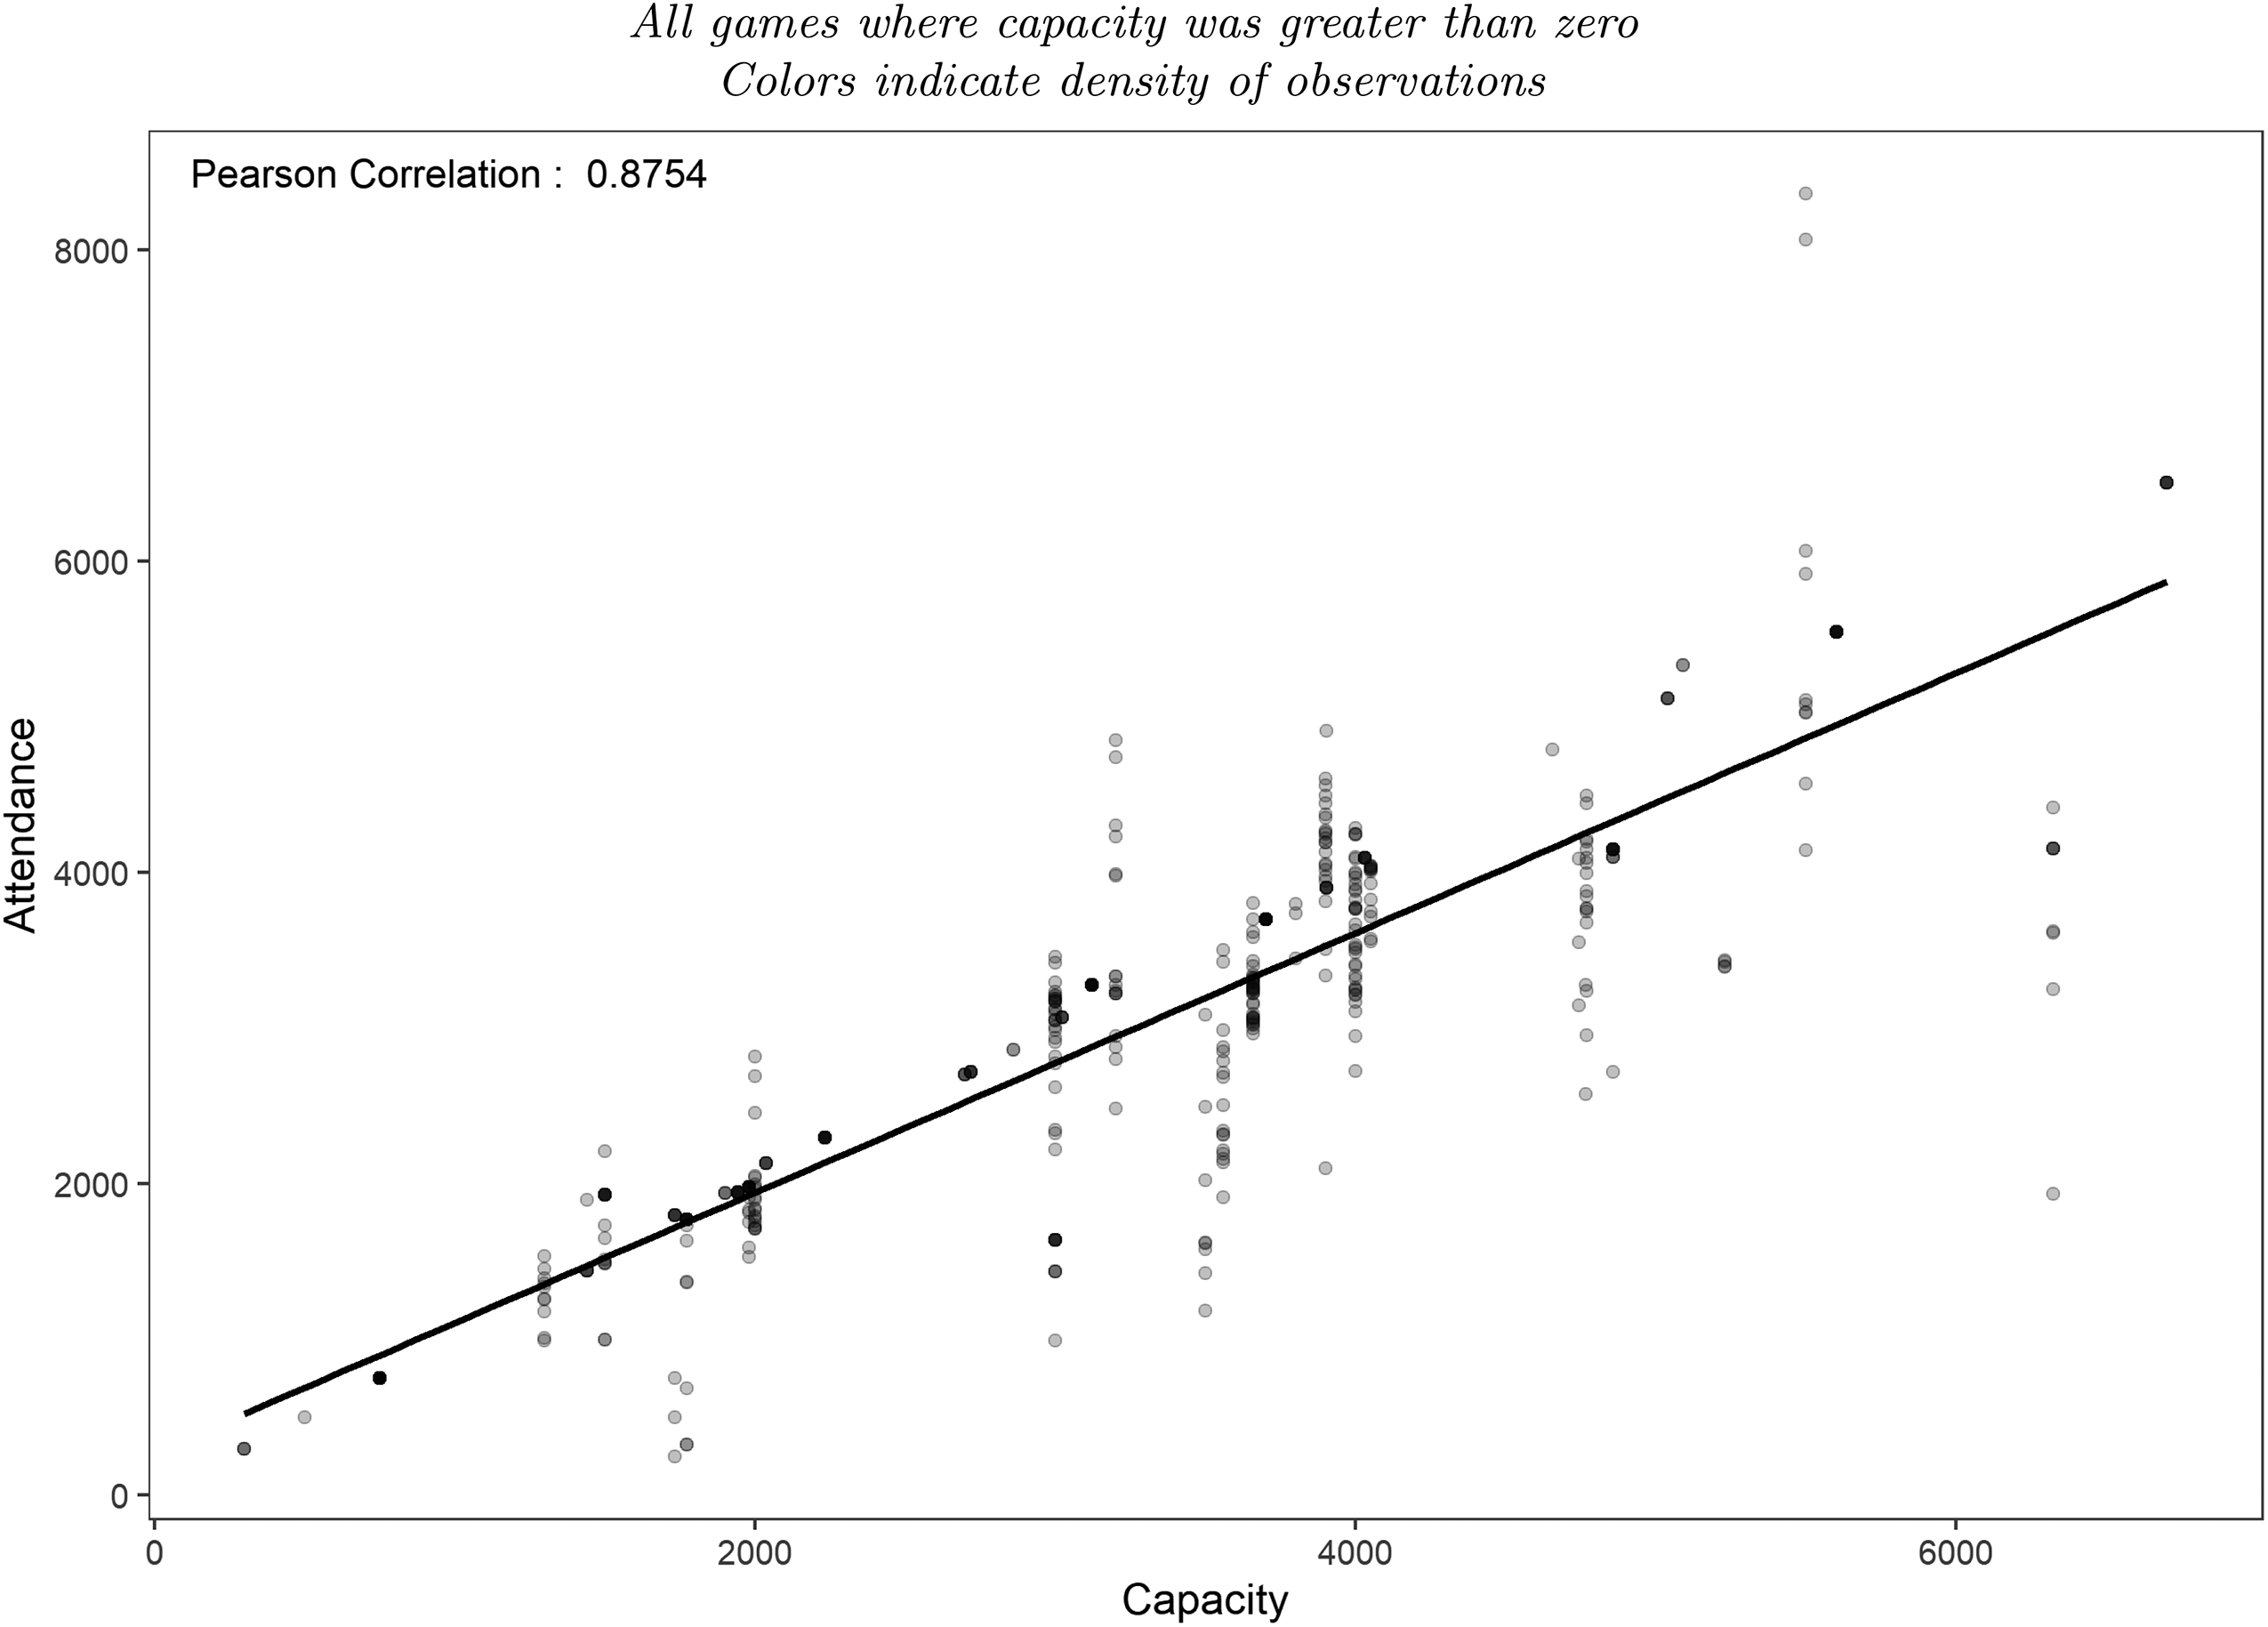
Correlation of attendance and maximum allowable capacity—2020–2021 National Basketball Association (NBA) regular season.
To assess the extent of within-team and cross-sectional variation in our data, Figure 5 shows the maximum allowable capacity for each team in the data across the 2020–2021 regular season. For some teams, we obtain five different levels of maximum capacity across the season while for others there is only one maximum capacity value. Increases in maximum capacity appear to occur at different times in the season for different teams and increases differ in magnitude across the league. We further observe decreases in capacity with the Memphis Grizzlies, Toronto Raptors, and Minnesota Timberwolves. 3
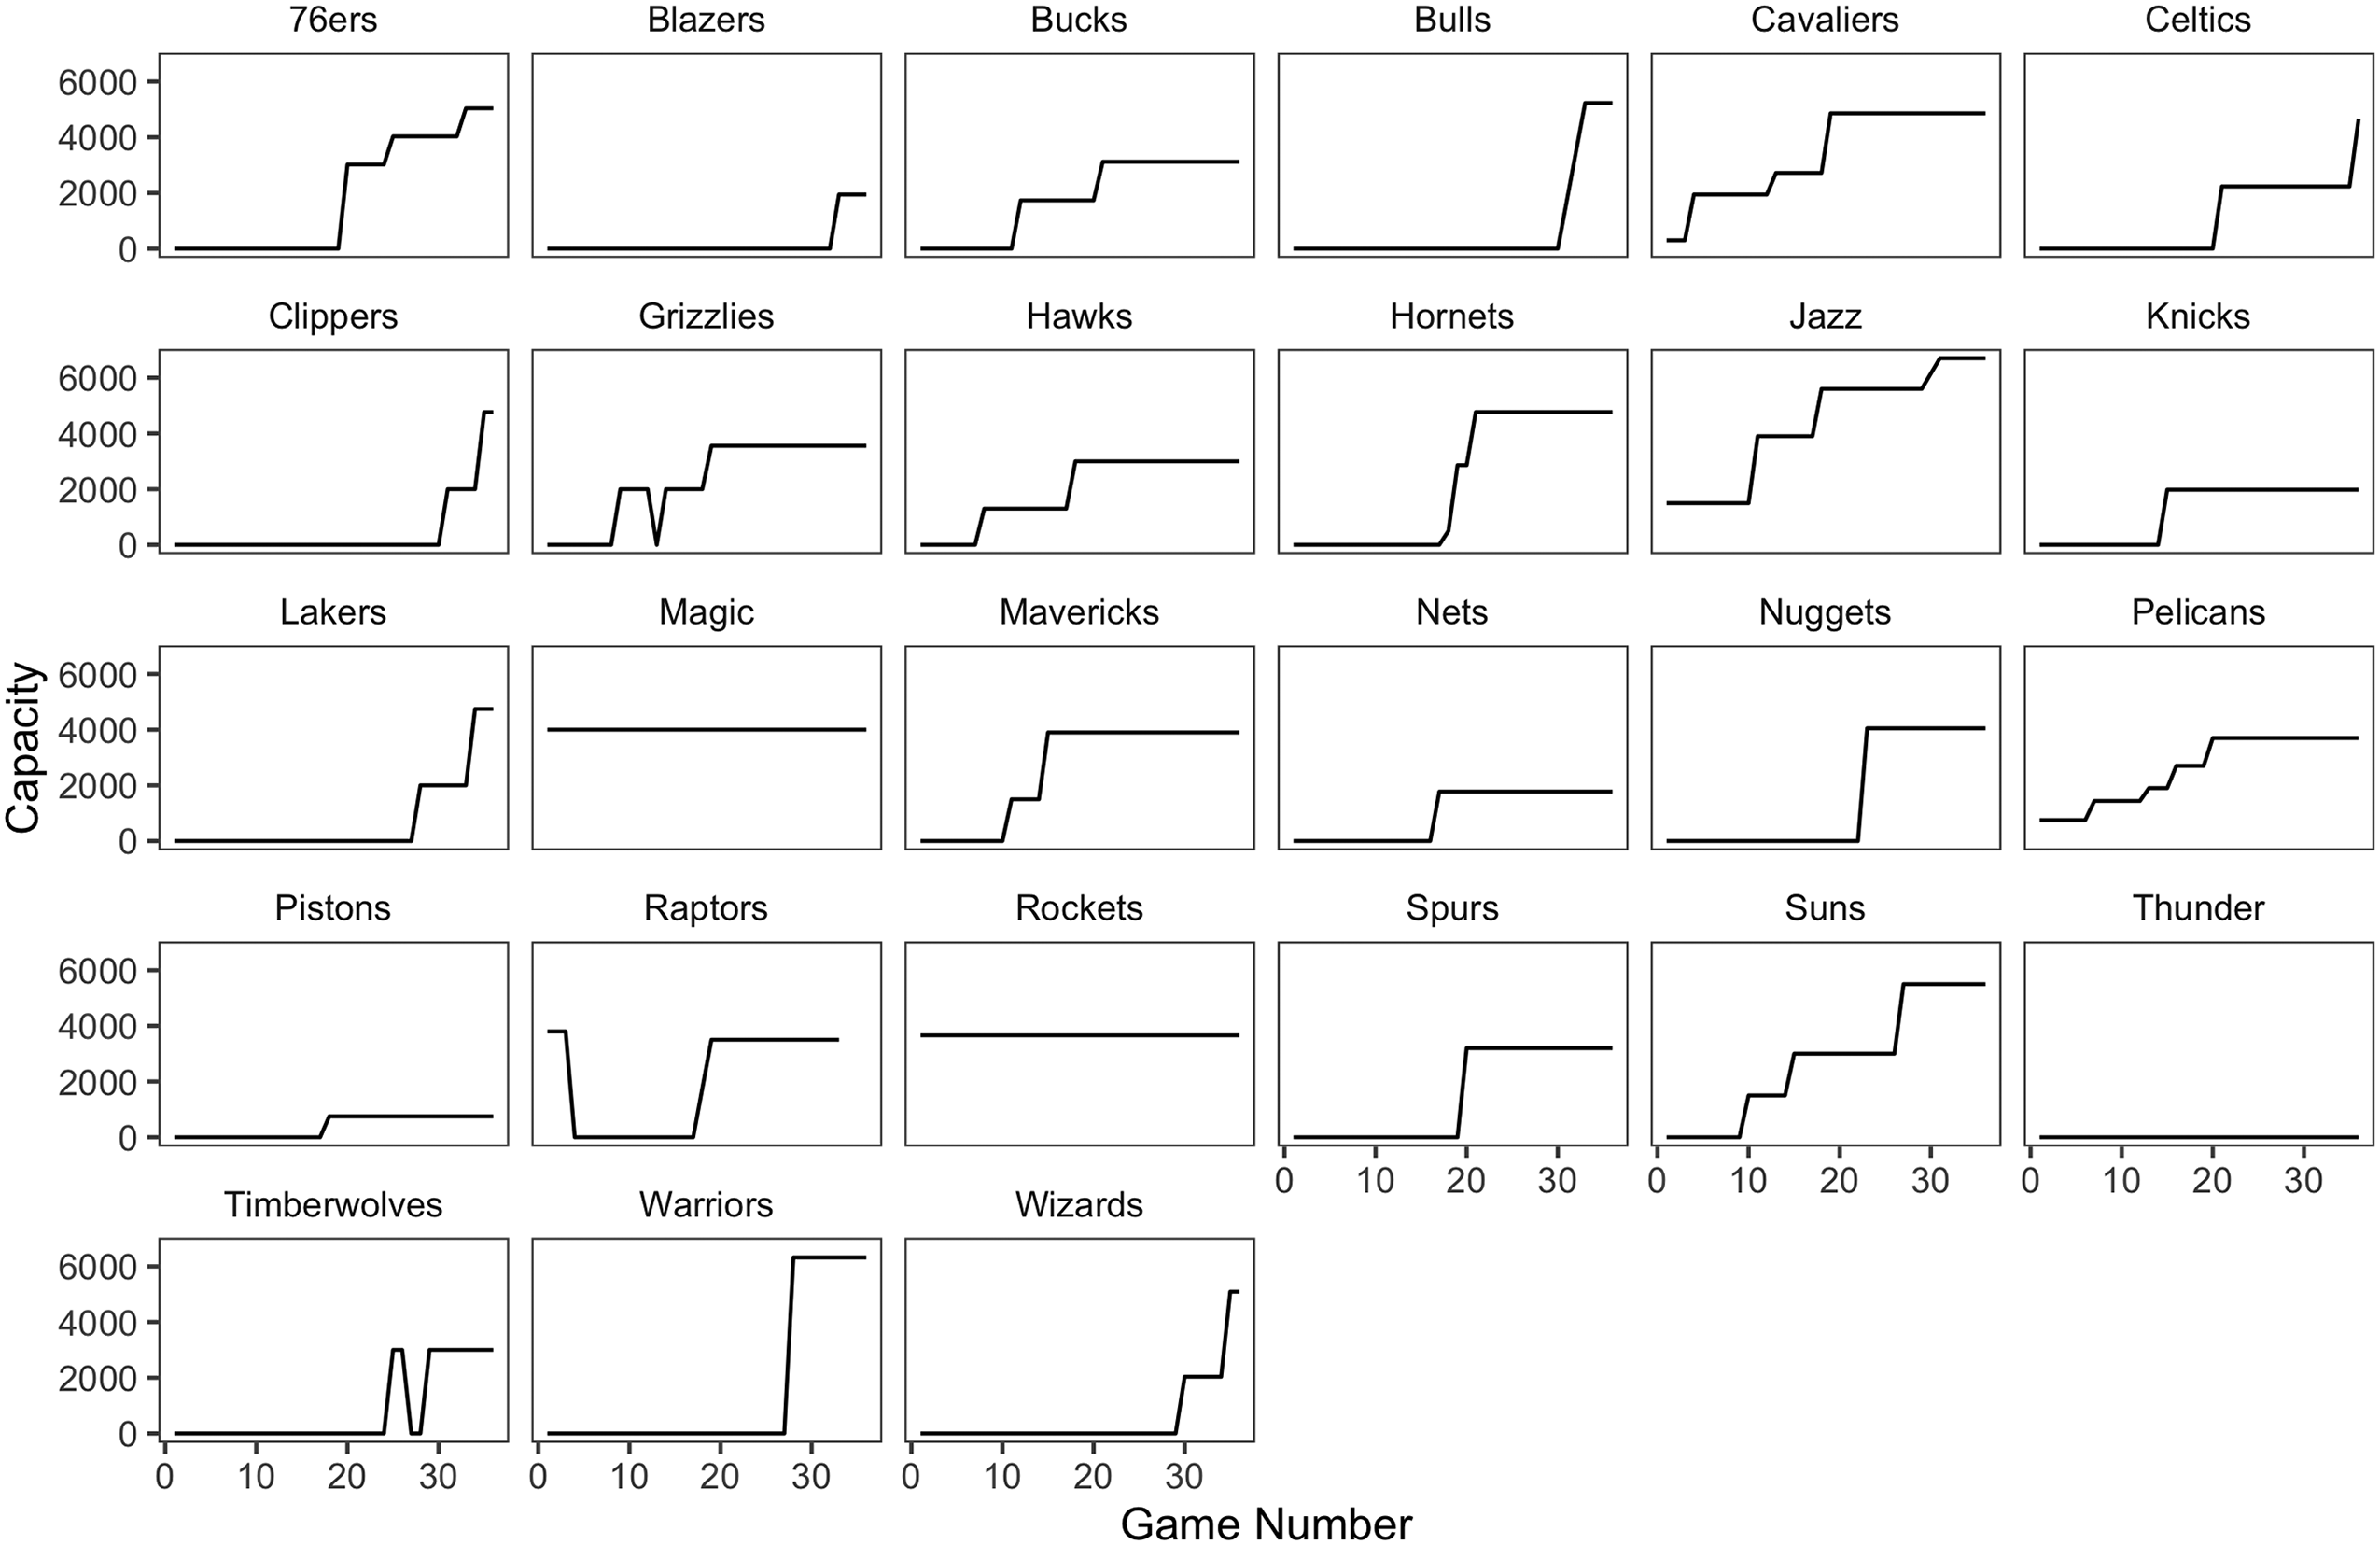
Maximum allowable capacity by team—2020–2021 National Basketball Association (NBA) regular season
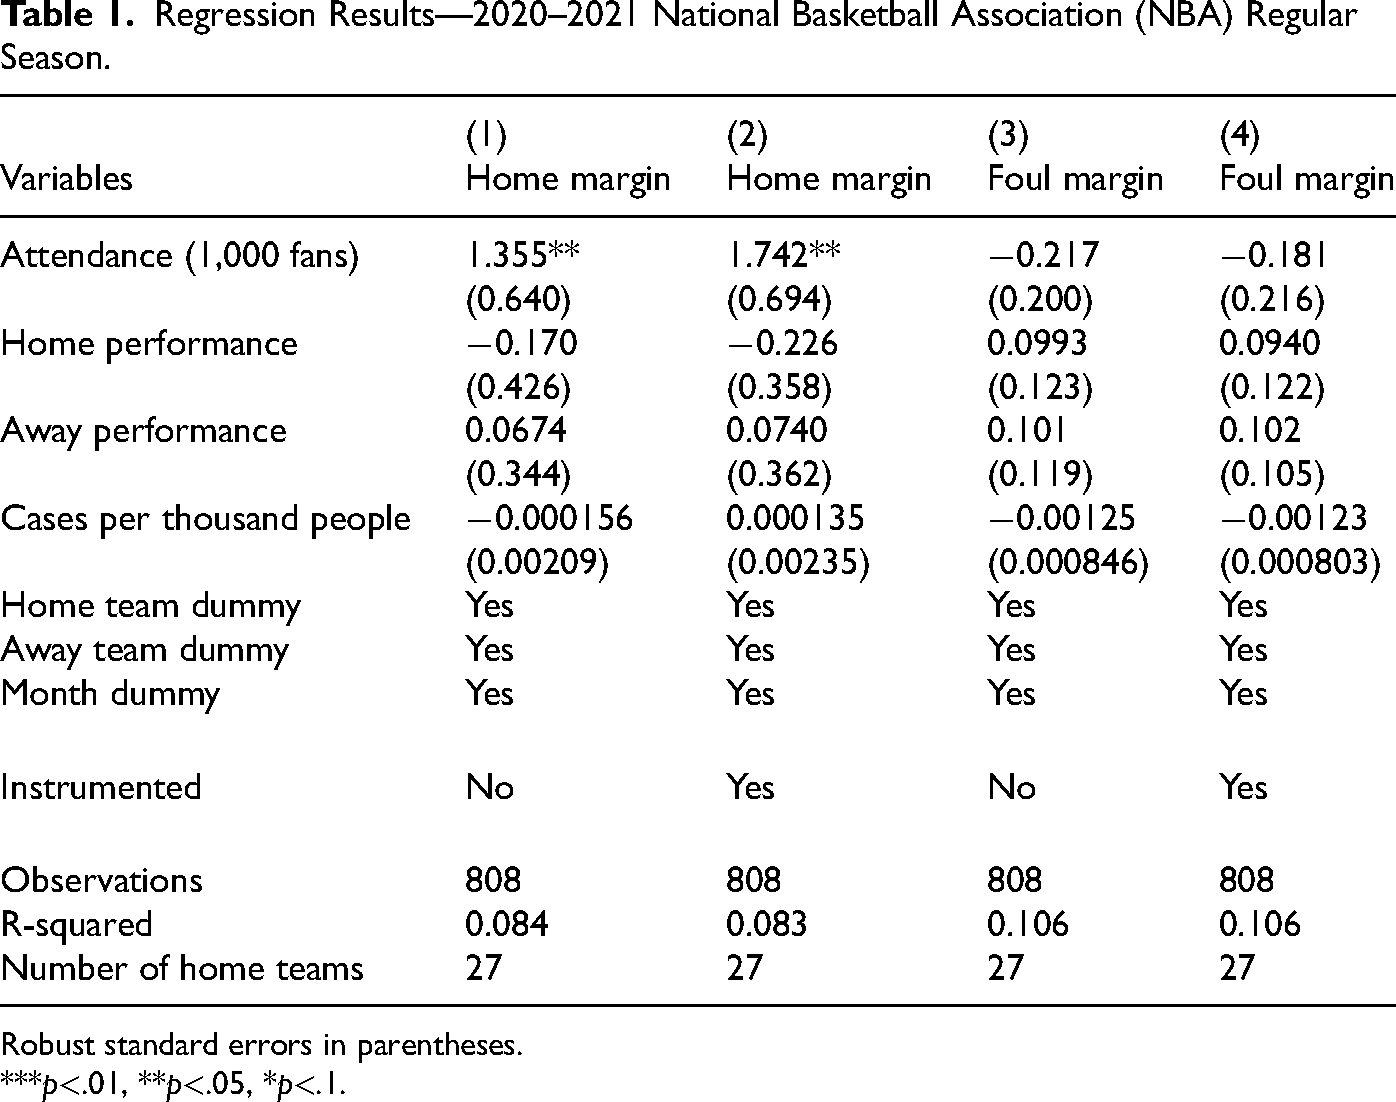
Next, we report our main regression analyses, which focus on variability in fan attendance during the 2020–2021 season and are presented in Table 1. Model 1 reports results from an (uninstrumented) fixed effects model. The marginal effect of an additional one thousand fans on home-court advantage is approximately
Regression Results—2020–2021 National Basketball Association (NBA) Regular Season.
Robust standard errors in parentheses.
***
In the third and fourth columns of the table, we also report the results from models in which the dependent variable is the foul margin. The coefficient on fan attendance is insignificantly different from zero in both models. These results, thus, do not support the claim that the impact of fans on home-court advantage is mediated by an impact on the referees.
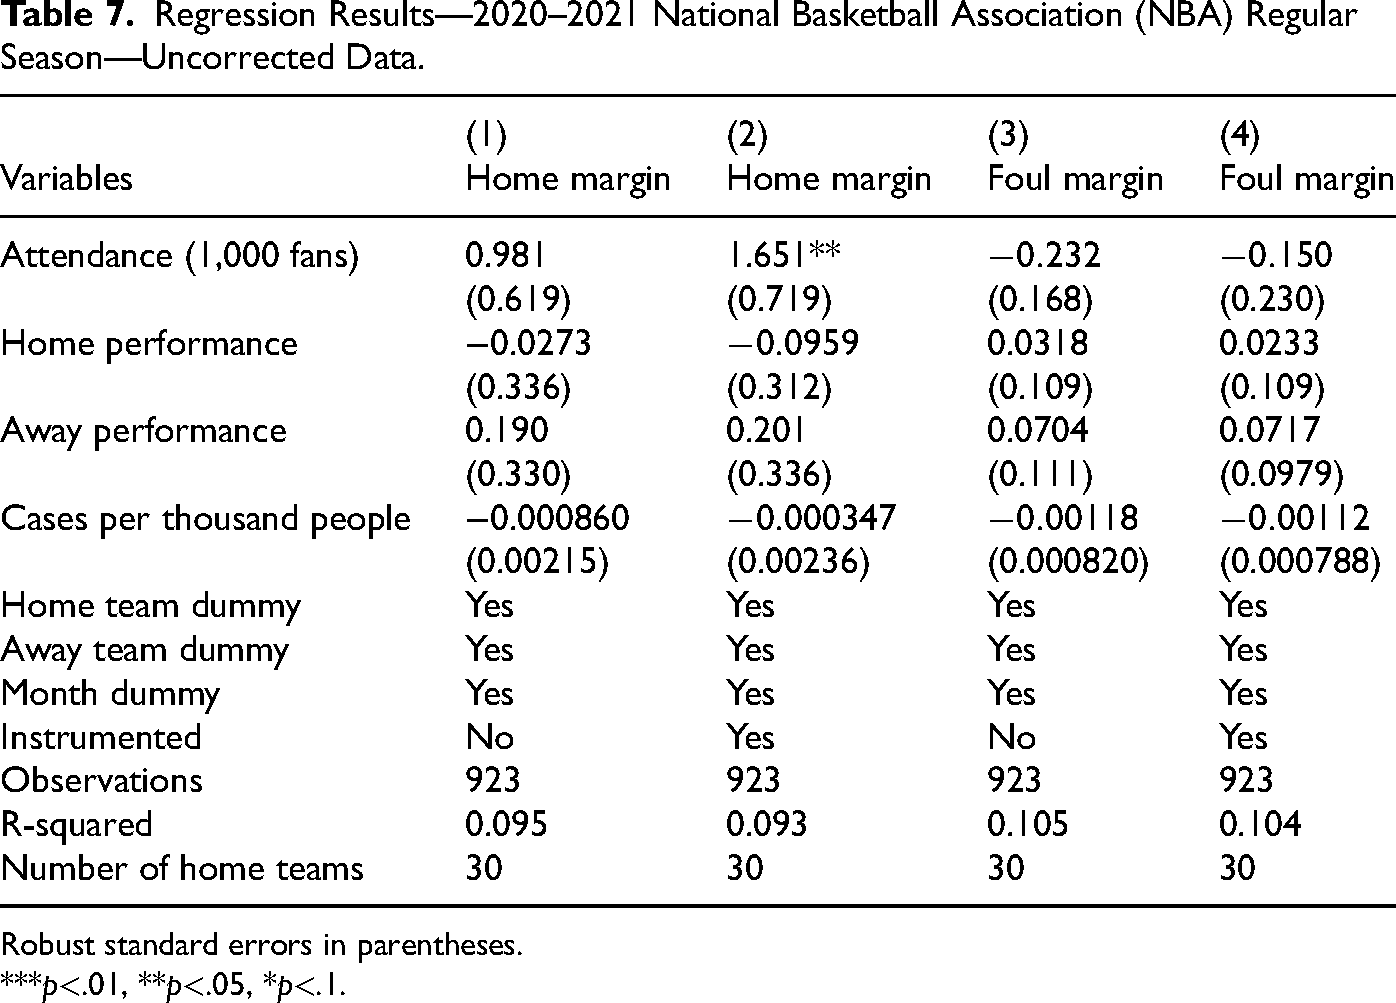
We also present results estimated on data that include the 25 games removed from our main analysis. In the appendix in Table 7, we produce the results for the same models using the uncorrected data. In the fixed effects model, the effect of fan attendance is attenuated somewhat, which is to be expected given the inclusion of additional data where zero attendance is incorrectly reported. In the instrumented model, however, the results are very similar to those found in Table 1 using the corrected data. In both the corrected and uncorrected datasets, the impact of attendance on the foul margin is insignificant in both the uninstrumented and instrumented models.
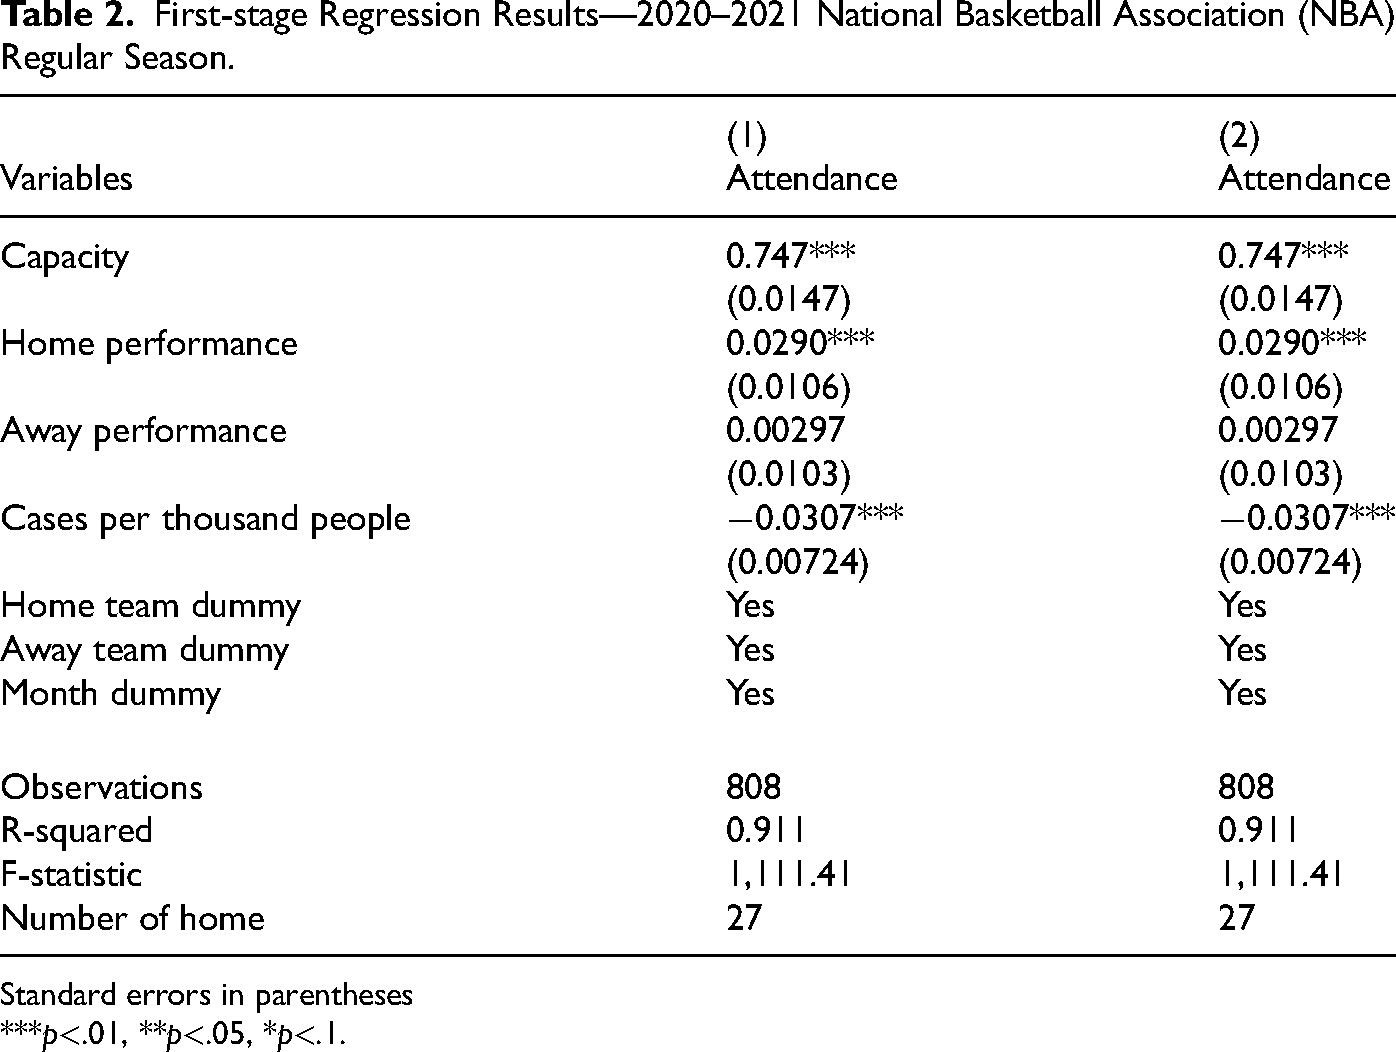
We also report the first-stage results of the two-stage least squares regressions in Table 2 in order to demonstrate the strength of maximum permitted attendance as an instrument for observed attendance. The high value of the
First-stage Regression Results—2020–2021 National Basketball Association (NBA) Regular Season.
Standard errors in parentheses
***
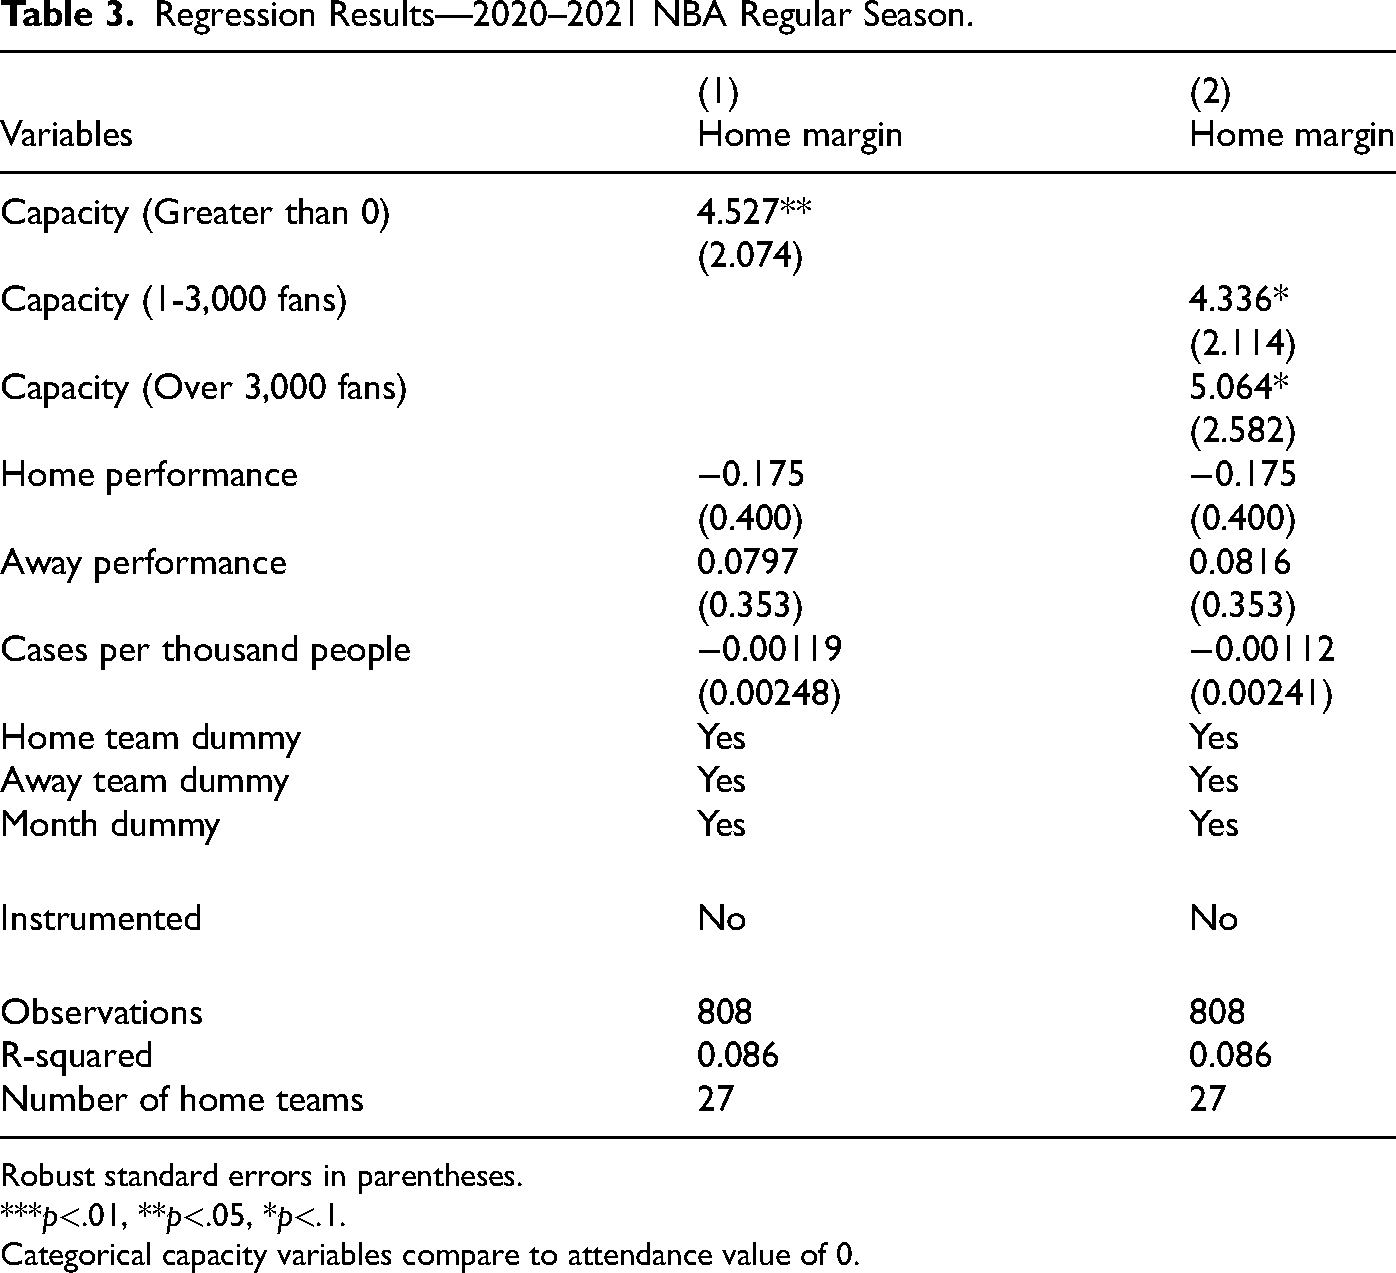
In Table 3, we present the results of the same regressions as in the first column of Table 1, but include capacity as a binary variable indicating whether or not fans were allowed to be present (in the first column) and then as a categorical variable with categories for zero capacity,
Regression Results—2020–2021 NBA Regular Season.
Robust standard errors in parentheses.
***
Categorical capacity variables compare to attendance value of 0.
Regression Results—2014–2015 to 2021–2022 National Basketball Association (NBA) Regular Seasons.
Robust standard errors in parentheses
***
Games Reporting Zero Attendance with Photographic or Video Evidence of Fans.
Stadium Capacity Limits—2020–2021 National Basketball Association (NBA) Regular Season.
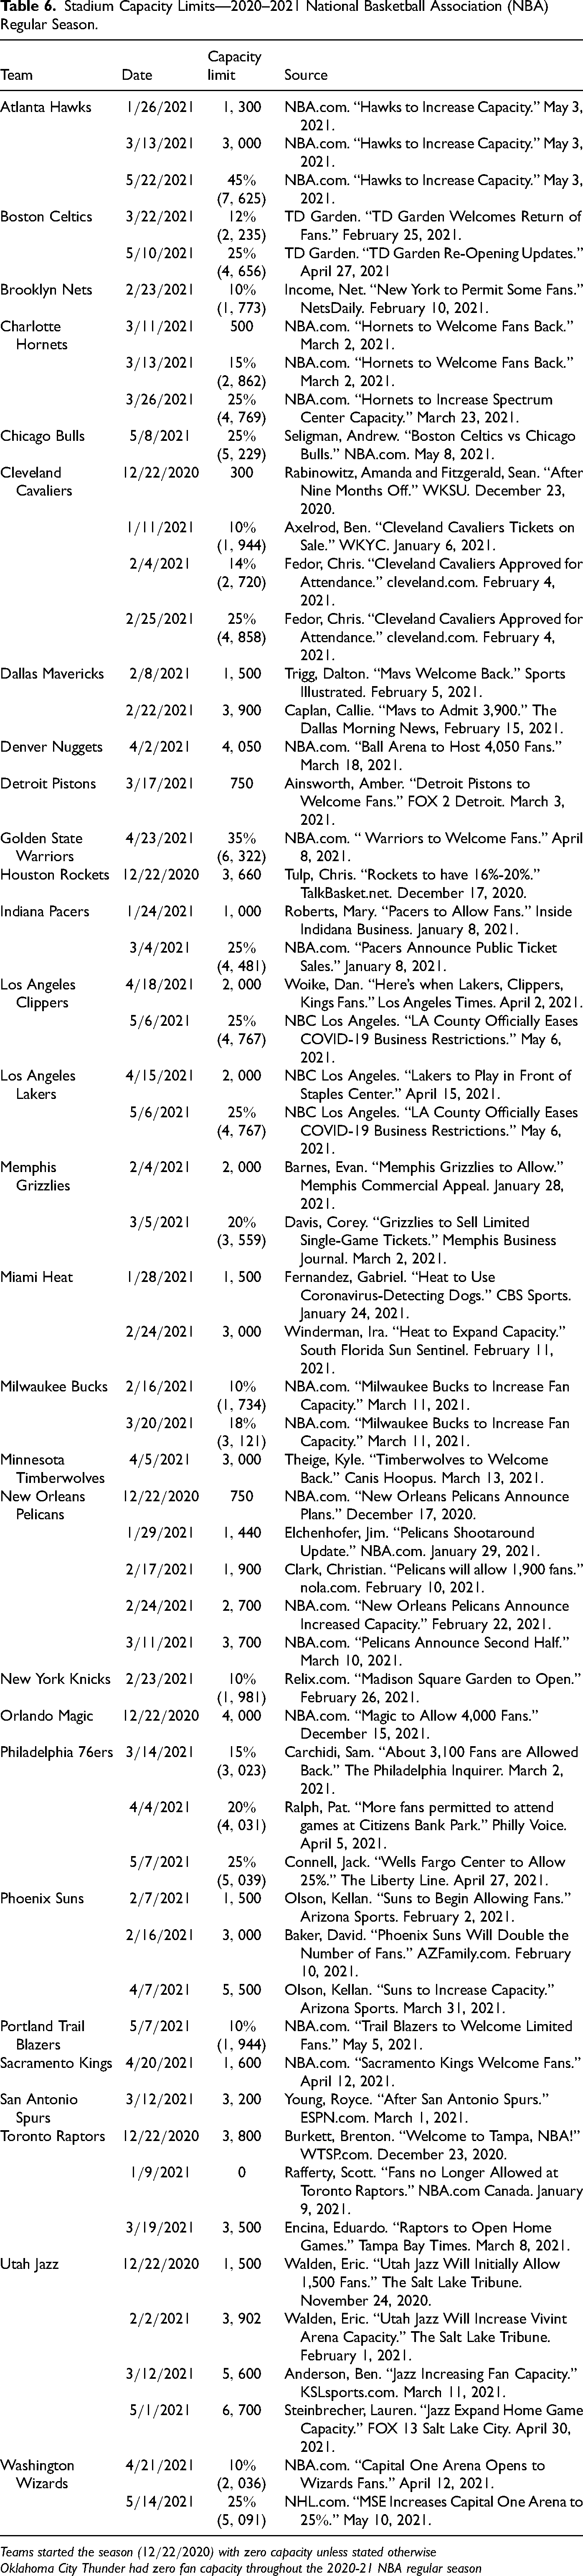
Teams started the season (
Oklahoma City Thunder had zero fan capacity throughout the 2020-21 NBA regular season
Regression Results—2020–2021 National Basketball Association (NBA) Regular Season—Uncorrected Data.
Robust standard errors in parentheses.
***
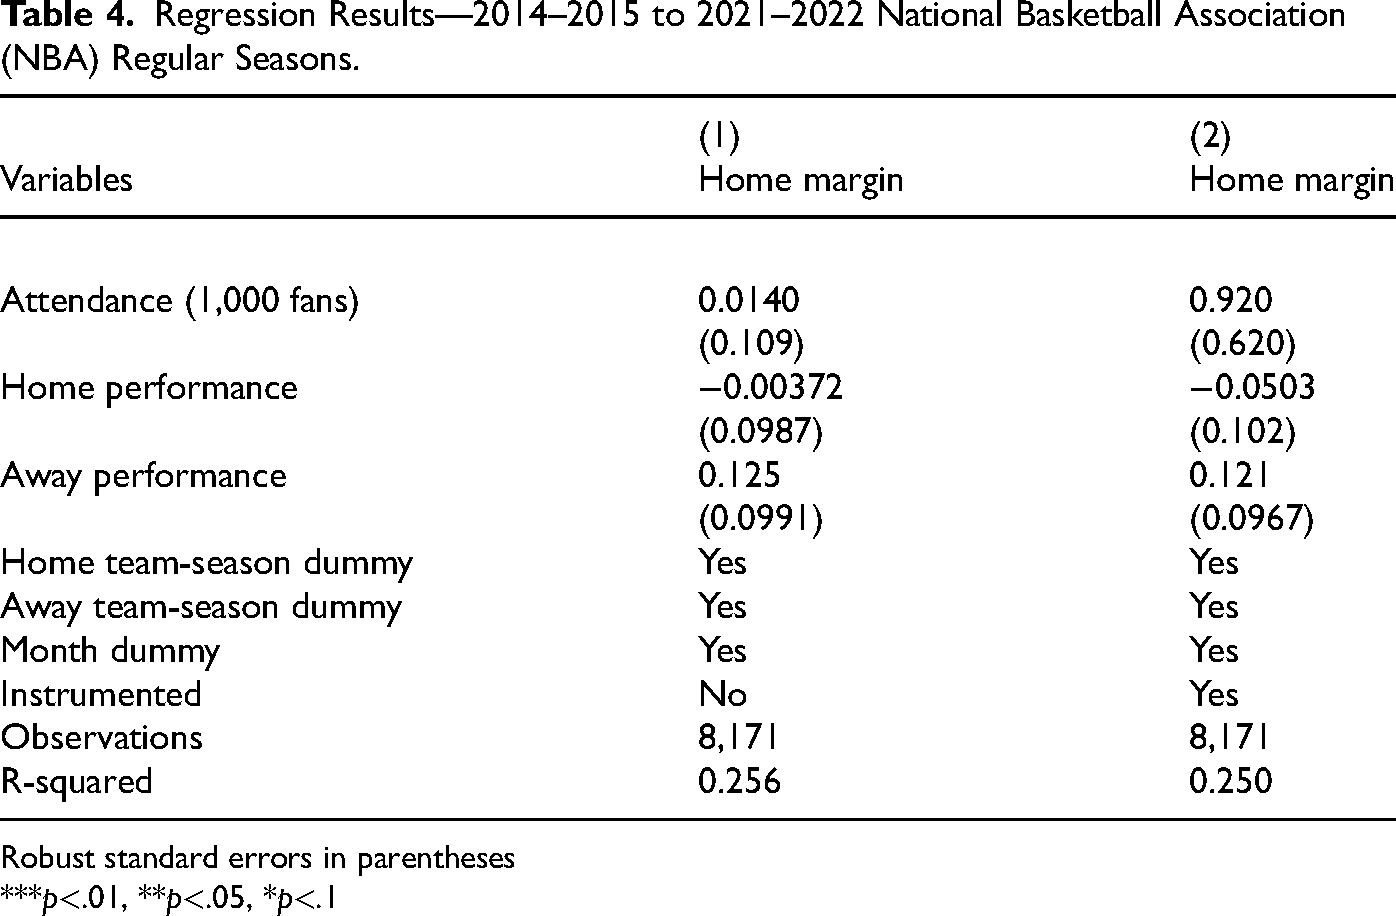
Lastly, we present the results of models estimated on all of the data from the 2014–2015 to the 2021–2022 NBA Regular Season, when there were no pandemic-driven restrictions on fan attendance. These data therefore primarily include games with near-capacity crowds. The first column reports coefficients from an uninstrumented fixed effects model and finds a small and insignificant positive effect of attendance on home-court advantage. The second column includes the maximum allowed attendance as an instrument for observed attendance. Again, the effect is insignificantly different from zero and very imprecisely estimated, in part due to the much weaker conditional correlation between maximum capacity and observed attendance. Together, these results offer suggestive evidence that the impact of fans on home-court advantage is stronger for small crowds than for those at near capacity.
Discussion and Conclusion
Our paper uses instrumental variables regression to examine whether fan attendance causes home-court advantage. By utilizing exogenous variation in capacity limits during the 2020–2021 NBA regular season, we avoid the problems of reverse causality that plague other empirical studies. We find a strong effect of fan attendance on home team performance. Games with fans are associated with a
It is helpful to place in context the size of this effect in terms of team performance. FiveThirtyEight’s Pythagorean expectation estimates teams’ winning percentages as a function of expected points scored and points allowed. Multiplying the formula by the number of home games in a season allows us to predict the effect of fans in attendance on the number of home wins expected in a season. According to basketball-reference.com, teams scored, on average, 112.1 points per game in the 2020–2021 NBA season. When we consider that, on average, home-court advantage improves by 1.69 points when fans are in attendance, this equates to approximately 2.2 additional home wins over the course of a full NBA regular season. Further, if we use our predicted estimate in column 1 of Table 1 that an additional 1,000 fans in attendance improves home-court advantage by 1.74 points and the fact that average attendance in the 2020–2021 season when capacity was greater than zero was 2,960, then this equates to approximately 6.4 additional home wins over a full season. Alternatively, using our predicted estimate in column 1 of Table 3, having fans in attendance versus having no fans in attendance adds approximately 5.7 home wins over the season.
However, there are important scope conditions to this result. First, the effect of fans on home-court advantage is only identified over the support of the data. The maximum attendance for any game during the 2020–2021 regular season was 8,359, which remains far below maximum capacity of any arena. We strongly caution against using these coefficient estimates to inform, for example, the impact of adding an additional one thousand fans when arenas are near full capacity. The fact that our study evaluates empty and near-empty arenas also makes it difficult to compare our results to prior work that evaluates the mechanisms causing home-court advantage in arenas near or at capacity. For example, common explanations for referee bias, which include the psychological effects of crowd size and noise, are unlikely to be as powerful in settings with such restricted attendance.
Second, our ability to estimate the effect is a result of this study being conducted during a pandemic, which impacts the external validity of the study. If fans make it easier for players to ignore off-the-court distractions, for example, the effect size could be overstated in our context. Further, the psychological effect of having fans present after a year of empty arenas could differ from the impact, for example, of having fans absent for random games scattered throughout a normal regular season. In contrast, if external stress makes players less sensitive to their external environment, the effect size could be understated. Of note, the absence of fans at a professional sports arena is always going to be associated with unusual circumstances of some sort. Any empirical estimate of the impact of fans on home-court advantage will face similar concerns about external validity.
With those caveats in mind, we cannot help but reemphasize just how strong of an effect we observe in this setting. With no fans in the stands, there is no evidence of a home-court advantage. With fans in the stands, the home-court advantage rebounds to its usual magnitude. The outsized effect of fan attendance on home-court advantage implies that this mechanism has likely been under-emphasized in the literature to date, especially relative to alternative mechanisms with smaller effects on game outcomes that have been easier to identify empirically. The mere effect of the first few hundred or thousand fans in the stands in an otherwise nearly empty arena is thus a good deal larger than the literature—and, for that matter, many of the players—previously thought.
Supplemental Material
sj-pdf-6-jse-10.1177_15270025231200890 - Supplemental material for A Mere Fan Effect on Home-Court Advantage
Supplemental material, sj-pdf-6-jse-10.1177_15270025231200890 for A Mere Fan Effect on Home-Court Advantage by Scott C Ganz and Kieran Allsop in Journal of Sports Economics
Supplemental Material
sj-xlsx-7-jse-10.1177_15270025231200890 - Supplemental material for A Mere Fan Effect on Home-Court Advantage
Supplemental material, sj-xlsx-7-jse-10.1177_15270025231200890 for A Mere Fan Effect on Home-Court Advantage by Scott C Ganz and Kieran Allsop in Journal of Sports Economics
Footnotes
Declaration of conflicting interests
The authors declared no potential conflicts of interest with respect to the research, authorship, and/or publication of this article.
Funding
The authors received no financial support for the research, authorship, and/or publication of this article.
Supplemental material
Supplemental material for this article is available online.
Notes
A Appendix
References
Supplementary Material
Please find the following supplemental material available below.
For Open Access articles published under a Creative Commons License, all supplemental material carries the same license as the article it is associated with.
For non-Open Access articles published, all supplemental material carries a non-exclusive license, and permission requests for re-use of supplemental material or any part of supplemental material shall be sent directly to the copyright owner as specified in the copyright notice associated with the article.