
Abstract
This study provides first evidence on how belief dynamics are driving entertainment utility and consequently the demand for sports across markets by analyzing minute-by-minute audience data of UEFA Champions League (UCL) games televised in the UK and the Spanish market during a full (pre-COVID) cycle of broadcasting rights. Overall, we find that suspense and surprise are the main drivers of demand in both markets while shock only has marginal effects in the Spanish market. Interestingly, we find a combined impact of suspense and surprise in the UK market that is of similar magnitude as reported in a previous study for English Premier League matches in the UK. In the Spanish market, however, the combined impact is considerably larger.
Introduction
The preference to understand and be aware of future events is seen as an influential motivator for survival (Bromberg-Martin & Hikosaka, 2009). Yet, in the realm of music, film, books, and sports, where information is non-vital, consumers seem to prefer disruptions to their expectations (Gold et al., 2019). In their seminal work, Ely et al. (2015) developed a comprehensive theoretical model on the demand for such non-instrumental information by focusing on entertainment utility from suspense and surprise.
Suspense is an ex-ante emotion; it is the feeling of anxious uncertainty and is experienced when the consumer is forward looking as to what could happen next. As such, suspense is greater when the upcoming events have a greater significance on the overall outcome. Suspense is most appropriately described as the juxtaposition of hope and fear (Madrigal et al., 2022). For instance, suspense can be experienced during the moments leading up to a penalty kick that would win the match, i.e., the hope to see a game-winning goal and the fear of a miss. 1 This is in distinction to surprise, which is an ex-post emotion that is present when an event occurs suddenly or unexpectedly and causes a shift in what the consumer previously thought the outcome would be. Ely et al. (2015) define a period to be more surprising when the current belief is further from the last period's belief, i.e., if the current events are vastly different from the previous events, the period is more surprising. For instance, surprise can be generated in a soccer match when a team opens the score against all odds.
Quite recently, Buraimo et al. (2020) have introduced a further entertainment utility factor: shock. Shock is similar to surprise. However, while the reference point for surprise is the (average) expectation over the outcome in the minute before, the reference point for shock is the (average) expectation over the outcome prior to kick-off. As such, shock is experienced when the current outcome probabilities are drastically different from those considered prior to the start of the match; For instance, when a heavily favored team is facing a high probability of losing to the pre-match underdog.
Despite the managerial relevance for broadcasters, sponsors, leagues, and clubs, empirical evidence on whether entertainment seeking sport consumers prefer suspense, surprise and/or shock elements in sports competitions is sparse. In a first application of these concepts to sports, Bizzozero et al. (2016) utilized minute-by-minute television audience data from international men's tennis matches played in Wimbledon (UK) broadcast in Switzerland on free-to-air networks. Overall, they find that both surprise and suspense are important drivers of demand. Surprise, however, tends to be more important than suspense. In a second application, Buraimo et al. (2020) modeled minute-by-minute television audience data from the English Premier League broadcast in UK on pay-TV networks. Similar to Bizzozero et al. (2016) they found that both surprise and suspense matter for viewership. However, in contrast to Bizzozero et al. (2016), the authors report a proportionally smaller combined impact of both cues. Simonov et al. (2023) focus on eSports and analyze streaming viewers of the game Counter-Strike: Global Offense (CS:GO). The authors find evidence that suspense is a significant indicator for viewership. On the contrary, however, surprise has little to no effect on streaming viewers’ preference. 2 Similarly, Kaplan (2021), suggests that heightened suspense leads to a considerably higher viewership of a National Basketball Association (NBA) game; however, this is only found to have significant impact on viewership when the skill of the performers on the court is lower.
We contribute to this literature by implementing the seminal framework of Ely et al. (2015) in their construction and understanding of suspense and surprise. Following that framework, we replicate and extend its applications by Bizzozero et al. (2016) and Buraimo et al. (2020). Next to the growing consensus regarding the importance of replication studies in economics and business research (see Hamermesh, 2017; Krumer et al., 2022), we offer insights on a particularly relevant and surprisingly understudied supranational competition, i.e., the UEFA Champions League (UCL). 3 Moreover, we explore two different markets at the same time, i.e., UK and Spain, and thus deliver some first evidence on the salience of emotional cues across markets. By analyzing minute-by-minute audience data of all UCL games televised in the UK and the Spanish market during a full (pre-COVID) cycle of broadcasting rights, we find that suspense and surprise are the main drivers of demand in both markets while shock only has marginal effects in the Spanish market. Interestingly, we find a combined impact of suspense and surprise in the UK market that is of similar magnitude as previously reported for English Premier League matches in the UK (see Buraimo et al., 2020). In the Spanish market, however, the combined impact is larger and closely resembles that reported for international tennis matches in Wimbledon (see Bizzozero et al., 2016).
Data and Measures
UEFA Champions League
We first begin with a brief description of our setting. The UCL, second only to the FIFA World Cup in worldwide football importance, is the most prestigious club football event in the world. Although the name might say otherwise, the UCL is not a league, rather, a pan-European tournament. This yearly, pre-eminent tournament was first held in the 1955–1956 season and has been played every year since. Its global audience, at about 1.7 billion viewers across all matches of a season, makes the UCL the second most viewed yearly sporting competition, only behind the Tour de France (Shazi, 2018). The Lisbon Final between Real Madrid and Atlético Madrid saw 380 million people tune from over 200 different countries around the globe (Ashby, 2014).
Since 1992, 32 teams qualify for the tournament and are drawn into eight groups of four. The number of qualifying teams varies by country/domestic league. For example, in England and Spain the teams finishing top four in their respective domestic leagues are allowed to join the tournament the following year. While smaller countries, like Croatia or Cyprus, are only allotted one team in the qualification rounds of the tournament. Teams are divided into four pots based on their UEFA club coefficient ranking. Pot 1 consists of the highest-ranked teams, while Pot 4 consists of the lowest-ranked teams. The draw begins with Pot 1, with the eight teams drawn one at a time and placed into groups A to H. Once all teams in Pot 1 have been placed, the draw proceeds to Pot 2, and so on until all four pots have been emptied. Note that restrictions are placed to ensure clubs from the same nation are not drawn into the same group. The winners and runners-up from each of the eight groups then qualify for the round of 16 – which initiates the two-legged knock-out phases for the round of 16, quarter-finals, and semi-final. The final is a single match in a neutral, pre-selected location, with the winner ultimately becoming the UCL champion of the year. Between 1997/98 and 2017/18, the finals have only consisted of clubs from England, Spain, Germany, or Italy (with the exception of the season 2003/04 where AS Monaco [France] and FC Porto [Portugal] met in the Final).
Television Viewership
The viewership data was kindly provided by the Union of European Football Associations (UEFA) and contains a total of 296 (172) UCL games televised in the UK (Spanish) market during four seasons, i.e., from 2014/15 to 2017/18. During this period, Spain and the UK (specifically, England) were among the most relevant markets both with regard to the UEFA association club coefficients as well as to the overall distribution of the UCL's market pool money (see Table A1 in Appendix A). To purge the data from any inconsistencies that might have been caused by the shift of broadcasting rights between 2014/2015 and 2015/2016, we focus in our main estimations on seasons 2015/2016–2017/2018. 4 This period corresponds to a full (pre-COVID) UCL broadcasting rights cycle, leaving us with a total of 180 (131) UCL games televised in the UK (Spanish) market. 5
For both markets we use aggregate minute-by-minute viewership, due to instances of games being televised by two or more channels (e.g., on regional and national channels in Spain, see Table A3 in Appendix A). To obtain a balanced panel, we drop all observations that go beyond the regular time, thus we are left with 90 min-by-minute observations per game. Table 1 provides an overview of the televised games by season, stage, and market. On average (excluding extra time), between seasons 2015/2016 and 2017/2018 UCL telecasts in the UK attracted around 0.560 million viewers per minute, while in Spain the telecasts had an average minute-by-minute audience of around 2.607 million viewers. This difference in the audience figures may be partly explained by the fact that during the period of study UCL telecasts were available only on paid TV in the UK, whilst in Spain games were televised either on free-to-air channels or on paid TV with the share of free-to-air games being around 34% (see Table 2). 6
Overview of UEFA Champions League Telecasts by Season, Stage, and Market.
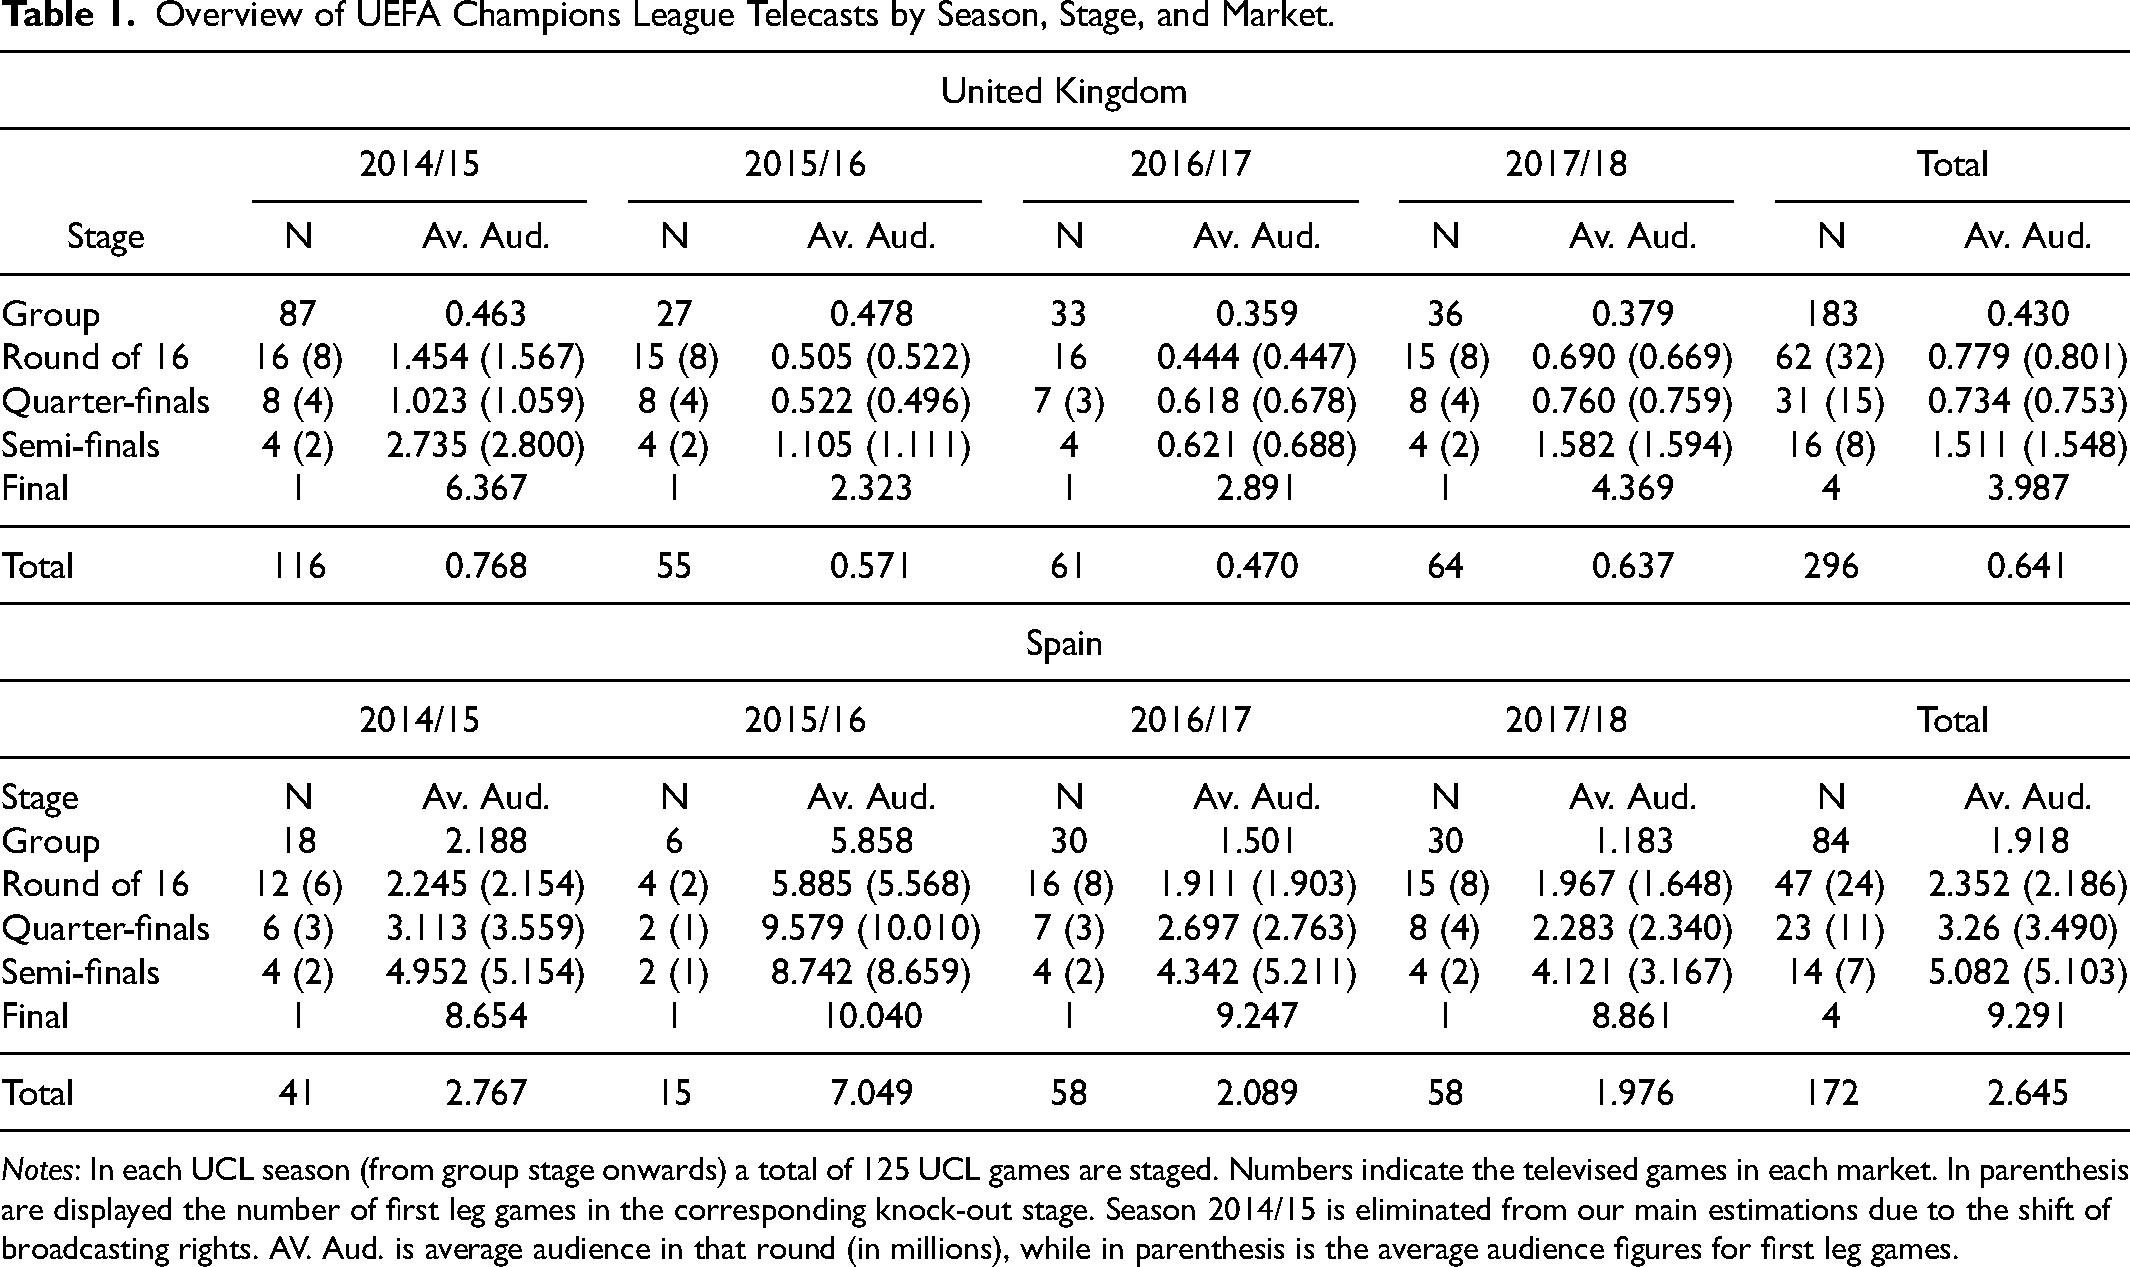
Notes: In each UCL season (from group stage onwards) a total of 125 UCL games are staged. Numbers indicate the televised games in each market. In parenthesis are displayed the number of first leg games in the corresponding knock-out stage. Season 2014/15 is eliminated from our main estimations due to the shift of broadcasting rights. AV. Aud. is average audience in that round (in millions), while in parenthesis is the average audience figures for first leg games.
Number of Games Shown on Television by Broadcaster.
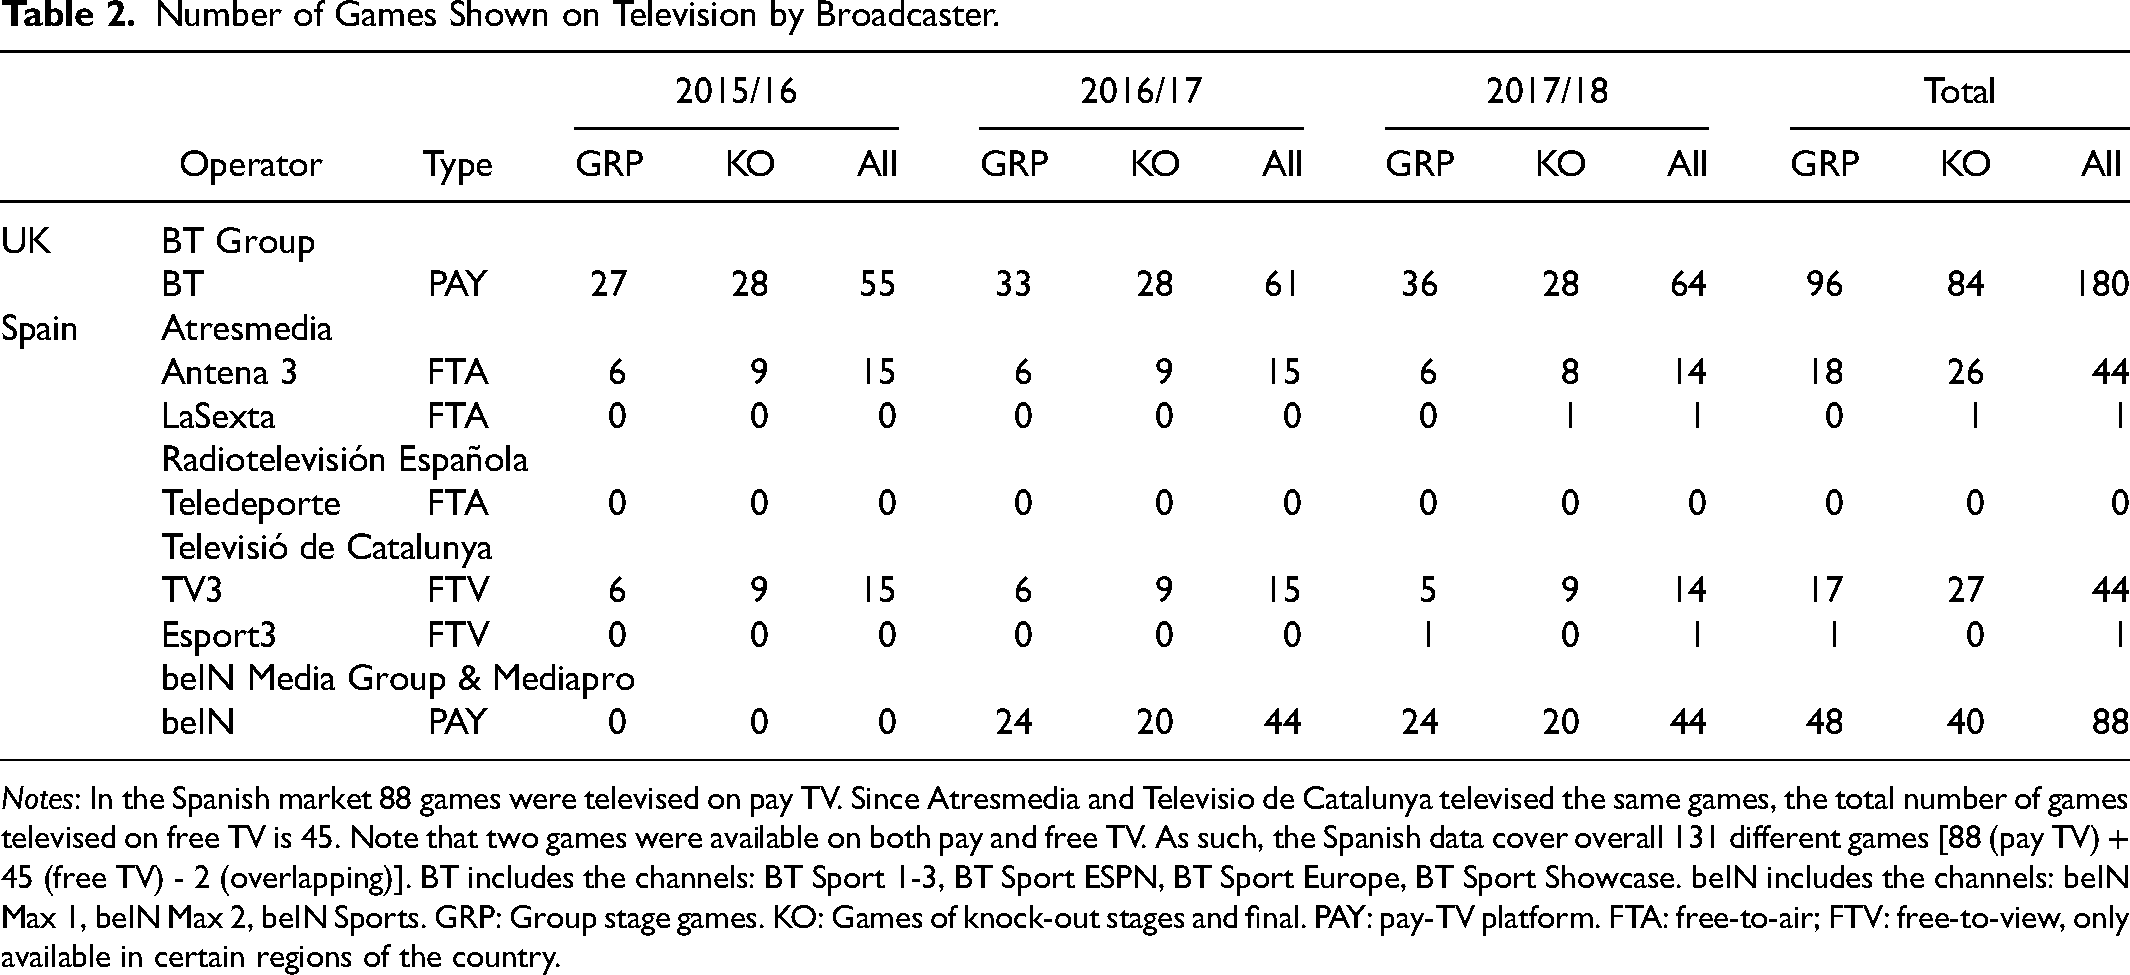
Notes: In the Spanish market 88 games were televised on pay TV. Since Atresmedia and Televisio de Catalunya televised the same games, the total number of games televised on free TV is 45. Note that two games were available on both pay and free TV. As such, the Spanish data cover overall 131 different games [88 (pay TV) + 45 (free TV) - 2 (overlapping)]. BT includes the channels: BT Sport 1-3, BT Sport ESPN, BT Sport Europe, BT Sport Showcase. beIN includes the channels: beIN Max 1, beIN Max 2, beIN Sports. GRP: Group stage games. KO: Games of knock-out stages and final. PAY: pay-TV platform. FTA: free-to-air; FTV: free-to-view, only available in certain regions of the country.
Moreover, Spanish teams were more successful than UK teams in the competition during our observation window. Table 3 shows, by year and round, each team from the UK and Spain that competed in the UCL KO stages.
UK and Spanish Teams’ Participation in the Knock-Out Stages During the Study Period.
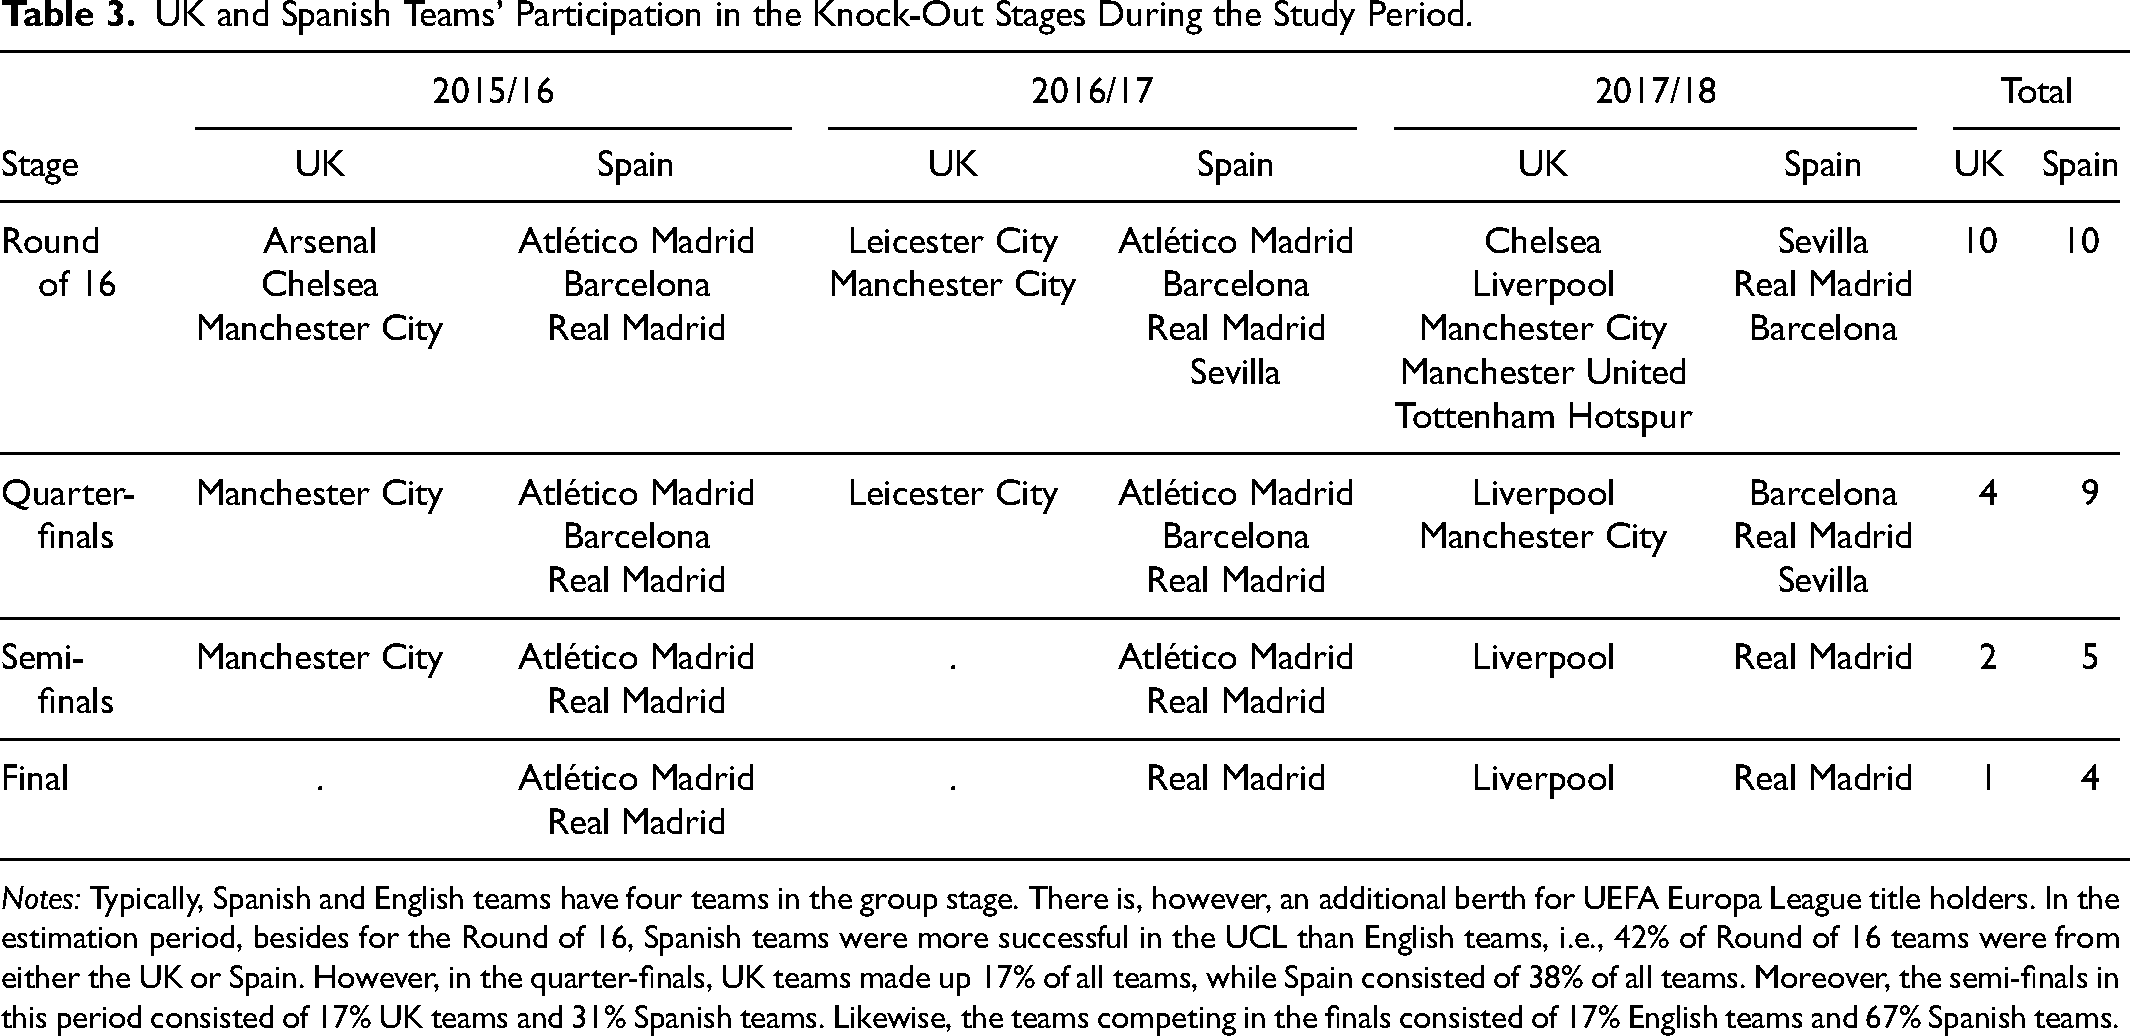
Notes: Typically, Spanish and English teams have four teams in the group stage. There is, however, an additional berth for UEFA Europa League title holders. In the estimation period, besides for the Round of 16, Spanish teams were more successful in the UCL than English teams, i.e., 42% of Round of 16 teams were from either the UK or Spain. However, in the quarter-finals, UK teams made up 17% of all teams, while Spain consisted of 38% of all teams. Moreover, the semi-finals in this period consisted of 17% UK teams and 31% Spanish teams. Likewise, the teams competing in the finals consisted of 17% English teams and 67% Spanish teams.
Emotional Cues
For modeling the effects of emotional cues on audience size, the exact timing of significant match events such as the beginning and ending of the first and second half, goals scored or red cards received is needed. This exact time stamp information was acquired through the British sports analytics firm, Opta/Stats Perform, allowing for the nontrivial task of synchronizing the audience dataset with the football dataset to be compatible and accurate with the expressed times and events during the games.
To define suspense and surprise, we closely follow the work of Ely et al. (2015) and shadow Buraimo et al. (2020) for the additional definition of shock. While surprise is about what just happened in the match and how outcome probabilities changed from minute t-1 to minute t, shock refers to the difference between outcome probabilities in minute t and the pre-match outcome probabilities t = 0. Accordingly, pt refers to the match's final outcome probabilities at minute t and H, D, and A identify a home win, draw, and away win, respectively. As such, we define surprise and shock as:


In order to calculate suspense, surprise and shock, in-play outcome probabilities are required. Since available in-play betting odds might suffer from behavioral biases (see, for instance, Angelini et al., 2022), we mimic the approach proposed by Buraimo et al. (2020) and use in-play outcome probabilities calculated with the following model. Assuming independent Poisson distributions for goals scored by the home team (X) and the away team (Y), i.e.,

After the scoring rates for each team have been estimated, the next step is to distribute these across the minutes of the match. A rudimentary way to achieve this would be to assume uniform distribution so that each minute was equal to λ/90. However, scoring rates are not evenly distributed throughout a match; for instance, more goals typically occur in the latter moments of a match rather than the opening minutes. To execute a more accurate method, we split the scoring rates in proportion to the empirical distribution of goals per minute, as suggested by Buraimo et al. (2020). The empirical goal distribution for the UCL between the tournament years of 1998/99 and 2020/21 can be seen in Figure 1. It is important to note that goals occurring in stoppage time of their respective half are included in the goal tally for the 45th and the 90th minutes, partially explaining the higher goal totals in those minutes. We use this approach in order to keep all games at exactly 90-min length. As such, any goal occurring in extra-time (i.e., when a knock-out match is tied after the original 90 min) was not included in the goal total.
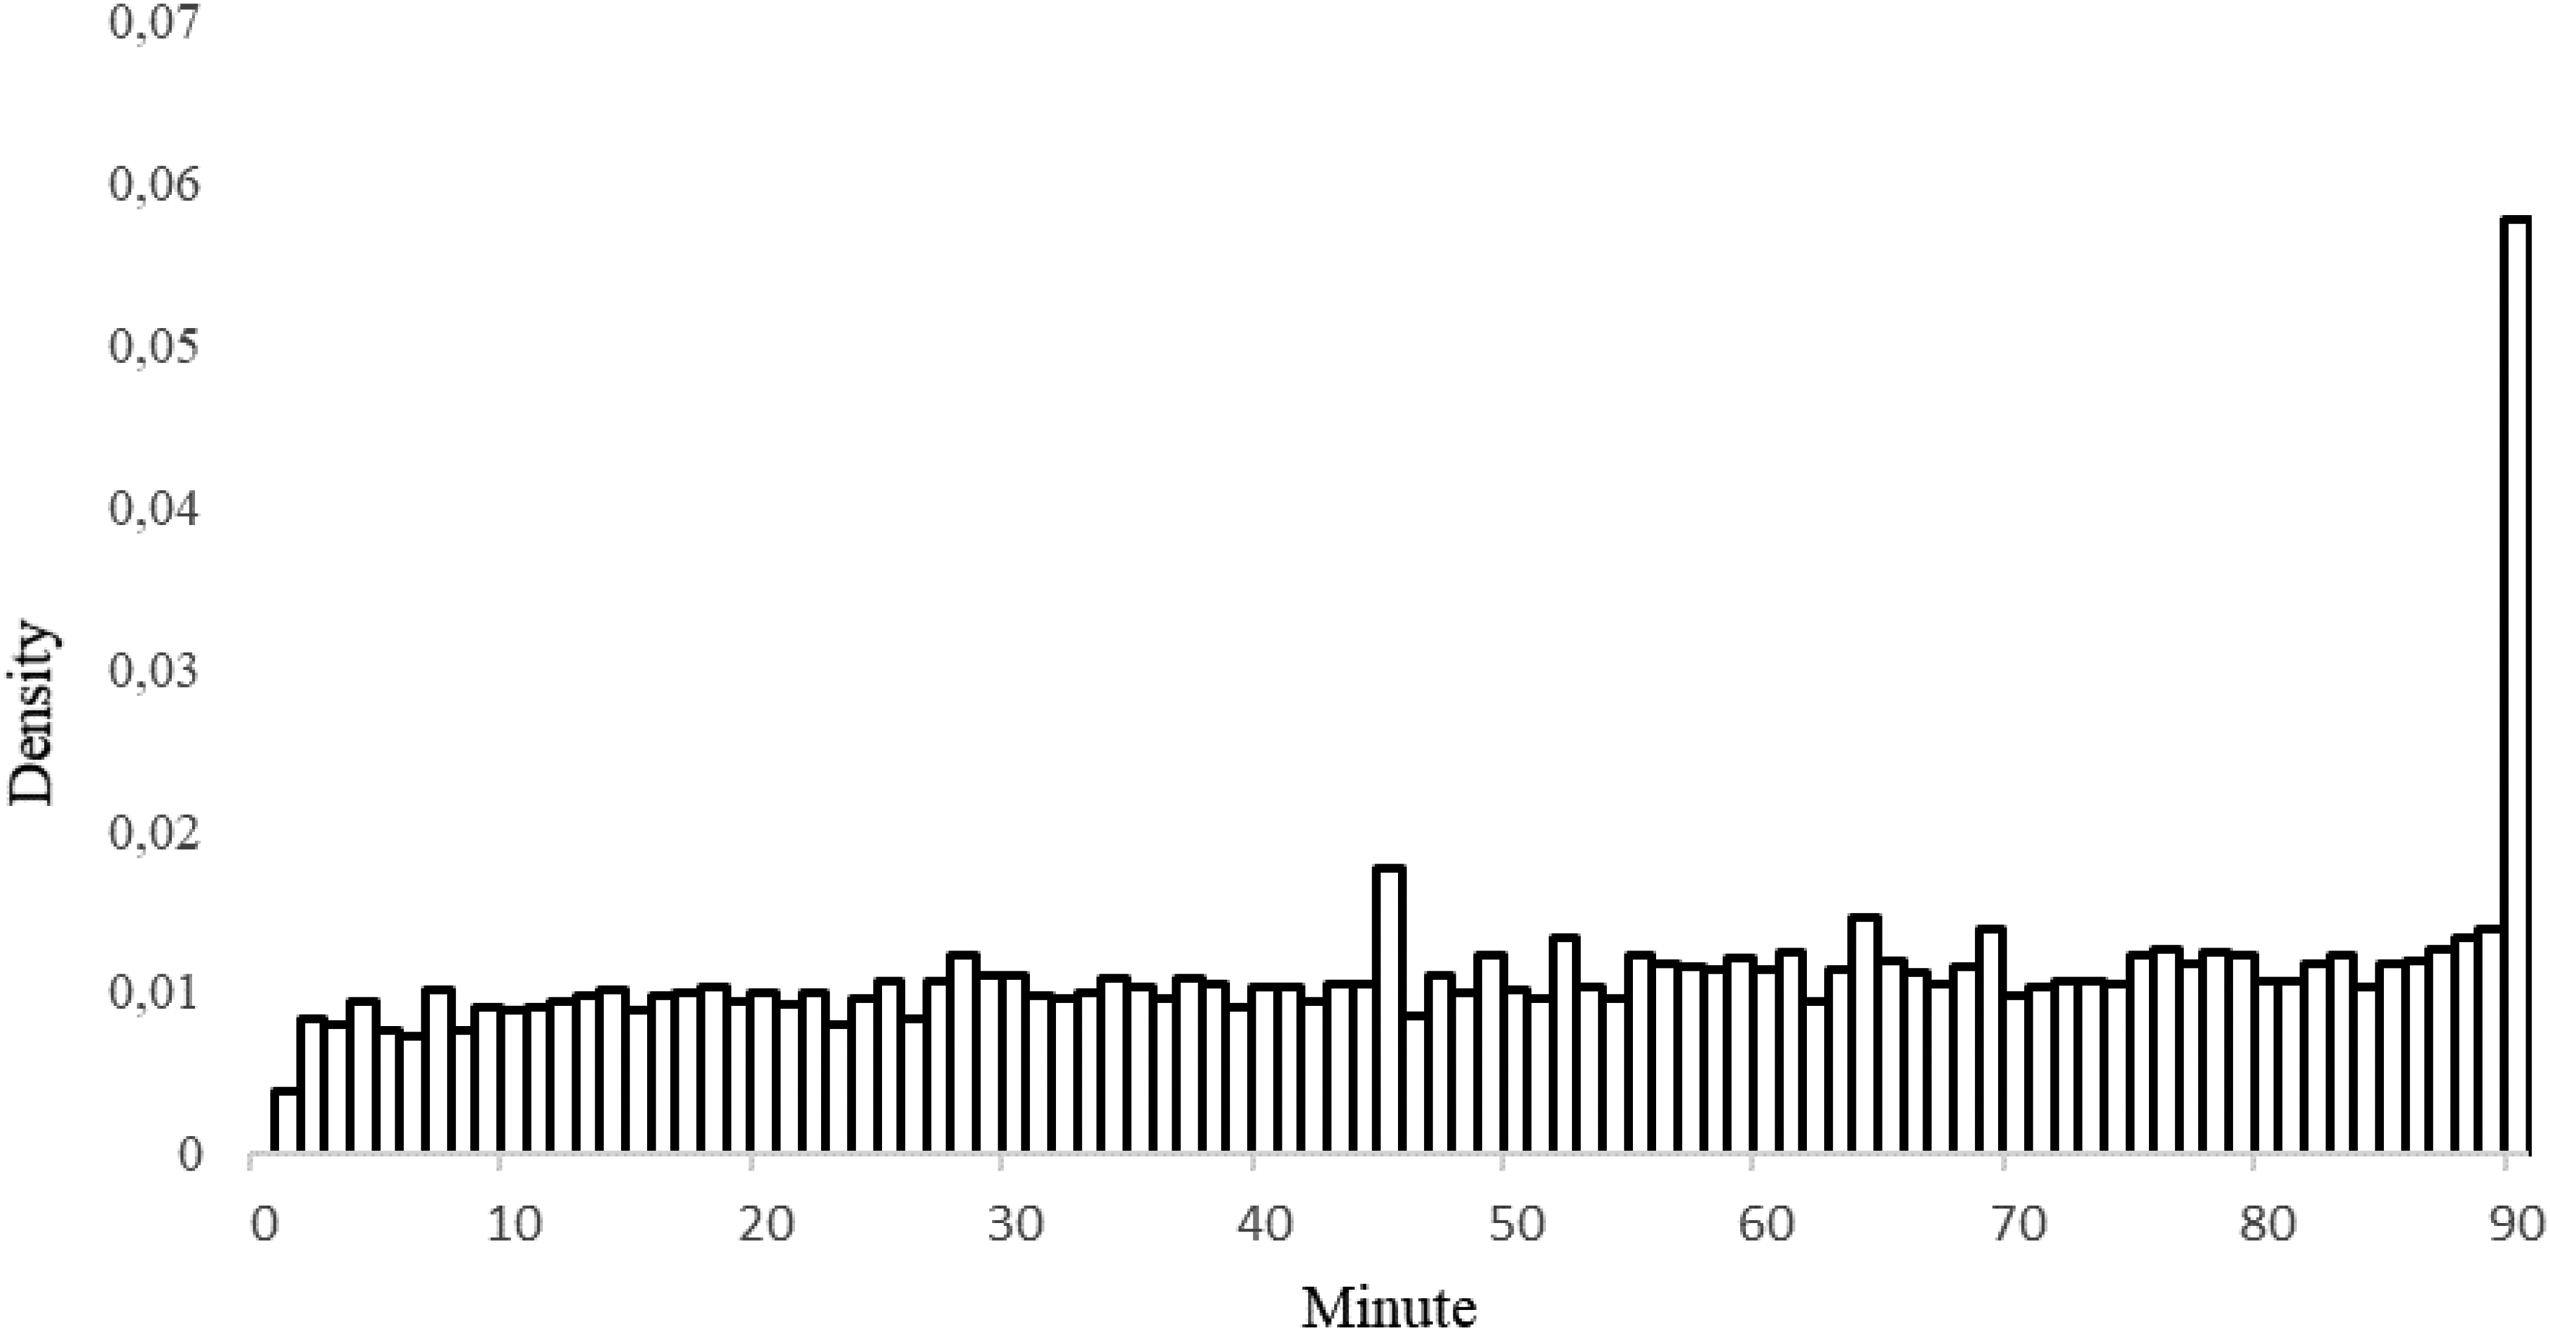
Empirical goal distribution in the UCL between 1998/99 and 2020/21.
Using these scoring rates per minute, we simulate the number of goals being scored in each minute of a specific match, then total the score and record the final result. This match-level simulation was repeated 100,000 times per minute, leading to 9 million simulations per match. In other words, each individual match of 90 min was simulated 100,000 times leading to 100,000 “matches” being played.
These simulations are also used to evaluate the probabilities of a home win, a draw, and an away win for calculating suspense by using “what if” scenarios: “What are the probabilities of a home win, draw, or away win if the home team scored in the next minute? What are the probabilities of a home win, draw, or away win if the away team scored in the next minute?”. Red cards are accounted for by following the methods of Vecer et al. (2009) – if a team received a red card, their goal scoring rate, for the rest of the game, was diminished to 2/3 of the original, while the opposition's scoring rate was multiplied by 1.2.
Example Games
For a better grasp and understanding of the data, we illustrate the evolution or our key measures during the course of an “exciting” match (Figure 2) and a kind of “routine” match (Figure 3) that were both televised in the UK and Spanish market. The criteria used to select the example games were as follows: First, the respective game needed to be broadcast in both the UK and Spanish market. Second, the respective game needed to follow the timeline of “routine” or “exciting” (based on the authors’ footballing opinion). Third, the respective game needed to be a group stage game to prevent any additional audience views caused by match relevance.
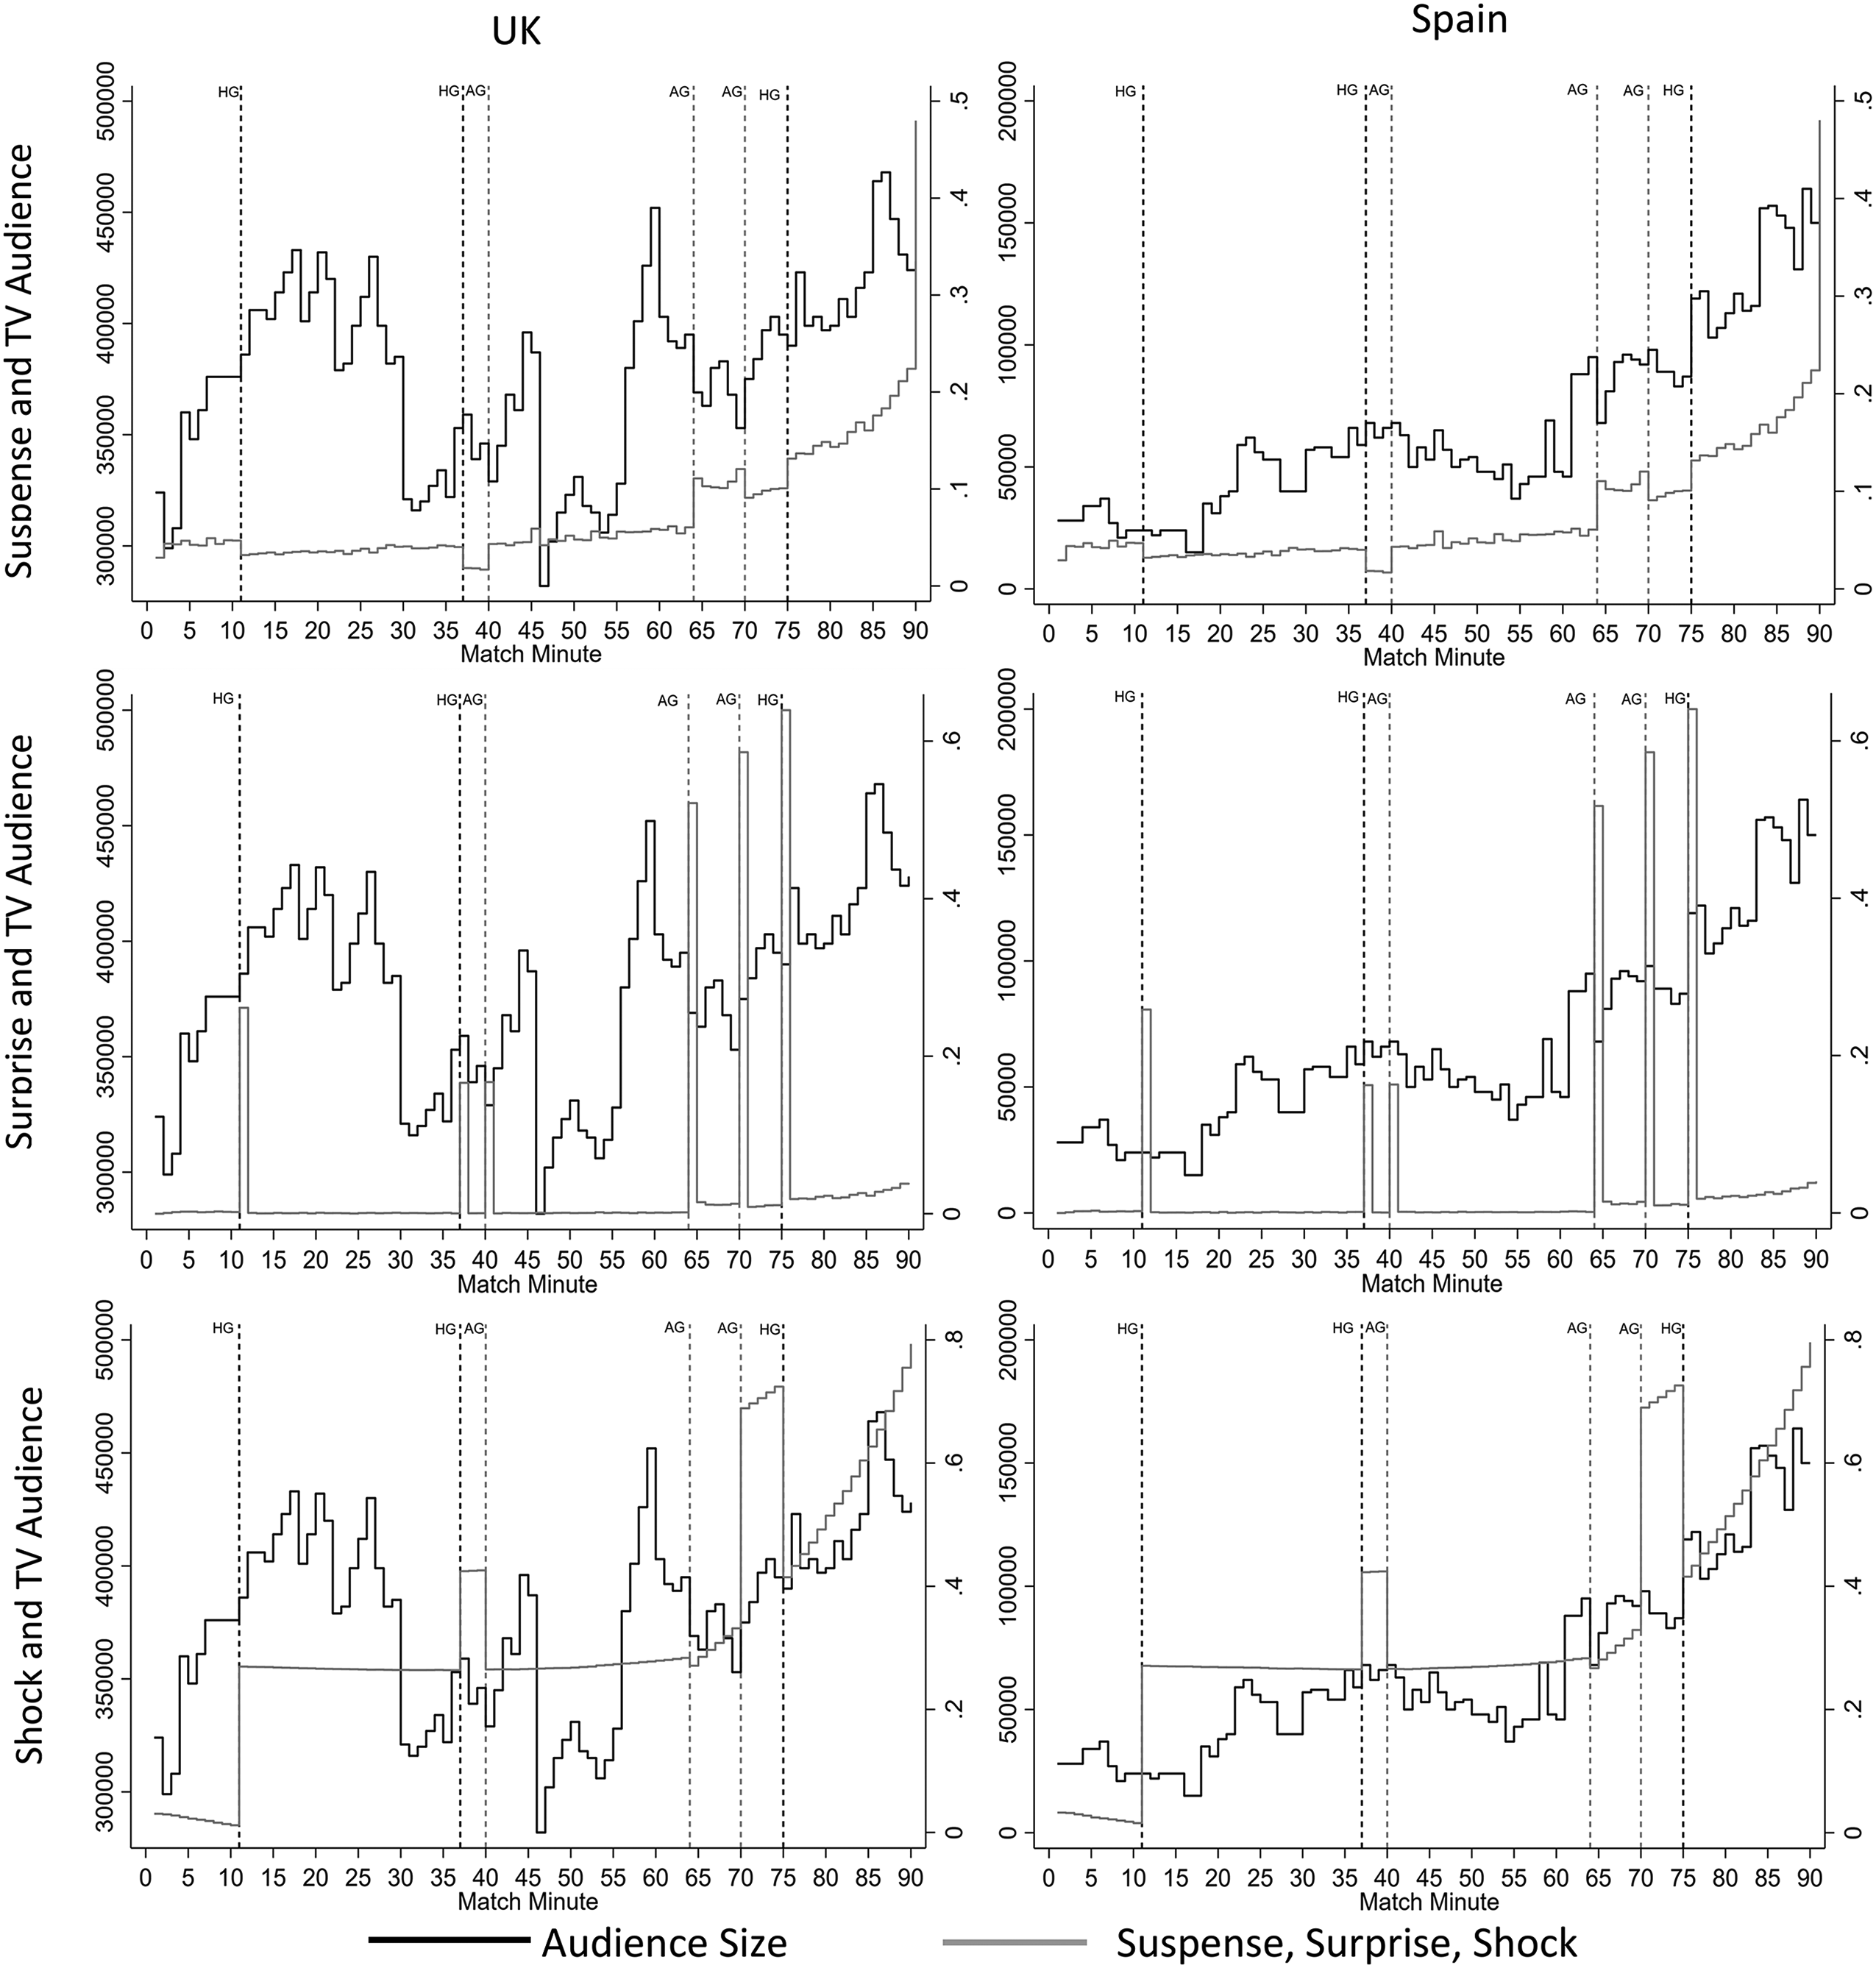
Audience size and emotional cues in an “exciting” match (Chelsea vs Roma, October 18, 2017).
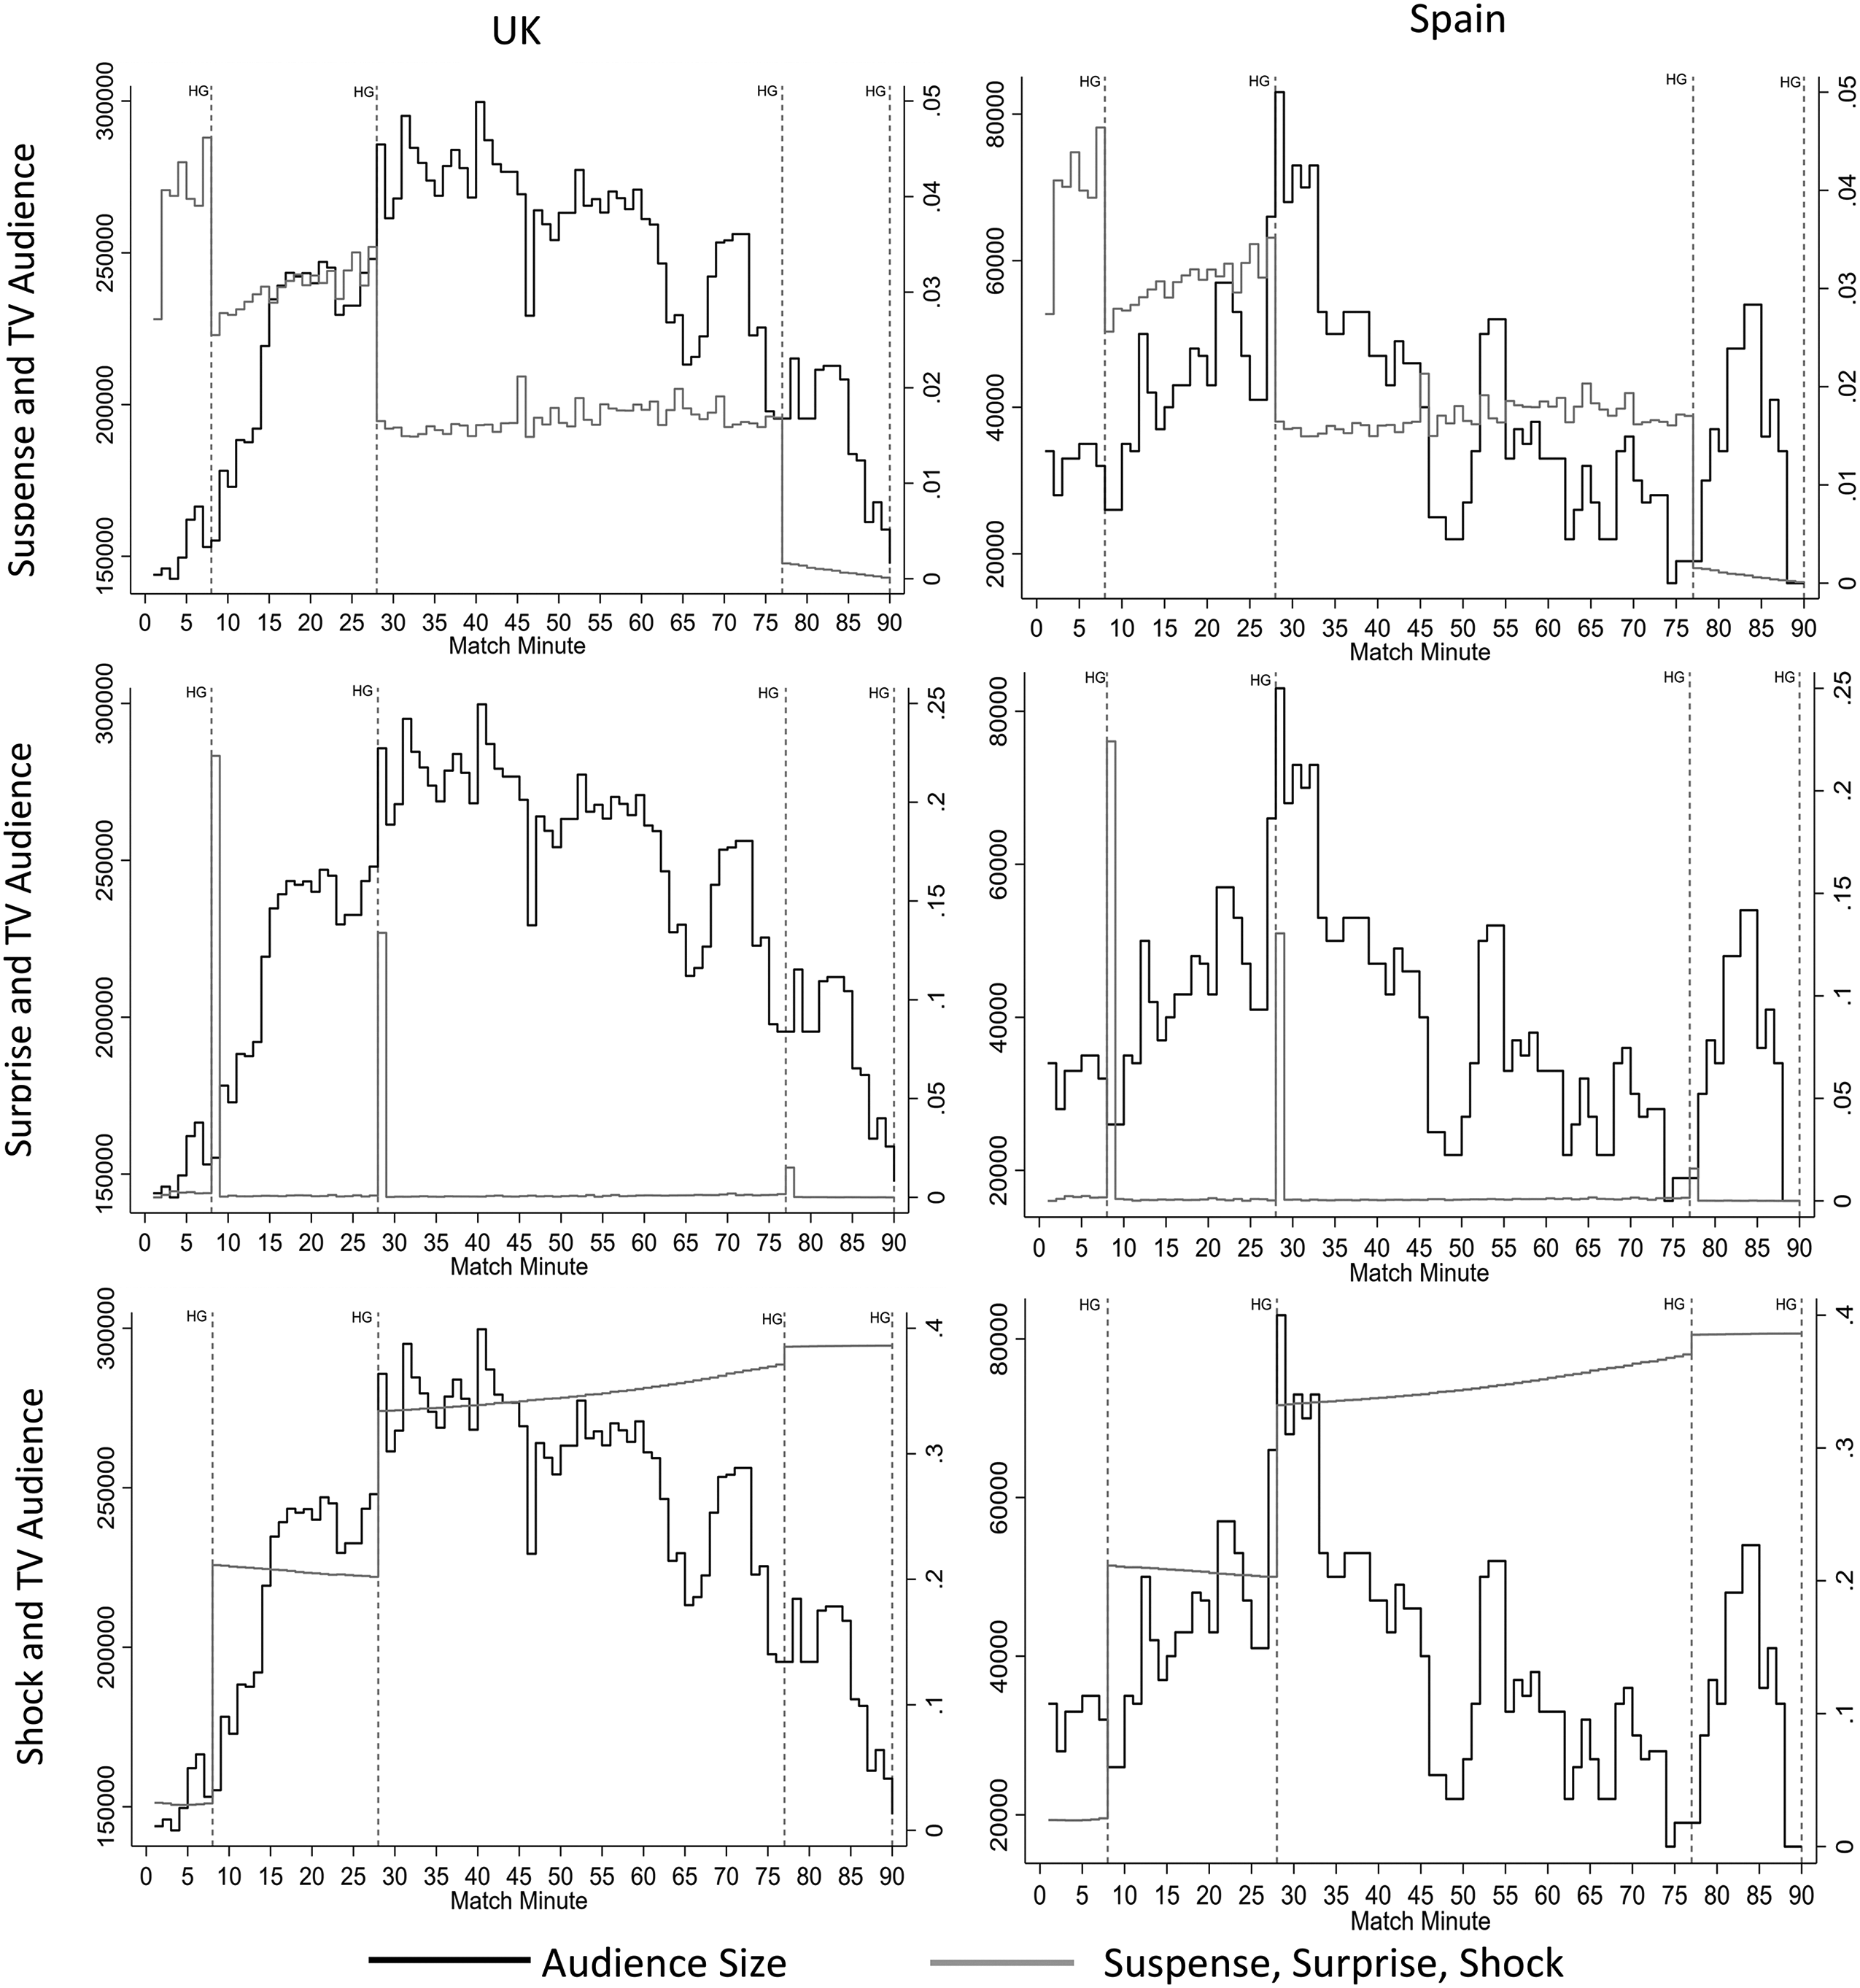
Audience size and emotional cues in a “routine” match (Manchester City vs Borussia Monchengladbach, September 14, 2016).
In the first example (Figure 2), a match played between Chelsea vs Roma (played on October 18, 2017) was selected as example of an “exciting” match due to the many goals (six in total) and the back-and-forth nature of the match (2-0; 2-3; 3-3). Chelsea (61% winning probability according to closing odds) opened the scoring with two early goals. Suspense remained at low levels due to the initial one-sided win probability for Chelsea. However, Roma managed to take the lead in the second half causing an increase in suspense. When Chelsea equalized shortly after, suspense in the game reached high levels nearing the final whistle - as a goal for either team would be decisive. Toward the latter minutes of the match when surprise and shock both saw increased yields due to major shifts in game events, both the UK and Spanish viewing audience follow suite and increase until the final moments.
The second example match (Figure 3) between Manchester City and Borussia Monchengladbach (played on September 14, 2016) was selected as an example of “routine” match. Manchester City (69% winning probability according to closing odds) routinely produced a 4-0 win, scoring twice in each half. For both suspense and surprise, the generated yields decreased after each goal was scored and practically disappeared after goal three and as full-time approached. Comparatively speaking, the shock levels were still low compared to our “exciting” example, however shock, rose until the very end, as the pre-match expectation of such a drastically one-side game was lower than the actual outcome. Interestingly, after halftime the UK viewership gradually decreased, while Spanish viewers were variable throughout the entire match with multiple spikes of audience interest.
Model Specification
In our main specification, we regress audience size of game i in minute t on all three emotional cue variables of game i in minute t as well as lagged audience size, a series of minute-of-match dummies and match fixed-effects. In this regard, we include minute-of-match dummies to account for common temporal patterns, such as the decreased viewership right after halftime due to the viewers switching back to the game after ignoring the halftime show or commercials. Match fixed-effects account for all factors identifying individual matches, including the quality and appeal of teams, the relevance of the game, the location of the match, and the television station. Finally, lagged audience size proxies the inertia when viewing live football on television due to the assumption that our forecasts of audience figures depend on the events occurring in the same game.
In order to avoid spurious correlations, we need to check whether our audience measure is I(1) or stationary. We test this using the full sample as well as different subsamples (e.g., all minute-by-minute observations vs first half only and second half only). Overall, Im–Pesaran–Shin Unit Root tests (2003) strongly reject the null hypothesis that all panels contain unit roots. Moreover, Maddala and Wu (1999) Panel Unit Root tests also strongly reject the null that the series is I(1). Since these “first generation” tests are frequently criticized for assuming cross-sectional independence, we further implemented the Pesaran (2007) Panel Unit Root test which relaxes this assumption. Again, non-stationarity is strongly rejected.
For estimating the model, we must consider the distribution of our dependent variable is right-skewed and includes zero observations. 8 As such, we opt for the Pseudo-Poisson Maximum Likelihood estimator (see Silva & Tenreyro, 2006) which is robust to any distribution (Wooldridge, 2010). Moreover, controlling for lagged audience – which is important in order to avoid any omitted variable bias (see Bizzozero et al., 2016; Buraimo et al., 2020) – might cause problems. While residual autocorrelation may cause a downward bias in models including a lagged dependent variable (Keele & Kelly, 2006), the inclusion of both fixed effects and a lagged dependent variable may raise concerns with regard to Nickell bias (Nickell, 1981). Since, however, the time dimension of our panel is comparably large (T = 90 min), we argue that the bias (if any) is small (see Baltagi, 2008; Nickell, 1981). 9
Findings
In our analysis we focus on two main panels. Panel A contains just group stage games. Panel B contains all group stage games (i.e., Panel A) plus all first leg games of the knock-out stage and the Final match. We do not consider second leg games since emotional cues are expected to be triggered by the probability of qualifying to the next stage rather than the actual outcome of the individual game. Table 4 displays the descriptive statistics for the UK (Spanish) market of the overall 96 (66) matches in Panel A and 140 (100) matches in Panel B. 10
Descriptive Statistics.
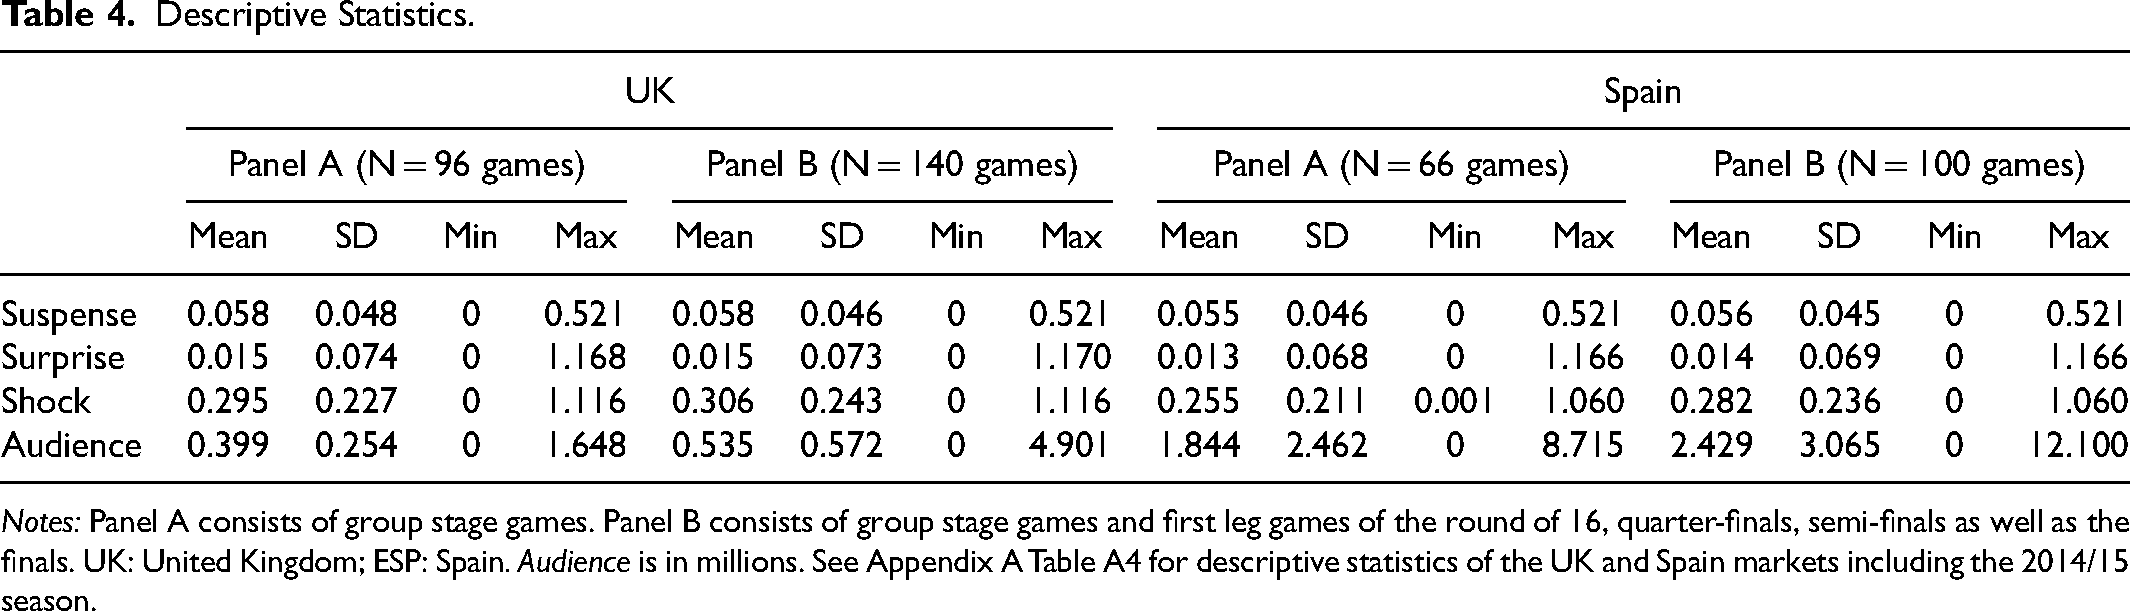
Notes: Panel A consists of group stage games. Panel B consists of group stage games and first leg games of the round of 16, quarter-finals, semi-finals as well as the finals. UK: United Kingdom; ESP: Spain. Audience is in millions. See Appendix A Table A4 for descriptive statistics of the UK and Spain markets including the 2014/15 season.
Table 5 displays our main results. Overall, our findings suggest that particularly suspense and surprise are driving the demand for UCL games in both markets. Shock, however, has a marginal impact on the demand for UCL games in both markets being statistically significant just for the Spanish one (Panel B). 11 Importantly, when estimating all models excluding shock the coefficients of surprise and suspense hardly change (see Table A7 in Appendix A). As such, we conclude, like Buraimo et al. (2020), that shock does not absorb any effects of surprise or suspense and appears to be an additional – though in our setting less relevant – cue. 12
Main Results.
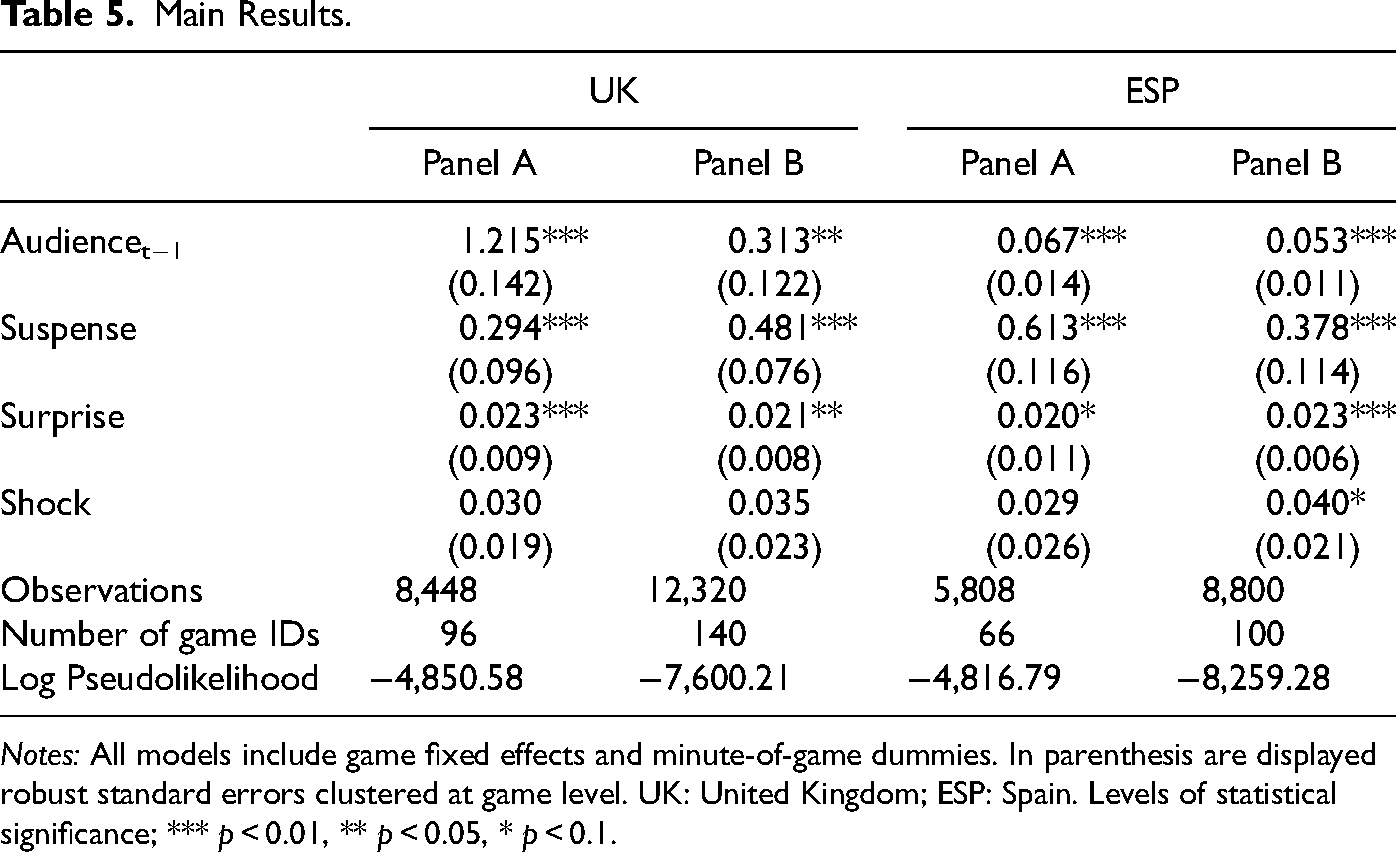
Notes: All models include game fixed effects and minute-of-game dummies. In parenthesis are displayed robust standard errors clustered at game level. UK: United Kingdom; ESP: Spain. Levels of statistical significance; *** p < 0.01, ** p < 0.05, * p < 0.1.
In order to explore potential effect heterogeneity, we repeat our analysis using different specifications. To start with, we interact the variables of interest with stage of the competition, i.e., group stage or knock-out stages (see Table 6). Overall, our findings suggest that suspense and surprise seem to matter more for group stages than knock-out games in both markets while only the UK audience seems to value shock more when watching group stage games.
Effect Heterogeneity: Group Stage Games vs Knock-Out Games.
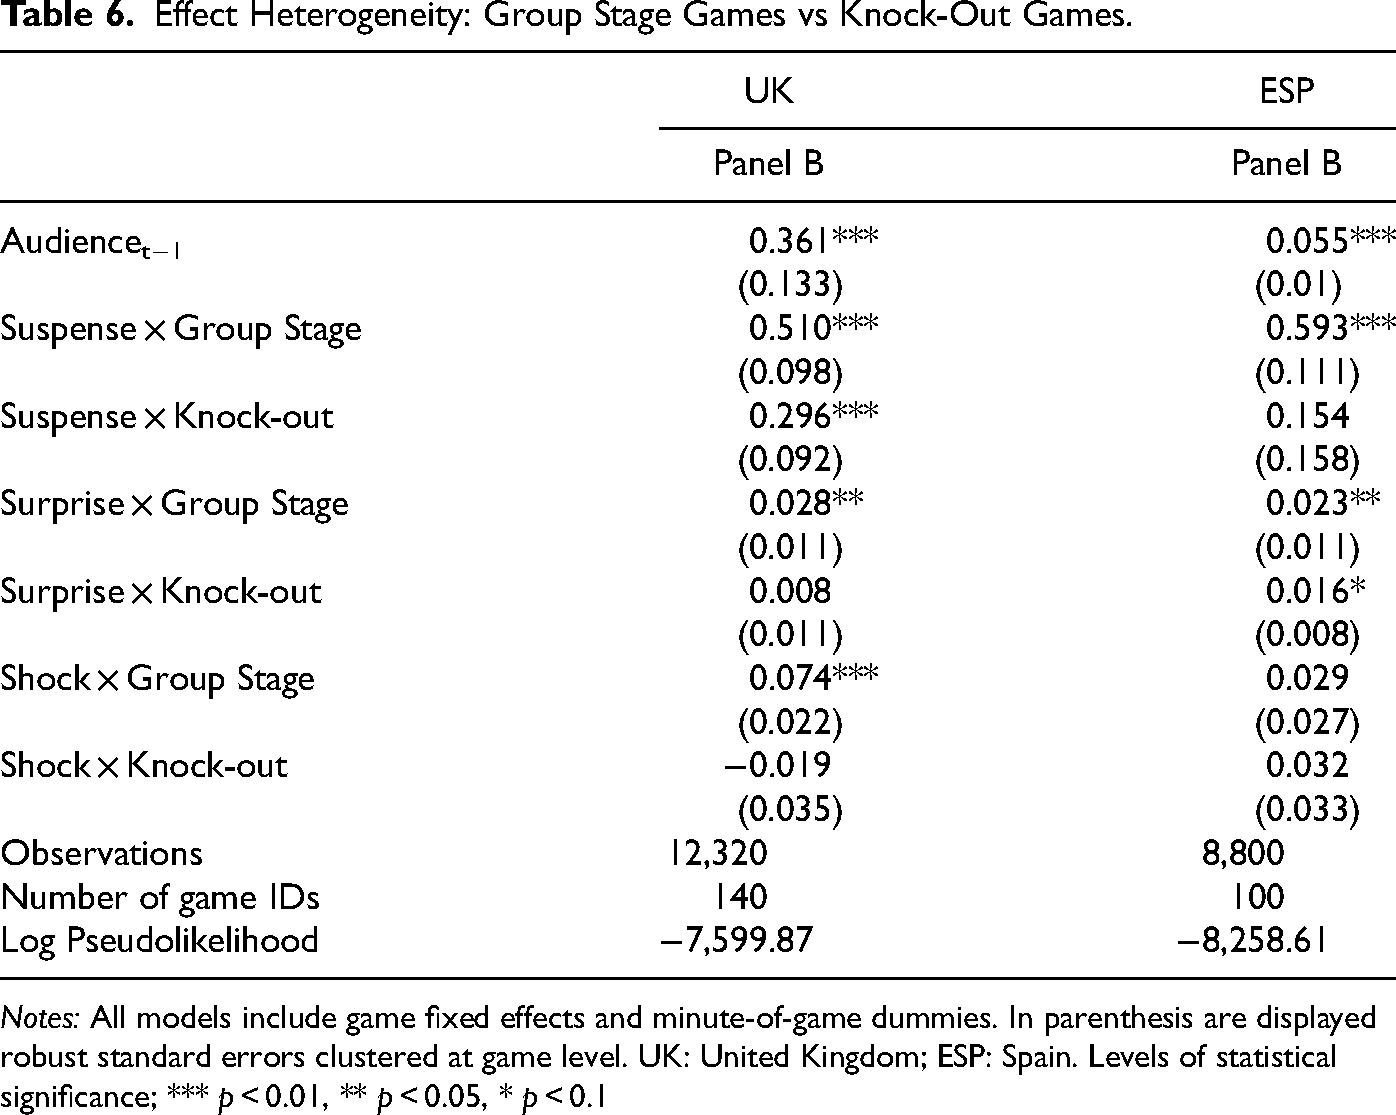
Notes: All models include game fixed effects and minute-of-game dummies. In parenthesis are displayed robust standard errors clustered at game level. UK: United Kingdom; ESP: Spain. Levels of statistical significance; *** p < 0.01, ** p < 0.05, * p < 0.1
We further explore effect heterogeneity with regard to the halves of the match (see Table 7). In line with Bizzozero et al. (2016) we find audience, in both markets, to have a preference for suspense particularly in the second half. Interestingly, however, in the Spanish Panel B the interaction effect between first half and suspense is negative and statically significant. Additional subsample estimations suggest that this negative effect is primarily driven by knockout games televised on free-to-air channels (see Table A8 in Appendix A). Concerning surprise, in UK it seems that this cue is only a precise predictor of demand in the second half. In Spain, however, no differences arise with regard to the impact of surprise in both halves.
Effect Heterogeneity: First vs Second Half.
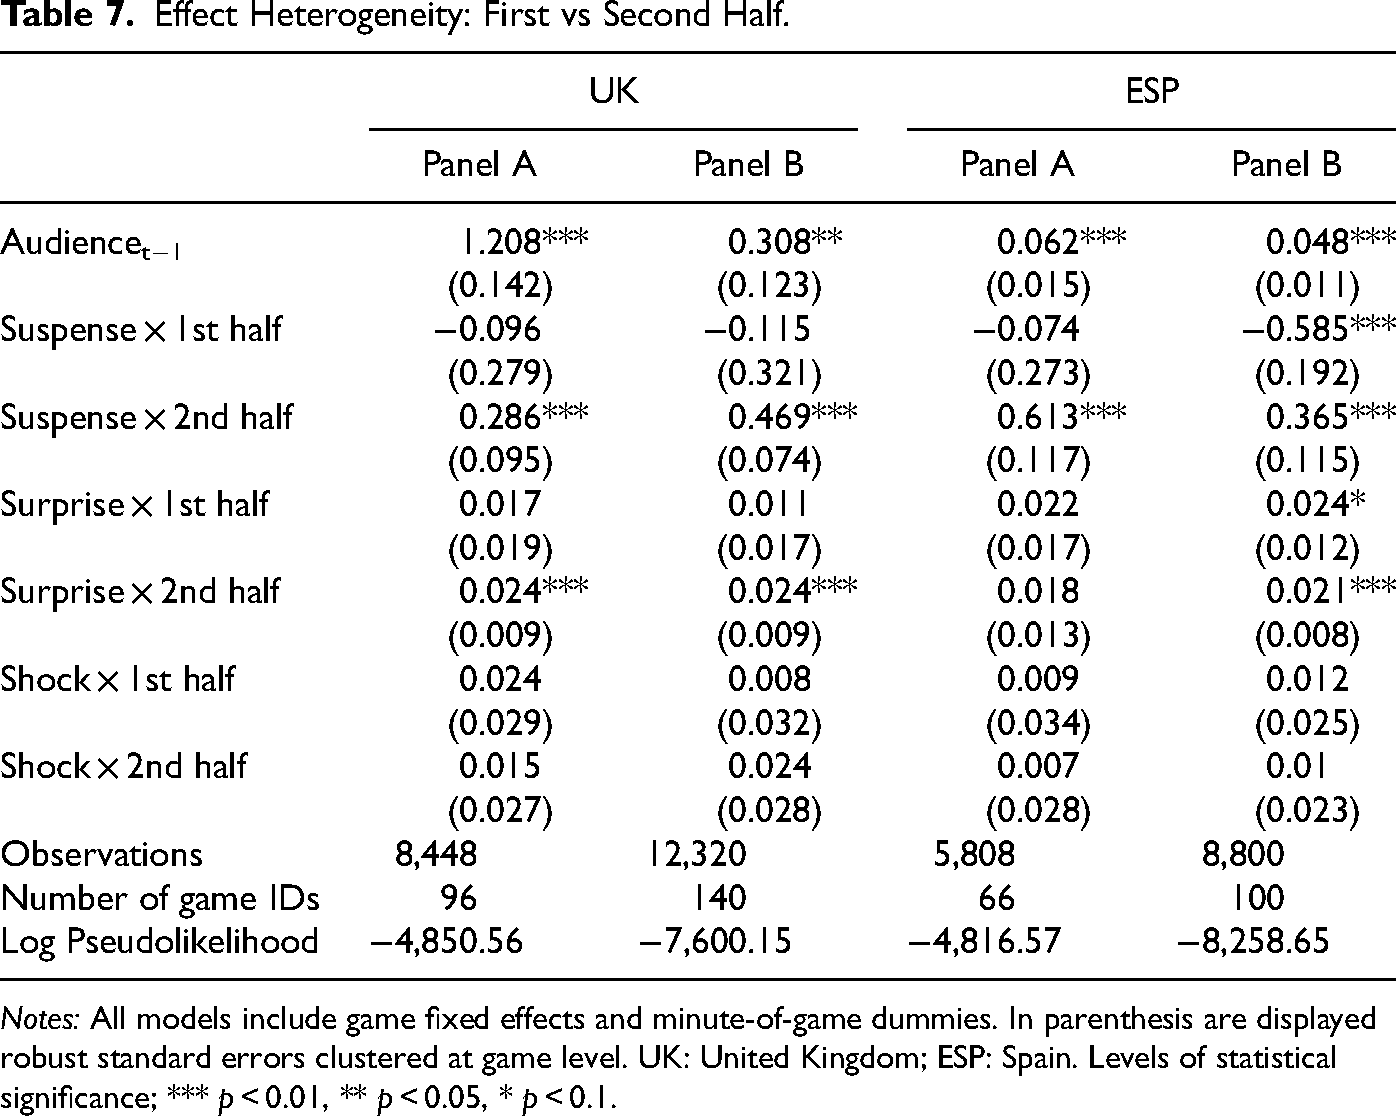
Notes: All models include game fixed effects and minute-of-game dummies. In parenthesis are displayed robust standard errors clustered at game level. UK: United Kingdom; ESP: Spain. Levels of statistical significance; *** p < 0.01, ** p < 0.05, * p < 0.1.
Finally, we return to the concept of uncertainty of outcome that dominated the empirical research during the last decades (see, for instance, Nalbantis & Pawlowski, 2019; Pawlowski et al., 2018), and estimate our main specification with additional variables directly measuring uncertainty of outcome. Theoretically, uncertainty of outcome as well as suspense, surprise, and shock are closely connected. While suspense is increasing with increasing uncertainty of outcome, both surprise and shock are increasing with decreasing (lagged) uncertainty of outcome. Moreover, an event with high levels of uncertainty will cater to the suspense that pleases TV viewers. This is due to suspense existing along a continuum in which the audience is aware of the endpoint that will produce an outcome; for each minute that occurs, that potential outcome becomes closer making the audience feel more suspense (Madrigal et al., 2023). Madrigal et al. (2023), also, find that uncertainty of outcome only creates suspense to the extent that there is an established and known endpoint. 13
We measure outcome uncertainty by taking the absolute difference between the home and away win probability at minute t and further consider the probability to draw (e.g., Alavy et al., 2010). Moreover, we control for the number of goals at minute t as well as the goal difference between the contestants at minute t (e.g., Buraimo et al., 2020). Overall, while the effects of all three cues partly reduce, controlling for these measures does not change our main findings about suspense and surprise. Interestingly, however, shock becomes even significant for some specifications (see Table 8). 14
Controlling for Game Uncertainty and Current State of Game.
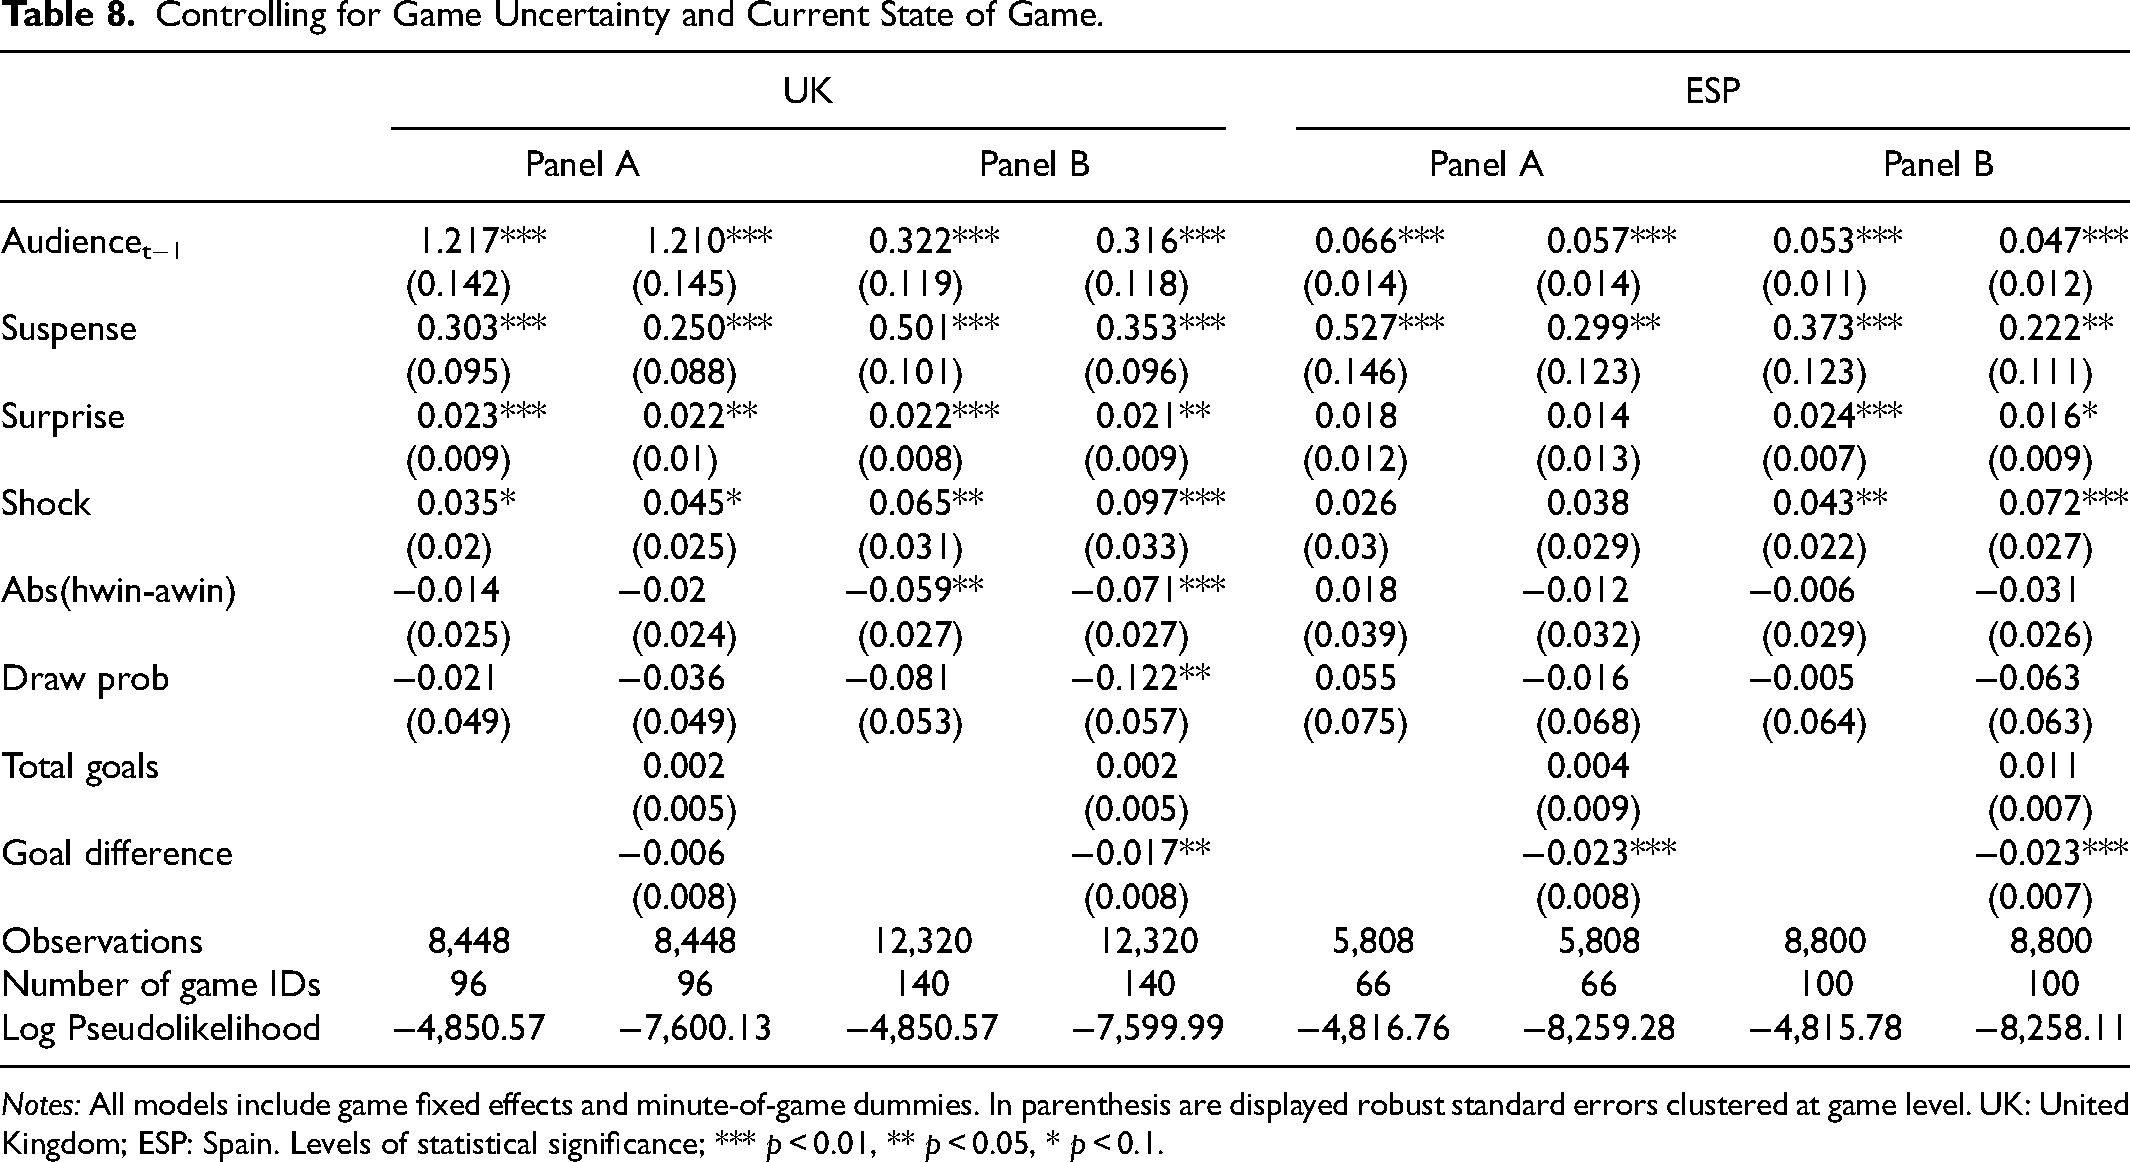
Notes: All models include game fixed effects and minute-of-game dummies. In parenthesis are displayed robust standard errors clustered at game level. UK: United Kingdom; ESP: Spain. Levels of statistical significance; *** p < 0.01, ** p < 0.05, * p < 0.1.
Overall, our models support the notion that suspense, surprise, and shock are viable factors with respect to UCL football television audience demand. But are they also economically significant? For answering this question, we quantify the impact of the emotional cues based on our main results in Table 5 (Panel A). For the UK market, an increase of one standard deviation in suspense (surprise) [shock] is predicted to increase audience by 1.4% (0.2%) [0.7%]. In the Spanish market, an increase of one standard deviation in suspense (surprise) [shock] would increase audience size by 2.9% (0.1%) [0.6%]. For both markets, the effects of suspense are larger compared to Wimbledon tennis (which was estimated at about 1.2%, see Bizzozero et al., 2016) while the effect of surprise is considerably lower (which was estimated at about 2.5%, see Bizzozero et al., 2016). If we take into account the joint effect of surprise and suspense, our estimates for the Spanish market are close to that reported for Wimbledon tennis. For the UK market, however, the joint effect is similar to that reported for the English Premier League (about 1.2%, see Buraimo et al., 2020).
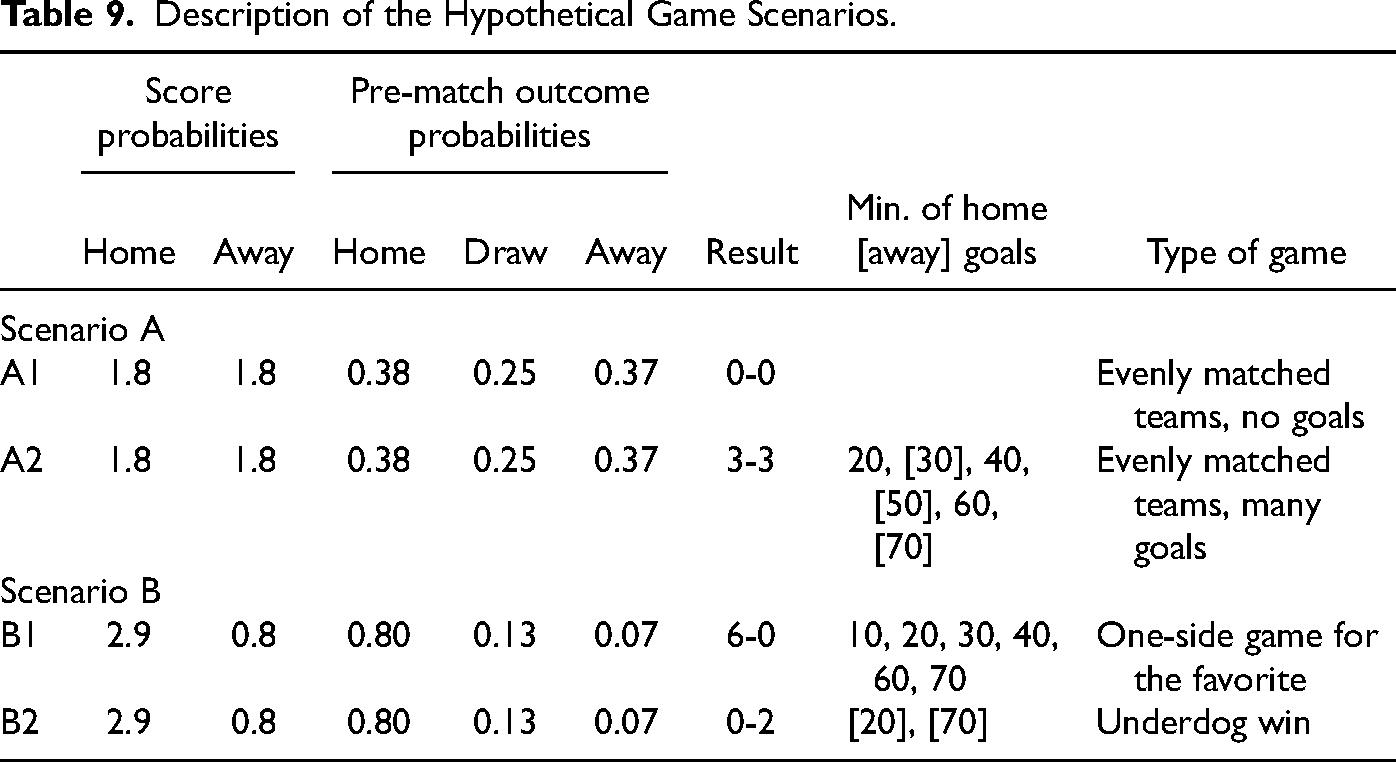
To better apprehend the economic importance of the emotional cues, we also quantify the impact of suspense, surprise, and shock (based on UK Panel A coefficients, see Table 5) with the help of hypothetical (yet arguably realistic) scenarios. We start the simulations by considering two main scenarios (see Table 9). In scenario A, we closely follow Buraimo et al. (2020) and predict the audience of a group game where both contestants are fairly equally matched, yet the home team has a slight home advantage (outcome probabilities: 38% home win; 25% draw; 37% away win). Both teams have a scoring probability of 1.8 and the game starts with 500,000 viewers. We simulate this game with two different outcomes, i.e., the game ends in a goalless tie (A1) and both teams score a total of six goals and end up in a tie (A2). In A2, the home team scores in the 20th, 40th and 60th minute. The away team comes back after each home goal, scoring in the 30th, 50th and 70th minute. In scenario B, we consider a group game where the home team is a strong favorite (outcome probabilities: 80% home win; 13% draw; 7% away win). The home team has a score probability of 2.9 and the away team has a score probability of 0.8. As before, we simulate this game with two different outcomes and a starting audience of 500,000 viewers. In subscenario B1, it is a one-side game with the favorite scoring six times, on the 10th, 20th, 30th, 40th, 60th and 70th minute. In subscenario B2, the away team wins against all odds scoring twice in the 20th and 70th minute. Figure 4 provides the predicted audience based on the aforementioned scenarios.
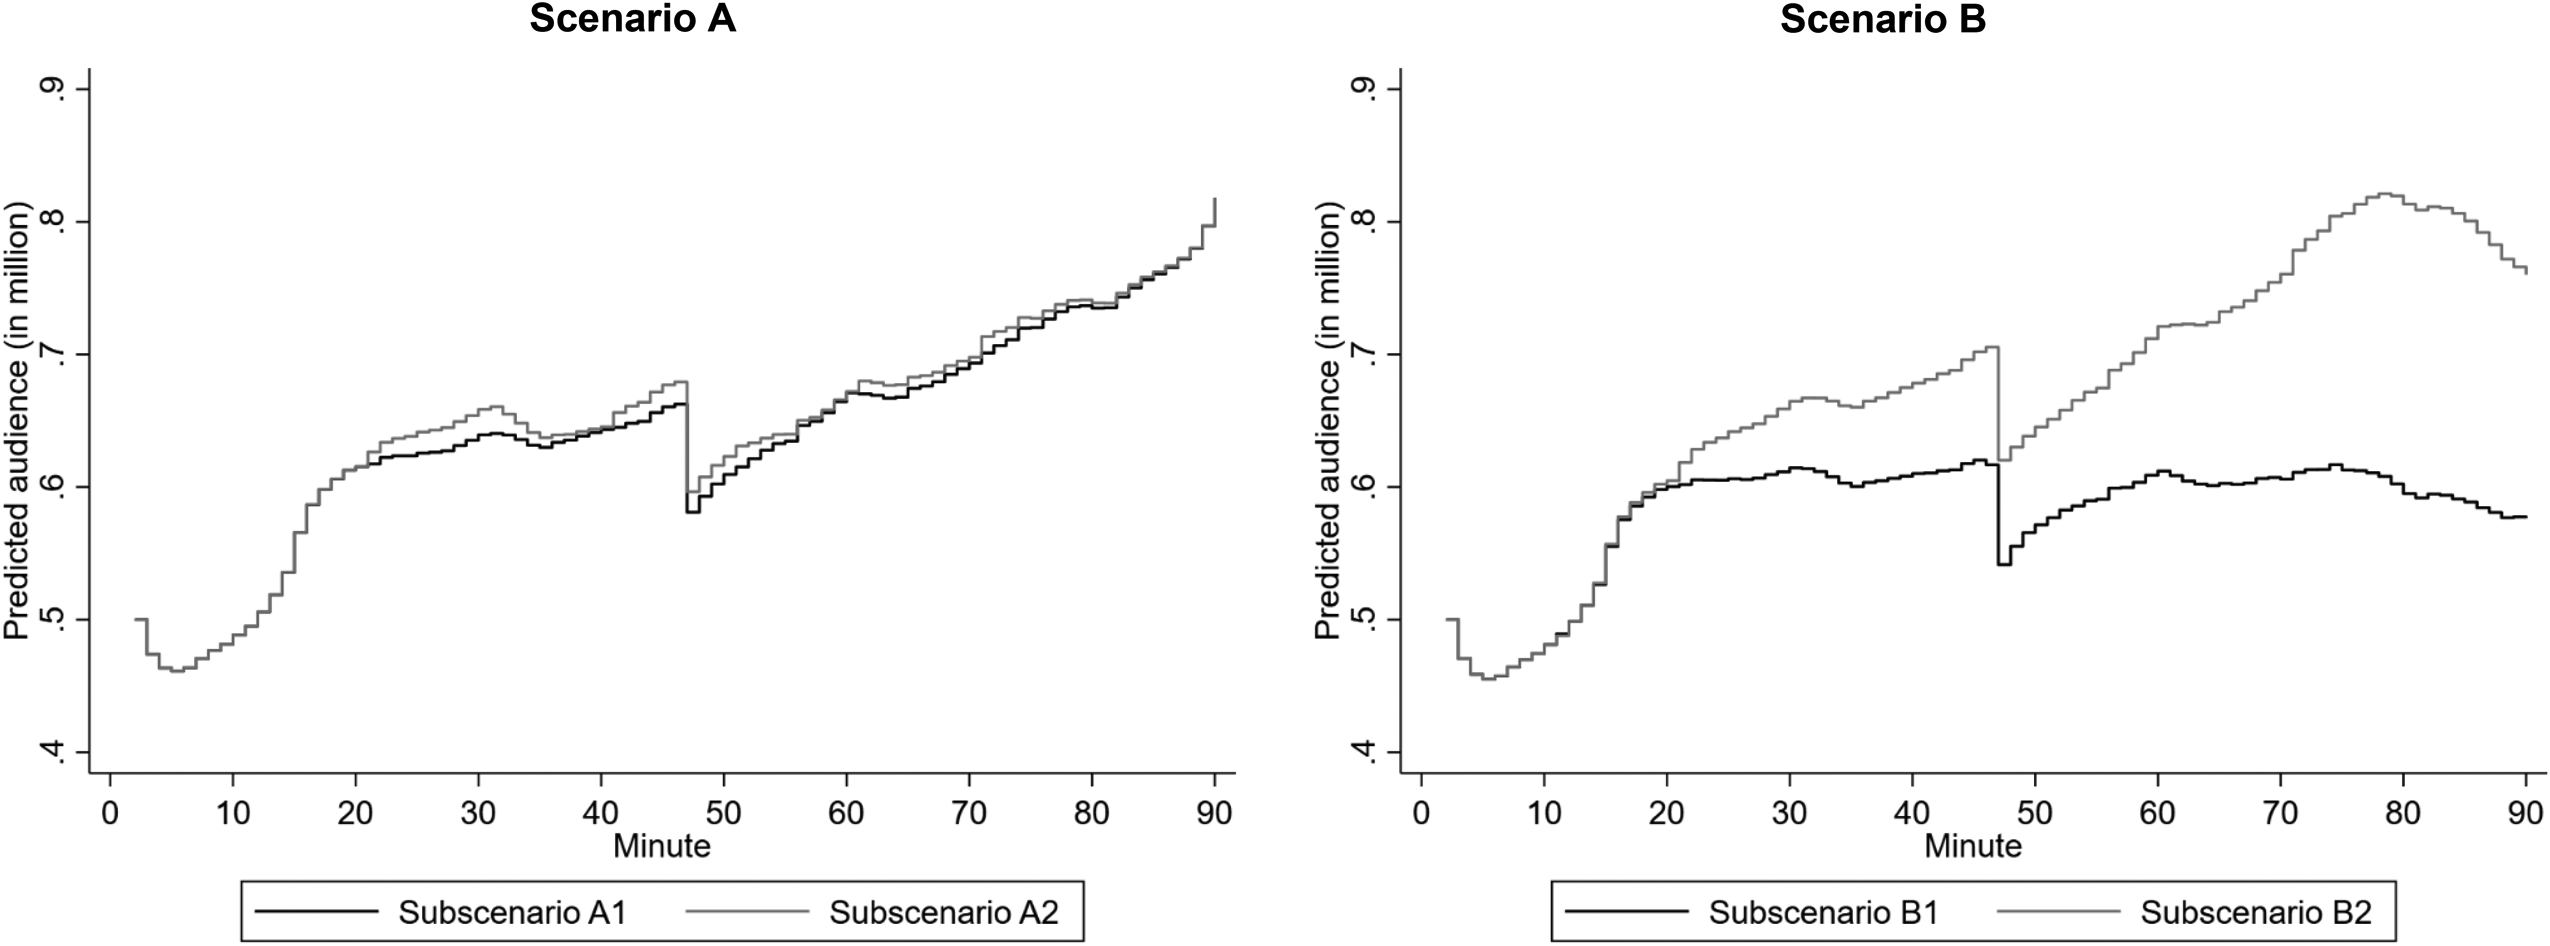
Predicted audience (in millions) based on four hypothetical group stage games.
Description of the Hypothetical Game Scenarios.
First, both A1 and A2 are characterized by similar levels of suspense, yet A2 is characterized by higher amounts of surprise and shock around the time of goals. Figure 4 provides the predicted audience for these subscenarios. In the first 20 min both games have exactly the same viewership. After the first goal and up to the 70th minute, the A2 game attracts on average higher viewership than the A1 game. Comparing both subscenarios for the full game, the A2 game attracts extra 611,000 viewer-minutes in comparison to the A1 game. This equates to roughly an extra 6,865 viewers per minute.
Second, the B2 game is characterized by higher amounts of suspense, surprise and shock than the B1 game. In the first 20 min both games have exactly the same viewership. When the underdog scores, the B2 game starts to attract higher viewership than the B1 game with the difference between both becoming substantially higher in the second half of the game. Comparing both subscenarios for the full game, the B2 game attracts extra 7.969 million viewer-minutes in comparison to the B1 game. This equates to roughly an extra 89,540 viewers per minute.
Finally, comparing scenarios A and B, both games A1 and A2 attract larger audiences than game B1, that is extra 5.185 and 5.796 million viewer-minutes respectively. 15 However, game B2 has higher aggregate viewership than games A1 and A2, attracting extra 2.784 and 2.173 million viewer-minutes respectively. These simulations are suggestive that games between equally matched teams attract higher viewership than games in which the favorite win. At the same time, however, games where the underdog wins the match generate even higher audience levels. This is in line with notion that fans seem to have a preference for upsets which is frequently reported in the literature examining the impact of outcome uncertainty on viewership using aggregated audience data (Humphreys & Pérez, 2019) or survey data (Pawlowski et al., 2018). This result is also in line with Antony et al. (2021) who modeled belief-consistent against belief-inconsistent scenarios. The authors concluded that belief-inconsistent results of a game that contradicted the pre-match belief were better predictors of subjective event boundaries (or what the subject thought would happen).
Conclusion
We implemented the seminal framework of Ely et al. (2015) by replicating and extending its applications by Bizzozero et al. (2016) and Buraimo et al. (2020). In particular, we explored for the first time whether and how belief dynamics during the course of the same events are driving entertainment utility and, consequently, the demand for televised sports in different markets.
Overall, we find that suspense and surprise are statistically and economically significant drivers of demand for UCL matches in both the UK and Spanish market. These effects are not absorbed when controlling for traditional uncertainty of outcome measures. Moreover, our findings suggest that suspense and surprise matter more for group stage (rather than knock-out-stage) matches as well as in the second (rather than the first) half of a match.
Interestingly, we find the combined effects of suspense and surprise in UK to be fairly similar to those reported for the English Premier League (see Buraimo et al., 2020), while in the Spanish market the combined effects are fairly similar to those reported for Wimbledon tennis (Bizzozero et al., 2016). Buraimo et al. (2020) argued that any differences in effect sizes between their study and the study by Bizzozero et al. (2016) may be attributed to the fact that Wimbledon matches were shown on free-to-air television, while Premier League games are only accessible on pay-TV platforms. At first sight, our findings could be considered as suggestive evidence that this argument may hold. However, our sample size prohibits running sub-sample estimations focusing just on free-to-air games in the Spanish market to further support this argument. As such, we are cautious with any such conclusions.
Moreover, differences regarding the salience of emotional cues in the two markets could be also ascribed to distinct social/cultural contexts. For instance, Liddell and Williams (2019) find that response to emotional cues (or “emotional regulation strategies”, in their words) may depend on various contextual factors, including cultural differences. As such, future research focusing on cross-cultural differences could deliver some meaningful insights in this regard.
A further highly relevant line of future research is exploring effect heterogeneity with regard to fandom. Even though Madrigal et al. (2023) find that enjoyment differences are independent of “favorable” outcomes (see also Hall, 2015), behavioral responses to emotional cues could differ across the different types of viewers. Initially, we thought about exploring this in our setting by simply comparing the effects for UCL games involving (or not) domestic teams. Doing so, however, is problematic already from a theoretical perspective, since viewing figures probably consist of fans of a team hoping for a favorable outcome as well as “haters” that tune in to watch hoping for a poor outcome for a rival team. As such, individual level data is required. Such data would also allow delving into how emotional cues are related to a viewer's tuning and switching behavior as well as their attention level (see Liu et al., 2020).
Overall, these results offer some implications for broadcasters, advertisers/sponsors, and league organizers/governing bodies.
In this regard, our findings could inform advertisers and sponsors on the proper timing of ads placement and sponsor messages during live sports content. More precisely, our findings suggest that advertisers and sponsors may benefit from increased visibility due to higher viewership after surprising moments (e.g., a goal of an underdog), when an upset seems very likely to happen, or when a game is very suspenseful. At first glance, this implication seems to be in line with the consumer psychology literature. For instance, Bee and Madrigal (2012) find that fans react more favorably to ads shown after suspenseful games. Since, however, viewers are less attentive to sponsor messages in suspenseful situations (Breuer et al., 2020), the overall effectiveness of placing an ad or sponsor message when a game is suspenseful remains unclear.
Our findings also suggest that broadcasters should not be afraid to show a game with a clear favorite as long as there is still a chance for an upset to happen. Although it is difficult to predict which games may result in an upset, it may be possible to stimulate fan engagement by promoting one-sided games in a way that invokes a “David and Goliath” narrative.
Finally, wins of underdogs are rare in football and depend – amongst others – also on referee decisions. Hereto, there is an abundance of empirical findings showing that referees tend to favor the favorite team (e.g., Erikstad & Johansen, 2020; Lago-Peñas & Gómez-López, 2016). Such implicit biases can pose a barrier to the prospect of upsets. Consequently, any endeavors aimed at mitigating such bias could potentially yield a positive impact on viewership. Numerous leagues including the UCL have introduced video-assistant-referee systems to promote impartial and accurate decision making with notable success (see Holder et al., 2022). Increasing the level of impartiality even further and standardizing referee decision-making by revising rules that are open to subjective interpretation (e.g., stoppage time estimation) could be a step in the right direction.
Footnotes
Acknowledgments
Data was kindly provided by the Union of European Football Associations (UEFA). UEFA had no role in the study design, further data collection and analysis, or the preparation of the manuscript. We thank Lukas E. G. Fischer and Michael Nagel for their assistance in the development of the emotional cue measures. The paper was presented at/in the Sports Economics Talk (University of St. Gallen), the Business Economics Research Seminar (University of Zurich), the Sports Economics Research Seminar (University of Tübingen) and in a session organized by the North American Association of Sports Economists (NAASE) at the Western Economic Association International (WEAI) Conference. We thank all participants and discussants for their helpful comments and suggestions. Moreover, we thank the editor, Helmut Dietl, as well as two anonymous reviewers for their guidance and help in improving the manuscript. The authors do not have a financial interest in the topic of this paper and there are no conflicts of interest. All errors are our own.
Authors’ Note
Tim Pawlowski is also associated with LEAD Graduate School and Research Network, Tübingen, Germany and Interfaculty Research Institute for Sports and Physical Activity, Tübingen, Germany.
Declaration of Conflicting Interests
The author(s) declared no potential conflicts of interest with respect to the research, authorship, and/or publication of this article.
Funding
The author(s) received no financial support for the research, authorship, and/or publication of this article.