
Abstract
The lack of crowds at sports fixtures as a result of COVID-19 restrictions has allowed researchers a unique opportunity to examine the widely accepted convention of home advantage. This work takes a slightly different approach, by examining within game outcomes. Specifically using play-by-play data from the NFL, this paper asks whether the lack of crowds aided a Quarterback's ability to manipulate opposition defenses. Results suggest this was the case, though effects are not uniform by home and away team.
Introduction
Speaking after his Green Bay Packers team had come away from the New Orleans Superdome with a victory in week 3 of the 2020 National Football league (NFL) season, Packers’ Quarterback Aaron Rodgers claimed that “not playing with anybody in the crowds makes a huge difference” (reported by Kilgore, 2020). Rodgers was referring to a play in the fourth quarter; a 3rd and 3 scenario in New Orleans territory, in which his false cadence caused the Saints’ defense to cross the line of scrimmage before the ball was snapped. This led to a free play and ultimately set up the Packers’ game-winning touchdown.
Such scenarios became increasingly familiar during the 2020 NFL season. Usually, playing in front of a loud capacity crowd would mean the Quarterback, especially the away team's Quarterback (i.e., Rodgers in the above example) ability to manipulate the defense with his cadence is significantly lessened. Yet, COVID-19 restrictions at the time in New Orleans meant that only a smattering of fans was in attendance allowing Rodgers to successfully use his cadence to trick the opposition defense into committing a penalty.
The aim of this paper is relatively straightforward. To what extent did the lack of crowds (as a result of COVID-19 restrictions) affect a Quarterback's ability to manipulate opposition defenses, as well as potentially inadvertently fooling their own offense? The work contributes to the recent dearth of literature examining the interplay of crowds (or lack of them during COVID-19 restrictions), home advantage, and refereeing decisions in professional sports, with a particular focus on in-play outcomes, rather than considering final match outcomes. More specifically, the paper analyses the incidence of nondiscretionary, pre-snap penalties with the intention of being able to more accurately distinguish between player and referee responses to playing in front of no crowds. Findings reveal that home defenses are less likely to commit penalties at the line of scrimmage when stadiums are full. However, crowds play no role in an offense committing penalties at the line of scrimmage, neither for the home nor the away team.
The paper proceeds as follows. “Related Literature” describes the related literature. “Context, Data & Methodology” discusses NFL attendances and penalties, and how they may be related, before describing the data and methodology. Results are shown in “Results,” and “Conclusion” concludes.
Related Literature
One of the most widely accepted conventions in sports is home advantage; the home team gets more points, is more likely to win, and gets more favorable refereeing decisions. The effect of the crowd is touted as one, though by no means the only source of this advantage. Home stadium familiarity and travel fatigue are generally identified as two other factors that may contribute to home advantage (Balmer et al., 2003; Nevill & Holder, 1999; Ponzo & Scoppa, 2018). Within crowd support, what is less clear is the mechanism through which it operates, be it through its effects on player effort, on refereeing decision making, or both.
A common explanation for changes in player and/or refereeing behavior is that the presence of a largely partisan, home-supporting crowd induces additional (social) pressure on the agents, which can in turn affect decision making (Dawson, 2012; Dohmen & Sauermann, 2016). Such explanations arise from advances in economics recognizing that agents’ decision making is affected not only by monetary incentives but also by social considerations, so much so that payoffs from adhering to social cues enter the utility function (in Bernheim (1994) for example, this is characterized as “esteem”). Unfortunately, empirical tests of how such social cues affect behavior can prove problematic due to the lack of exogenous variation in social pressure. Data from sports offers a potential solution, and it has long been recognized sports offers a fruitful laboratory for economic research (Bar-Eli et al., 2020). More specifically, the lack of crowds at sports fixtures as a result of COVID-19 restrictions has offered researchers a unique opportunity to examine the extent to which social pressure (i.e., crowds) contributes to home advantage. Previous attempts to identify such effects were limited to a very small sample of games as a result of, for example, one-off punishments from crowd disturbances (see, e.g., Reade et al., 2021), or games played at shared stadiums (Ponzo & Scoppa, 2018).
Much of the literature examining the effect of crowds (or lack of them as a result of COVID-19 restrictions) on home advantage focuses on European football. Fischer and Haucup (2021) show that German first division (Bundesliga) teams suffered a reduction in home advantage when games were played without fans, though the same cannot be said for the second and third tiers; a finding that appears to be driven by these clubs being used to playing in front of smaller crowds pre-pandemic. McCarrick et al. (2021) also find reductions in home advantage (measured by goals scored and points gained) across 15 different European leagues, while work by Bryson et al. (2021) shows that the removal of crowds led to a reduction in the number of yellow cards shown to the away team. They argue that the most likely mechanism is the removal of social pressure stemming from the home crowd results in less severe punishments for the away team.
Turning to the literature on North American sports, Gong (2022) reveals that the presence of fans does not lead referees to treat home and away teams differently during the last two minutes of games in the National Basketball Association (NBA). The exception to this is referees appearing not to call loose ball fouls that should have been called against the home team. Two further studies on the NBA, by Ehrlich and Potter (2022) and Leota et al. (2021), demonstrate that crowds play a significant role in determining match outcomes. The former finds that home advantage is wiped out entirely in games with no crowds, but a small portion remains when limited numbers of fans are in attendance. The same cannot be said about Major League Baseball (MLB) however. Losak and Sabel (2021) find no evidence that home team win percentage was different in 2020 (when MLB teams played in front of no fans) than in the 2019 season, though this was not uniform across the season.
In the NFL, both Robst et al. (2011) and Pitts (2016) find that teams playing at home are significantly more likely to win matches, though both their analyses are focused on postseason outcomes. At present, we know very little about changes to home advantage in the NFL since the advent of COVID-19. One exception is Davis and Krieger (2021), though their focus was primarily on the reaction of betting markets rather than on the results themselves. Nevertheless, they report that bookmakers appear to attribute about 57% of home field advantage to crowd support, given the change in average closing lines pre- and during COVID-19. A final paper of note is Higgs and Stavness (2021) who assess changes to home advantage across all four major North American sports (NFL, NBA, MLB, and the National Hockey League, NHL). Their results suggest that home advantage decreased in the NBA and NHL compared to the previous four seasons, but not in MLB or the NFL. They argue that this was likely due to much harsher COVID-19 protocols put in place by the NHL and NBA.
Another important strand of literature to consider is that which examines the determinants of penalties, with evidence coming both from the NFL and College Football. Snyder and Lopez (2015) find that the likelihood of referees calling discretionary penalties (holding and pass interference calls) is highly correlated with time. Calls are very low at the start and end of games, but high in the middle. Lopez (2016) also reports that referees are influenced by social pressure stemming from proximity to a team's coaches and players. In particular, penalties such as holding, interference, and unnecessary roughness, are far more likely to be called near midfield, but only near one team's side line. Other determinants shown to be important are warmer weather (Craig et al., 2016), off-the-field arrest records (Ge, 2019; Leal et al., 2017), the race of the player (Eiserloh et al., 2020), and even the race of the Head Coach (Davis et al., 2022).
The contribution of this paper to the literature is threefold. Primarily, we wish to try and more clearly distinguish between referee and player responses to crowds. This can prove problematic since it is not clear, for example, if it is players that are more likely to commit fouls with a crowd present, or if it is that referees who punish fouls more harshly, or a combination of the two. The assessment of player responses is particularly relevant in a setting where effective communication between teammates and opponents (or more precisely the deception of opponents) is key. We achieve this by examining a very specific group of penalty calls in the NFL, namely penalties that occur before a play starts. Such penalties are fairly clear cut and involve very little judgment by referees. In other words, they are not what would be considered discretionary penalties, as defined by Snyder and Lopez (2015). This, in theory, should allow for a much clearer assessment of player responses to playing with no crowd, rather than potentially conflating this with refereeing responses.
Other contributions include a broader assessment of the determinants of penalties in the NFL, namely the extent to which crowd sizes affect penalty calls, and finally we contribute to the literature surrounding home advantage in the NFL, which, compared to MLB and the NBA for example, seems a lesser studied league, particularly in relation to changes to home advantage in the NFL during COVID-19.
Context, Data, and Methodology
The NFL consists of 32 teams and is the highest level of professional football. Prior to the 2021 season, teams contested a 16-game regular season schedule, consisting of eight home and eight away matches. Following the conclusion of the regular season, the best placed teams go on to compete in the postseason, which culminates with the Super Bowl.
The data are formed by combining scheduling and attendance data from Pro Football Reference (www.pro-football-reference.com/), together with play-by-play data from NFL Savant (http://nflsavant.com/), for regular season games from the 2018 to the 2020 seasons. 1 The latter was affected by COVID-19 restrictions. Over these three seasons, there were some 133,000 individual snaps (or plays) in the NFL as reported by data from NFL Savant. However, there are a number of these plays that we exclude from analysis. Firstly, since 2007 the NFL has held games abroad as part of its international series. In the 2018 and 2019 seasons, a total of eight games were played abroad (seven in London and one in Mexico City). Due to COVID-19, no international games were held during the 2020 season. We omit these international games from our analysis (a loss of 1,160 individual plays). Even though one team is designated the “home” team for operational reasons, the stadium is essentially a neutral venue, and so it is not clear how home advantage would play out in these games. Finally, we remove largely irrelevant plays such as Quarterback kneels and kick-offs, so the resulting the sample size stands at a little over 108,000 snaps.
NFL Attendances
Like most major sports leagues, NFL games regularly sell out (Mills & Fort, 2014). Attendance data used in this paper reveals that during the 2018 and 2019 seasons (i.e., pre-COVID-19), average stadium capacity usage was above 95%. The situation changed dramatically with COVID-19 restrictions, with average capacity usage dropping to 6.7%. 148 games (out of the total 256) took place in front of no spectators at all. Figure 1 plots the density of stadium capacity usage for the 2018, 2019 and 2020 seasons.
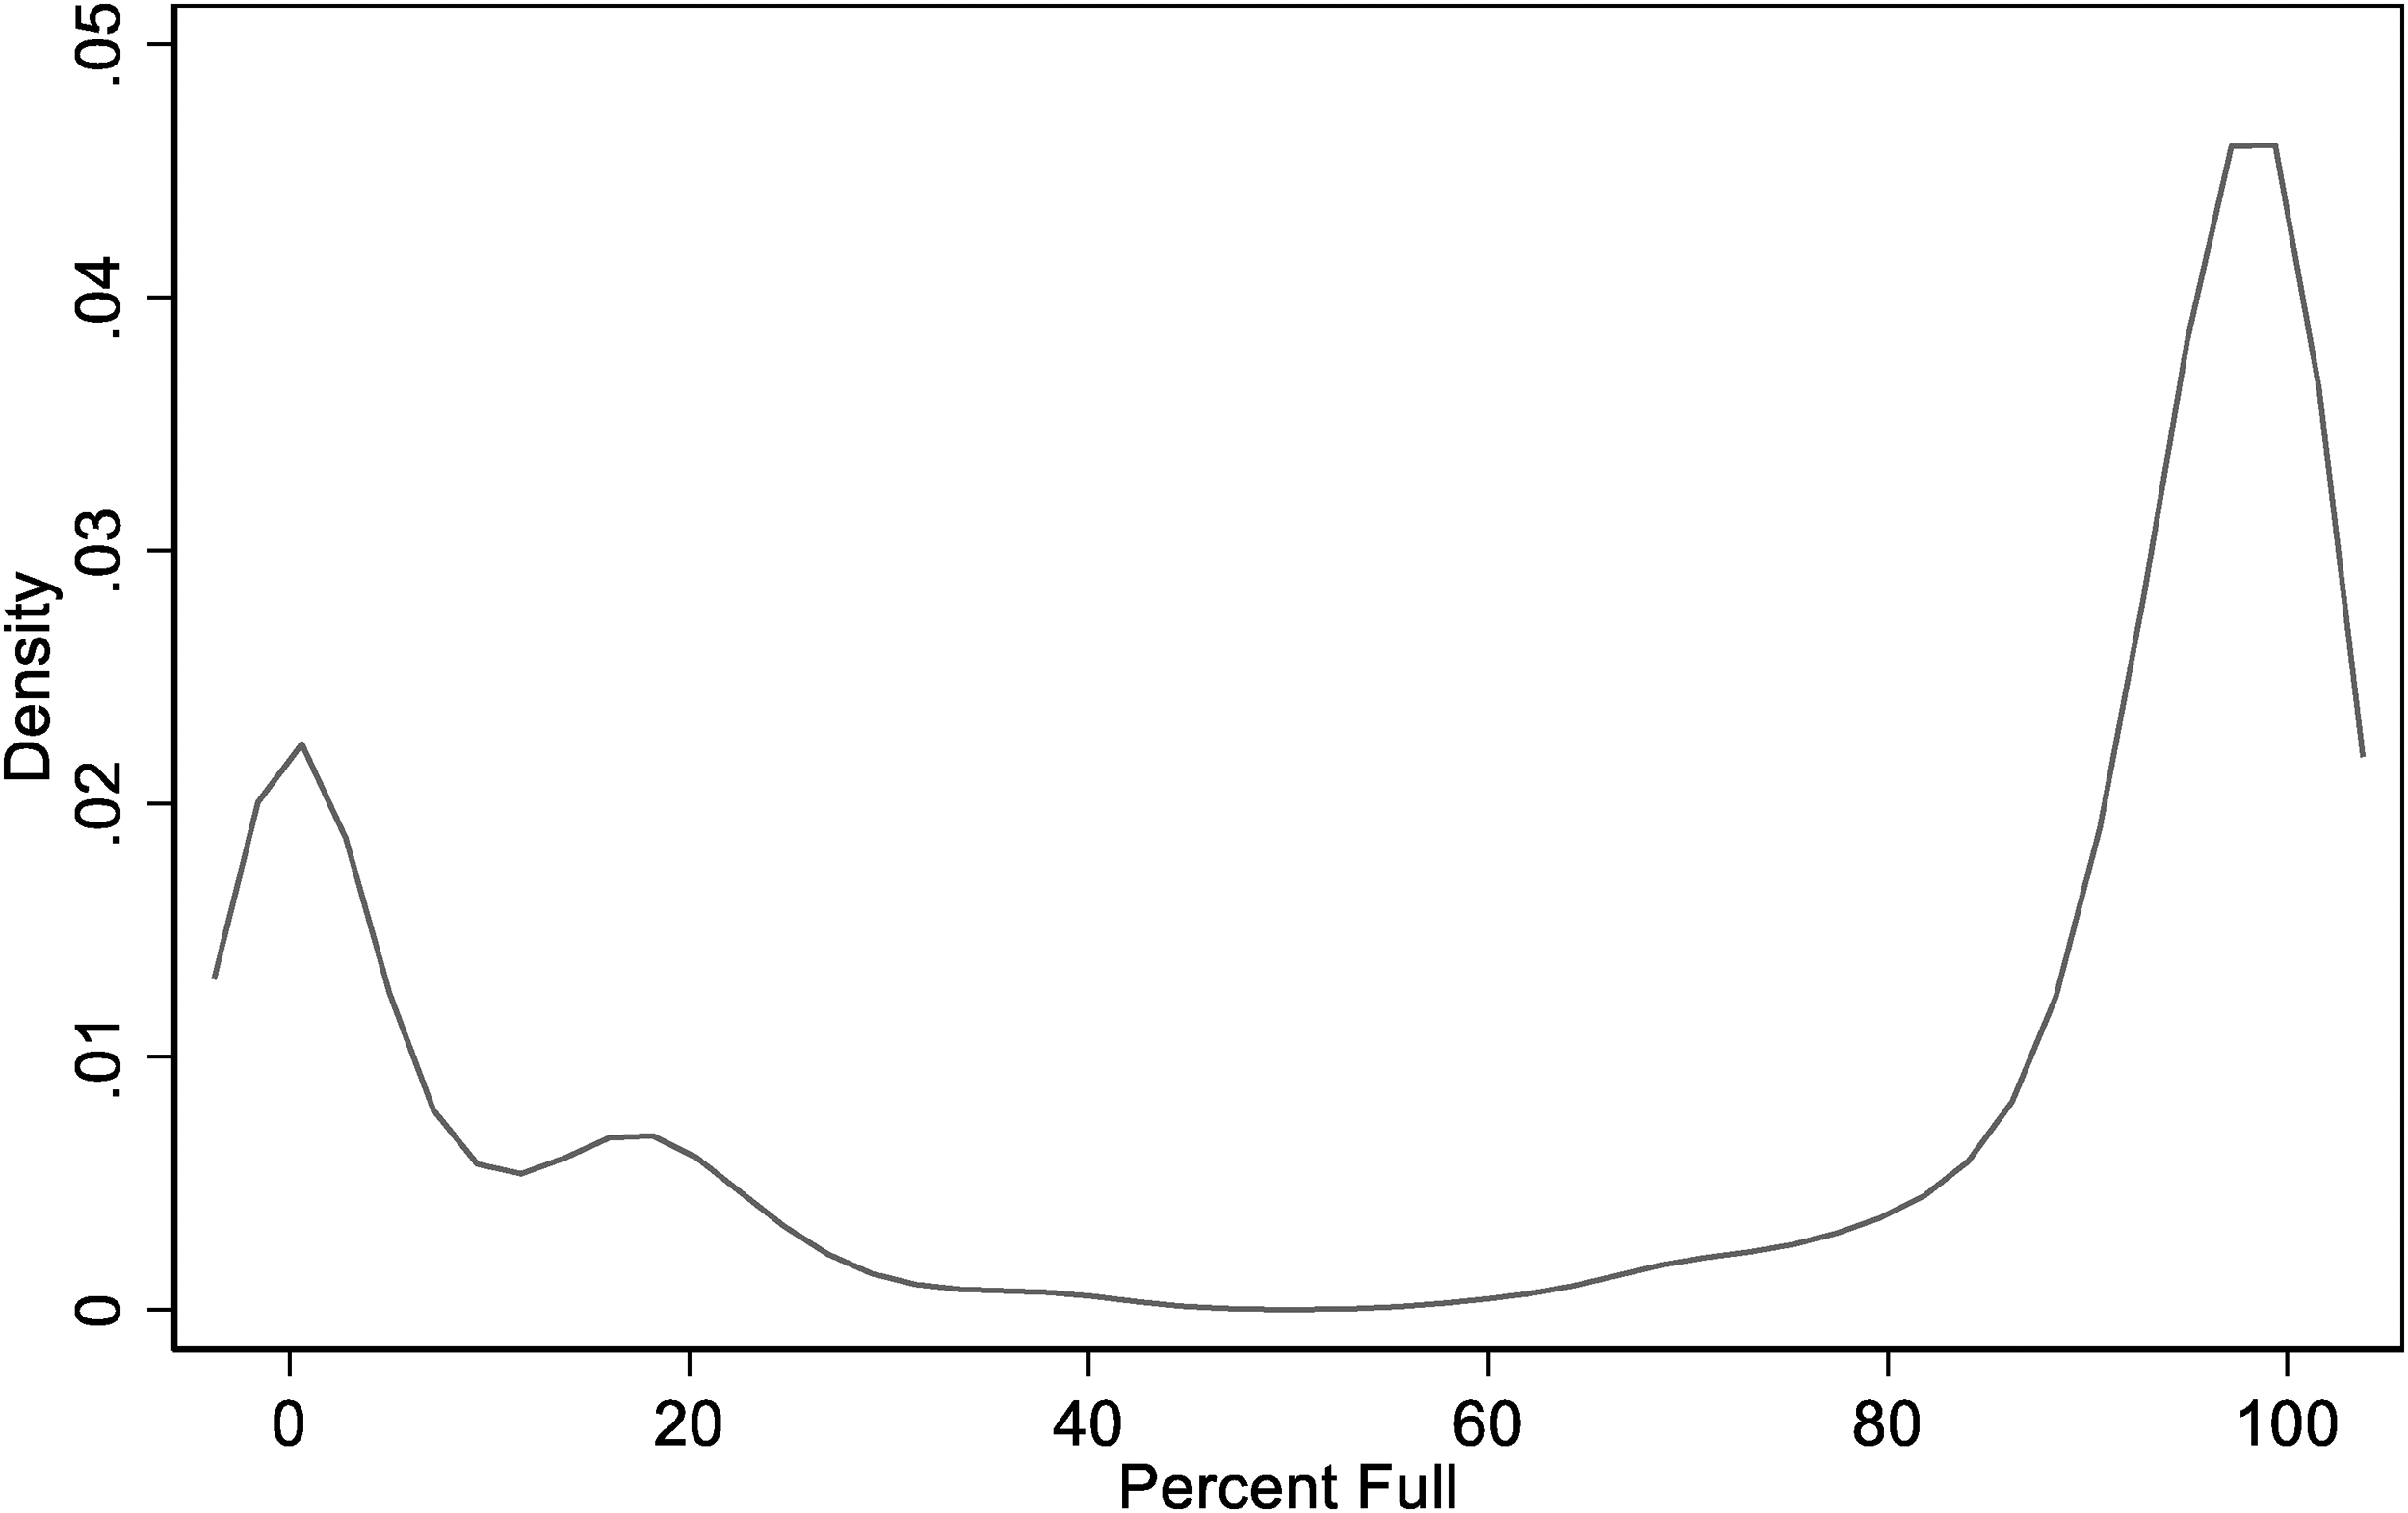
Kernel density estimate of stadium capacity usage.
Stadium utilization was not uniformly zero throughout the 2020 season. Figure 2 plots the seasonal average attendances for all 32 teams. Average attendances were relatively stable across the two seasons prior to COVID-19. The Dallas Cowboys had the highest average attendance, while the Los Angeles Chargers had the lowest average attendance (this was prior to their move to the new stadium in Los Angeles). All teams played in front of lower average crowds during the 2020 season, and many played in front of no fans for their entire home season. It was not necessarily the case however, that the ranking of teams stayed constant from 2018&19 to 2020 as this was dependant on local restrictions. For example, the Cincinnati Bengals (second lowest average attendance in 2018 and 2019) had the 10th highest average attendance during 2020. Moreover, due to loosening and tightening of restrictions over the course of the season, many teams experienced playing in front of both empty stadiums and restricted crowds. The Tampa Bay Buccaneers had the highest variation in attendances across the 2020 season.
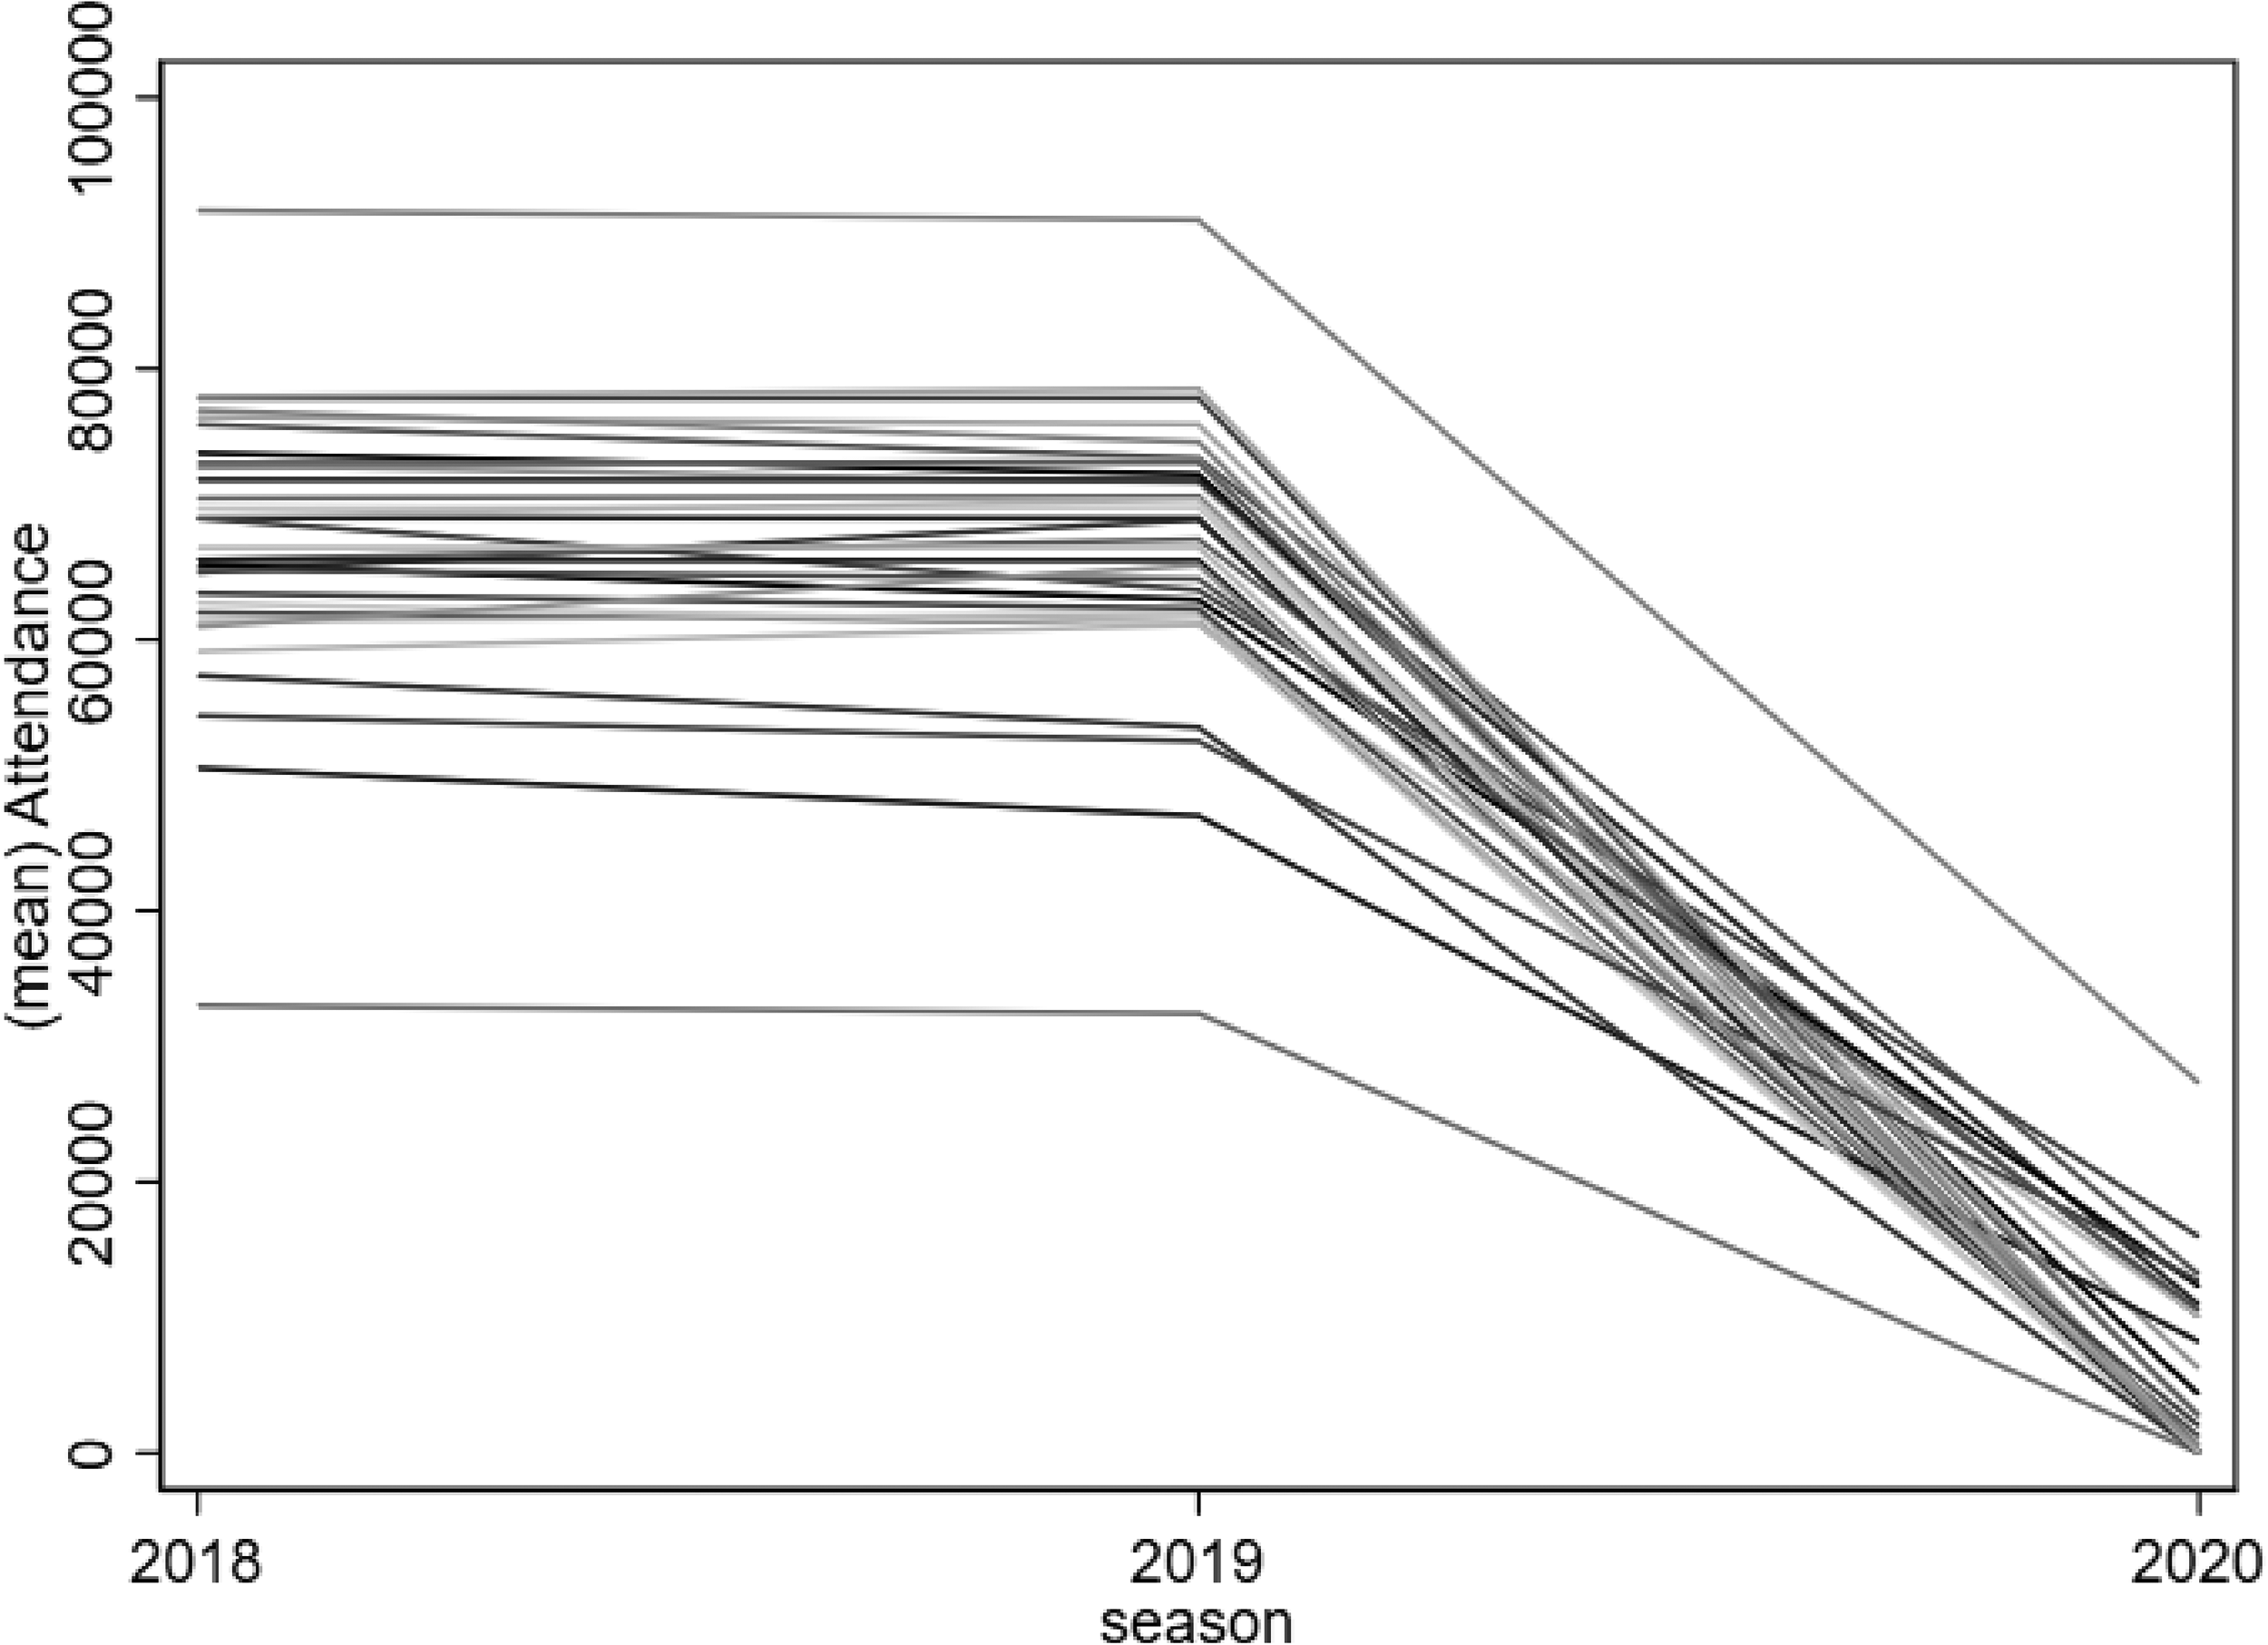
Average attendances by team.
NFL Penalties
An NFL game consists of a series of snaps (or plays) as teams try to progress the ball downfield to score points. Teams have four attempts (known as downs) to move the ball at least 10 yards, at which point they are given a fresh set of downs. Typically, before each snap a team will decide on a play in the huddle (with communication from the coaching staff) and then get set in their offensive formation. At this point, the Quarterback will typically, but not always, shout out a cadence. This is a series of instructions to his offensive teammates and might include a combination of words, colors and numbers followed by some signal to start the play. These words are coded with specific instructions to the offense on a variety of topics such as, but not limited to blocking assignments, defensive coverages, pre-snap motions and changes to the play.
Alternatively, the instructions could be specifically designed to try and deceive the defense into moving before the ball is actually snapped, resulting in a penalty called against the defense. One particular manifestation of the cadence is the so-called “hard count,” a type of cadence with irregular tones and accented syllables, with the aim of trying to fool the defense into moving before the ball has been snapped. In a game theoretic setting, this might be considered as “cheap talk,” in that a sender (the Quarterback) can send some costless signal to a receiver (the opposition) about their intentions. Given that the opposing sides have opposing preferences, in theory, this message should not convey any useful information and a so-called “babbling equilibrium” should exist (Crawford, 1998). To put that another way, nothing a Quarterback says should affect the defense's response because the Quarterback has a clear incentive to alter the behavior of the opponents. Yet, we know this is not true in NFL (defenses are routinely deceived by the Quarterback), and indeed various experimental evidence shows that recipients of cheap talk act on it too much compared to what is predicted by theory (Battaglini & Makarov, 2014; Croson et al., 2003). Of course, a hard count could also backfire and rather than tricking the opposition defense, the Quarterback could end up tricking his own offense into moving before the ball has been snapped, resulting in a penalty called against the offense.
Naturally, a noisy crowd should limit the effectiveness of the hard count, as the cadence would be drowned out by the noise of the crowd. This is particularly true for the visiting team's Quarterback, likely more so than the home team's Quarterback as fans typically get louder when the opposition is in possession (incidentally, fans are often actively encouraged to do so by messaging on the electronic screens inside stadiums). 2 Plays on 3rd downs are also more susceptible to crowd noise as typically, a 3rd down is seen as a team's last opportunity to convert to be given a fresh set of downs before having to punt the ball away on 4th down. In the event that teams elect to “go for it” on 4th downs (i.e., attempt a play rather than punt the ball away), the crowds also get louder to try and distract the opposition in these cases. The implication of this is that one would expect a lack of crowds, such was the case during COVID-19 restrictions, to make it far easier for a Quarterback to manipulate defenses with use of the hard count. This would be particularly true for the away team's Quarterback following the removal of a noisy home crowd.
On any particular play, the referees can signal for a multitude of different fouls. In fact, a total of 55 different penalties are called by referees over the 2018 to 2020 seasons, amounting to a penalty called on approximately 9.5% of plays. However, some of these penalties are so rare, and most are not relevant to this analysis. In particular, there are four penalty types that are of interest here. Specifically, we are interested in pre-snap penalties that occur at the line of scrimmage (i.e., the imaginary line denoting the starting position of the ball at each down, describing the situation just before a play starts and players are set in their offensive and defensive positions). These can be grouped into one type of offensive penalty (False Start) and three types of defensive penalty (Defensive Offside, Encroachment, and Neutral Zone Infraction). 3 A full definition of these penalties, along with the number of times with which they occurred during the 2018–2020 seasons, can be found in Table 1.
Penalty Types.
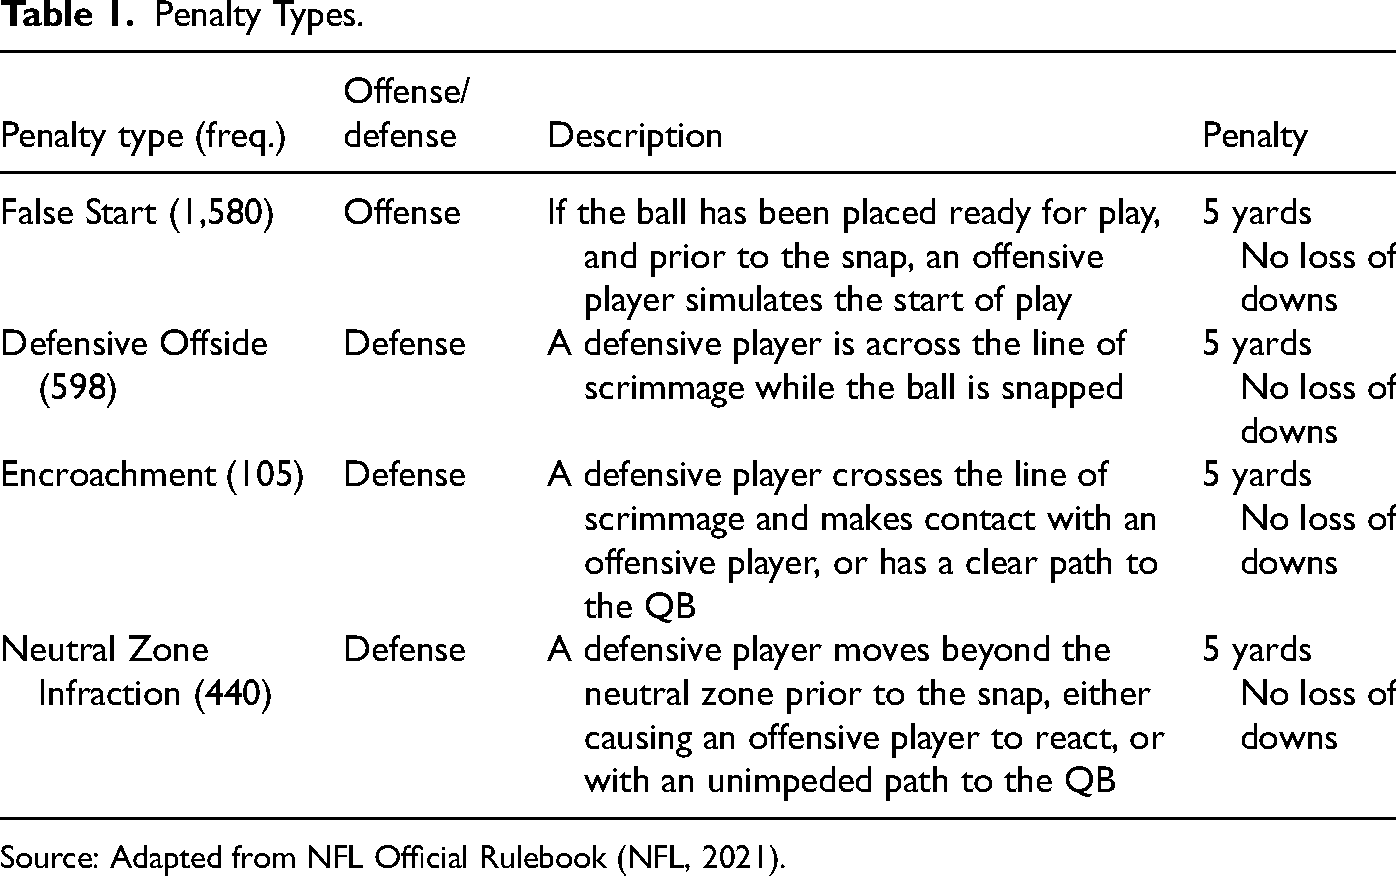
Source: Adapted from NFL Official Rulebook (NFL, 2021).
As noted in the literature review, focusing on these particular types of penalties, rather than all penalties, or say, fouls and cards in European football, is advantageous in that there is far less of a judgment involved for the referees when calling these penalties. It involves far less judgment, for example, to see if a defensive player is lined up in the neutral zone compared to whether a foul in European football merits a yellow card, if it is signaled for a foul at all. As such, this should provide a much cleaner assessment of player responses to playing with no crowds, rather than conflating this with refereeing decisions.
Methodology
The outcome of interest is whether or not a particular play resulted in a line-of-scrimmage penalty. As such, the outcome is a binary variable, and logistic regression models will be estimated separately for offensive line penalties and defensive line penalties (pooling the three defensive penalties together). 4 Due to the rarity of these penalties, one may be legitimately concerned that the probability of the rare penalties would be underestimated by conventional logistic regression (King & Zeng, 2001). However, a check using a rare events correction reveals results to be remarkably similar to conventional models. 5 The estimation strategy employed here closely follows that of Pettersson-Lidbom and Priks (2010) and Scoppa (2021) by exploiting exogenous variations in crowd sizes (in the former, this was due to stadium closures following instances of crowd violence, while the latter uses stadium closures due to the COVID-19 outbreak).
We proceed by estimating the following,
Within vector
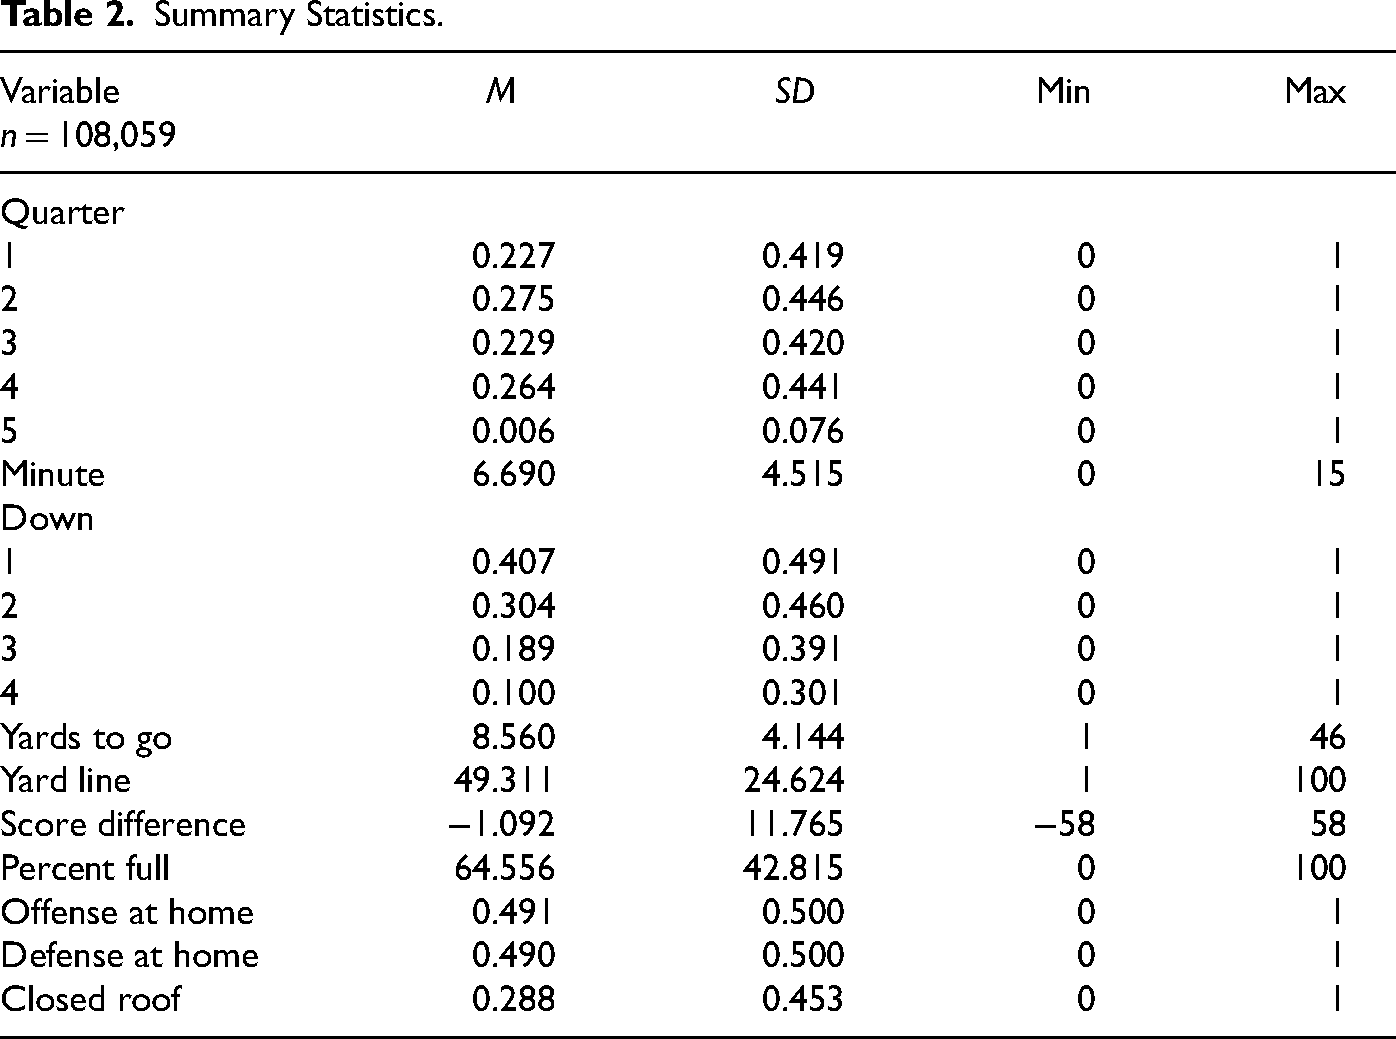
We also investigate several interaction terms that could be important. The first of which is an interaction of the down number with yards to go. Quarterbacks often attempt to draw the defense offside in third (and possibly fourth) and short (i.e., only a yard or two to go) situations. In this case, a resulting 5-yard penalty against the defense would automatically give the offense a new set of downs. Consequently, we might expect that incidences of penalties would increase on 3rd and 4th down plays with only a few yards to go. We also interact the quarter of the game with the score difference, with particular interest for the 4th quarter and overtime interactions. The signs of these interactions could be hypothesized to work in either direction. If the game is close in the last quarter (or overtime), players may be eager to “make a play” and risk jumping offside, in which case a penalty would be more likely late on in close games. On the other hand, players will also be aware that committing a penalty late on in close games would be very costly, in which case we might expect to see fewer penalties in such cases. Finally, we also run models including offense and defense team fixed effects, to control for the fact that, all else equal, some teams may be more or less likely to commit penalties. 7 See Table 2 for summary statistics for these variables. As expected, very few games go in to overtime so very few observations belong to plays in overtime. A negative average score difference implies that on average, the offense team is losing by just over a point. Average stadium capacity usage over the three seasons is 64.5%.
Summary Statistics.
Results
Main Results
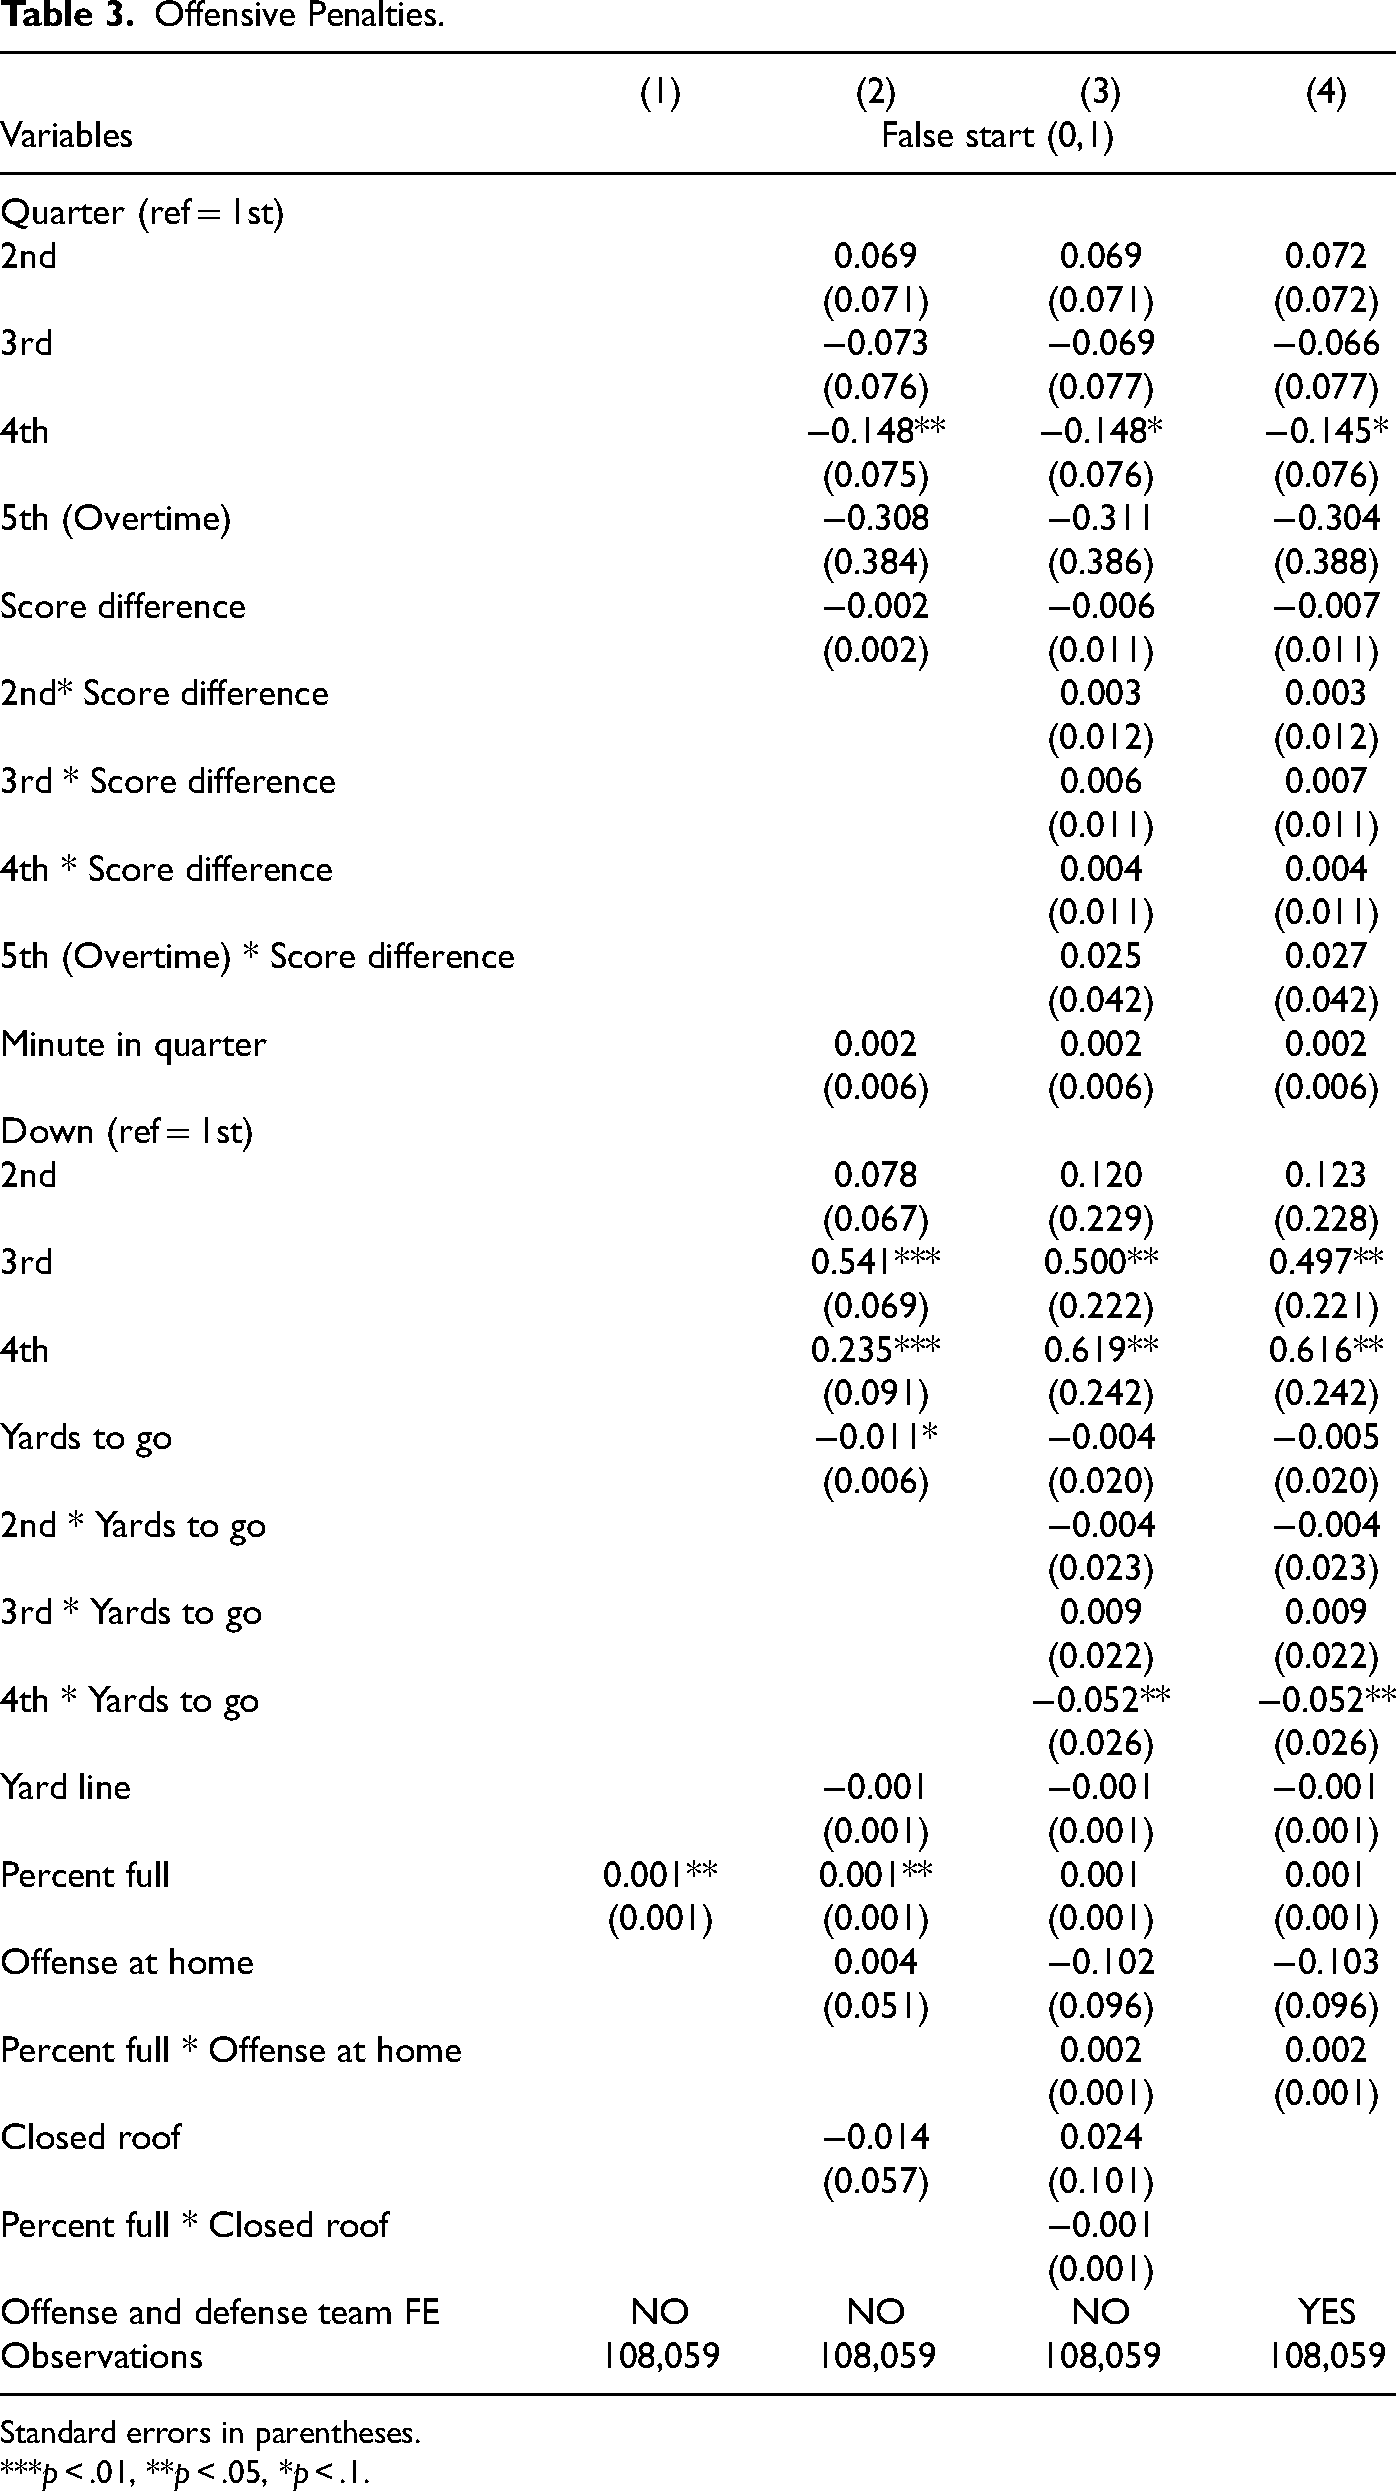
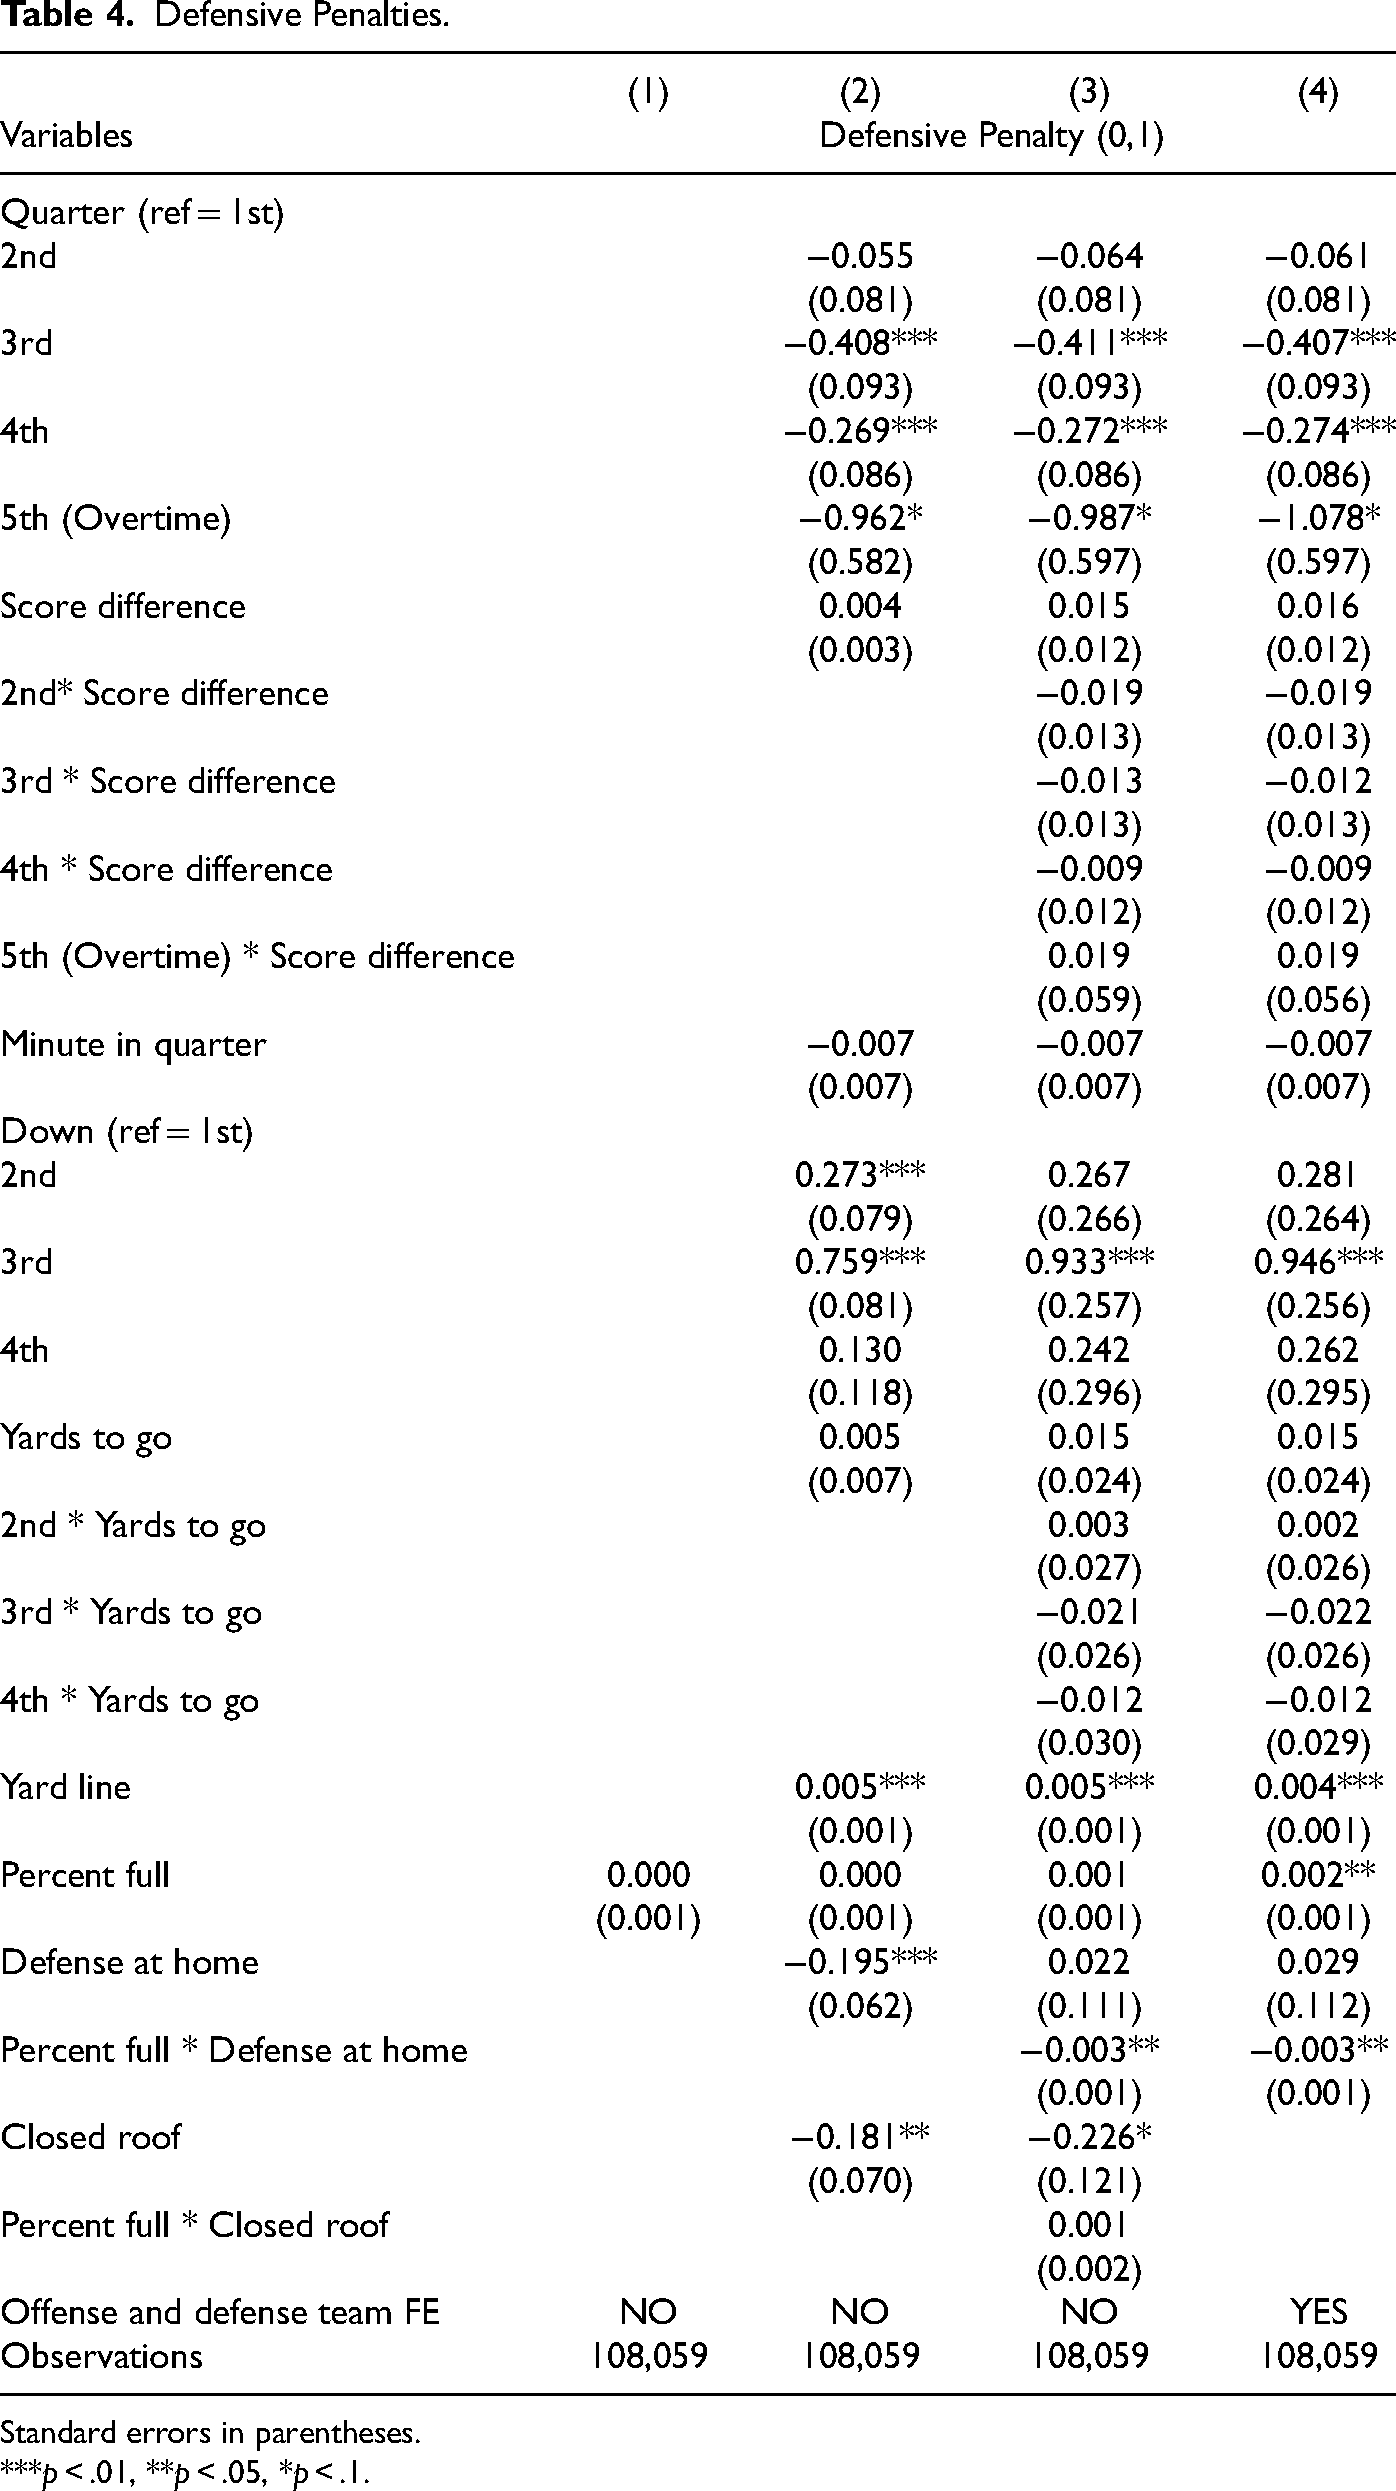
Table 3 models the likelihood of giving up a false start, while Table 4 models the likelihood of giving up a defensive penalty. Columns (1)–(4) gradually add in more variables, interactions, and finally offense and defense team fixed effects. With regards to the attendance variable Percent full, it appears higher attendances are associated with a higher likelihood of committing false start penalties, though when this is interacted with the dummy variable indicating whether the team on offense is the home team, this drops out of significance. The interaction itself is also insignificant. For the three defensive penalties, there is no significant relationship between attendance and committing a defensive penalty, apart from in the specification with team fixed effects. Of note however, the interaction between attendance and whether the defensive team is the home team is negative and significant in columns (3) and (4). In other words, defensive penalties decrease with higher attendance, only if the home team is on defense. This would be consistent with the argument that capacity crowds make it more difficult for the away team's Quarterback to fool the defense, and a likely mechanism is that the noise generated by fans drowns out the cadence. Put another way, the average marginal effect of percent full is 0.003 percentage points lower when the defensive team is the home team.
Offensive Penalties.
Standard errors in parentheses.
***p < .01, **p < .05, *p < .1.
Defensive Penalties.
Standard errors in parentheses.
***p < .01, **p < .05, *p < .1.
As for the control variables, false starts appear far less likely in the final (regular) quarter of games, and far more likely on 3rd and 4th down (especially the former) plays. This makes sense as offenses know they have to convert on these plays or risk turning the ball over to the opposition either via punting the ball after 3rd down or following an incomplete pass on 4th down. Interpreting these results as marginal effects (i.e., the partial derivative of the probability of committing a false start penalty with the quarter or down), reveals that the probability of false starting falls by 0.2 percentage points in the 4th quarter (all else equal, compared to the first quarter), while the probability increases by 0.8 and 0.3 percentage points on 3rd and 4th downs, respectively (all else equal, compared to the 1st down). With that said, the interaction of 4th down with yards to go enters negatively and significantly. In other words, with fewer yards to go, the likelihood of committing a false start penalty increases further. A possible explanation is that offensive linemen know they need to make a play in these crucial scenarios to avoid turning the ball over to the opposition and as a result are more “on edge,” risking moving before the ball is snapped. No other variables show significance.
Defensive penalties are far less likely to occur in 3rd and 4th quarter plays (and to an extent in overtime, though significant only at 10%), and far more likely to occur in 3rd down scenarios. Marginal effects are 0.4 and 0.3 percentage point reduction in committing defensive penalties in the 3rd and 4th quarters, respectively (all else equal, compared to the first quarter), and a 0.9 percentage point increase during the 3rd downs (all else equal, compared to 1st down). Also entering significantly in these models is the effect of Yard Line, which is measured from the offensive team's own end zone (so from the defense's point of view, higher values imply they are getting closer to their own end zone). As such, a positive coefficient implies the defense is more likely to commit a defensive line penalty when closer to their own end zone. These are higher stakes scenarios (the defense is faced with giving up a touchdown) and would be consistent with evidence on athletes making mistakes in high-pressure scenarios (e.g., Hickman and Metz (2015) for golf, Cohen-Zada et al. (2017) for tennis, and Toma (2017) for college basketball). Interpreting this as a marginal effect reveals that each 10 yards closer to their own end zone increases the probability of fouling by 0.04 percentage points.
The variable capturing playing in a closed roof stadium naturally is excluded from column (4) in Tables 3 and 4 due to its collinearity with certain teams. Nevertheless, columns (2) and (3) show the effect of playing in a closed roof stadium has no effect on false start penalties but reduces the likelihood of committing defensive penalties. This is somewhat surprising, as one would expect that noise would reverberate around a closed roof stadium. With that said, there is no significant effect for its interaction with attendance, and thus, it is possible that the closed roof variable is correlated with an unobserved team specific effect.
Robustness Checks
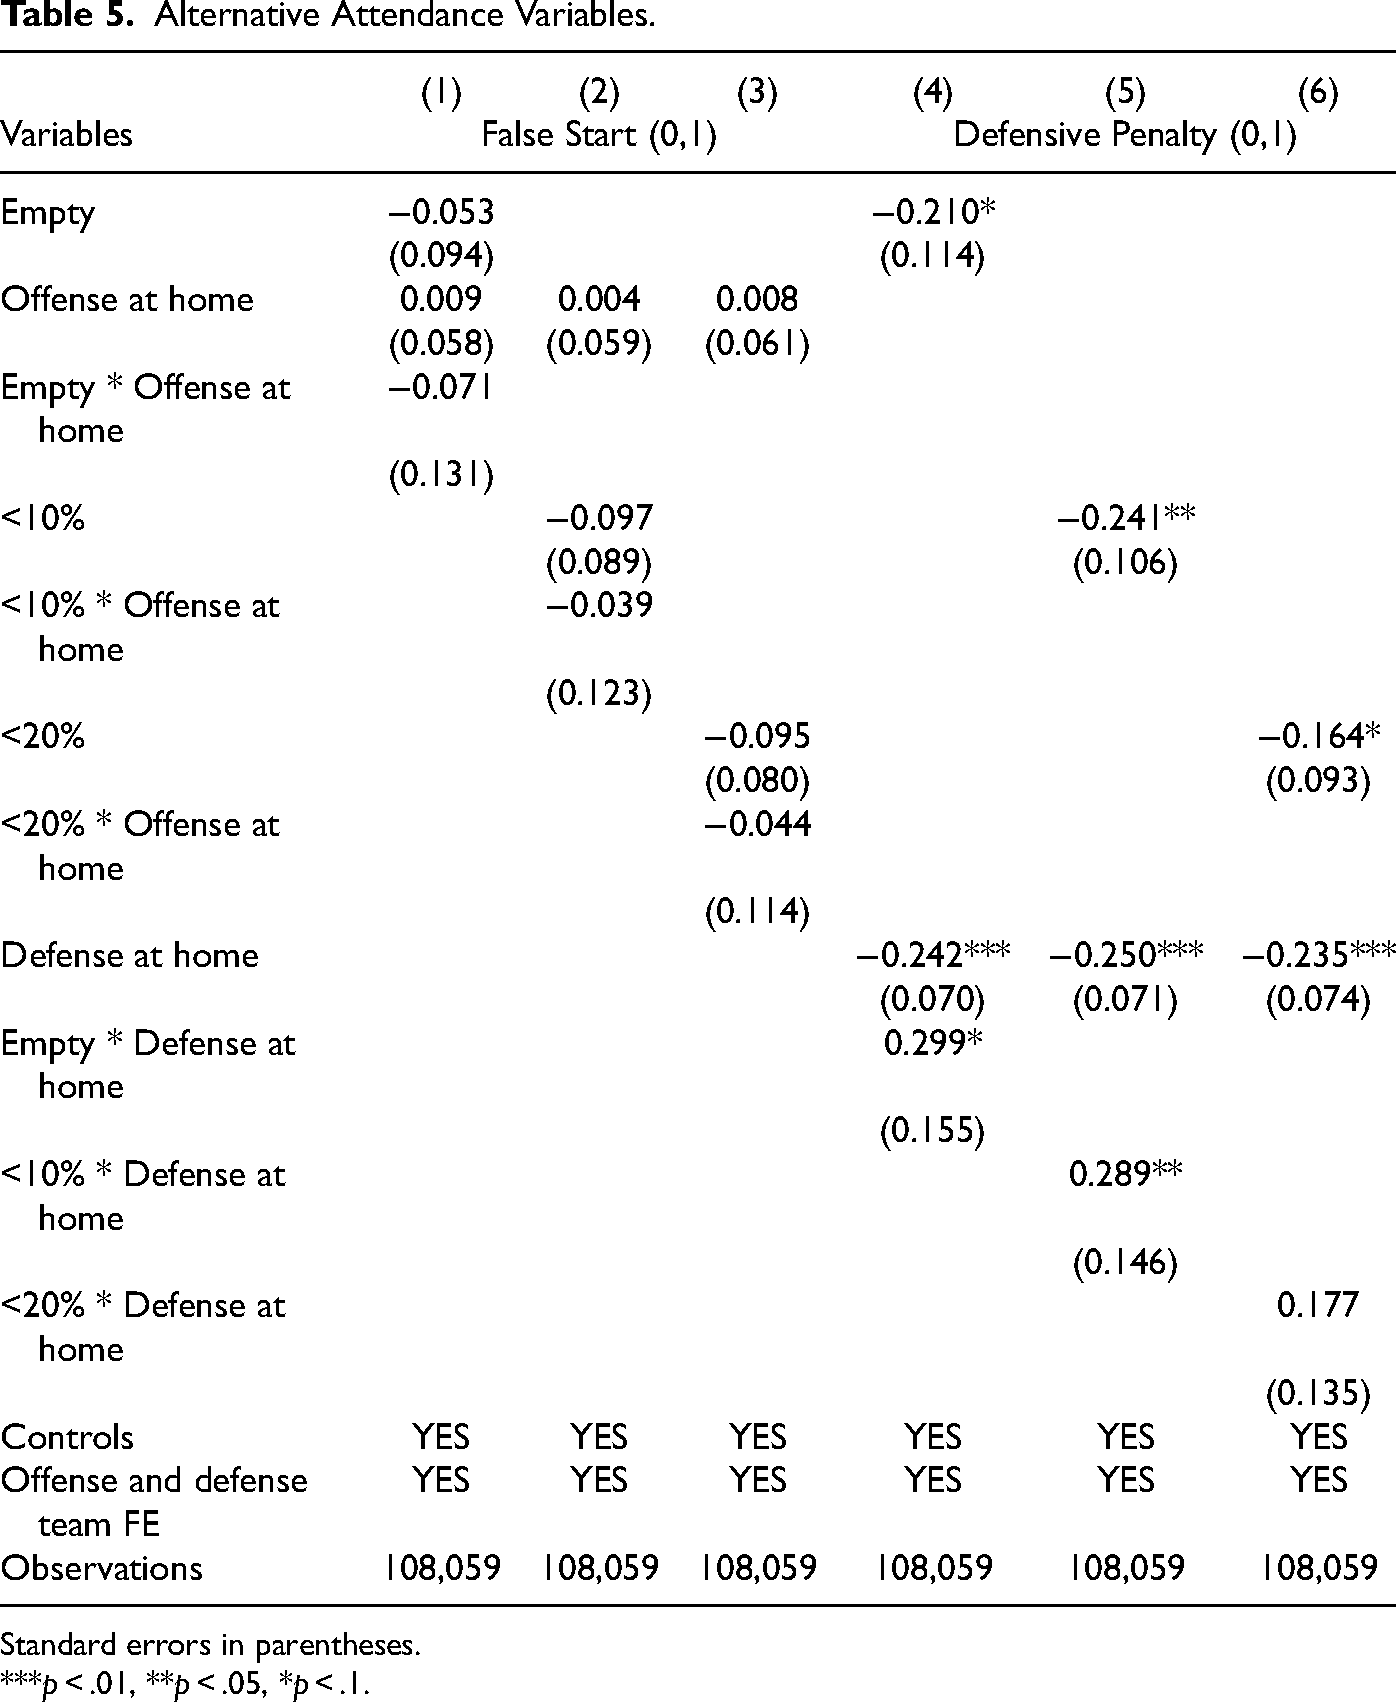
We first consider an alternative definition of the attendance variable. Referring again to Figure 1, stadium capacity utilization almost appears to behave as a binary variable, in that stadiums were either full or (close to) empty. As such, we experiment with dummy variables to capture the extent to which stadiums were utilized. The first of these, Empty, takes the value 1 if the stadium had no spectators, 0 otherwise. Yet, restrictions in many cities allowed for small numbers of spectators, thus, the variable <10% takes that value 1 if attendance was less than 10% of capacity, while <20% takes the value 1 if attendance was less than 20% of capacity, 0 otherwise. Results are shown in Table 5.
Alternative Attendance Variables.
Standard errors in parentheses.
***p < .01, **p < .05, *p < .1.
For False Start penalties, while the point estimates for the three dummy variables are negative (fewer false start penalties in empty, or close-to-empty stadiums), the coefficients are all insignificant. Contrasting this with the positive and significant effect of percent full in some specifications of Table 3, this would point toward attendance only really mattering at the very top end of the attendance distribution for false start penalties, rather than the extent to which a stadium is empty. Equally, the interactions with whether the home team is on offense are also insignificant, indicating no difference in the effect between home and away teams, in line with results from Table 3. The effects of the control variables (not shown for brevity) work identically to those shown in Table 3.
As for defensive penalties, empty and close-to-empty stadiums are negatively associated with committing such penalties (i.e., less likely to commit a defensive line penalty when the stadium is empty or close to empty). The dummy variable capturing whether the defensive team is the home team is also negative. The interaction between the defense at home dummy and empty indicators is positive, though this loses significance at the interaction with <20%. Nevertheless, the interactions largely conform with the findings from Table 3.
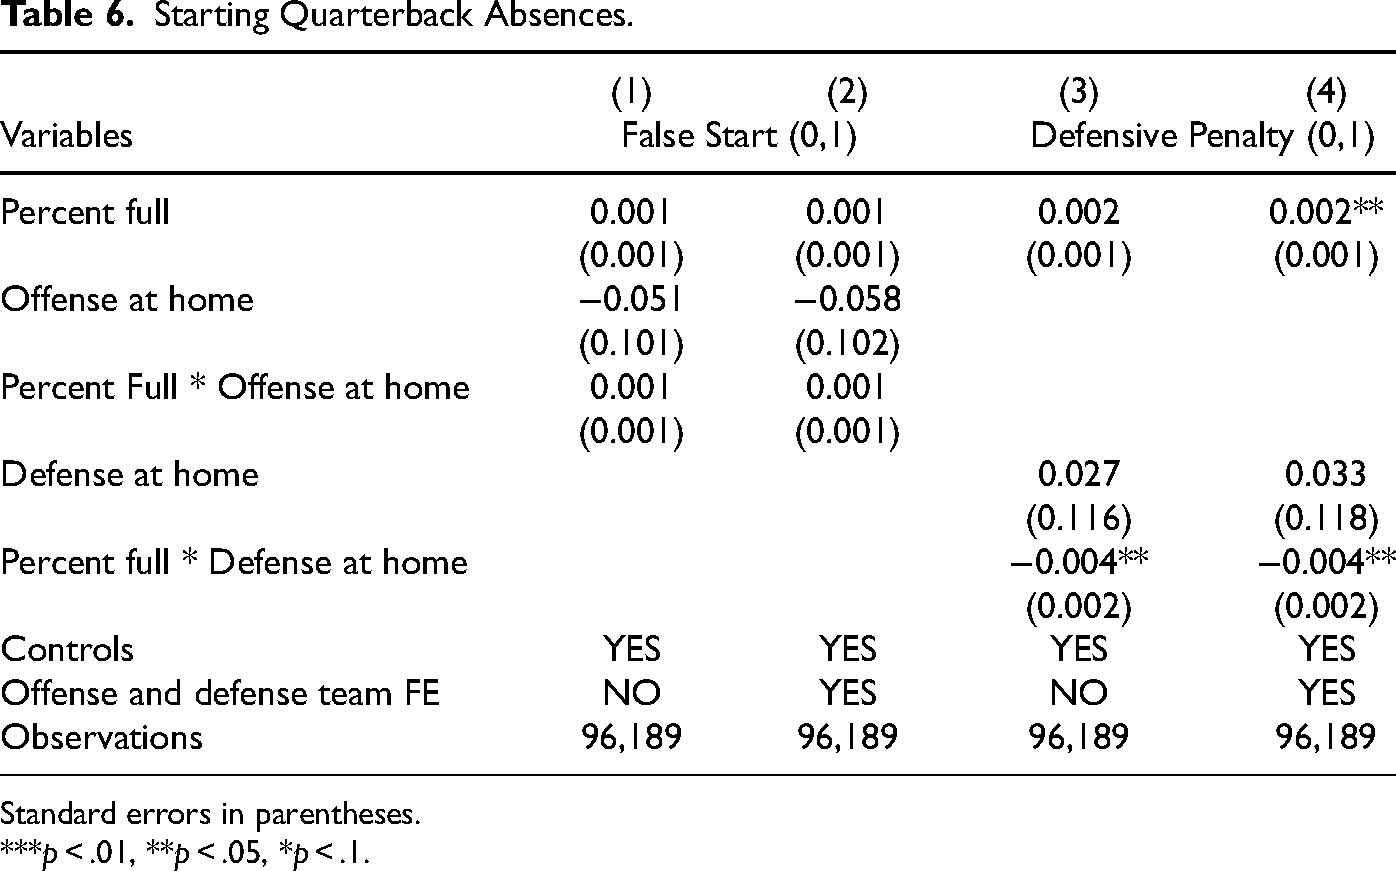
With regards to the mechanism at play, throughout we have argued that the most plausible explanation is the lack of crowd noise, allowing the Quarterback to more effectively deploy their cadence to fool defenses, particularly away defenses. But of course, this is not the only possible explanation. Alternative within game mechanisms could include less pressure from the crowd on referees to award such penalties (although as argued already, this is unlikely due to the nondiscretionary nature of these penalties). A more likely alternative explanation is that there is another channel through which COVID-19 restrictions impacted the NFL beyond just the lack of crowds. One such factor would be changed to training regimes and team practice sessions. Moreover, it could also be the case that areas with tighter COVID-19 restrictions (and resulting attendances) are correlated to incidences of players missing games through isolation. If a team is required to start a backup Quarterback for example, the rest of the team may not be as familiar with their cadence, or they may be not as effective as the starter in deploying their cadence to fool defenses. If so, this may affect the likelihood of committing penalties.
This is a possibility that we test. Using the information on Quarterback absences (via the injury tracker on Pro Football Reference), we identify offenses whose starting Quarterback was absent, and re-run the models with these observations excluded. 8 Results shown in Table 6, however, reveal that this explanation is unlikely to be a driver of our results, with the interaction of Percent full * Defense at home maintaining its significance, and even strengthening somewhat in magnitude. Again, for brevity, the full set of controls is not shown, but they behave very similarly to those in Tables 3 and 4.
Starting Quarterback Absences.
Standard errors in parentheses.
***p < .01, **p < .05, *p < .1.
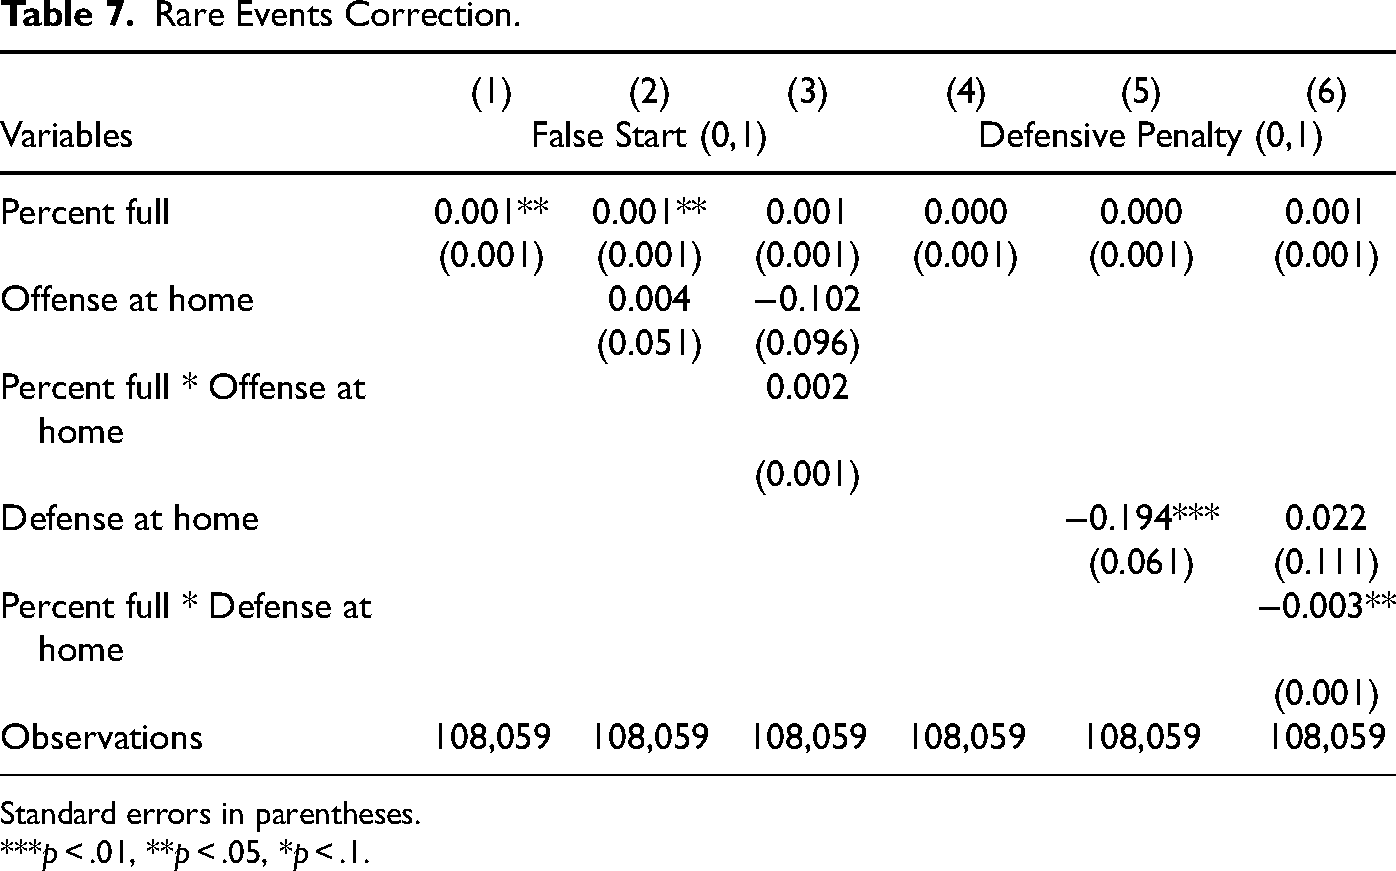
As a final check, we model these penalties using a rare events correction. Specifically, these checks were implemented using the Stata command firthlogit (Convey (2021), based on the model of Firth (1993); a penalized maximum likelihood estimation). Results shown in Table 7 show that specifying the model as such makes no difference to results.
Rare Events Correction.
Standard errors in parentheses.
***p < .01, **p < .05, *p < .1.
Conclusion
This paper has sought to contribute to the recent expansion of literature on home advantage in professional sports. Restrictions due to COVID-19 lockdowns meant that many sports teams played in front of limited or no spectators. However, rather than focusing on final match outcomes, this work focuses on within game outcomes. Specifically, using play-by-play data from the NFL, this paper examines the extent to which nondiscretionary penalty calls are affected by crowd absences. The advantage of using these specific penalty calls is a far cleaner assessment of player responses to crowd pressure, rather than conflating this with refereeing decisions. Put simply, the paper asks whether a Quarterback's ability to fool opposing defenses is affected by (noisy) spectators, and also whether communication with his own offense is invertedly affected.
There is some evidence to support this claim. While pre-snap offensive penalties (false starts) were not affected by crowds, pre-snap defensive penalties called against the home team are lower with the presence of spectators (alternatively they are higher in games with no crowds). The most likely mechanism (following the attempts to rule out other potential mechanisms) is that a quiet, empty stadium allows the away team's Quarterback to more effectively use their cadence to trick home defenses into pre-snap penalties. If NFL teams want to learn anything from this, it is that encouraging crowd noise is somewhat effective. More broadly, the empirical results speak to two theoretical strands of literature. The first is that crowd presence and social pressure do impact outcomes and that agents can be deceived by cheap talk. These findings would appear to sit well with broader evidence from outside sports.
Footnotes
Acknowledgments
The author would like to thank participants at the 8th Annual Sports Economics Workshop at University College Cork, as well as helpful comments from Vincent O'Sullivan and David Butler.
Declaration of Conflicting Interests
The author(s) declared no potential conflicts of interest with respect to the research, authorship, and/or publication of this article.
Funding
The author(s) received no financial support for the research, authorship, and/or publication of this article.