
Abstract
Seeding in tournaments is a process of creating a schedule based on performance in the recent past. It is used in many athletic disciplines to ensure that particularly attractive match ups do not occur until the later stages of the tournament. We exploit the discontinuous nature of the seeding system in the UEFA Champions League and the UEFA Europa League as a natural experiment to estimate the causal effect of being seeded. We find no evidence that seeding itself contributes positively to the team’s success in the tournament. This finding is surprising given the substantial drop in average strength of the opponents for seeded teams and in striking opposition to the findings of previous studies.
Introduction
Seeding in tournaments is a process of creating a schedule based on performance in the recent past. It is used in many athletic disciplines to ensure that particularly attractive match-ups do not occur until the later stages of the tournament, while simultaneously ensuring that higher ranked teams do not get penalized by being given a more difficult schedule than a lower ranked competitor (Schwenk, 2000).
Creating a fair seeding process that satisfies these axioms is challenging and occasionally fails. Notably, in the seasons 2015/16, 2016/17 and 2017/18, some competitors could have improved their odds to qualify for the UEFA Champions League by intentionally losing against the current title holder (Csató, 2019a). A well studied example from a different discipline is the NCAA’s men’s basketball tournament, where the tournament structure favors teams ranked
Another concern is that seeding teams according to their historic performance artificially strengthens the position of historically strong teams by shielding them from competition in early stages and therefore raises the barrier for upcoming competitors. In European club football, this concern should receive special attention since the 2018/2019 reform of the UEFA Champions League has already restricted access to the lucrative stages for national champions (Csató, 2019b). Any factor that affects team performance can have lasting consequences in this setting, because the seeding procedure is based on performance over the preceding five years. While, undoubtedly, there are many other factors contributing to persistence in success, in particular monetary rewards, this paper aims to answer whether seeding in itself exacerbates these patterns.
Previous research based on simulation exercises has largely confirmed that seeding increases the predictability of outcomes in tournaments. In particular, Schokkaert and Swinnen (2016) find evidence that the introduction of seeded group stages has increased the predictability of outcomes in the early rounds of the UEFA Champions League. In a similar vein, Scarf et al. (1980) confirm that seeding increases the correlation between team rank at tournament entry and exit. Dagaev and Rudyak (2019) and Corona et al. (2019) find qualitatively similar results when evaluating the 2015/2016 seeding reform, which reserved the first pot in the UEFA Champions League for the title holder and the champions of the top-7 nations, instead of seeding exclusively based on the team coefficient. 1 Their simulations indicate that the tournaments prior to the reform were characterized by higher average coefficients for the finalists, as well as more balanced match-ups in the final. Corona et al. (2019) conclude that the reform particularly favored national champions with low coefficients, such as the 2015 Dutch champion PSV Eindhoven, by placing them in pot 1 rather than pot 3, thus shielding them from facing an additional highly ranked competitor like FC Barcelona or Bayern Munich. It should be noted that the 2015/2016 reform induced perverse incentives for national competitions by awarding the eighth position in the first pot to a lower ranked league if the title holder of the Champions League and the national competition coincide (Csató, 2020). This can potentially lead to a situation where a team (in the national league) could manipulate its pot allocation by intentionally losing to a national title contender that did not win the CL. If this behavior was widespread, it would complicate our analysis since weaker teams would be allocated to higher pots. To our knowledge, this has not occurred so far.
A small number of articles has also investigated the effects of seeding procedures on tournament performance based on samples of real-world tournaments. Aside from the above mentioned NCAA basketball tournament, Monks and Husch (2009) study the seven FIFA World Cups held between 1982 and 2006. They find a strong positive association between being seeded and the performance in the tournament. There are, however, two main concerns that make this issue worth revisiting: first, the focus on World Cup data implies that sample sizes are relatively small, since the event only occurs once every 4 years. Second, there is a difficulty in disentangling the effect of the seeding procedure from the fact that teams with higher seeds have had better performances in the past or constitute the host country. If a linear control for relative rank does not fully capture strength differences between teams, any estimate of being seeded will be biased due to the correlation with unobserved determinants of team performance. Our empirical strategy isolates the effect of the seeding procedure to analyze if the tournament design contributes to persistence in performance in the context of European club football.
In order to address the challenge to identification, we build on the specific design of the seeding procedure in the UEFA Cup, the UEFA Europa League 2 and UEFA Champions League to implement a regression discontinuity design that allows us to cleanly identify the causal effect of being seeded in a marginally better position on tournament performance.
In European club football, teams are seeded based on a 5-year coefficient, calculated as a weighted sum of the team’s past performance and the performance of other teams from the same country of origin. To draw the groups for the group stage, teams are ranked on the basis of their coefficient and allocated to pots from which groups are drawn. A group is formed by drawing one team from each pot, with some restrictions based on country of origin. The teams in each group compete in a double round-robin format and the best two or three teams advance to the next round, usually the knockout phase of the tournament. Since the pots are formed based on a continuous measure of past performance, the strength of the median team in a pot increases with the rank of the pot. At the same time, each pot contains only a fixed number of teams, resulting in a set of sharp cutoffs determining whether a team is allocated to the higher or lower pot.
Our approach exploits the fact that teams close to the cutoff are allocated to pots in a quasi-random fashion and should therefore be comparable in terms of strength. 3 Being in the higher pot reduces the average strength of one of the opponents because one of them is drawn from the pot below instead of the pot above. We thus identify the causal effect of being marginally allocated to a higher pot on the probability of advancing past the group stage.
Surprisingly, we find no positive effect on the probability of advancing to the next round, suggesting that the seeding system has not systematically increased the degree of persistence in European club football for marginally seeded teams. In fact, while the exact magnitudes of the estimated coefficients vary with the choice of bandwidth, most specifications yield negative point estimates. Taken at face value, this would suggest that, on average, teams that faced nominally stronger opponents performed better. While this result is counter-intuitive and warrants further investigation, the magnitudes and significance of the coefficients are strongly dependent on the choice of bandwidth. Therefore, we caution against attaching too much weight to the negative coefficients.
The paper is organized as follows: In Section 2 we introduce the data and the institutional setting of our analysis, while in Section 3 we outline our empirical strategy. In Section 4 we present our main results, as well as a set of robustness checks and heterogeneity analyses. In Section 5 we conclude.
Data
We collected data on match results, UEFA 5 year coefficients and pot allocations for the 1999/2000–2019/2020 Champions League seasons 4 and the 2004/2005–2019/2020 Europa League seasons. 5 Earlier seasons of the Europa League did not have a group stage but instead started with the knockout phase immediately. Moreover, we collect data on club Elo ratings as a measure of team strength. 6
Our main outcome of interest is whether a team advanced from the group stage to the knock-out stage of the competition. For the main analysis, we define advancing as advancing within the same competition, thus counting teams that came third in a group of the Champions League and continued playing in the knock-out stage of the Europa League as not having advanced. In the robustness section, we show that the main results are similar for alternative definitions of the outcome variable.
Figure 1 shows the relationship between the 5-year coefficient and the probability of advancing in a binned scatterplot that pools across both the Europa League and the Champions League. 7 Two main patterns arise from this graph. First, as implied by the seeding procedure, the average 5-year coefficient increases monotonically moving from pot 4 to pot 1. Second, and more interestingly, there is a strong positive correlation between the probability of advancing and the 5-year coefficient, suggesting that there is a high degree of persistence in the tournament performance. These patterns are also visible in Figure 2, which shows that the rank of each team in that year’s draw (based on its coefficient) strongly correlates with the probability of advancing. This pattern holds for both the Champions League and Europa League, and for every pot, which are depicted by different icons in the figure. Teams in pot 1 have a higher probability to advance than teams with lower ranks, which indicates that teams with a stronger past performance also perform better in the current tournament.
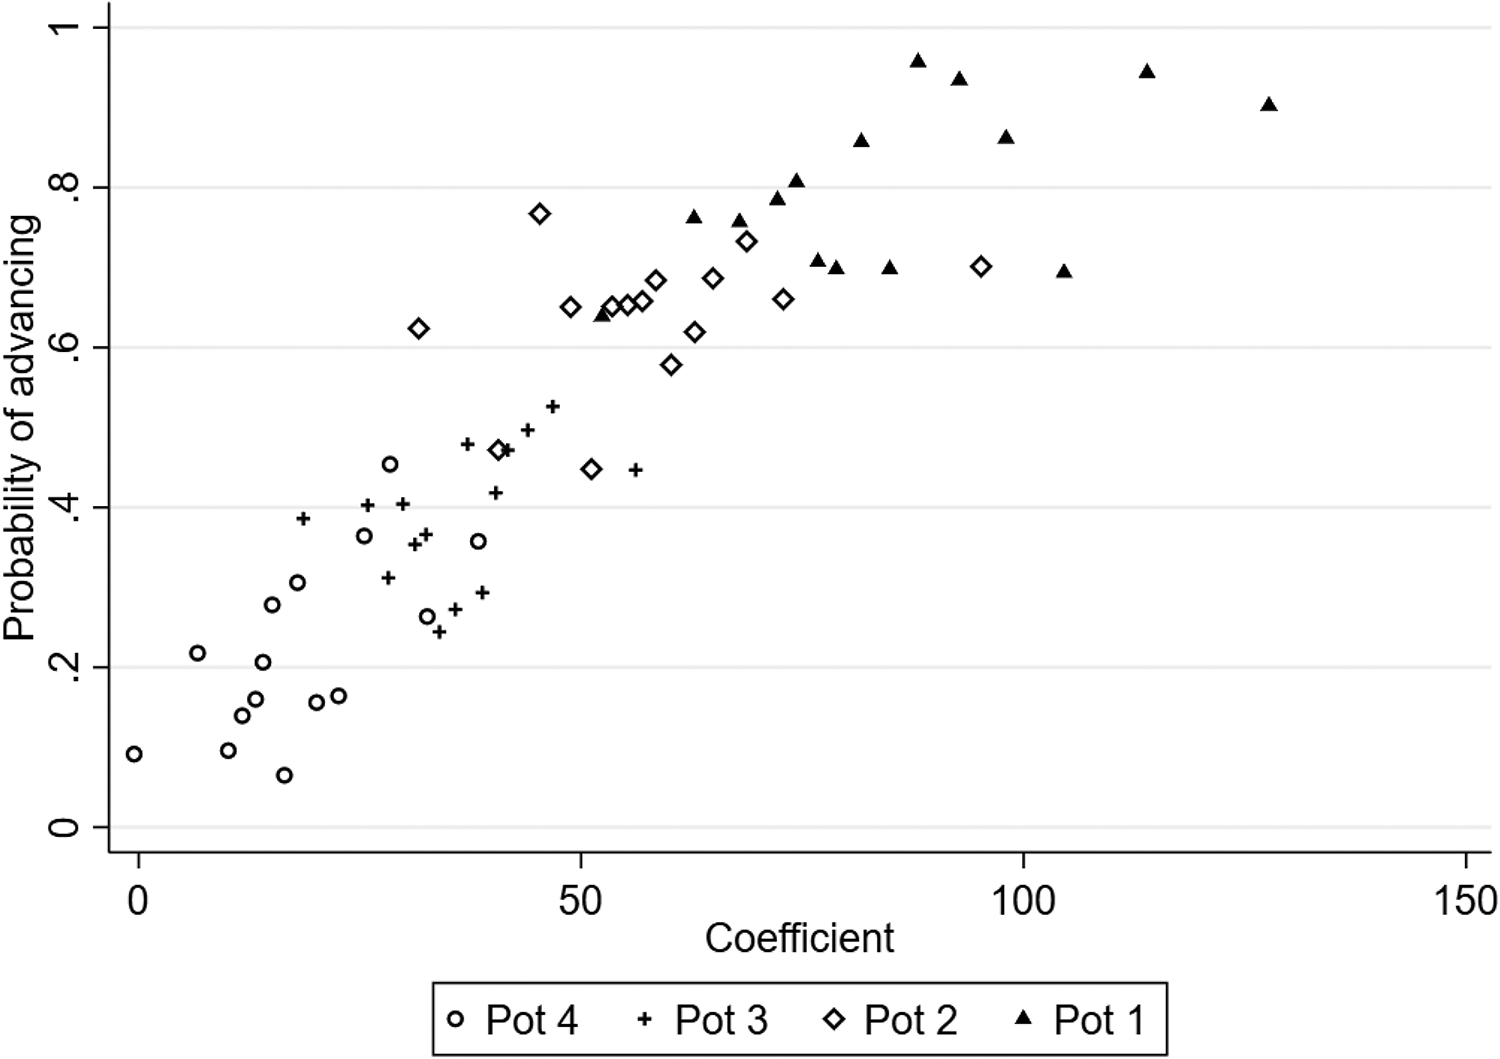
Binned scatterplot of the probability of advancing on 5-year coefficient. The graph plots the probability of advancing against the 5-year coefficient used for seeding. For each pot, 15 bins are created across which both variables are averaged. In order to ensure comparability, both variables are residualized on a league dummy. The graph excludes pot 1 of the Champions League after 2015 and we exclude pot 5 from this graph since our dataset only includes five season-league pairs in which there were 5 pots.
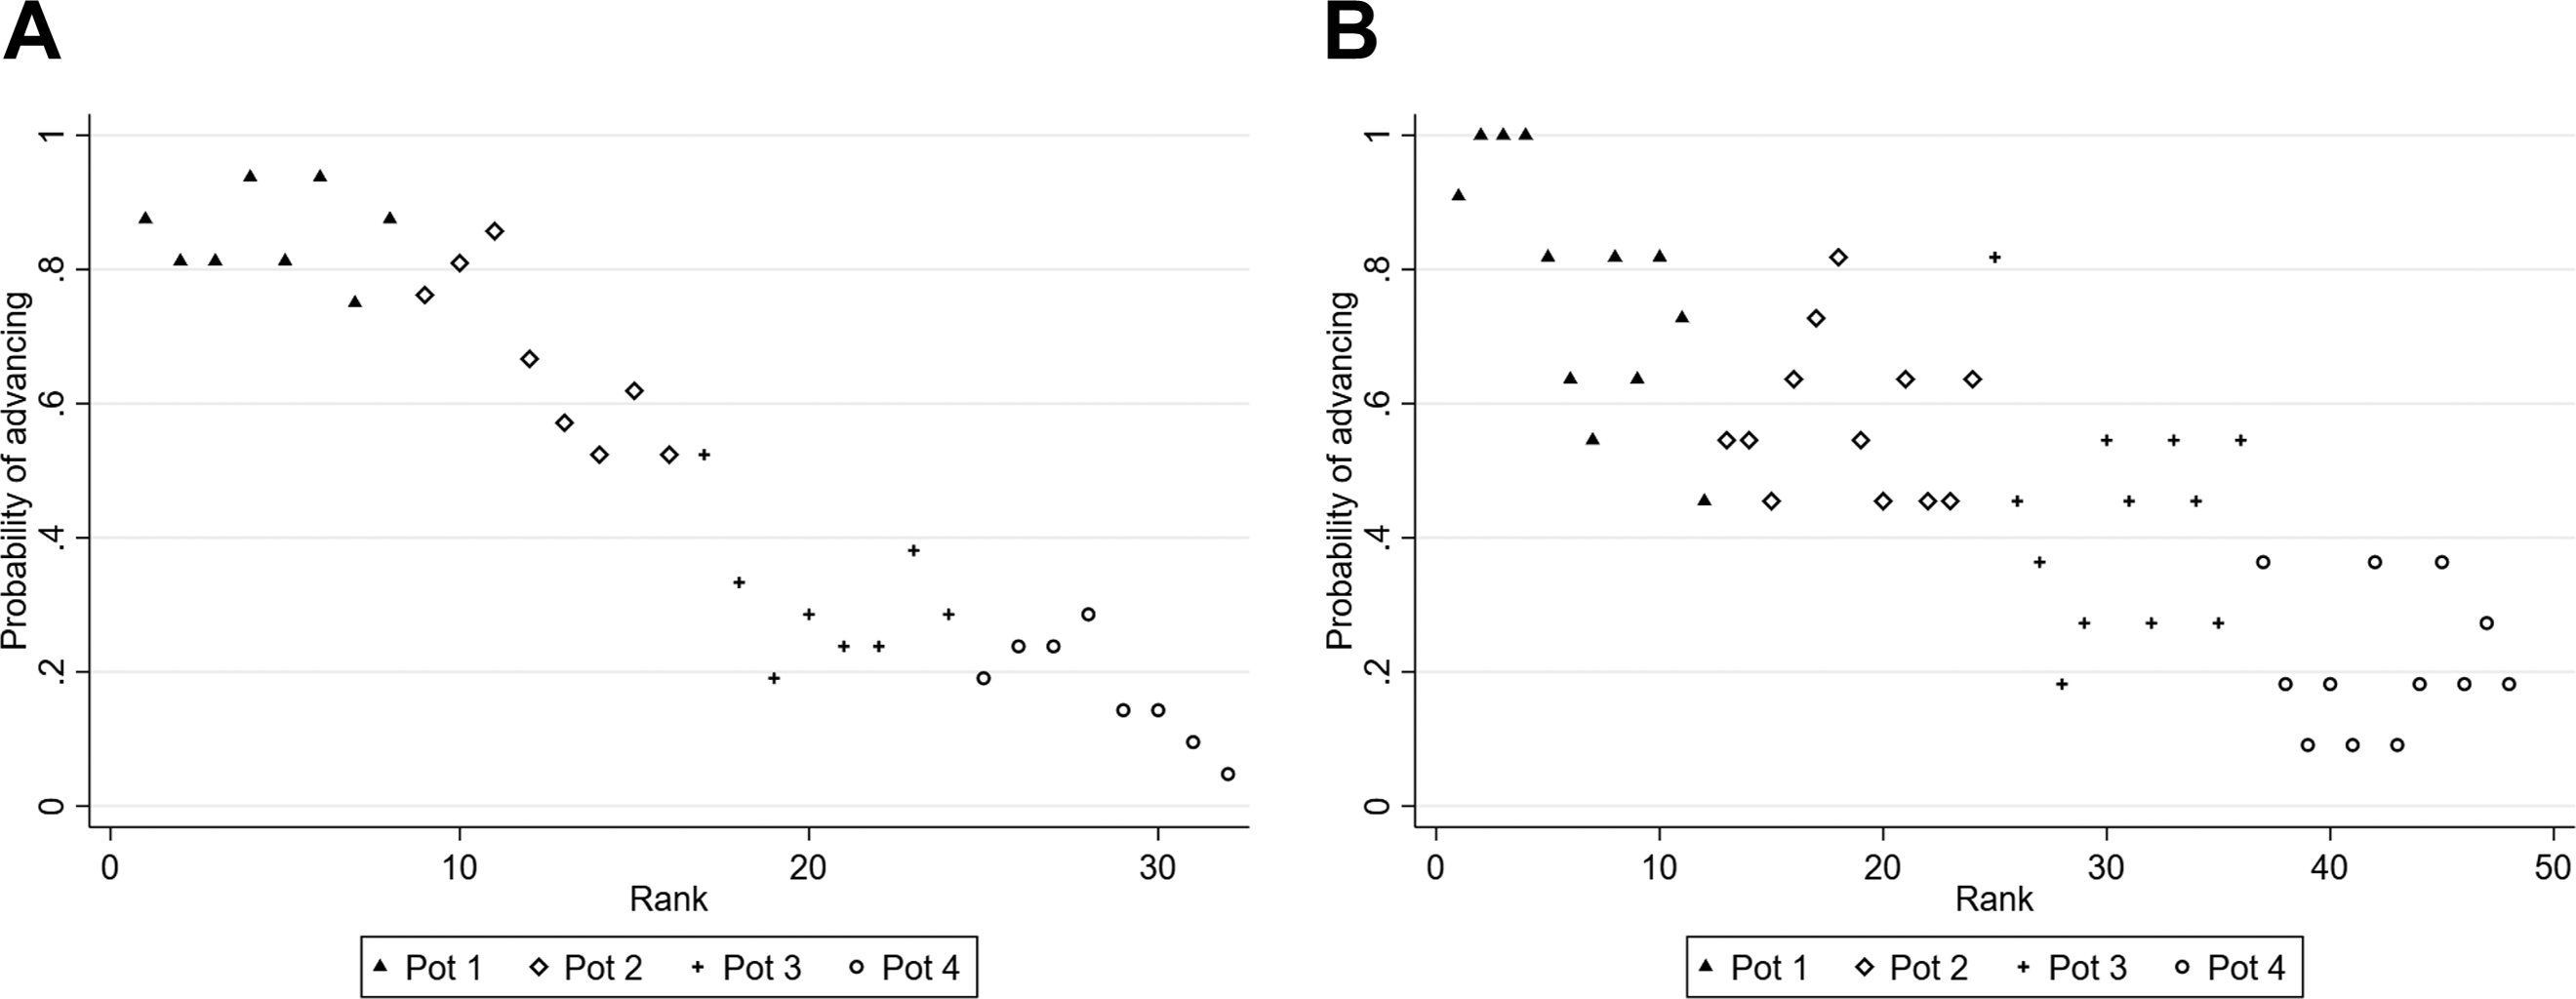
Probability of advancing by seeding rank. (a) Champions League. (b) Europa League.The two panels present the average probability of advancing by seeding rank for the Champions League and Europa League respectively. We exclude the UEFA Cup from this graph since it featured a different number of pots and we only have access to five seasons, resulting in a large degree of noise in the data. As in Figure 1, the graph excludes pot 1 of the Champions League after 2015.
While Figure 1 clearly shows that there are large average differences in 5-year coefficients across teams in different bins, it masks important heterogeneity between the Europa League and Champions League. Table 1 presents the median 5-year coefficient by pot in the Europa League as well as the Champions League. A number of patterns arise: first, as a mechanical result of the seeding rule, there is a monotonic relationship between pots and median coefficients. Second, the median coefficient is considerably lower for all pots in the Europa League than in the Champions League, which is a result of the fact that the top-performing teams in the national competitions get the chance to compete in the Champions League, while lower ranked teams compete in the Europa League.
Median 5-year Coefficient by Pot and Competition.
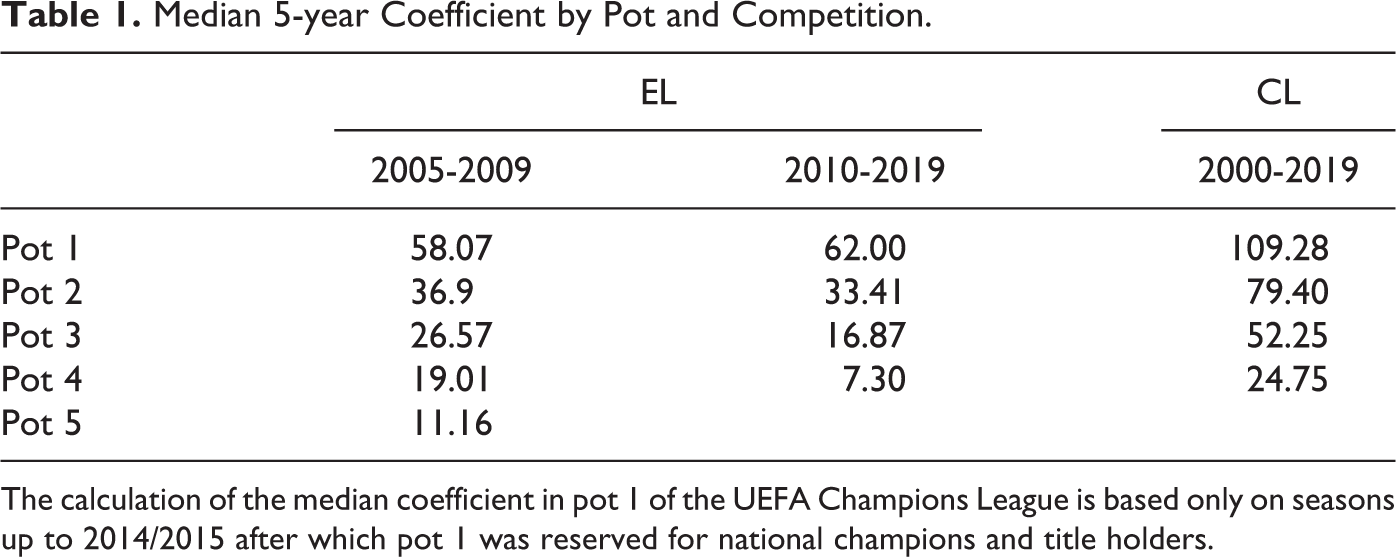
The calculation of the median coefficient in pot 1 of the UEFA Champions League is based only on seasons up to 2014/2015 after which pot 1 was reserved for national champions and title holders.
We define the cutoff as the mean between the highest ranked team in a pot and the lowest ranked team in the next pot above for each season and contest. For each team, we then calculate the distance to the nearest relevant cutoff. 8 In a narrow bandwidth around the cutoff the pot allocation is as good as random, allowing us to estimate the causal effect of the pot allocation on the tournament outcome in a regression-discontinuity design.
In our main regressions, we use bandwidths of 3 and 1 points around the relevant cutoff. Table 2 presents summary statistics for both of these sub-samples as well as the full sample we draw on, in order to illuminate the degree to which these sub-samples are representative of the universe of teams performing in the Champions League and Europa League. The main pattern that arises is that the estimation samples stem predominantly from the Europa League and feature a disproportionate number of teams from the third pot of a given competition. Moreover, teams included in the estimation sample tend to have lower average 5-year coefficients and club Elo ratings than the average team competing in the Europa League and Champions League. This selection is mainly driven by the fact that coefficients are higher on average and more dispersed in the Champions League, leading to fewer observations close to the cutoff. On top of that, almost mechanically, our sample selection eliminates the highest-seeded teams since these are never close to a cutoff, thus leading to a reduction in the average strength of teams included in our estimation samples.
Summary Statistics.
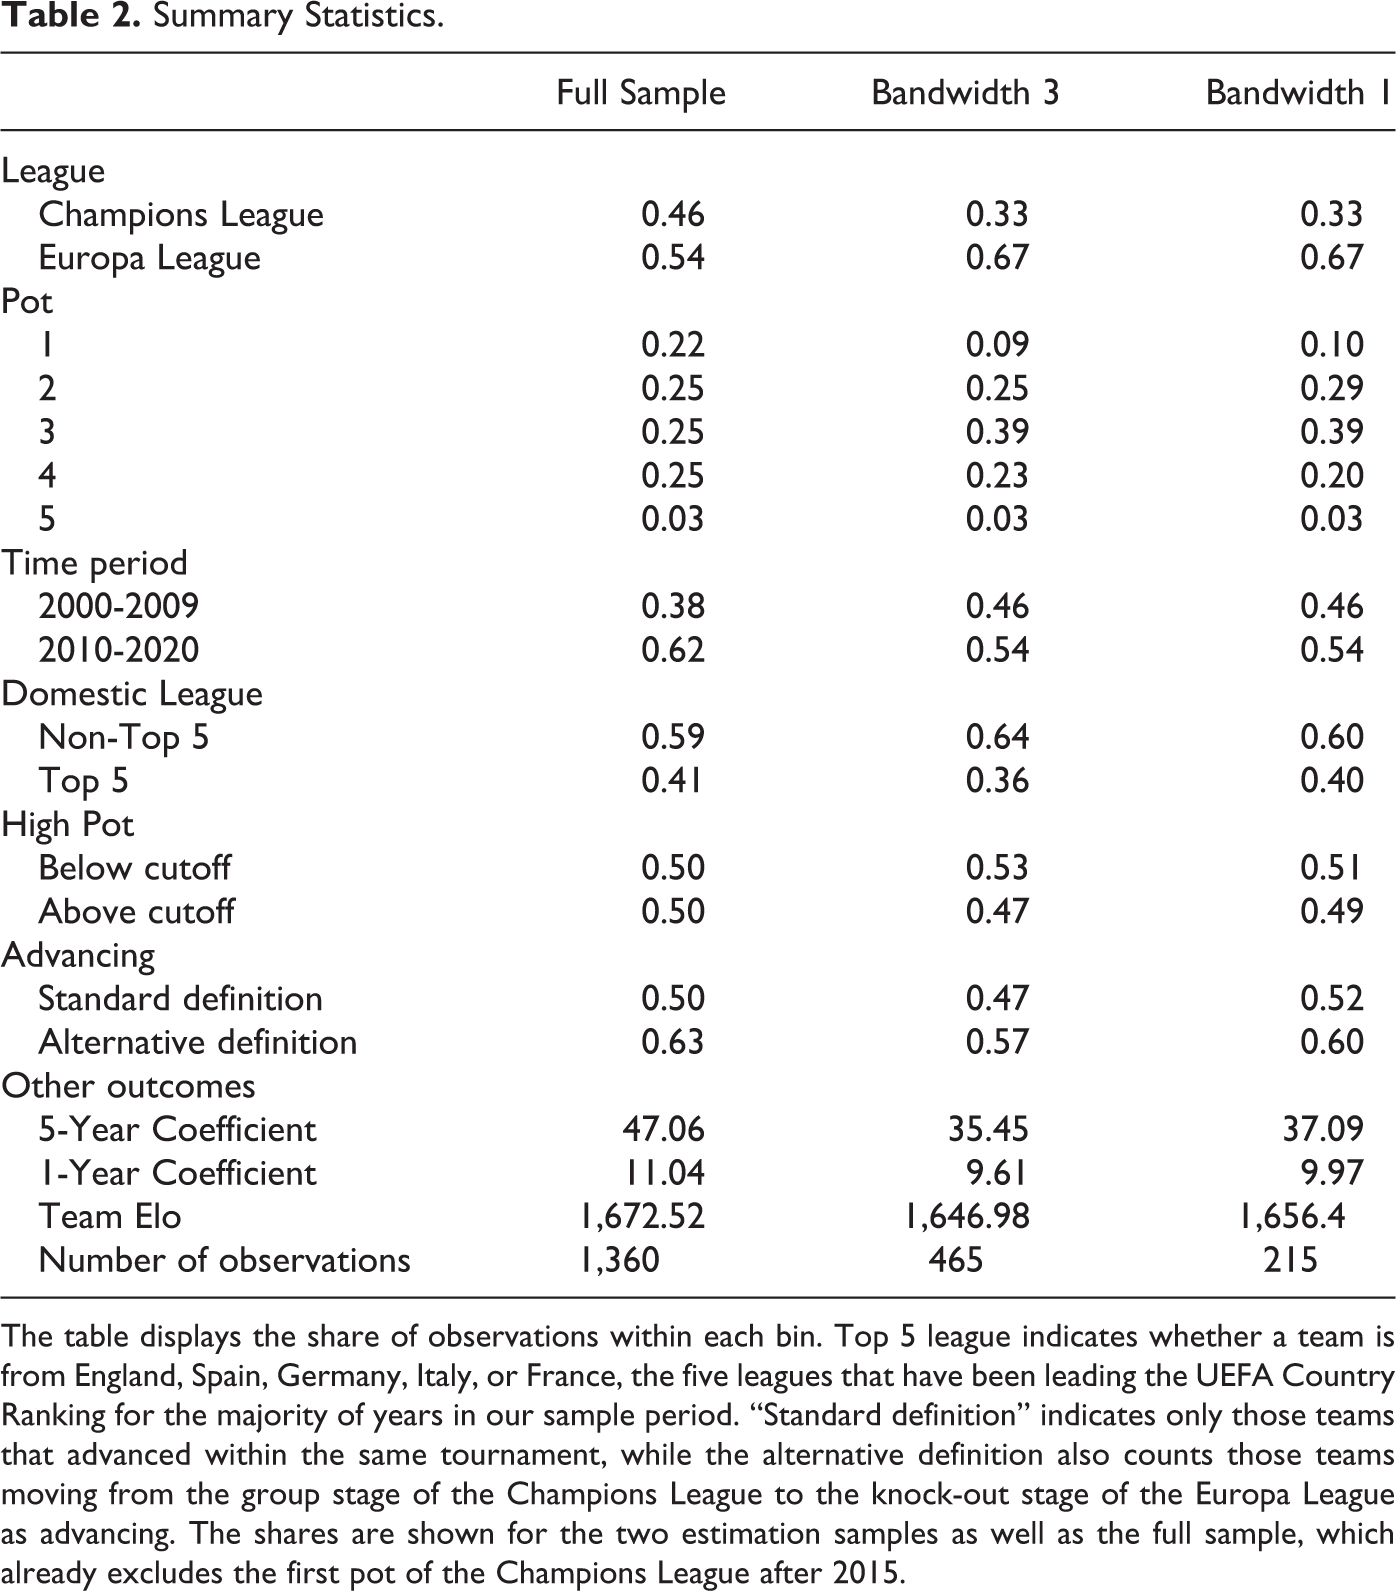
The table displays the share of observations within each bin. Top 5 league indicates whether a team is from England, Spain, Germany, Italy, or France, the five leagues that have been leading the UEFA Country Ranking for the majority of years in our sample period. “Standard definition” indicates only those teams that advanced within the same tournament, while the alternative definition also counts those teams moving from the group stage of the Champions League to the knock-out stage of the Europa League as advancing. The shares are shown for the two estimation samples as well as the full sample, which already excludes the first pot of the Champions League after 2015.
These statistics provide useful insights into how broadly our results should be interpreted: the regression discontinuity design identifies the effect of interest at the discontinuity and hence is informative about a team that is marginally seeded, but the conclusions we can draw about the effect of seeding on a team far from the discontinuity are limited.
Empirical Strategy
Our main regression specification is the following:

where
We first evaluate the relevance of the regression discontinuity design by estimating the consequences of being allocated to a higher pot in terms of opponent strength. We then proceed to the main analysis, which uses an indicator for advancing to the next round as the outcome variable. We consider a binary outcome variable to be the most relevant for a number of reasons. First, since we pool data from two different competitions and across several years, continuous measures such as the yearly coefficient are not straightforward to interpret. Second, we expect the effect of seeding to be strongest during the group stage, whereas effects on later rounds should be more muted. Finally, using a linear probability model, the estimated coefficients can straightforwardly be interpreted as the change in the probability of advancing to the next round. To check the validity of our approach, we also investigate the behavior of team strength around the cutoff using both a measure of performance in the previous year’s competition and the club’s Elo rating at the start of the season.
Results
Figure 3 displays the results from a first-stage regression of the average coefficient of all other teams in the same group on a linear control for distance on both sides of the cutoff. 9 It can be seen that there is a clear drop in the average 5-year coefficient of around 5 points at the cutoff, suggesting that teams slightly above the cutoff indeed face opponents that are historically weaker on average. Due to the design of the seeding system, this drop is driven by a single team that is drawn from the pot below rather than the pot above, thus implying a quite substantial difference in the strength of one of the opponents faced during the group stage. This provides some evidence that from a purely mechanical point of view, the seeding procedure has been successful. In the remainder of this section, we investigate whether this change in opponent strength translates into changes in tournament performance for the marginally seeded team.
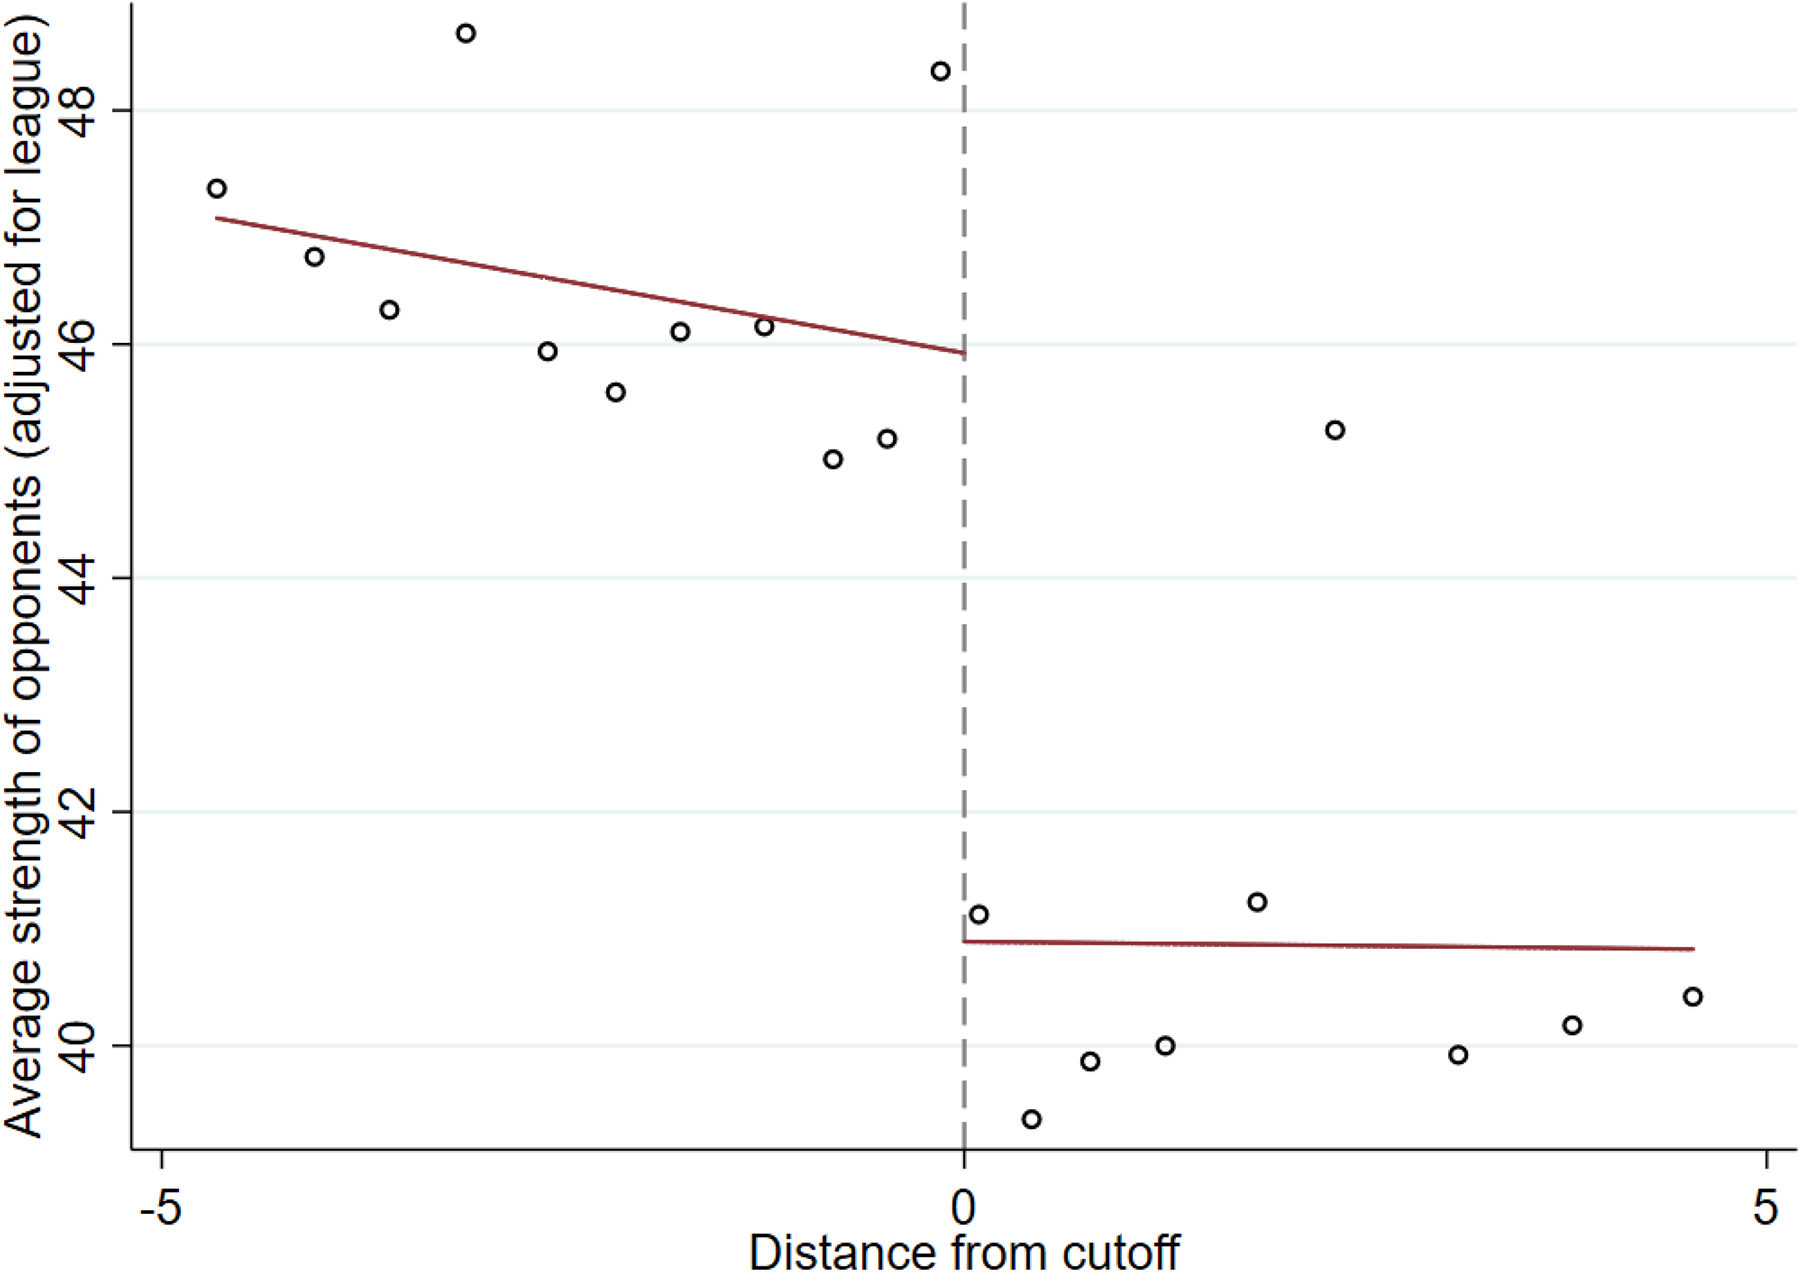
Effect of seeding on average 5-year coefficient of opponents. The graph plots the average 5-year coefficient of all other teams in the group against the distance from cutoff. Teams above the cutoff are placed in a higher-ranked pot while those below the cutoff are placed in the lower-ranked pot. The distance from cutoff is generated by subtracting the value of the closest cutoff from the 5-year coefficient, with every team only being matched to the closest cutoff. Two separate linear regressions are fit on both sides of the cutoff. Outcomes are residualized on a league dummy to enable pooling of observations across Champions League and Europa League.
Table 3 shows the results from our main regression specification for three different sets of control variables using bandwidths of 1 and 3, respectively. While the estimated coefficient on being marginally allocated to the higher pot on the probability of advancing is very close to zero with a bandwidth of 3 and no controls aside from the linear running variable, the point estimate turns negative when controls are added to the model or a smaller bandwidth of 1 is considered. The estimated coefficient reaches considerable magnitudes in columns 4 and 5, suggesting an almost 25 percentage point reduction in the probability of advancing for marginally seeded as compared to unseeded teams. However, column 6 shows that this effect is sensitive to the choice of control for the running variable, with the coefficient returning to close to zero when controls for the running variable are removed from the model.
Regression Discontinuity Results.
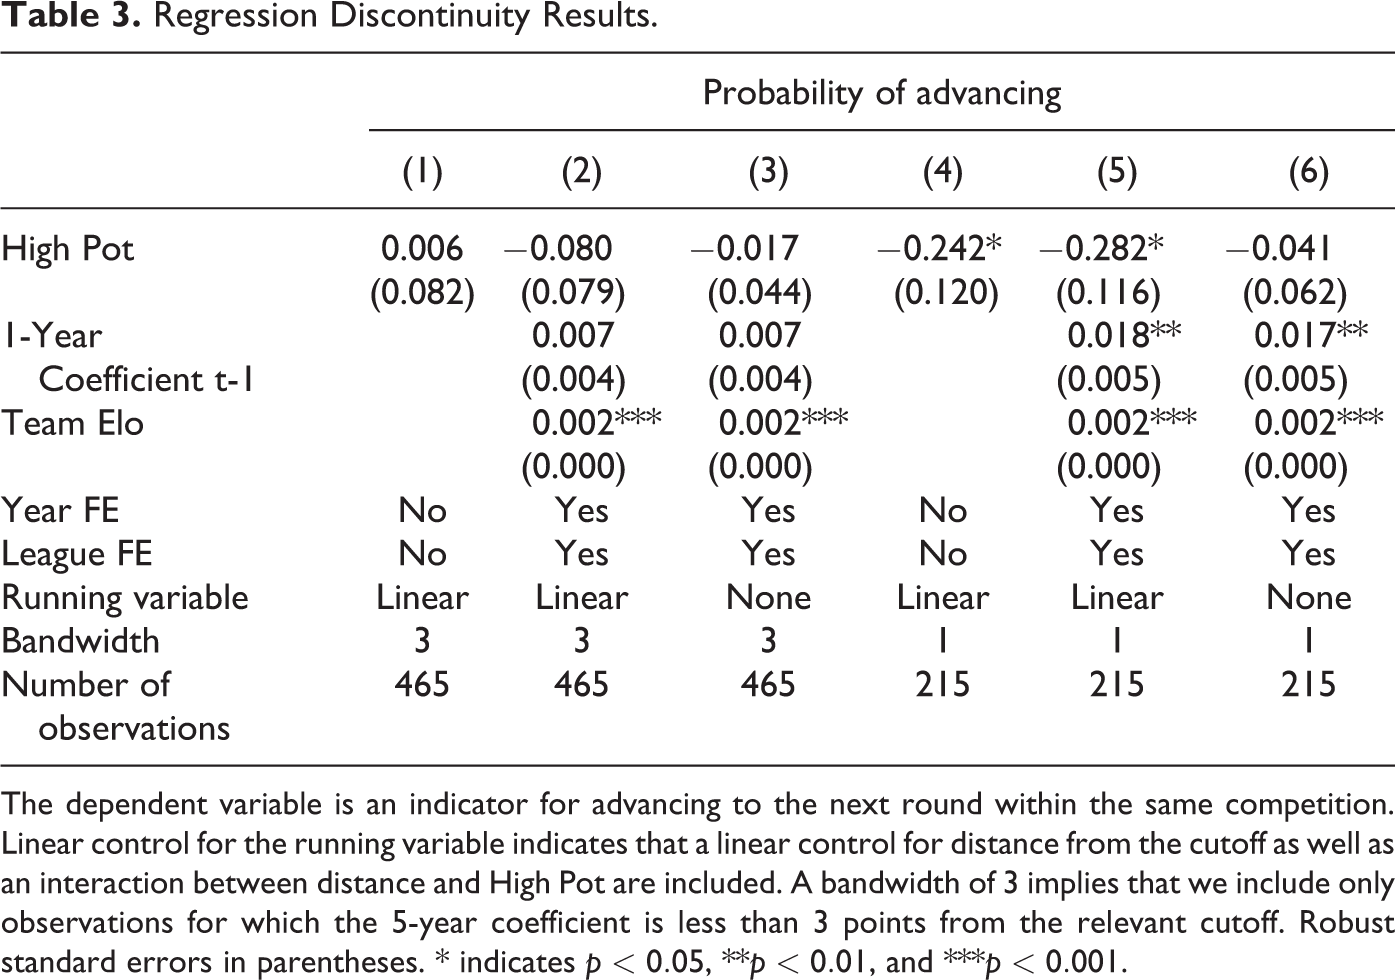
The dependent variable is an indicator for advancing to the next round within the same competition. Linear control for the running variable indicates that a linear control for distance from the cutoff as well as an interaction between distance and High Pot are included. A bandwidth of 3 implies that we include only observations for which the 5-year coefficient is less than 3 points from the relevant cutoff. Robust standard errors in parentheses. * indicates
In line with the previous discussion of persistence in performance, the results in Table 3 suggest that while the club Elo rating and lagged 1-year coefficient are strong predictors of the probability of advancing, they correlate little with bin placement. Any regression discontinuity design hinges on the assumption that any discontinuous changes at the cutoff are only due to the treatment. While we can rule out any kind of manipulation of the 5-year coefficients due to the fact that the tournament is incentive-compatible and the exact cutoff is determined only after the end of the previous year’s tournament, there might be room for concern that, simply by chance, teams above and below the cutoff could differ in terms of strength. We can never fully rule out such concerns, but we can investigate whether discontinuities arise even in variables that we know cannot have been affected by the cutoff due to being determined at an earlier point in time. Two relevant variables we have at our disposal are the lagged 1-year coefficient, which measures how well teams performed on the international stage in the previous season, and the club Elo at the start of the season. Figure 4 displays the effect of being seeded in a higher pot on these two variables, both of which have been residualized with respect to league to enable us to pool observations across tournaments. The figure suggests that there are no substantial changes around the discontinuity, which lends some credence to our identification strategy since it implies that our results are not driven by systematic changes in team strength at the cutoff.
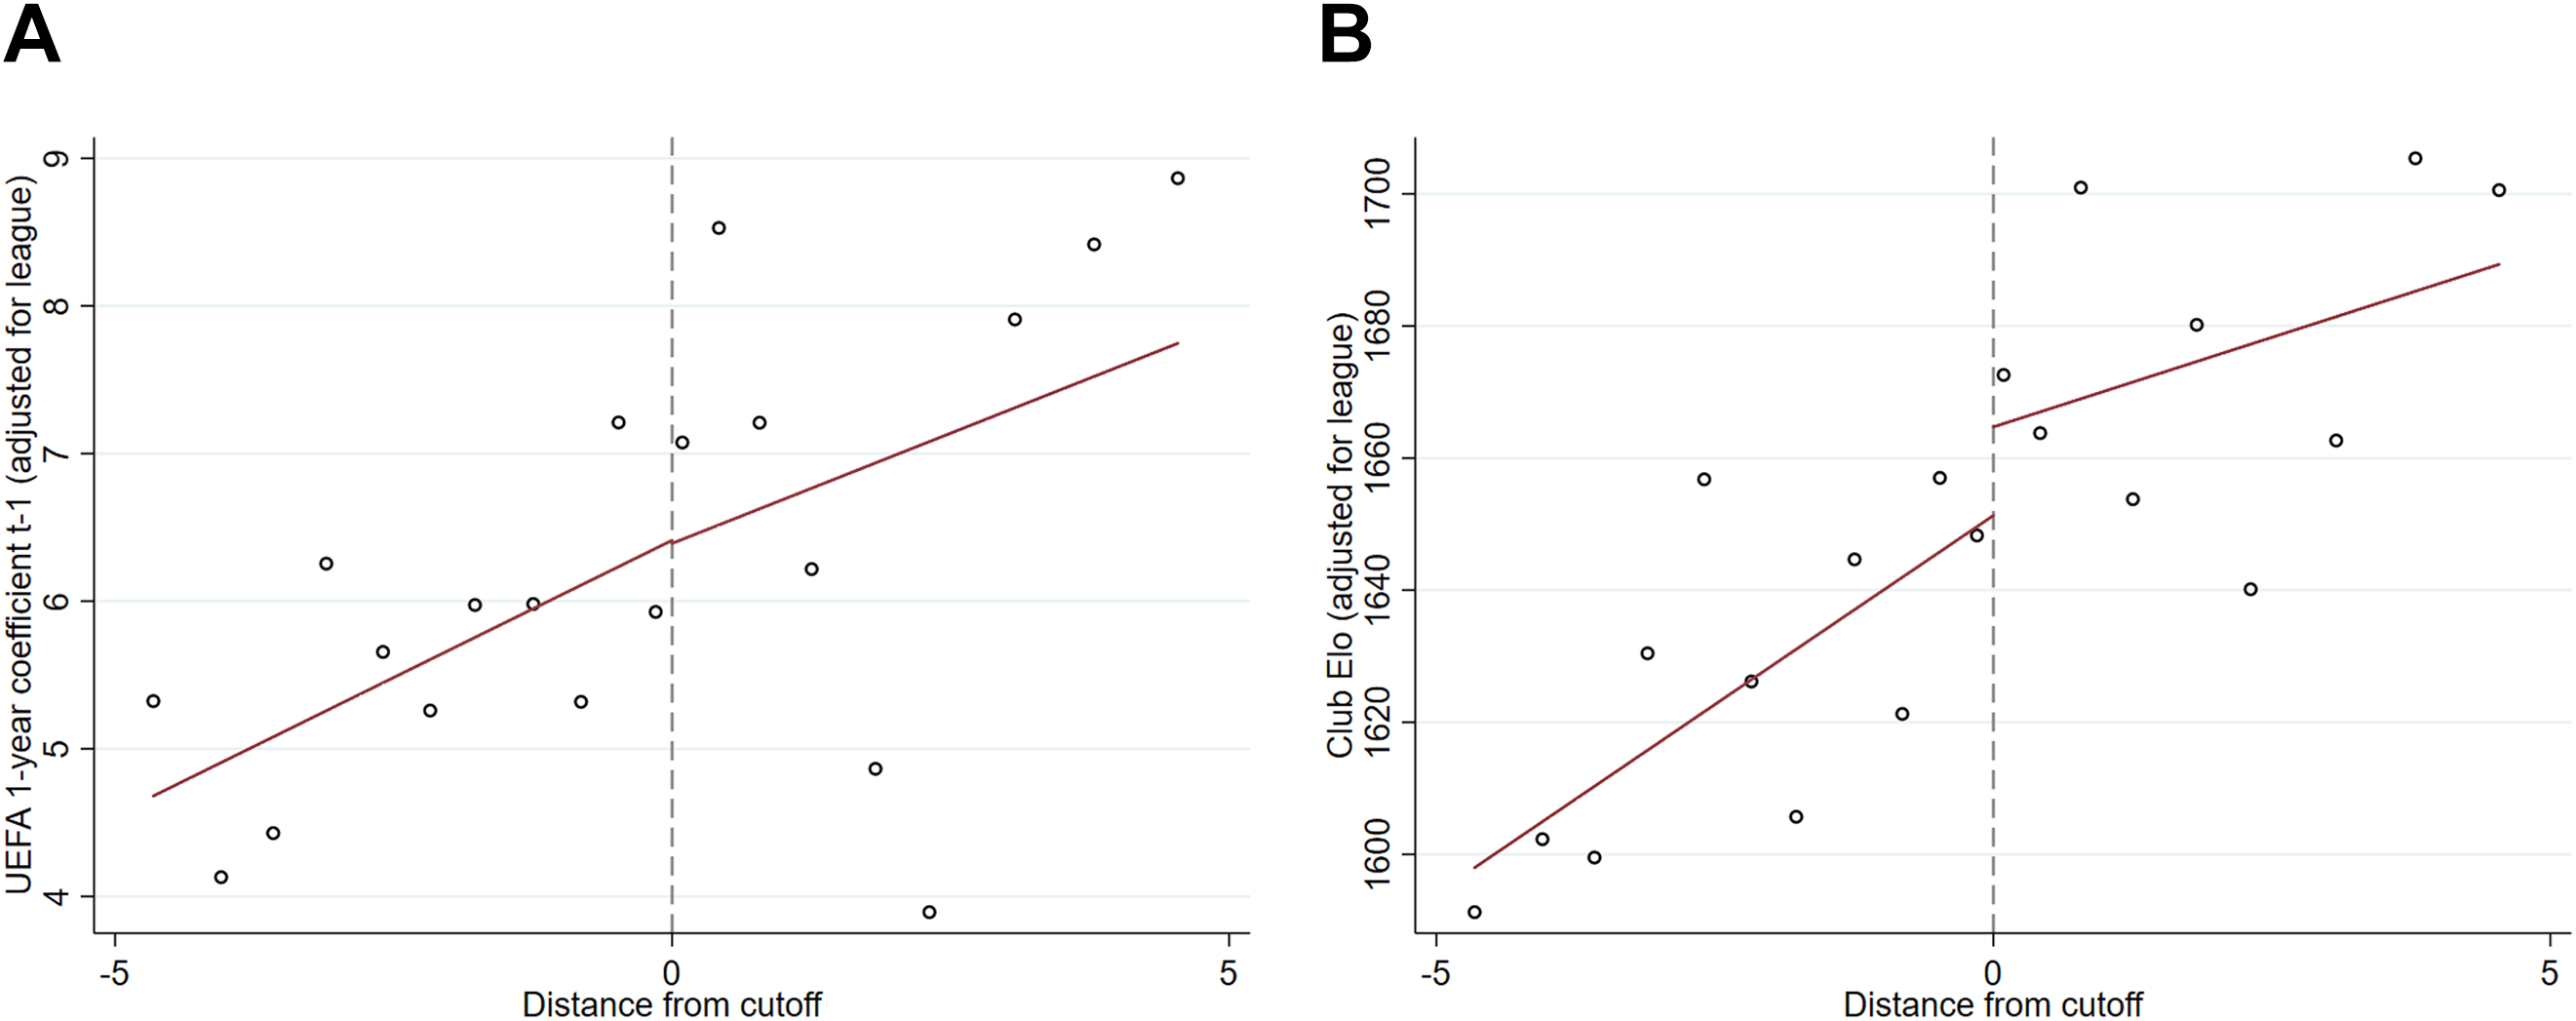
Validity checks. (a) Lagged 1-Year Coefficient. (b) Team Elo. The procedure of creating the graphs is equivalent to Figure 2. Panel a uses the (pre-determined) lagged 1-year coefficient as an outcome, while panel b presents results for the Club Elo rating recorded at the beginning of the season.
Two surprising aspects of our findings thus far should be noted. First, and most strikingly, regardless of their mixed statistical significance, the direction of the point estimates runs counter to our expectations. While, of course, we acknowledge the possibility that this is merely a statistical artifact, the data suggest that in previous years teams that faced nominally weaker opponents fared worse. Second, while the sign of the estimated effects is almost unambiguously negative, the magnitude of the estimates hinges crucially on the choice of bandwidth with narrower bandwidths producing estimates of increasing magnitude. The next section investigates the robustness of our findings before we move on to a detailed heterogeneity analysis to shed light on potential drivers.
Robustness
In order to ensure that our results are not just artifacts of arbitrarily chosen specifications, Figure 5 presents the estimated coefficients from three alternative models for a range of bandwidths between 1 and 7 points on either side of the cutoff. Specifically, panel (a) presents the estimated coefficients from a model with a full set of controls but omitting control variables for the running variable, while panel (b) adds linear controls for the running variable. Finally, panel (c) presents similar results based on a local linear model. The emerging patterns are broadly consistent across specifications: the estimated coefficients are almost exclusively negative and have a tendency to become more negative the smaller the bandwidth, although they tend not to reach statistical significance at conventional levels. 10 Remarkably, and in line with our previous findings, omitting the control for the running variable drastically increases the stability of the estimated coefficients with respect to the choice of bandwidth, yielding estimated coefficients that lie within a narrow band around 0.
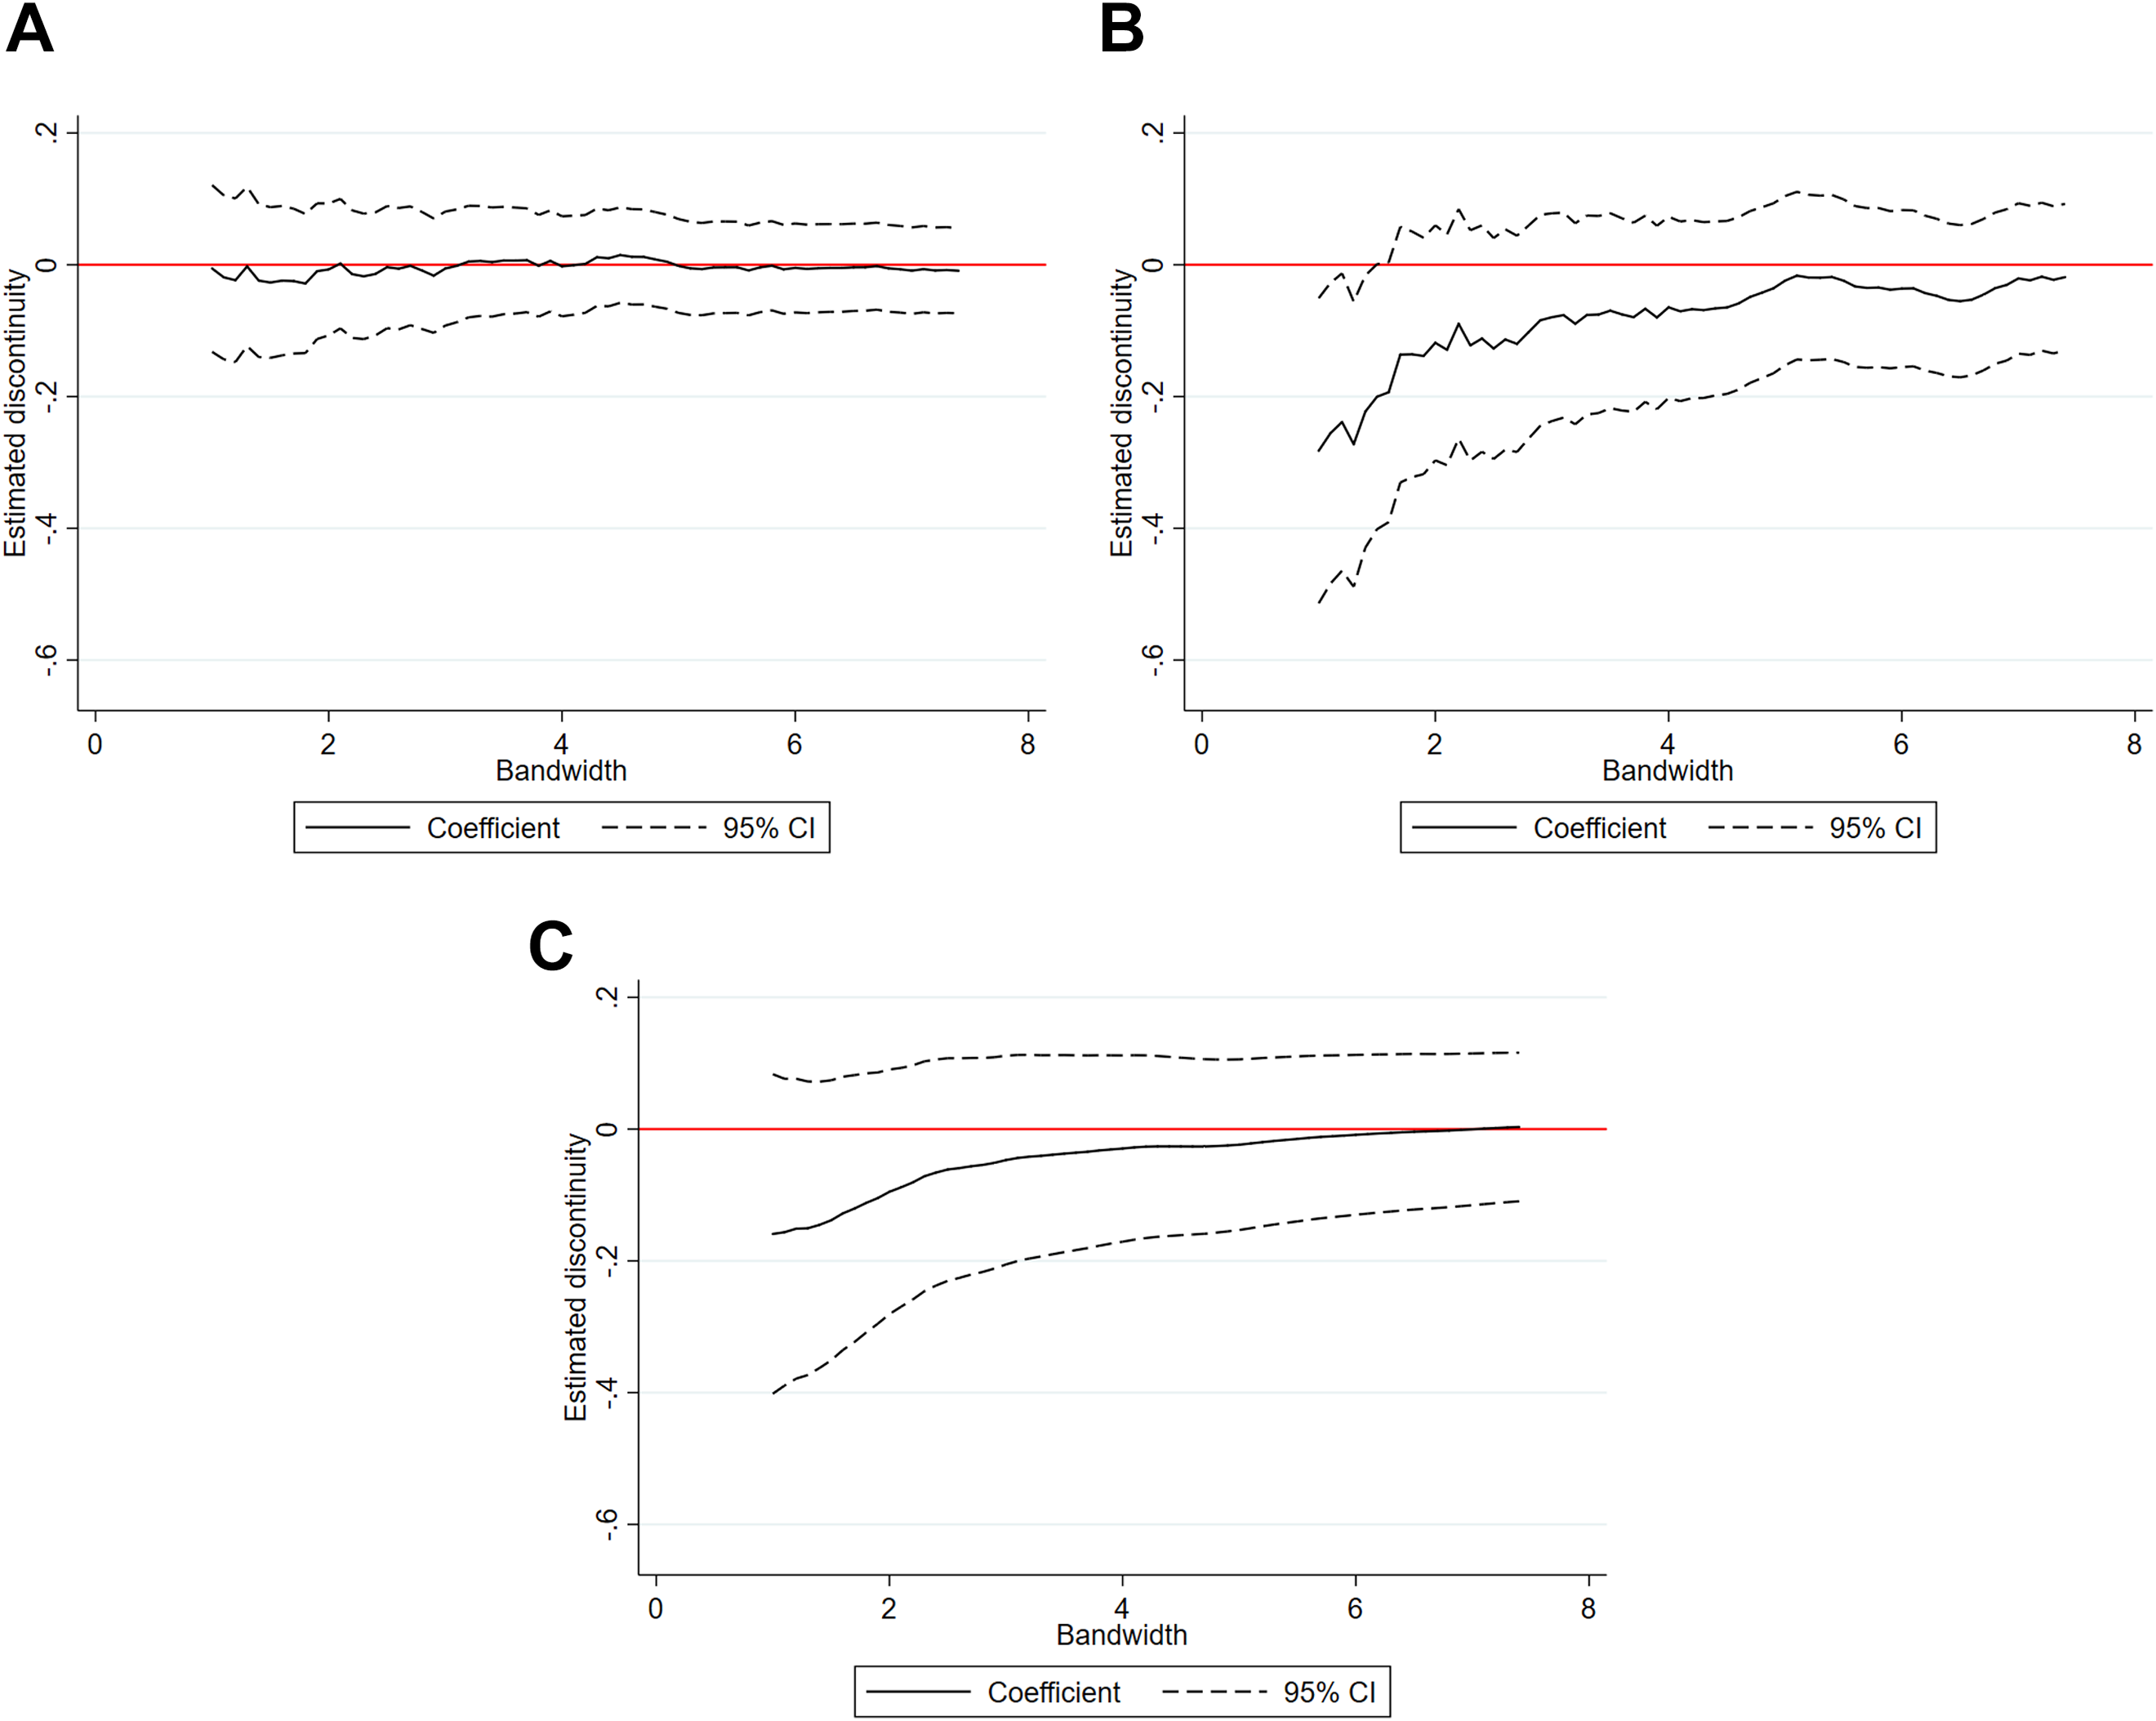
Estimated coefficients with varying bandwidth. (a) No control. (b) Linear control. (c) Local linear regression. The three panels present the estimated coefficients on High Pot derived from a regression of our indicator of advancing to the next round on High Pot, the lagged 1-year coefficient, club Elo, and a full set of year and league fixed effects. Panel a includes no control for the running variable, while panel b includes a linear control for distance from cutoff and an interaction between High Pot and distance. Panel c estimates a local linear regression. On the x-axis of each panel, we vary the bandwidth in steps of 0.1 from 1 to 7.5, implying that each data point represents a separate regression where all observations within this bandwidth are included. As a visual aid, the red line indicates a coefficient of 0.
While this analysis suggests that our findings are not driven by some peculiar choice of bandwidth, one might still be worried that our conceptualization of the bandwidth is flawed in itself. In general, the 5-year coefficients have become more dispersed over time. Moreover, compared to the Europa League, the Champions League features teams with higher average coefficients and thus fewer teams within a narrow margin of the cutoff. Therefore, a symmetric interval in terms of the 5-year coefficient might give undue weight to observations from earlier as compared to more recent seasons and the Europa League as compared to the Champions League.
In order to overcome this concern, Table 4 selects the sample on the basis of seeding rank rather than coefficient. Specifically, columns 1 and 2 are estimated only on the observations immediately above and below the cutoff, independently of how far their coefficients are from the cutoff, whereas columns 3 and 4 consider the two closest teams on each side of the cutoff. 11 The results are generally in line with those obtained previously: all estimated coefficients are negative but mostly insignificant with larger magnitudes obtained for the smaller sample. Figure 2 in Section 2 shows this result visually. There are no jumps in the probability of advancing between the lowest ranked team in the higher pot, and the highest ranked team in the lower pot. We take this as an indication that our results are robust to our conceptualization of bandwidth.
Regression Discontinuity Results: Cutoff Based on Rank.
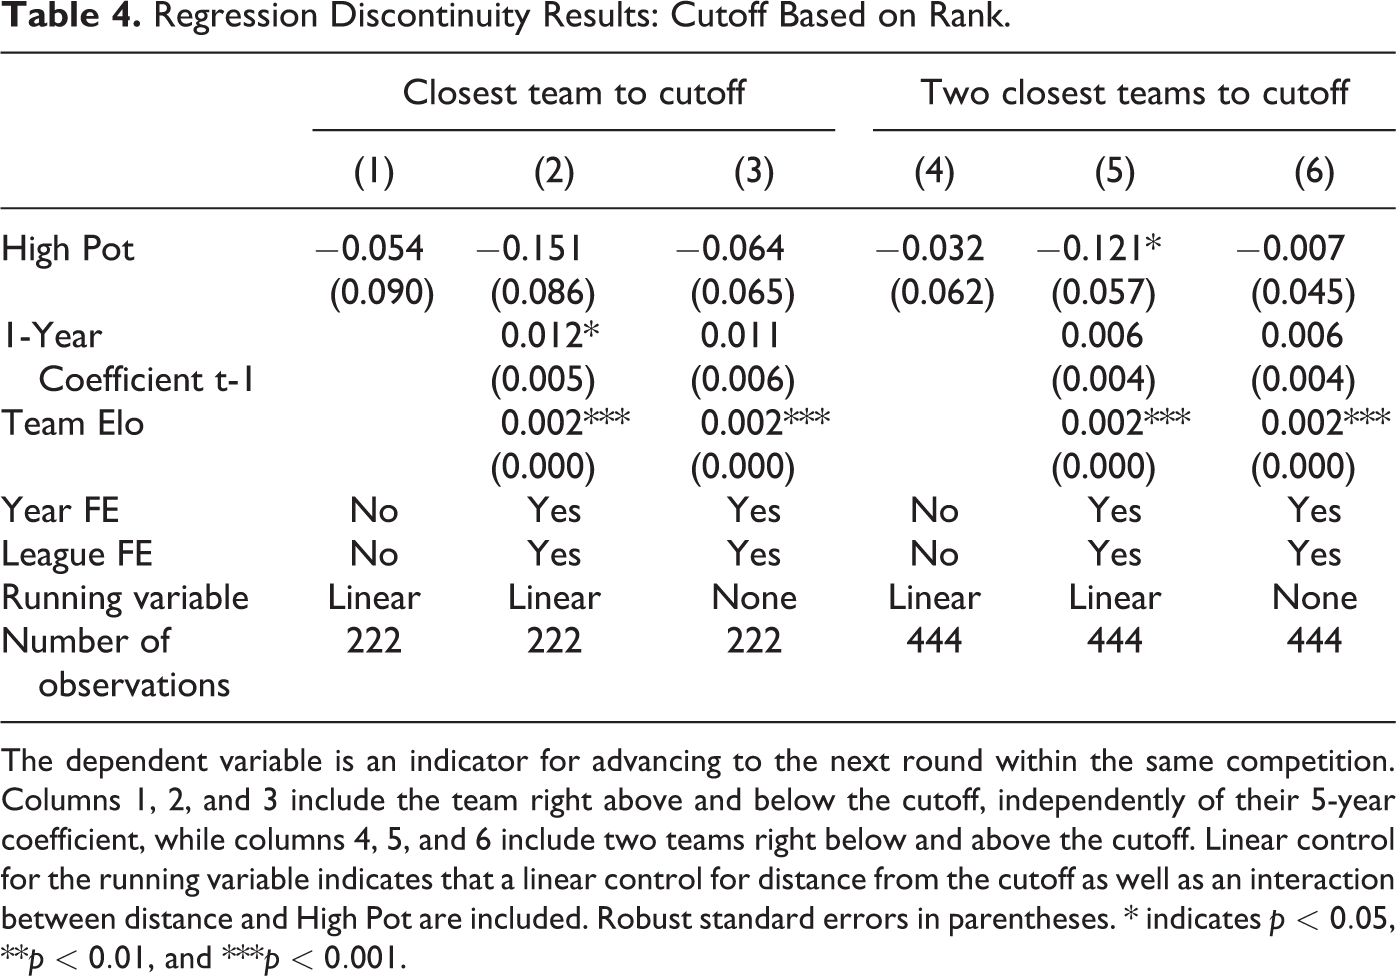
The dependent variable is an indicator for advancing to the next round within the same competition. Columns 1, 2, and 3 include the team right above and below the cutoff, independently of their 5-year coefficient, while columns 4, 5, and 6 include two teams right below and above the cutoff. Linear control for the running variable indicates that a linear control for distance from the cutoff as well as an interaction between distance and High Pot are included. Robust standard errors in parentheses. * indicates
Further, to study whether the results presented thus far are sensitive to the particular outcome variable we consider, Table 5 presents the same specifications as in Table 3, for alternative definitions of the outcome variable. Panel A uses a dummy variable indicating whether the team proceeded to the knock-out stage of the competition they started out in or came third in their Champions League group and thus “advanced” to the knock-out stage of the Europa League. The resulting coefficients are largely in line with those obtained in the main specification, although slightly smaller in magnitude (i.e. less negative). Panel B considers the current UEFA 1-year coefficient as an outcome variable. 12 This variable measures performance in the entire tournament, going beyond just the group stage on a more continuous scale. The general pattern of results is consistent with those obtained previously, with all coefficient estimates being negative without achieving conventional levels of statistical significance.
Regression Discontinuity Results, Alternative Outcome Variables.
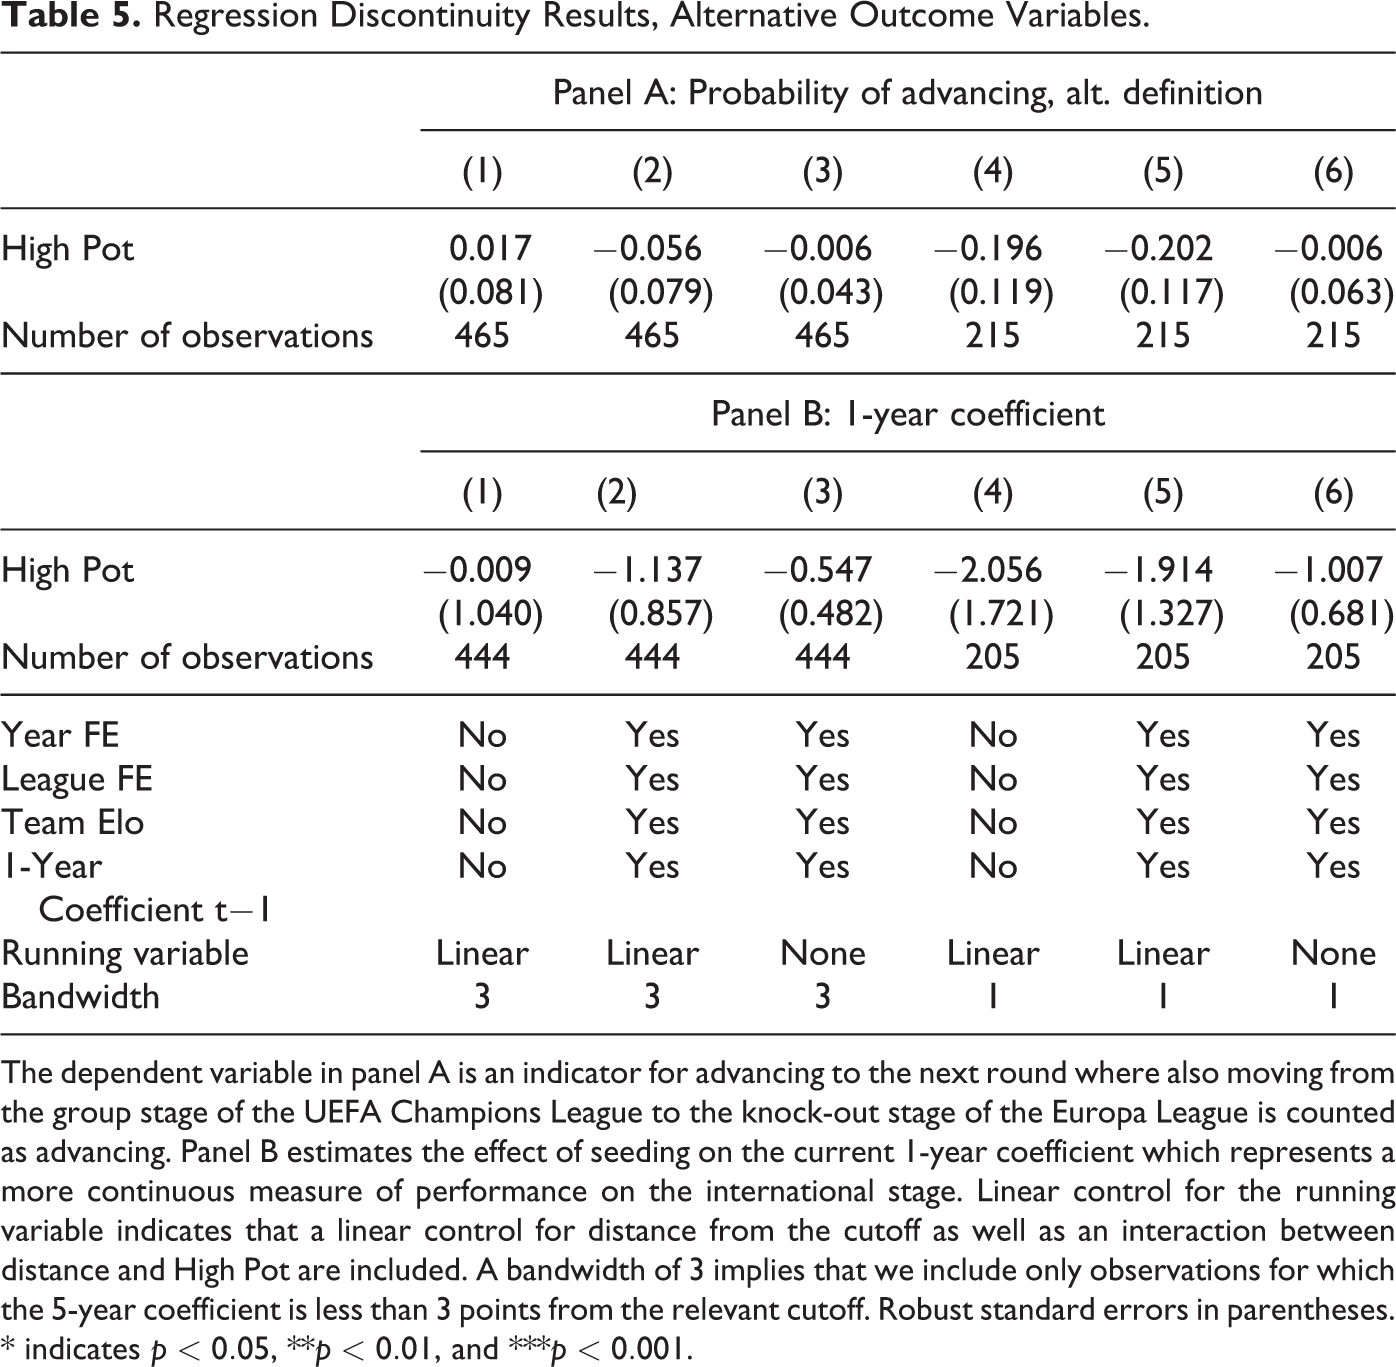
The dependent variable in panel A is an indicator for advancing to the next round where also moving from the group stage of the UEFA Champions League to the knock-out stage of the Europa League is counted as advancing. Panel B estimates the effect of seeding on the current 1-year coefficient which represents a more continuous measure of performance on the international stage. Linear control for the running variable indicates that a linear control for distance from the cutoff as well as an interaction between distance and High Pot are included. A bandwidth of 3 implies that we include only observations for which the 5-year coefficient is less than 3 points from the relevant cutoff. Robust standard errors in parentheses. * indicates
Heterogeneity Analysis
While the analysis thus far was based on a pooled sample spanning different leagues, time-periods, and cutoffs, in the following we will disentangle the results along each of these dimensions, in an attempt to shed light on the generalizability of our results as well as their potential drivers.
As a first exercise, Table 6 replicates the main analysis, including an additional interaction term between a Champions League indicator and the indicator for being in the higher pot. 13 This setup explicitly allows for the treatment effect to differ across the two tournaments and thus enables us to investigate whether there are meaningful differences between the two tournaments. The estimated coefficient on the variable High Pot gives the treatment effect for the Europa League whereas the interaction term captures the difference between the effect arising in the Champions League and the Europa League. While the estimated coefficients, particularly on the interaction term, are generally more noisy due to the reduction in degrees of freedom, an interesting pattern emerges: The estimated effects for the Europa League are largely in line with those obtained above, with the majority of specifications yielding negative point estimates that tend to increase in magnitude as a narrower bandwidth is chosen. At the same time, the interaction term yields positive point estimates in all but one specification, which might hint at a more positive effect of seeding in the Champions League than in the Europa League. It should, however, be stressed that the estimated coefficients on the interaction terms are very noisy such that they never reach statistical significance. 14
Regression Discontinuity Results by League.
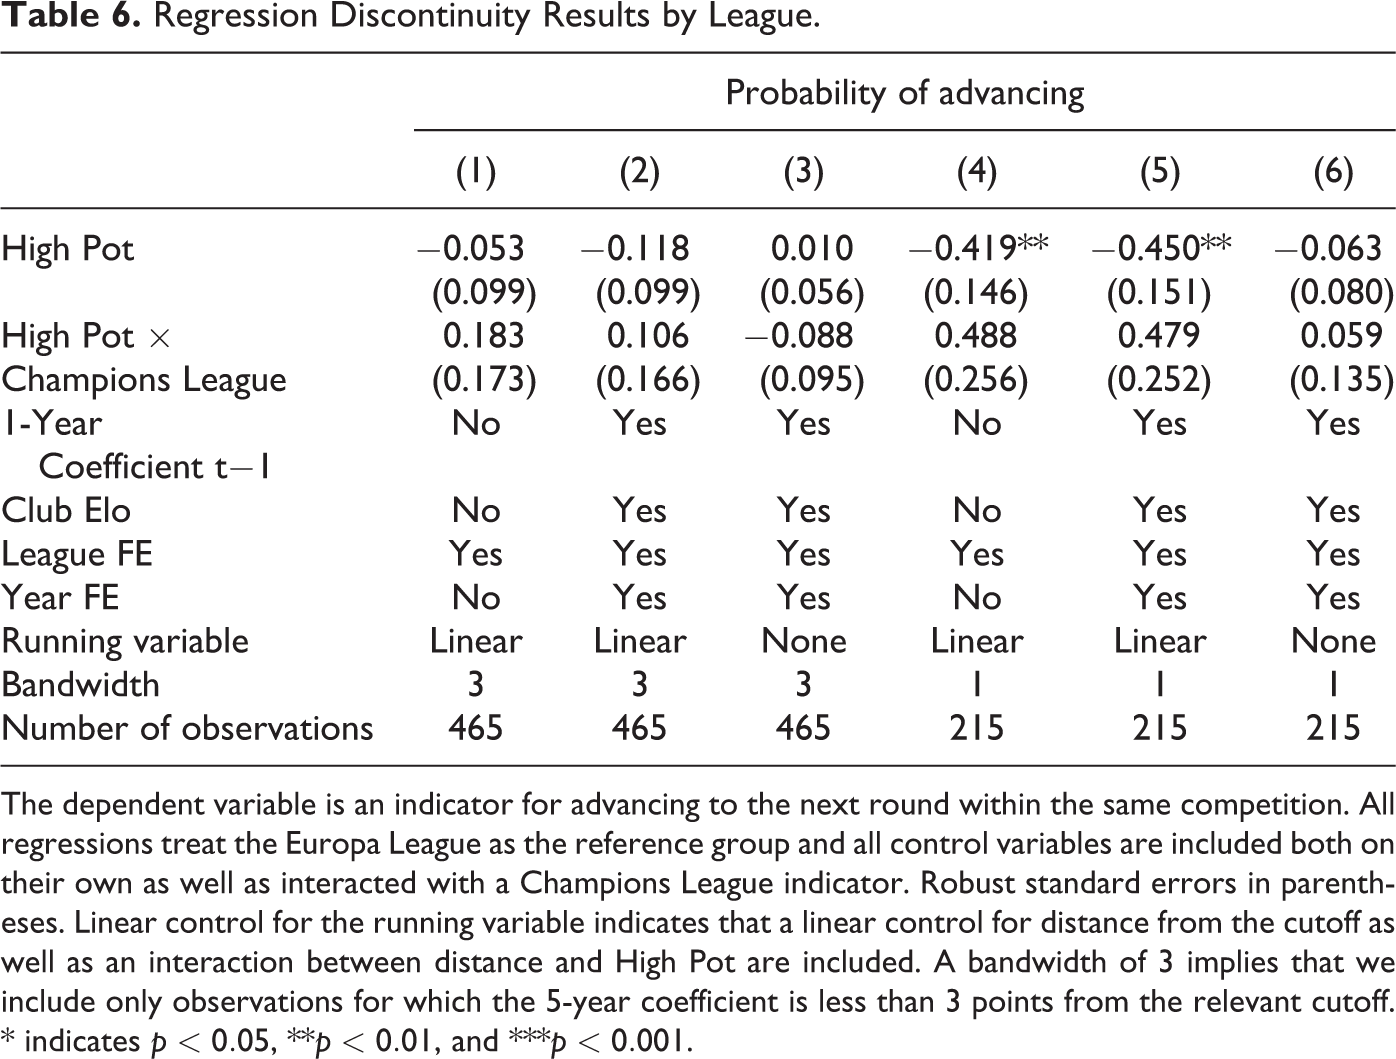
The dependent variable is an indicator for advancing to the next round within the same competition. All regressions treat the Europa League as the reference group and all control variables are included both on their own as well as interacted with a Champions League indicator. Robust standard errors in parentheses. Linear control for the running variable indicates that a linear control for distance from the cutoff as well as an interaction between distance and High Pot are included. A bandwidth of 3 implies that we include only observations for which the 5-year coefficient is less than 3 points from the relevant cutoff. * indicates
In a similar spirit, we can investigate the robustness of the estimated coefficients across time periods. Table 7 presents such a sample split where columns 1 through 3 are based on the subsample from 2000-2009, whereas columns 4 through 6 use only observations from 2010-2020. This represents a natural point to split the sample since the 2010 season marked the advent of the UEFA Europa League and introduced a number of changes to the tournament structure that might have induced changes to the relevance of the seeding procedure for tournament outcomes.
Regression Discontinuity Results by Time Period.
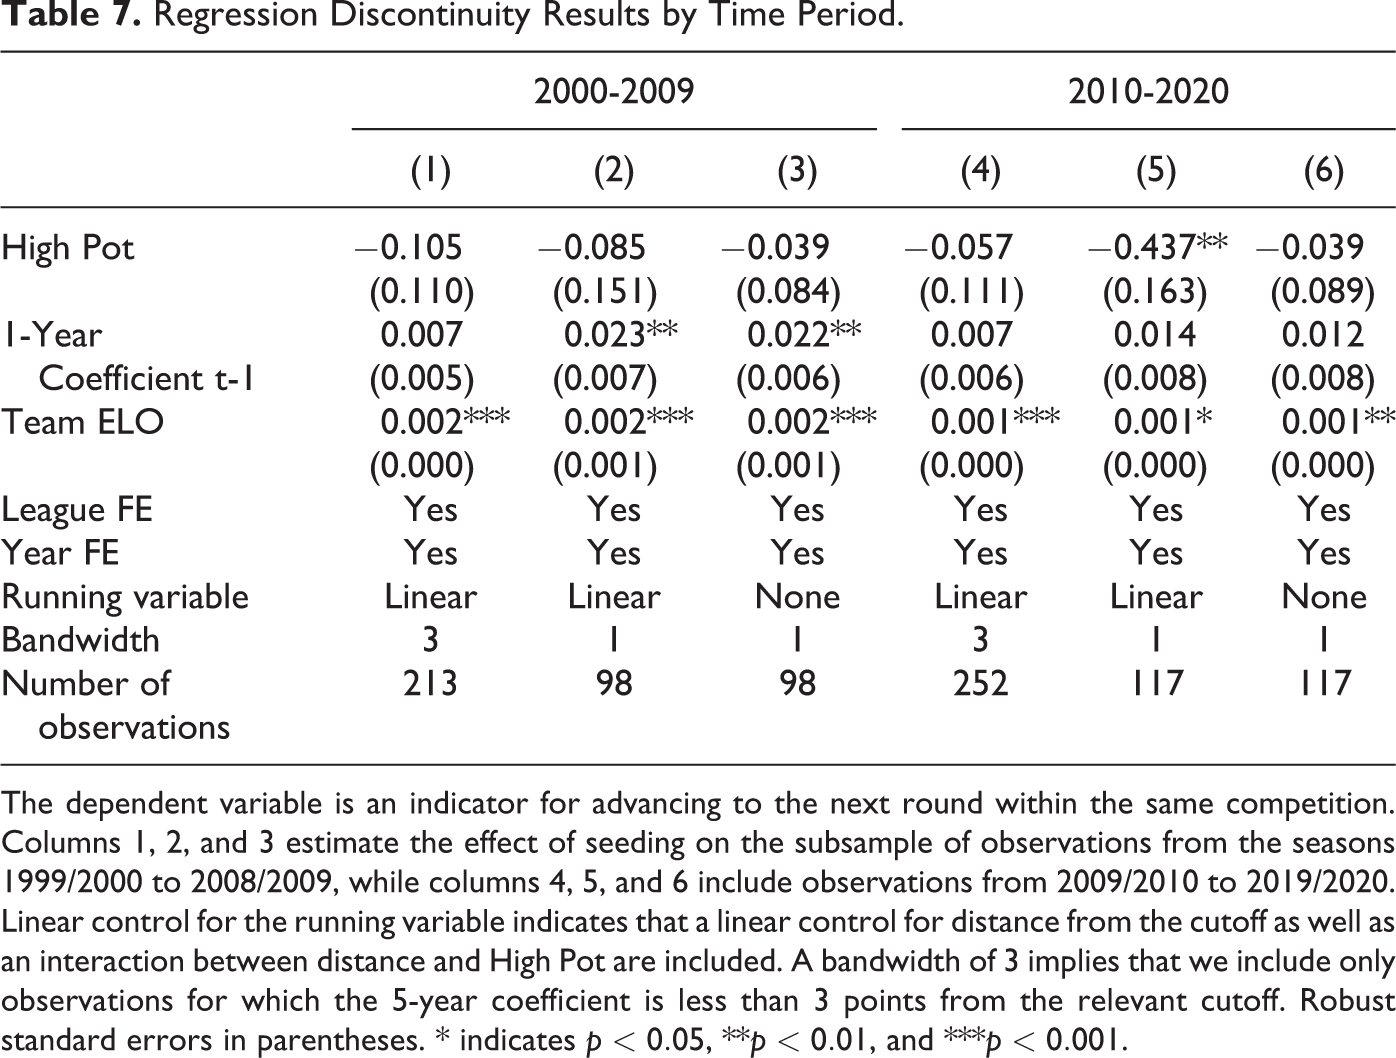
The dependent variable is an indicator for advancing to the next round within the same competition. Columns 1, 2, and 3 estimate the effect of seeding on the subsample of observations from the seasons 1999/2000 to 2008/2009, while columns 4, 5, and 6 include observations from 2009/2010 to 2019/2020. Linear control for the running variable indicates that a linear control for distance from the cutoff as well as an interaction between distance and High Pot are included. A bandwidth of 3 implies that we include only observations for which the 5-year coefficient is less than 3 points from the relevant cutoff. Robust standard errors in parentheses. * indicates
The results suggest that the estimated coefficients are stable across time periods in two of the three specifications, whereas the coefficient obtained in column 5 differs quite substantially from that in column 2. Since this effect, however, appears not to be robust to the small change in specification due to removing the linear control for the running variable, this result should be interpreted with caution. Overall, the results therefore suggest that the finding of a small negative coefficient is not merely the result of a specific time period but seems to be a general feature of the tournaments in our sample.
As a final dimension for heterogeneity, we estimate the effect of seeding separately at each cutoff. Every tournament-season yields anywhere from 2 to 4 cutoffs along which our coefficient of interest can be identified, with recent Champions League seasons only supplying two relevant cutoffs (between pots 2 and 3 as well as between pots 3 and 4) and early seasons of the Europa League supplying 4 relevant cutoffs (between pots 1 and 2, 2 and 3, 3 and 4, as well as 4 and 5). From a theoretical standpoint, not all of these cutoffs are expected to have the same effect on the probability of advancing to the next round: consider a hypothetical and strongly simplified scenario of a tournament with a 4-pot seeding procedure in which all pots are filled according to rank and the team with the higher 5-year coefficient always wins a direct match-up. In this scenario, the pot 1 team would win all its games in the group stage, while the pot 2 team wins only against its opponents from pots 3 and 4, and so on. In this scenario, moving from pot 3 to pot 2 induces the team to advance to the knock-out stage, while moving from pot 2 to pot 1 or from pot 4 to pot 3 has no effect on the probability to advance. 15
The results from this heterogeneity exercise are shown in Table 8. Panel A presents the results for a bandwidth of 1, where the control for the running variable is omitted, and panel B presents results from the same specifications for a bandwidth of 3, this time including a linear control for the running variable. The results from columns 1 through 3 suggest that there is little heterogeneity along this dimension: the coefficient estimates obtained for the cutoff between pots 2 and 3 is the most negative but the differences between the specifications are far from statistically significant.
Regression Discontinuity Results by Cutoff.
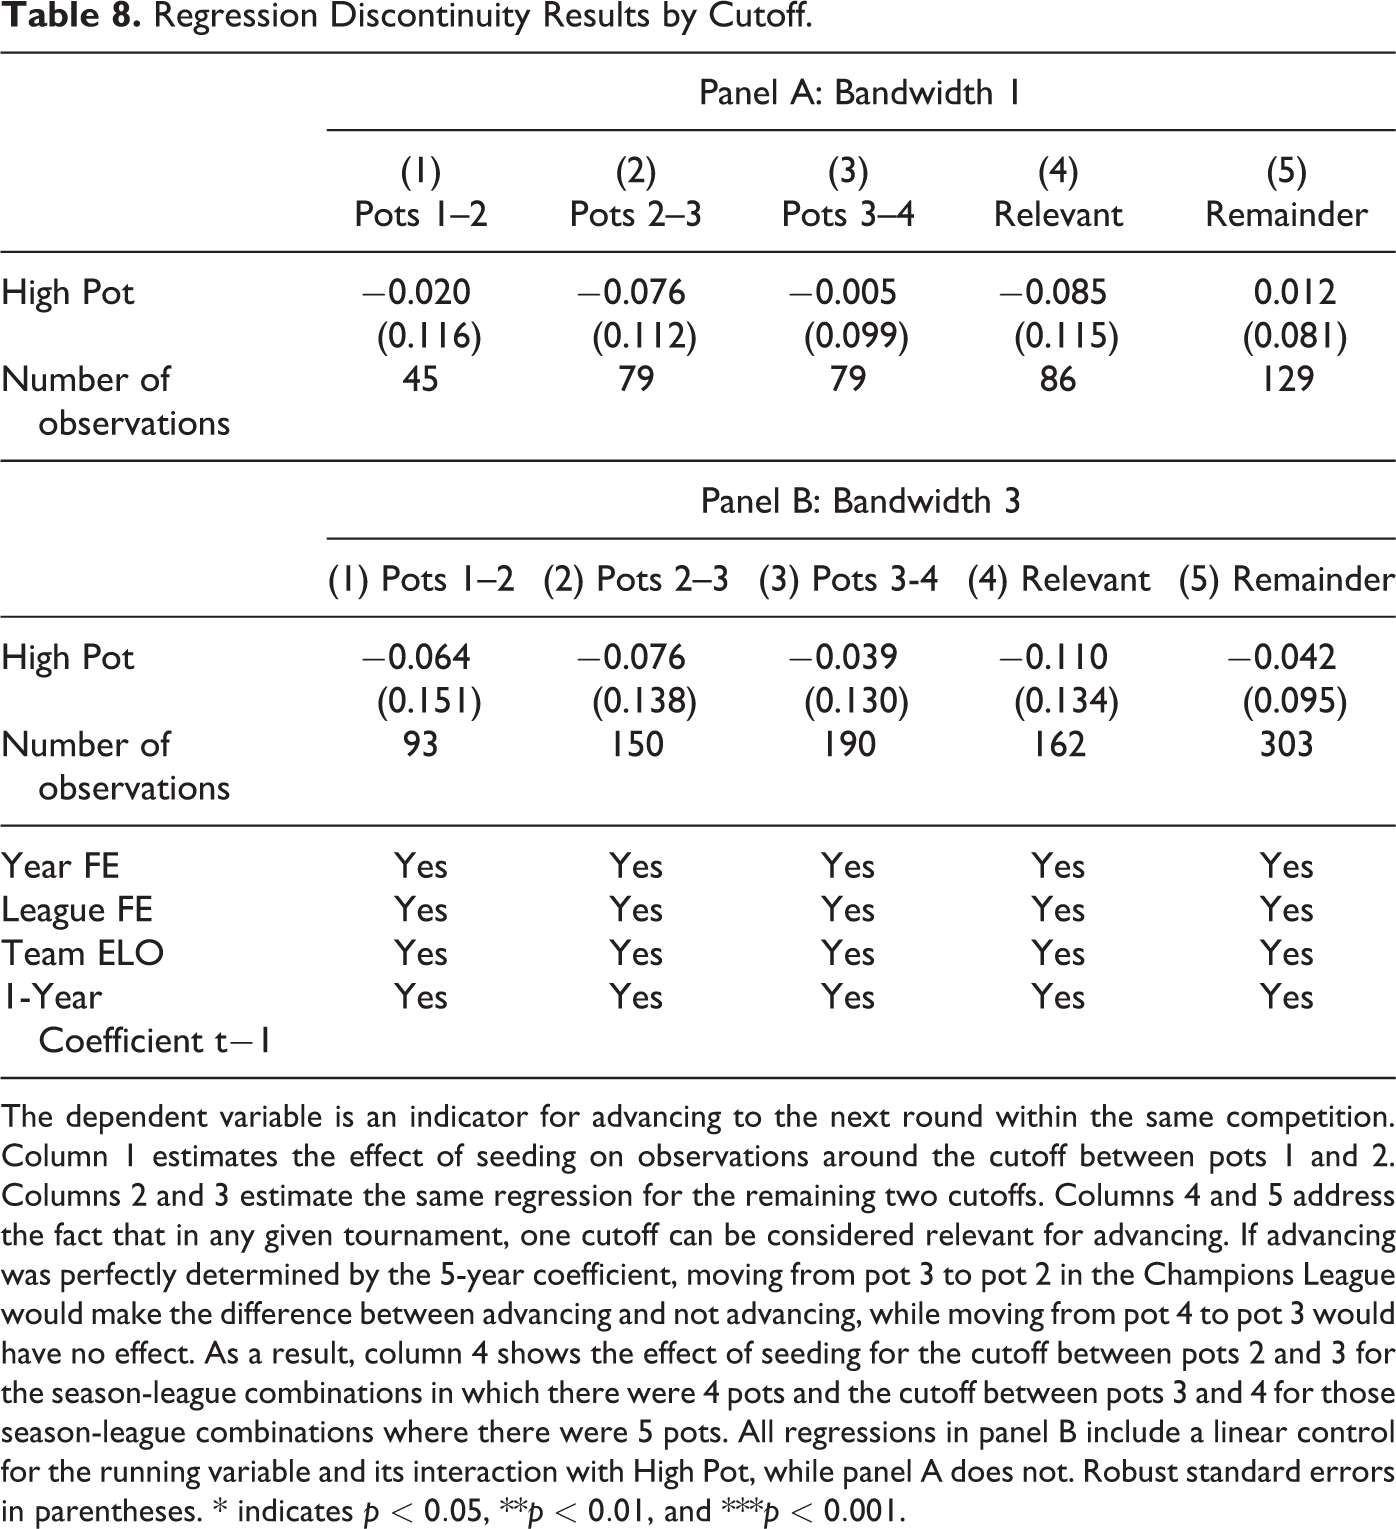
The dependent variable is an indicator for advancing to the next round within the same competition. Column 1 estimates the effect of seeding on observations around the cutoff between pots 1 and 2. Columns 2 and 3 estimate the same regression for the remaining two cutoffs. Columns 4 and 5 address the fact that in any given tournament, one cutoff can be considered relevant for advancing. If advancing was perfectly determined by the 5-year coefficient, moving from pot 3 to pot 2 in the Champions League would make the difference between advancing and not advancing, while moving from pot 4 to pot 3 would have no effect. As a result, column 4 shows the effect of seeding for the cutoff between pots 2 and 3 for the season-league combinations in which there were 4 pots and the cutoff between pots 3 and 4 for those season-league combinations where there were 5 pots. All regressions in panel B include a linear control for the running variable and its interaction with High Pot, while panel A does not. Robust standard errors in parentheses. * indicates
In line with the illustrative example outlined above, in columns 4 and 5, we split the sample according to whether a cutoff can be considered the “relevant” one, where relevant is defined as representing the line between advancing and not advancing if the 5-year coefficient used for seeding was perfectly predictive of performance. 16 While the estimated coefficients are not significantly different from each other, it is interesting to note that if anything the estimated coefficient is more negative for this set of cutoffs than for all others.
Overall, the results from the heterogeneity analyses can be summarized as follows. The estimated coefficients display a relatively high degree of stability both across time and across cutoffs, with the estimated coefficients suggesting a small negative impact which, however, does not reach statistical significance. Moreover, there are some weak indications that the counter-intuitive negative point estimate of being seeded might be driven more by the Europa League than the Champions League.
Conclusion
We estimate the effect of seeding rules on tournament outcomes in European club football using a regression discontinuity design. While we show that, as intended, teams with a better seed faced historically weaker opponents on average, we find no evidence that this translated into a higher probability of advancing to the knock-out stage of the tournament. In fact, the negative point estimates obtained in our pooled specifications suggest that unseeded teams over-performed on average, an effect that seems to be robust across different measures of tournament performance as well as a wide array of econometric specifications and sample selection procedures.
In a set of additional heterogeneity analyses, we show that there is no indication that our results are driven by specific time periods or specific cutoffs, although from a theoretical standpoint there is reason to believe that some cutoffs should be more relevant to tournament performance than others. Finally, our results suggest that there may be reason to believe that the effects of being seeded in the Champions League could be more in line with the positive effects predicted by simulation studies. It should be emphasized however, that this difference in the effect across the two tournaments does not reach statistical significance.
Our main result that seeding did not have an effect on tournament performance of marginally seeded teams is surprising as it contradicts not only our intuition but also previous findings in the literature, particularly since we present evidence that seeded teams did in fact face weaker opponents on average. Hence our results cannot be explained by a failure of the seeding procedure itself. While our design is better suited to deal with confounding variables than existing studies, it does not provide a mechanism that could reconcile the patterns observed in the data.
If teams do perform better in a tournament despite facing stronger opponents, this could potentially be the result of teams being able to adapt their play-style to improve their performance against a nominally stronger opponent or stronger teams underestimating their lower-seeded opponents. Teams might also strategically invest in better players in anticipation of facing strong opponents, especially since reaching the knockout stages of the Europa League and Champions League is financially lucrative. While our data do not allow us to test these hypotheses, we consider them useful avenues for future analyses into the role of seeding for tournament outcomes.
Moreover, future research on the effects of seeding should aim to replicate our results in different domains to test the extent to which our findings can be extrapolated. The opportunities for such analyses are plentiful, since similar seeding regimes are employed in international football tournaments such as the Africa Cup, the FIFA World Cup, as well as the football event of the Summer Olympics. It should be noted that these events base their seeding procedure on different metrics, with the FIFA World Cup seeding based on the FIFA World Ranking, 17 while the Africa Cup employs a score calculated from the performance in past Africa Cups and FIFA World Cups. Comparable seeding procedures are also found outside of football, for example in the Beach Volleyball World Championships, the Hockey World Cup, the Rugby World Cup, and the European Table Tennis Union’s Champions League, as well as until recently in the European Hockey League. While all of these events in principle provide a similar setting to the one studied in the present article, some suffer from the drawback that they are infrequently held, feature a small number of teams, or were only recently established, thus resulting in relatively small samples.
Footnotes
Author’s Note
Erik Merkus is also affiliated with the Mistra Center for Sustainable Markets (Misum), Stockholm, Sweden.
Acknowledgments
We would like to thank Mikael Priks, Christofer Schroeder, Joakim Semb, Emil Bustos, Felix Wilke, and Michael Klug for helpful comments. We would also like to thank the editor and two anonymous referees for their detailed reports that helped us improve the paper substantially. Financial support by the Jan Wallander and Tom Hedelius foundation is gratefully acknowledged.
Declaration of Conflicting Interests
The author(s) declared no potential conflicts of interest with respect to the research, authorship, and/or publication of this article.
Funding
The author(s) received no financial support for the research, authorship, and/or publication of this article.