
Abstract
Introduction
Few studies have compared within-patient variability measures of tacrolimus trough levels by formulation and assessed within-patient variability on outcomes of kidney transplant recipients.
Research Questions
(1) To compare within-patient variability of trough levels when converting from twice-daily to once-daily tacrolimus using standard deviation, coefficient of variation, and intrapatient variability percent. (2) To use the 3 measures of variability to examine the relationship between tacrolimus once-daily within-patient variability and total graft failure (i.e., return to chronic dialysis, pre-emptive retransplant, death with graft function).
Design
In this observational cohort study, within-patient variability of trough levels pre- and post-conversion from twice-daily to once-daily tacrolimus were compared using Wilcoxon matched-pairs signed-rank test. Graft outcomes were analyzed using Kaplan-Meier curves and multivariable Cox proportional hazards models.
Results
In 463 patients, within-patient variability differences pre- and post-conversion of median standard deviation, coefficient of variation, and intrapatient variability percent were −0.16 (P = 0.09), −0.01 (P = 0.52), and −1.41 (P = 0.32), respectively. Post-conversion, every 1 unit increase in within-patient variability standard deviation and intrapatient variability percent and every 0.1 unit increase in the coefficient of variation was associated with an increased hazard ratio [1.19 (P = 0.004), 1.02 (P = 0.030), 1.13 (P = 0.001), respectively] of total graft failure. Post-conversion, within-patient variability above cohort medians using standard deviation and coefficient of variation had a significantly higher risk of total graft failure.
Discussion
Under a program-wide conversion, no significant difference was observed in within-patient variability post-conversion from twice-daily to once-daily tacrolimus using the three measures of variability. High within-patient variability was associated with adverse transplant outcomes post-conversion.
Introduction
Calcineurin inhibitors continue to be the cornerstone of kidney transplant immunosuppression.1,2 Tacrolimus is the preferred calcineurin inhibitor as it has been shown to significantly reduce rejection rates. 2 It comes in twice-daily immediate release (Tac-BD) and once-daily extended-release formulations (Tac-OD). Several transplant centers have converted patients from Tac-BD to Tac-OD with the hope of simplifying medication administration and improving adherence.2–6 Both formulations have narrow therapeutic windows, thus tacrolimus blood trough levels must be closely monitored.2,7 Trough-level fluctuations of tacrolimus within a patient are referred to as within-patient variability (WPV). High WPV has been previously shown to be associated with adverse graft outcomes including lower glomerular filtration rate and higher rates of acute rejection, transplant glomerulopathy, and total graft failure.8,9
Tacrolimus WPV is commonly measured using standard deviation (SD), coefficient of variation (CV), and intrapatient variability percent (IPV%).4–6,8–11 Standard deviation quantifies dispersion from the population mean, while CV standardizes the SD by the mean. Intrapatient variability percent is a method of dispersion similar to CV. Some studies have shown less WPV with Tac-OD compared with Tac-BD.4,12 These studies have limited generalizability due to their small sample sizes and the use of different measures in evaluating WPV. In addition, studies have assessed the effect of different measures of variability on patient outcomes, but there have not been direct comparisons of the measures of variability or their associations with patient outcomes. Within-patient variability has been increasingly used to quantify adherence to immunosuppressive regimens, a crucial factor to ensure improved long-term graft survival.13,14 Therefore, having a consensus on a method to assess tacrolimus WPV could potentially allow for improved graft outcomes for patients.
Research Objectives
The objectives of this study are (1) to compare WPV of tacrolimus trough levels pre- and post-conversion from Tac-BD to Tac-OD in kidney transplant recipients using three measures of variability (SD, CV, and IPV%) and (2) to use the different measures of variability to examine the relationship between Tac-OD WPV and clinical outcomes of recipients who converted from Tac-BD to Tac-OD.
Methods
Design and Setting
We conducted a single-center observational study employing both cross-sectional and cohort study designs at a large transplant hospital in Toronto, Ontario, Canada. Approval was obtained from the Research Ethics Board at the University Health Network.
Population
The study population of interest was all adult kidney transplant recipients ( ≥ 18 years of age) who received a deceased or living donor kidney between January 1, 2000 and December 31, 2012. All patients transplanted during this time period were eligible for inclusion into the cohort, including the full range of age, biological sex, race, and causes of end-stage kidney disease (e.g., glomerulonephritis, diabetes mellitus, cystic diseases). Characteristics of the population are described in the results.
Sampling
Patients were excluded if they were (a) not part of the center's formal conversion program from Tac-BD to Tac-OD in September 2012 (including patients on cyclosporine-based maintenance immunosuppression), (b) less than 1 year on Tac-BD or Tac-OD around the time of conversion, (c) less than 15 months since transplant at the time of conversion (to ensure patients have at least 3-months of stabilization post-transplant), (d) had no more than 1 tacrolimus level measured prior to or after conversion, and (e) were recipients of non-kidney transplants (multi-organ or simultaneous). Study follow-up was terminated on December 31, 2014.
Data Collection
Tacrolimus formulation names and doses, start/stop dates, and trough levels were extracted from the Organ Transplant Tracking Record, the electronic medical record used in the transplant center during the study period. Baseline characteristics and clinical outcomes were collected from the Comprehensive Renal Transplant Research Information System (CoReTRIS), which is the transplant center's in-house kidney transplant research database. 15 Baseline characteristics were grouped into recipient (i.e., age, sex, race, body mass index, time on dialysis, cause of end-stage kidney disease, history of diabetes, peak panel reactive antibody), donor (i.e., age, donation type), and transplant (i.e., induction type, delayed graft function, median estimated glomerular filtration rate (eGFR) at conversion, HLA mismatches, and transplant era) factors.
Procedure
The center underwent a formal conversion from Tac-BD to Tac-OD among eligible kidney transplant recipients between September 2012 and December 2013. Patients were eligible for conversion regardless of their time post-transplant or severity of prior Tac-BD trough level fluctuations. Patients were informed of the conversion program via telephone, clinic appointments, or mail. Reasons for not converting included maintenance therapy on cyclosporine, the discretion of the treating physician, recently switched to Tac-OD outside of the formal conversion program, and patient preference. Informed consent prior to conversion was obtained. On the date set for conversion, the patient stopped Tac-BD and started Tac-OD in the morning, with blood work scheduled within one week. Dose adjustments were made at that time, if necessary. At the time of the conversion program, there was only one formulation of once daily, extended-release tacrolimus authorized by Health Canada (Advagraf; Astellas Pharma Ltd, Surrey, the UK).
Data Analysis
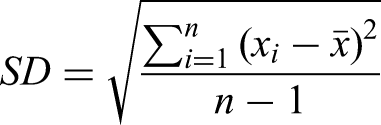
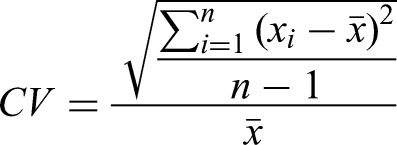
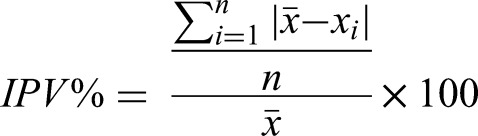
For analyses of tacrolimus variability, the time of conversion from Tac-BD to Tac-OD was used as the time origin. The exposure variable was time on Tac-BD versus Tac-OD, and the outcome of interest was WPV measured using SD, CV, and IPV%. Standard deviation is a measure of variability around the mean of a set of data. The closer the values are to the sample mean, the lower the SD. The coefficient of variation is a ratio of the SD to the mean. As a result, CV is a more standardized measure of variability, facilitating comparisons of the dispersions of different sample means regardless of their values. Intrapatient variability percent is another measure of variability with similar components to the CV equation; however, IPV% computes a different value since it uses modulus and does not have Bessel's correction. 5
The formulas for each measure of variability are depicted below, where n = number of data points,
For analyses of the effect of tacrolimus variability on patient outcomes, the time origin was set at 1-year post-conversion. Time-varying Tac-OD WPV (SD, CV, and IPV%) was the exposure variable and the outcomes assessed were death-censored graft failure (defined as a return to chronic dialysis or preemptive re-transplant), death with graft function, or total graft failure (composite of death-censored graft failure and death with graft function). Kaplan-Meier curves were used to graphically depict time-to-event for each outcome. Univariable and multivariable Cox proportional hazards models were also used for the patient outcome analyses. Covariates entered in the multivariable analyses were (a) WPV, (b) recipient age, (c) recipient history of diabetes, (d) recipient eGFR (CKD-EPI), and (e) donor type (living vs deceased). Multivariable analyses were conducted using values of WPV as a continuous variable and categorized as high and low WPV groups, based on the median of the three measures.
Sensitivity analyses were conducted for tacrolimus variability by including an additional three months of Tac-OD measurements for WPV. The additional sensitivity analysis used backward stepwise selection to determine the independent association of the exposure and study outcomes. All statistical analyses and visualizations were performed using STATA MP 13.0 (StataCorp, College Station, TX, http://www.stata.com/). A two-sided P-value of < 0.05 was considered statistically significant.
Results
There were 2,119 patients who received a kidney transplant from 1-Jan-2000 to 31-Dec-2012 (Figure 1). Among these patients, the mean age was 51.8 years (SD 13.2), median time on dialysis was 2.9 years (IQR: 1.0, 5.2), 62.1% were male, 70.4% were of the White race, 31.8% had glomerulonephritis as the cause of end-stage kidney disease, and 35.6% had diabetes mellitus. When compared to these patients, the study cohort undergoing conversion from Tac-BD to Tac-OD (N = 463) was slightly older (54.5 vs 51.8 years), had longer dialysis vintage (3.3 vs 2.9 years), and a higher prevalence of glomerulonephritis (36.1 vs 31.8%) but a lower prevalence of males (59.4 vs 62.1%), White race (64.1 vs 70.4%), and diabetes mellitus (24.9% vs 35.6%).
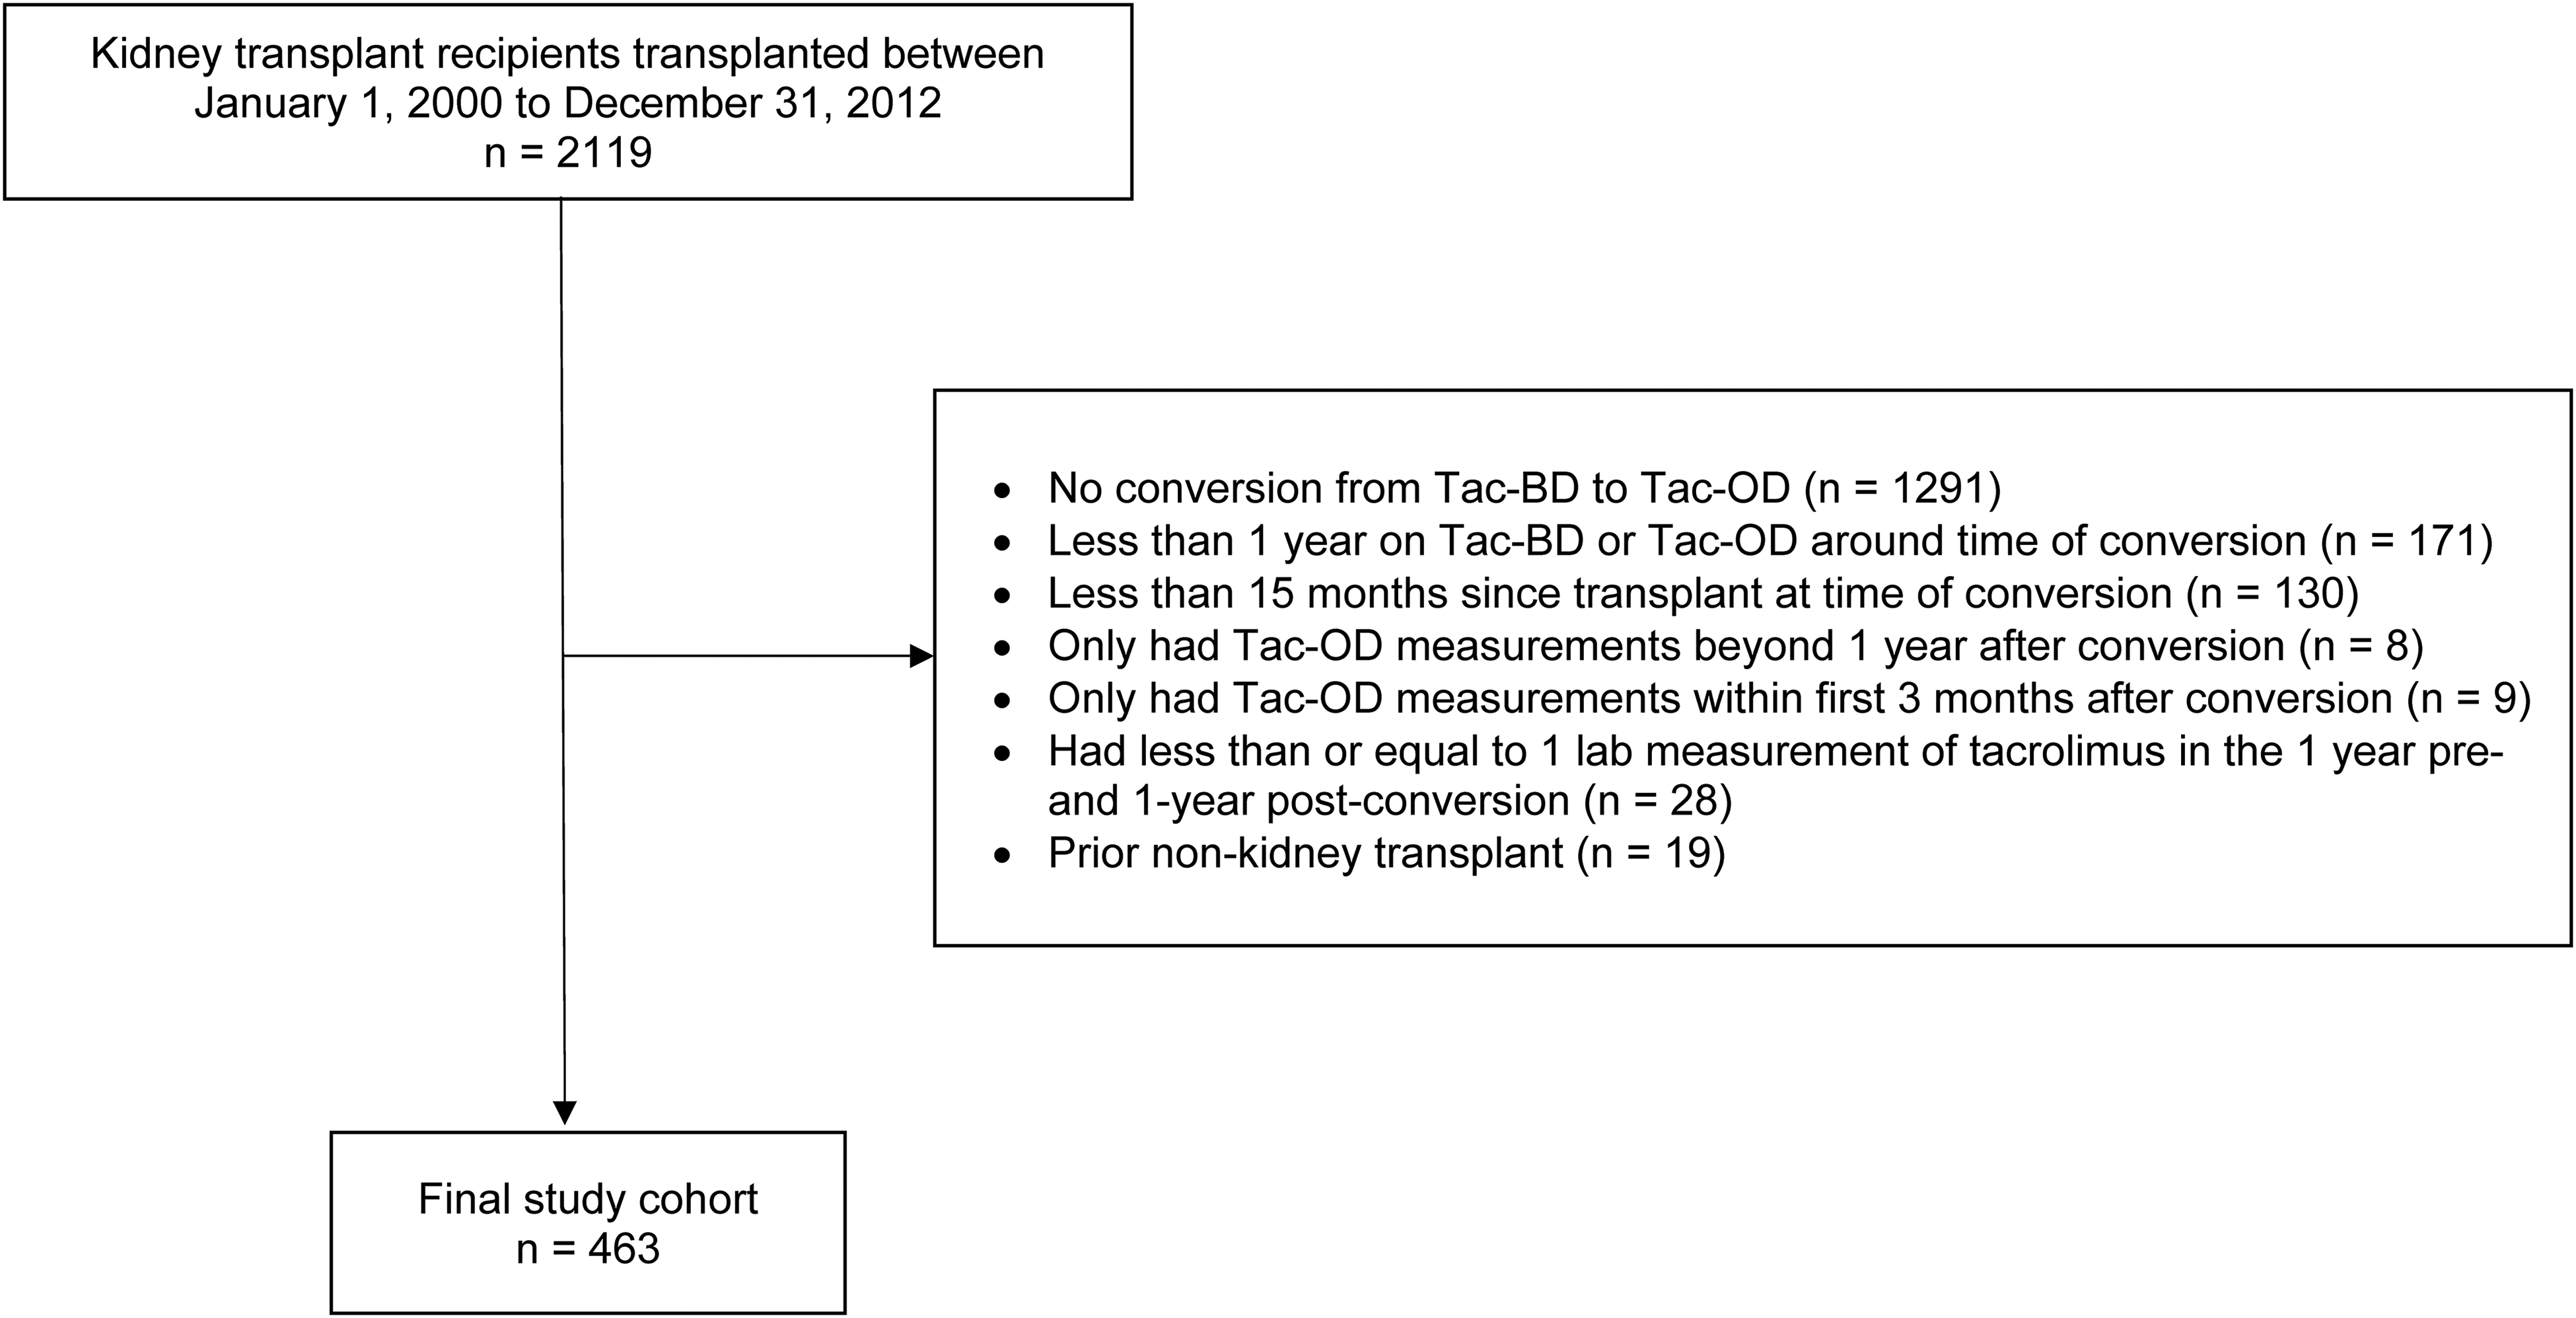
Study flow diagram. Abbreviations: Tac-OD, once-daily tacrolimus; Tac-BD, twice-daily tacrolimus.
In the study cohort, the median time from transplant to conversion was 4.5 years [IQR: 2.8, 6.9]. At the time of conversion, 42.7% of patients were on cyclosporine or a non-CNI-based regimen and 1.6% were already on Tac-OD. After the application of the pre-specified exclusion criteria, the final cohort consisted of 463 patients. The majority were male (59.4%) and Caucasian (64.1%), with a mean age of 54.5 years. The baseline characteristics of the study cohort at conversion are presented in
Baseline Recipient, Donor, and Transplant Characteristics.
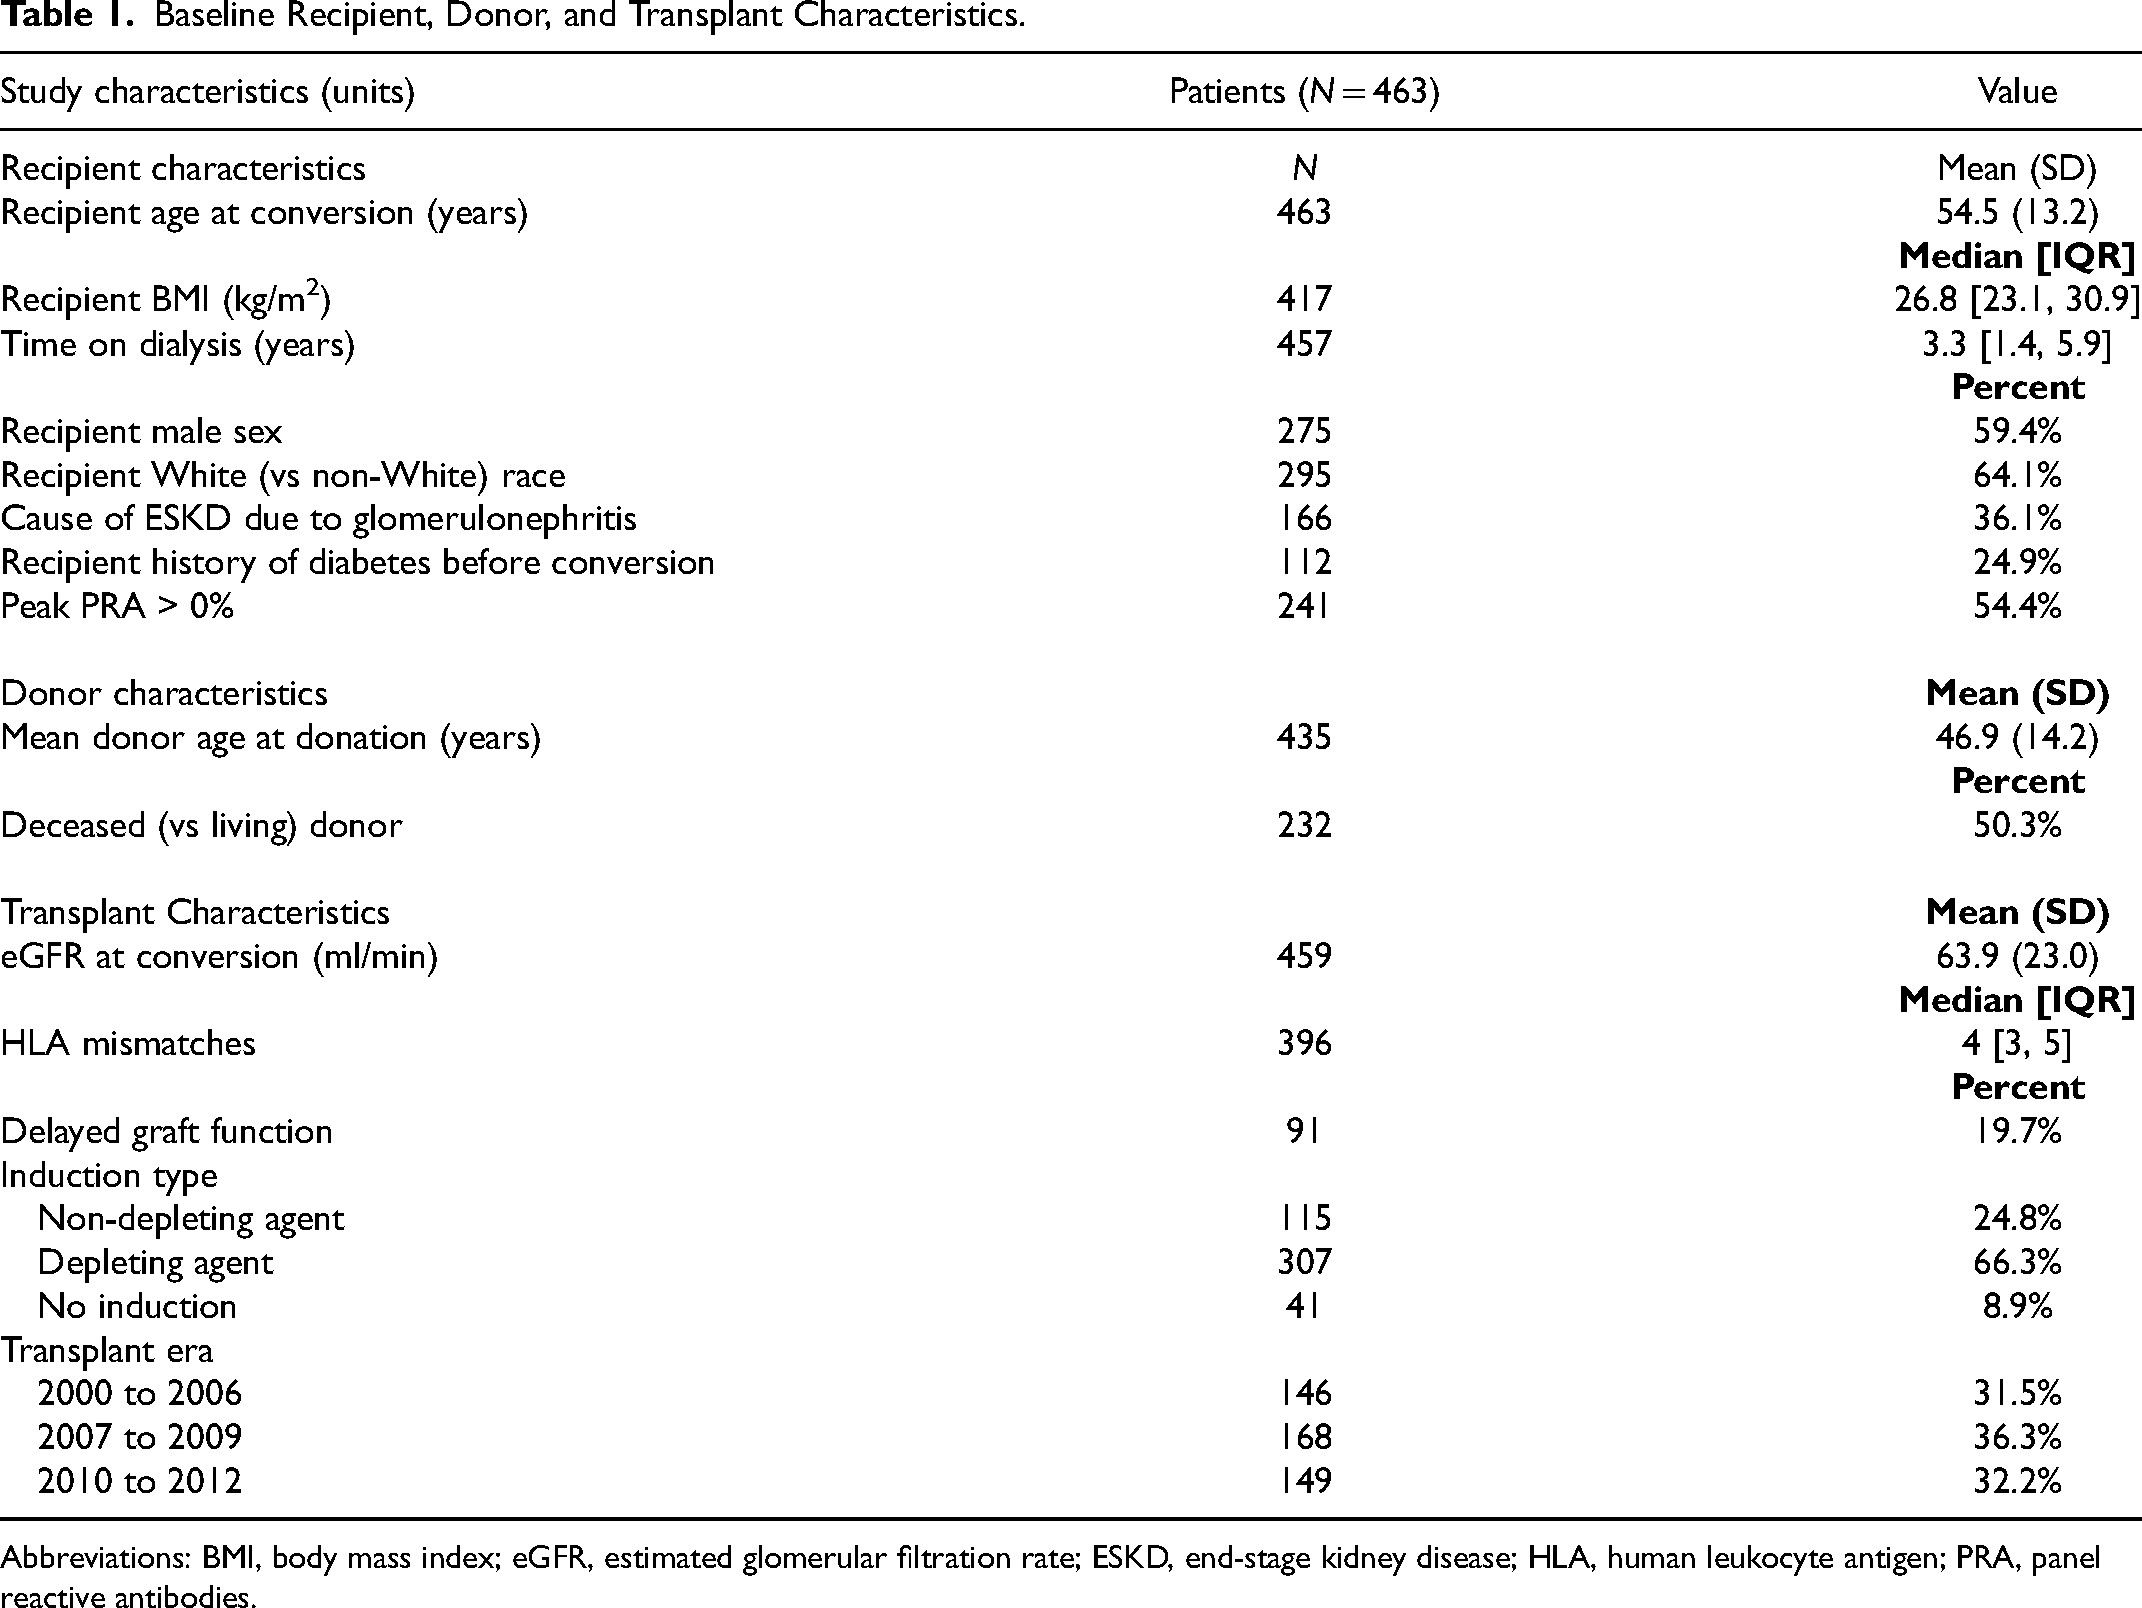
Abbreviations: BMI, body mass index; eGFR, estimated glomerular filtration rate; ESKD, end-stage kidney disease; HLA, human leukocyte antigen; PRA, panel reactive antibodies.
Within-Patient Variability Pre- and Post-Conversion
A median of 6 [IQR: 4, 10] and 5 [IQR: 3, 7] trough levels of Tac-BD and Tac-OD, respectively, were used to calculate WPV measurements (SD, CV, IPV%). Tac-BD and Tac-OD boxplots were right-skewed for each variability measure, whereas boxplots for WPV differences between Tac-BD and Tac-OD were more symmetrically distributed, with the median at zero (Figure 2). Within-patient variability differences (Tac-OD minus Tac-BD) in median SD, CV, and IPV% were −0.16 (95% CI [confidence interval]: −0.90, 0.63; P = 0.09), −0.01 (95% CI: −0.11, 0.11; P = 0.52), and −1.41 (95% CI: −8.39, 8.11; P = 0.32), respectively (
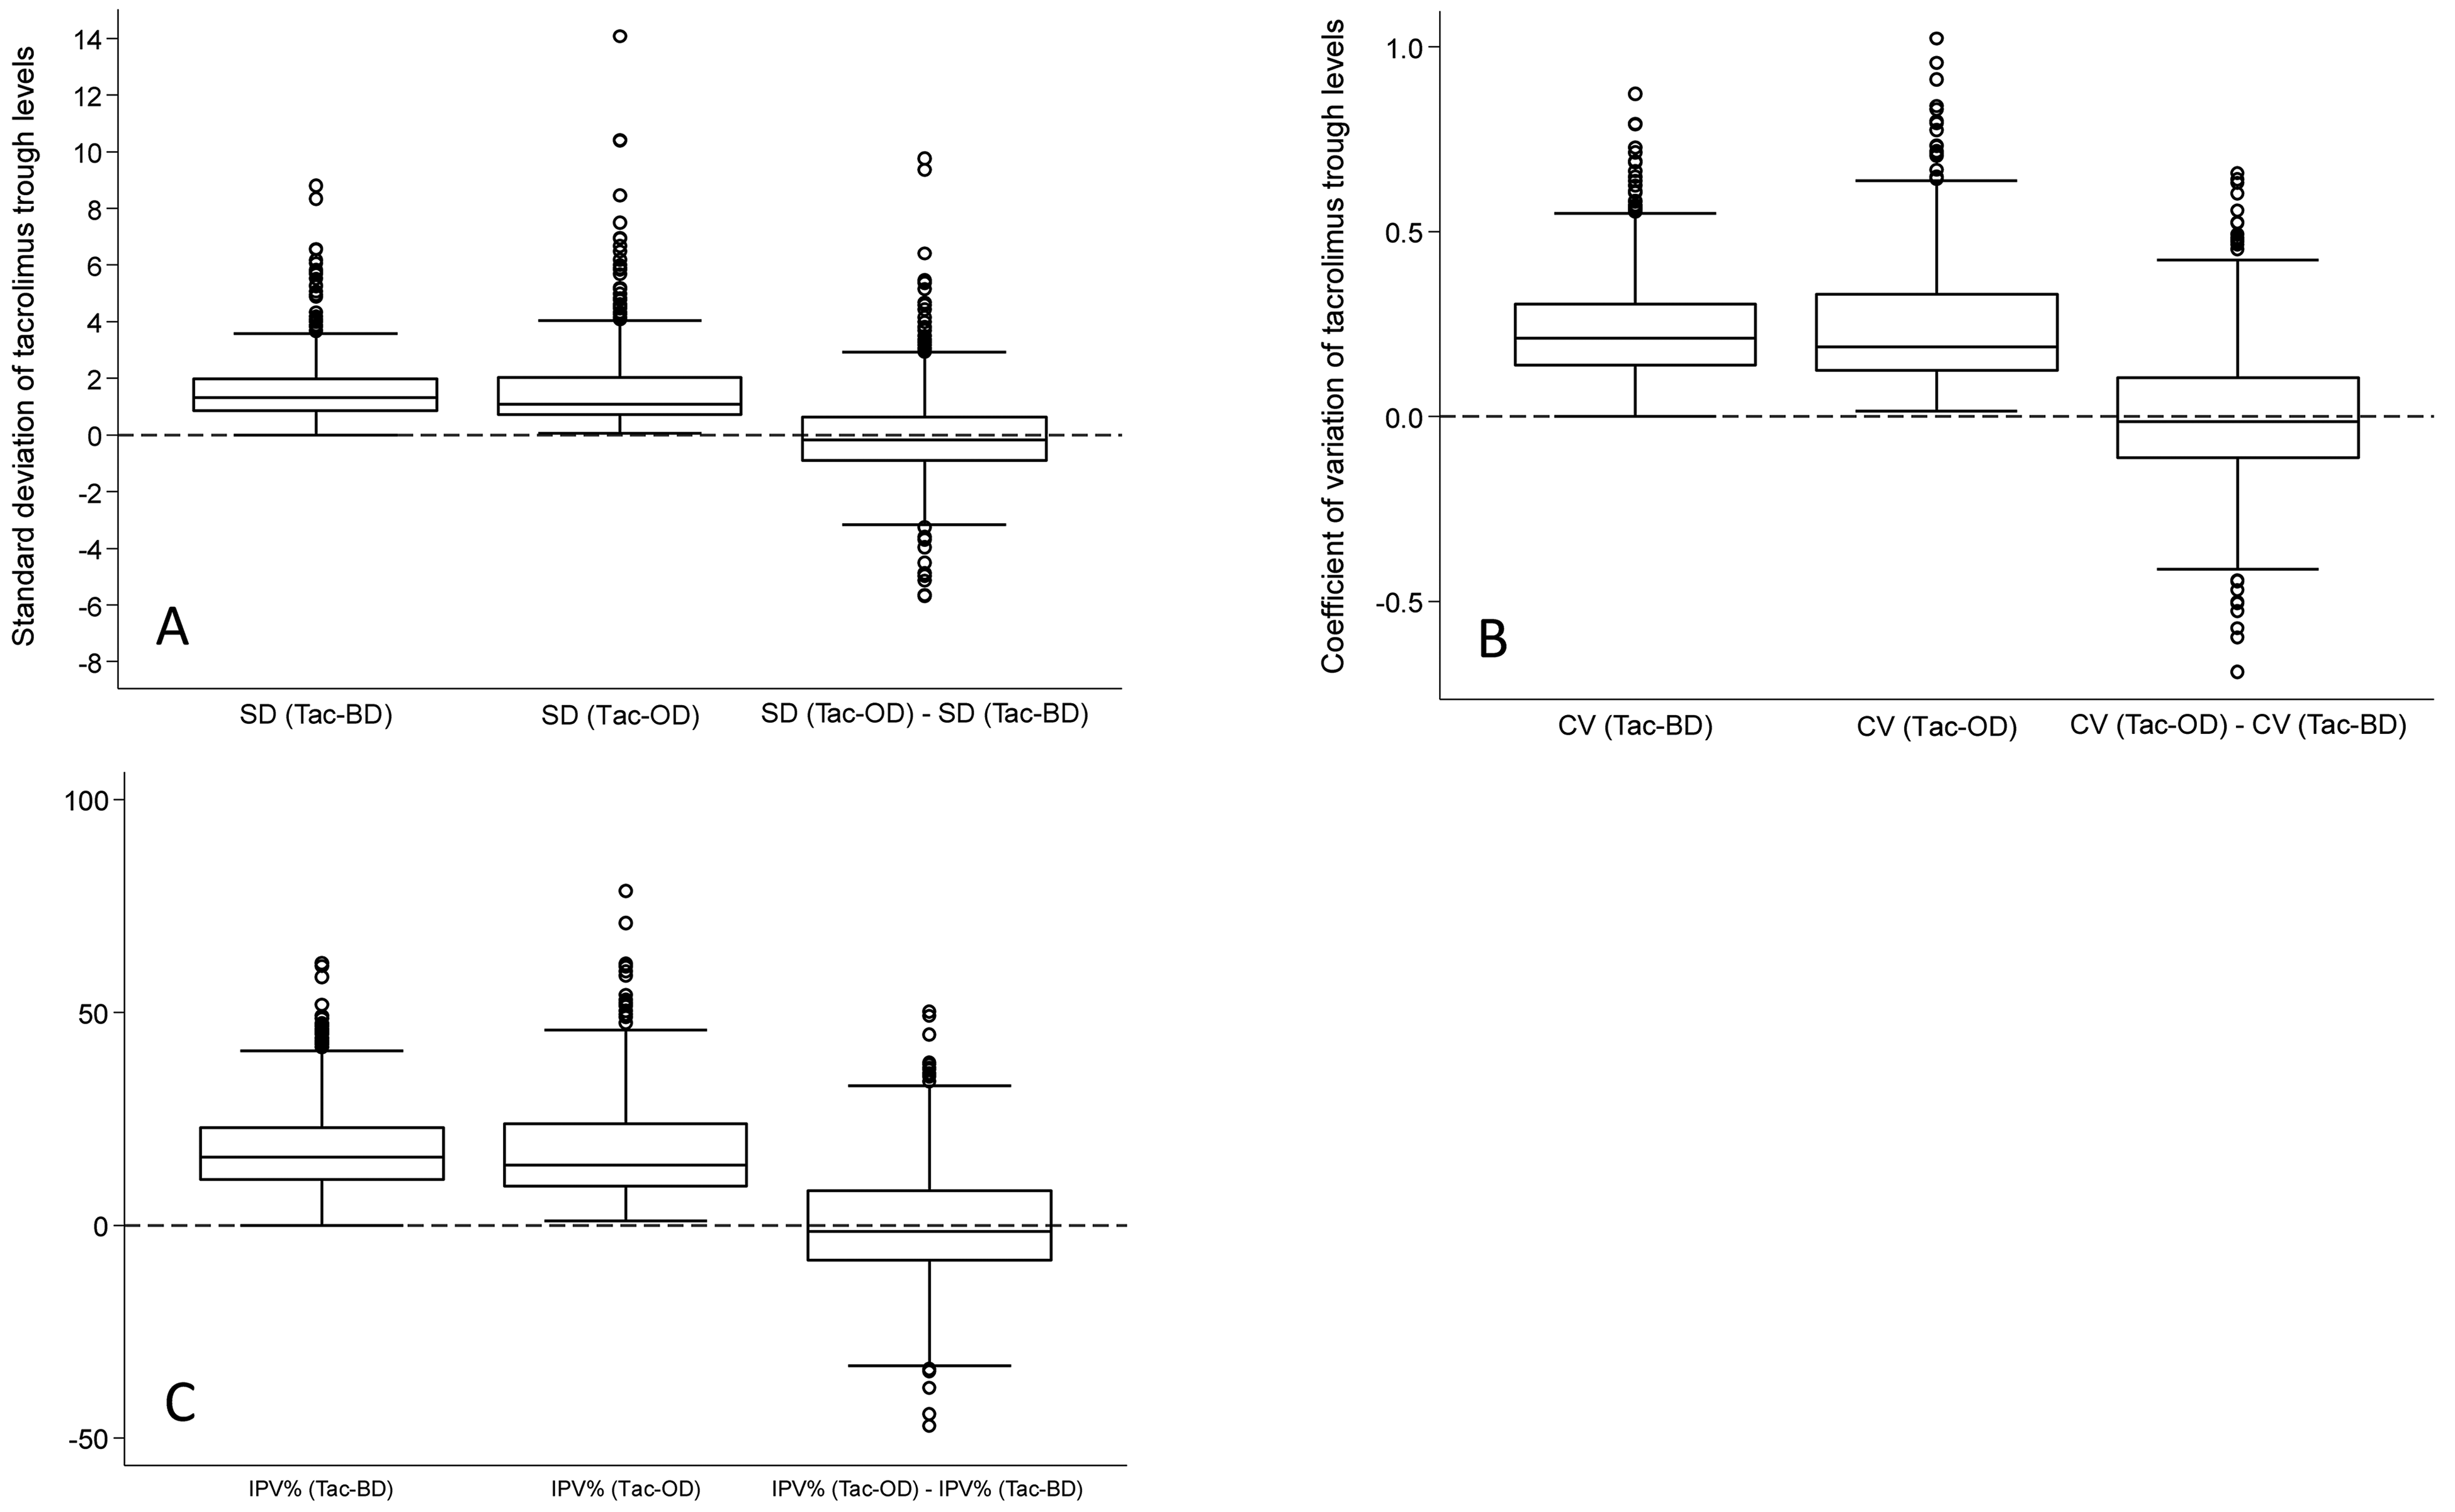
Box plots of measurements of within-patient variability of Tac-BD and Tac-OD and their difference, based on (A) standard deviation, (B) coefficient of variation, and (C) intrapatient variability percent. Abbreviations: CV, coefficient of variation; IPV%, intrapatient variability percent; Tac-OD, once-daily tacrolimus; Tac-BD, twice-daily tacrolimus.
Comparison of Within Patient Variability Between Tac-BD and Tac-OD Using Different Statistical Measures.
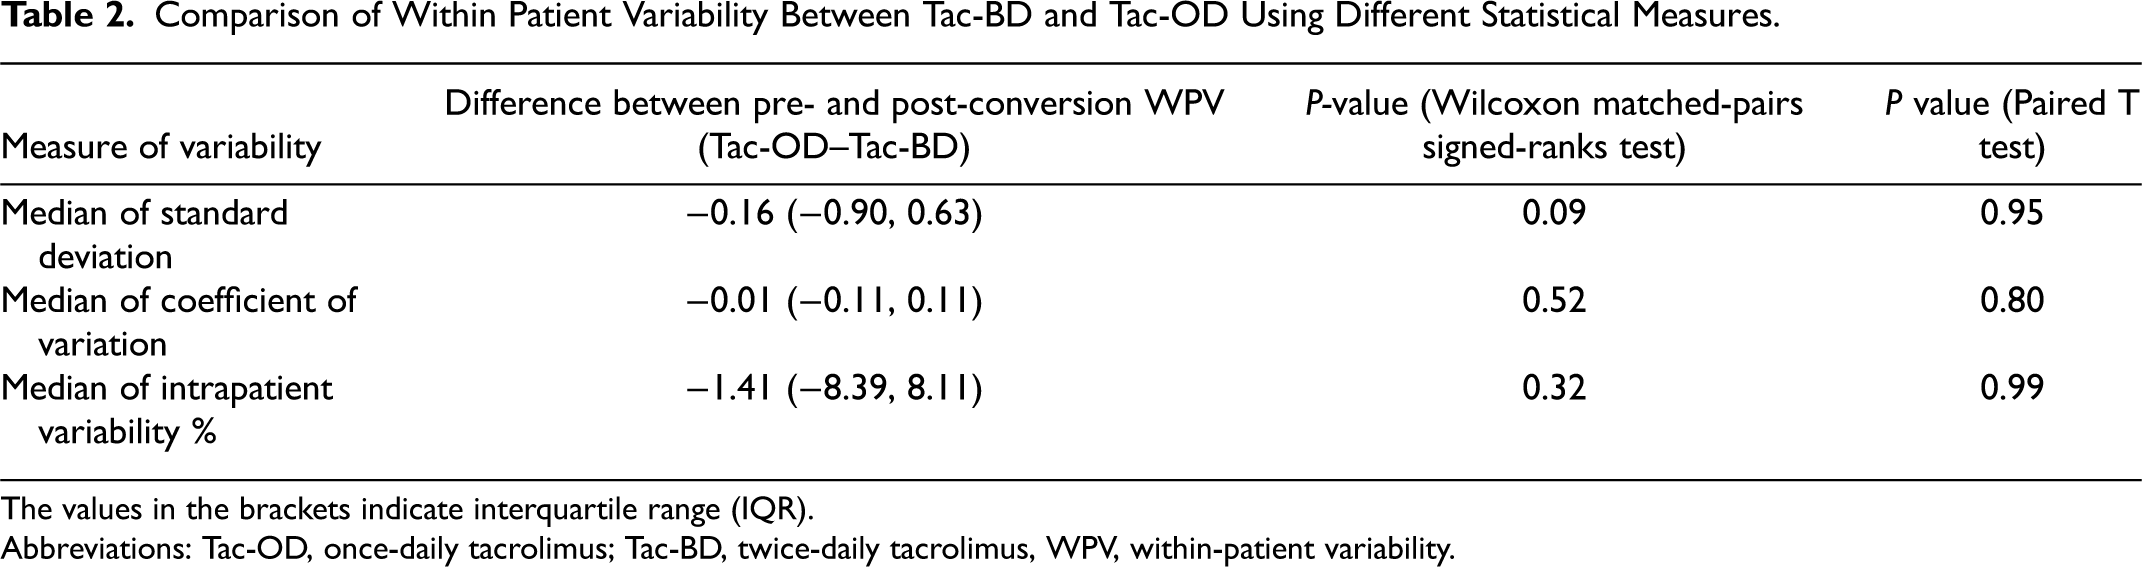
The values in the brackets indicate interquartile range (IQR).
Abbreviations: Tac-OD, once-daily tacrolimus; Tac-BD, twice-daily tacrolimus, WPV, within-patient variability.
Post-Conversion Clinical Outcomes in Relation to Tac-OD Within-Patient Variability
For the analysis of patient outcomes, the median follow-up time beyond one year after starting Tac-OD was 1.69 years [IQR: 1.40, 1.92] or 751 person-years. There was a total of 36 total graft failure events consisting of 17 graft losses and 19 deaths with graft function. The incidence rates per 100 person-years for total graft failure, death-censored graft failure, and death with graft function were 4.80 (95% CI: 3.46, 6.65), 2.26 (95% CI: 1.41, 3.64), and 2.53 (95% CI: 1.61, 3.97), respectively. The cumulative incidence of total graft failure at 24 months after conversion was 8.97% (95% CI: 6.22, 12.85; Figure 3). When Tac-OD WPV was categorized by the median (SD = 0.92, CV = 0.16, and IPV% = 7.7), the incidence of total graft failure was notably elevated in SD and CV groups above the median (vs below the median), but this was not observed for IPV%. Similar patterns were seen with the multivariable Cox proportional hazards model (Supplemental Table 1).
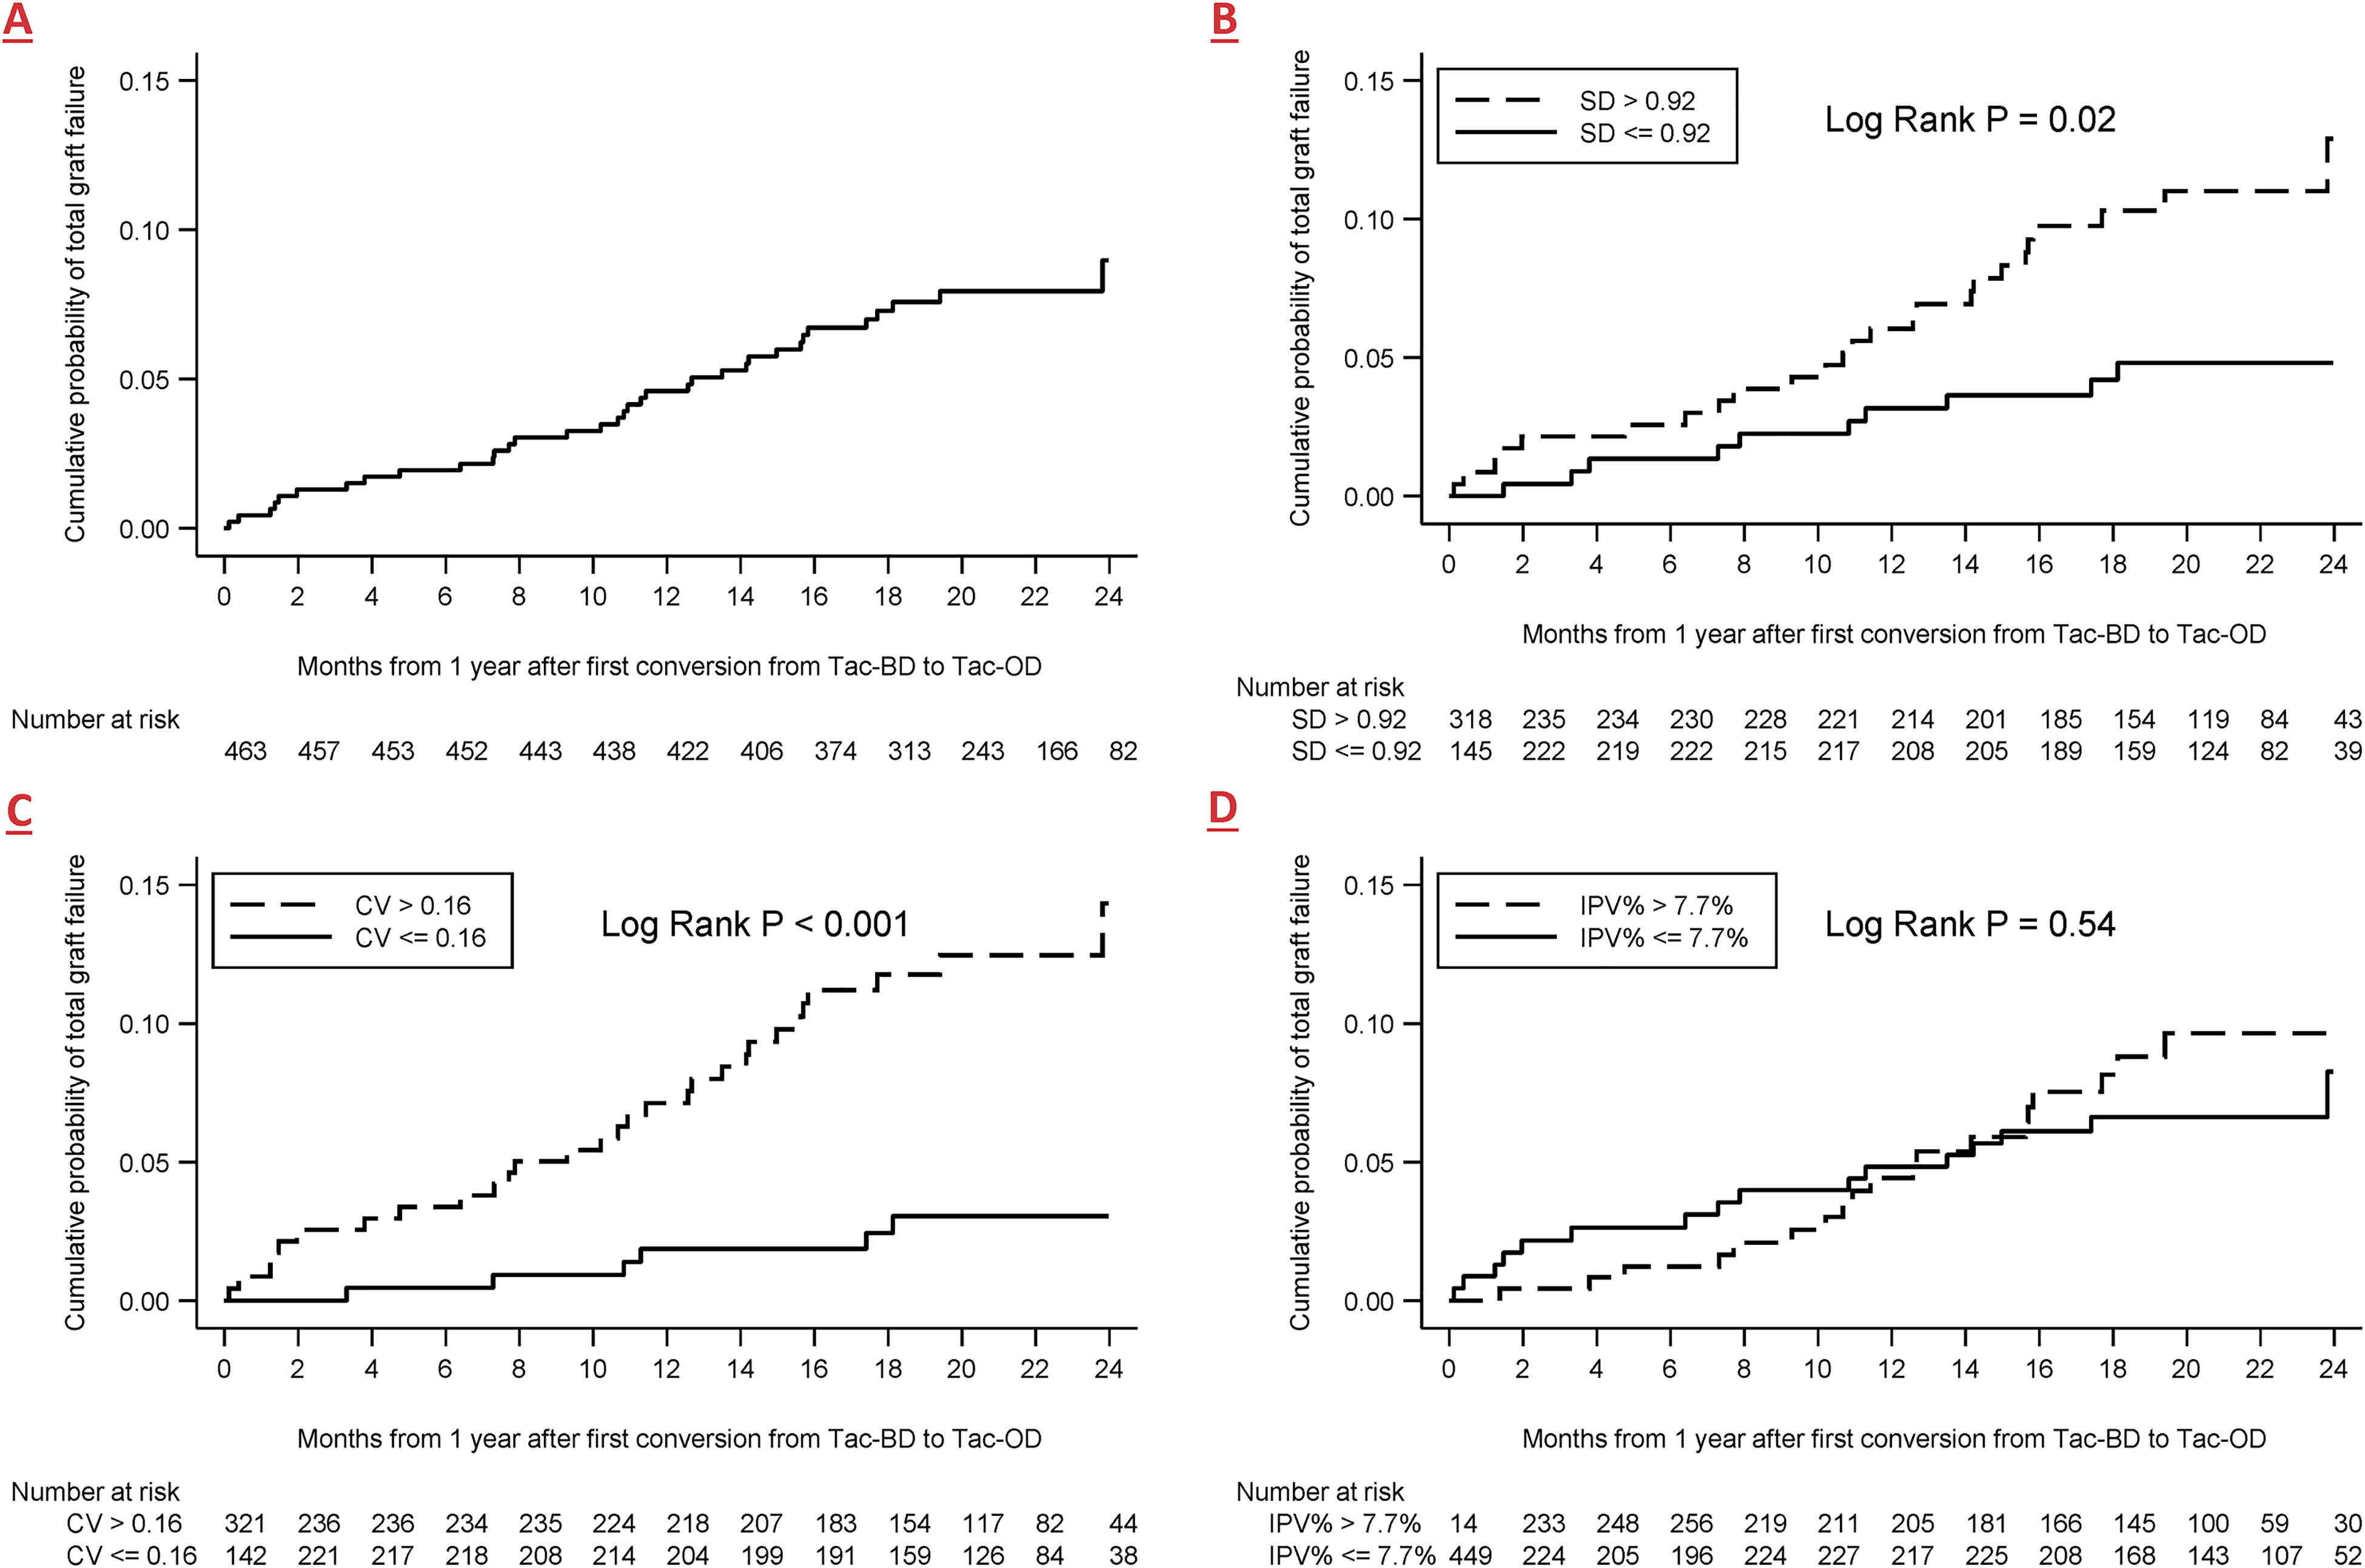
Kaplan-Meier analysis of time to total graft failure for the whole cohort (A), Or stratified by median of (B) standard deviation of Tac-OD, (C) Coefficient of variation of Tac-OD, and (D) intrapatient variability % of Tac-OD. Abbreviations: CV, coefficient of variation; IPV%, intrapatient variability%; KM, Kaplan-Meier; SD, standard deviation; Tac-OD, once-daily tacrolimus; Tac-BD, twice-daily tacrolimus.
When assessing Tac-OD WPV as a continuous variable, every 1 unit increase in SD and IPV% was associated with increased relative hazard for total graft failure and death with graft function. Similarly, every 0.1 unit increase in CV was associated with an increased relative hazard of total graft failure and death with graft function. Increased Tac-OD WPV, as determined by SD, CV, and IPV%, were not clearly associated with death-censored graft failure (
Multivariable Cox Model for Effect of Tac-OD Within Patient Variability (As A Continuous Variable) On Graft Outcomes.
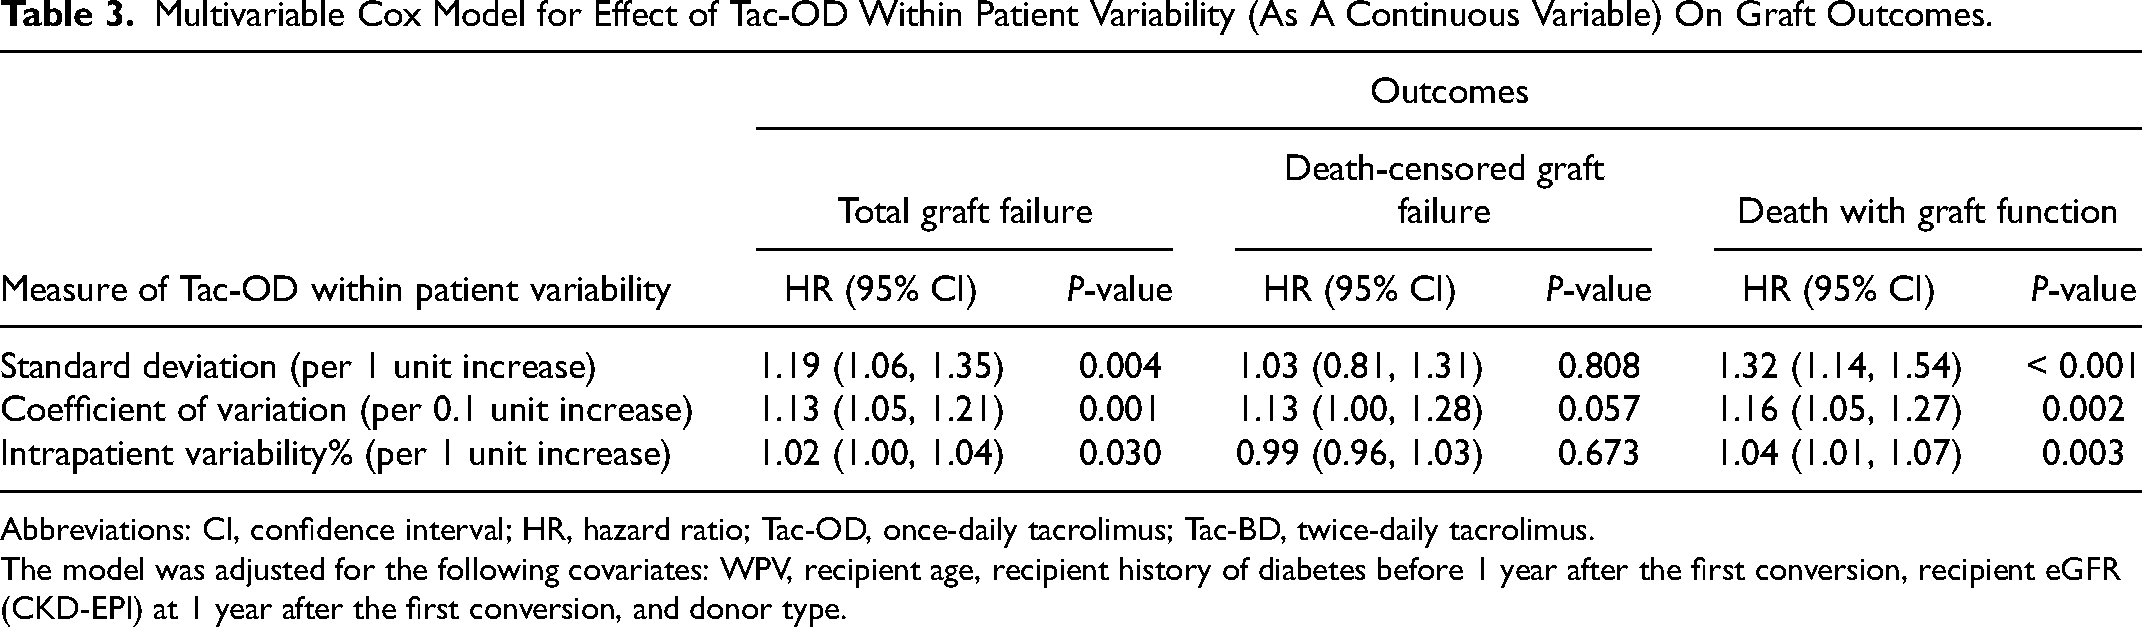
Abbreviations: CI, confidence interval; HR, hazard ratio; Tac-OD, once-daily tacrolimus; Tac-BD, twice-daily tacrolimus.
The model was adjusted for the following covariates: WPV, recipient age, recipient history of diabetes before 1 year after the first conversion, recipient eGFR (CKD-EPI) at 1 year after the first conversion, and donor type.
Sensitivity Analysis
In line with the primary results, the main results between the Tac-BD and Tac-OD medians using the 3 WPV measures were robust to extending the period of observation from 12 to 15 months post-conversion (data not shown). The pattern of results using backward stepwise variable selection for models of WPV as continuous and categorical variables was similar to the main results. However, the estimate for the association of categorized CV and death-censored graft failure did not converge due to the small number of events in that group (data available upon request).
Discussion
The primary objective of this study was to compare WPV of tacrolimus trough levels pre- and post-conversion from Tac-BD to Tac-OD using different measures of variability. Our analyses demonstrated no significant difference between Tac-BD and Tac-OD WPV as determined by SD, CV, and IPV%. The agreement between the three measures suggests that they all exhibit similar sensitivity in detecting variability. This was expected since IPV% is similar to CV and CV is a standardization of SD using the mean. Our results validated previous findings by Shuker et al., 5 Wehland et al., 16 van Hooff et al., 17 and Bunthof et al., 10 who showed no difference in WPV post-conversion using either one of IPV% or CV%. However, Wu et al. 4 demonstrated less WPV post-conversion from Tac-BD to Tac-OD using CV%. Larpparisuth et al. 11 had similar findings. These varying outcomes may be explained by differing cohort sizes and demographics. Different races have been shown to exhibit varying bioavailability and metabolism of tacrolimus.2,7 Both studies were conducted in a predominantly Asian population, whereas our study was done in a Canadian setting with a more racially diverse cohort.
The minimal difference in WPV after conversion may be attributed to our inclusion/exclusion criteria, which required a minimum of 12 months of Tac-BD therapy prior to conversion. Acknowledging the need for more frequent dose adjustments of immunosuppressive medications in the early posttransplant period, we excluded patients within 15 months of their transplant at the time of conversion to ensure there were at least 3 months of stabilization.10,14,18,19 The median time from transplant to conversion was 4.5 years, allowing sufficient time to achieve a stable medication regimen. Despite studies showing that once-daily dosing increased adherence in chronic diseases, 20 Tac-BD and Tac-OD do not seem to exhibit this relationship in patients.21,22 This may be due to polymedication in patients, so one less dose may not decrease the medication administration burden. 22 While our results do not align with some previous findings,4,12 our study contributes to the literature on WPV of Tac-BD to Tac-OD conversion in patients due to the paucity of studies on the effect of conversion on WPV.
The secondary objective was to assess the relationship between different measures of Tac-OD WPV and outcomes 1-year post-conversion. We determined that higher WPV measured by SD and CV was associated with an increased risk of total graft failure. This is concordant with previous reports.8,9,14,23 While Sapir et al. 8 reported that Tac-BD variability above the SD threshold of 2.5 was associated with poorer graft and survival outcomes, our analysis used a Tac-OD SD of 0.92. The narrower distribution of Tac-OD variability can be attributed to a cohort with a stable medication regimen. Furthermore, Borra et al. 9 and Shuker et al. 23 demonstrated that patients had poorer long-term outcomes with WPV CV higher than 14.9% and WPV IPV% higher than 16.2%, respectively. This is similar to our findings of CV greater than 0.16 having a higher likelihood of total graft failure.
When using WPV as a continuous variable, every 0.1 unit increase in WPV CV and every 1 unit increase in WPV SD and IPV% raised the risk of total graft failure and death with graft function. Although total graft failure consists of death with graft function and death-censored graft failure, the increase in Tac-OD WPV was not associated with an increased risk for death-censored graft failure. While necessary to maintain graft survival, long-term immunosuppression may negatively affect other organ systems.24,25 Although higher WPV increased the risk of total graft failure, the risk for death with graft function and death-censored graft failure did not change in the categorical analysis. We suspect this effect may be due to a limited number of total graft failure events.
Previous studies have principally relied on one measure to evaluate WPV, but our study examined WPV using multiple measures. This study was also one of the few to explore WPV using Tac-OD formulation and provided insight into how the WPV of Tac-OD affects patient outcomes. The study avoided the highly reported tacrolimus trough level drop immediately post-conversion by excluding the first 3 months of Tac-OD post-conversion, 26 which would have altered results to indicate more variability with Tac-OD. Finally, our results validate other studies that used different measures to evaluate variability.
This study capitalized on a program-wide Tac-BD to Tac-OD conversion program to examine a clinically relevant issue for which additional research was warranted. The study included a relatively large patient population with multiple measures of drug variability. An analysis of the impact of time-dependent Tac-OD variability on outcomes was included to highlight the implications of variability on patients and their kidney transplants.
Although this study had many strengths, there were some limitations as well. First, only patients eligible for conversion, and those who had an adequate number of drug-level measurements, were included in the cohort. This may limit the generalizability of some of the study's inferences. Second, patients who were part of the conversion program were clinically stable, which would not reflect the WPV and outcomes of patients who required more intensive medical management. Our analysis was done based on the assumption that a study cohort surviving a median of 4.5 years after transplant would have stable medication regimens. Thus, our results may not directly apply to centers that have different conversion protocols. Third, our study allowed for patients with a minimum of two lab values for either tacrolimus formulation to be included. Balancing issues of estimation and sample size informed this choice. The majority of patients had three or more measures (based on the IQR). Fourth, it is not possible to rule out residual confounding variables due to the observational nature of this study. This was partially mitigated by using multivariable analysis and additional backward stepwise selection to identify confounders. Both a priori and backward selection approaches led to four covariates plus WPV in the model. With 36 total graft failure events, the model was somewhat underpowered. However, the benefits of greater bias reduction may help to offset any losses in precision. Finally, since the conversion program occurred in September 2012, the data were older. This was a unique opportunity to study WPV before and after a program-wide switch in a large kidney transplant center. Clinical practice has changed little since then, so the results remain relevant today.
Conclusion
Our findings suggest that WPV between Tac-BD and Tac-OD was similar in a stable conversion population of patients. It also provided further evidence that high WPV was associated with poorer graft outcomes. Any of the three measures (SD, CV, IPV%) could be used to develop a decision support system to monitor WPV since they all produced similar results. This system could allow practitioners to detect and further investigate patients with high WPV. Although reducing WPV in all patients may improve long-term outcomes, targeting those with higher WPV would be a more effective use of medical resources. Clinical trials to test tacrolimus WPV monitoring systems (e.g., using electronic health records), and the application of interventions in response to increased WPV, will provide the next step in translating the findings of this research into medical practice.
Supplemental Material
sj-docx-1-pit-10.1177_15269248221145044 - Supplemental material for Tacrolimus Formulation, Exposure Variability, and Outcomes in Kidney Transplant Recipients
Supplemental material, sj-docx-1-pit-10.1177_15269248221145044 for Tacrolimus Formulation, Exposure Variability, and Outcomes in Kidney Transplant Recipients by Elaine F. Lai, Huong Thao Nguyen, Olusegun Famure, Yanhong Li and S. Joseph Kim in Progress in Transplantation
Footnotes
Acknowledgments
The authors thank Jennifer Harrison, BScPhm, MSc, for her guidance and insights on immunosuppressive medications and regimens, and Edilyn Llameg, RN, for her explanations of the tacrolimus conversion program.
Declaration of Conflicting Interests
The authors declared no potential conflicts of interest with respect to the research, authorship, and/or publication of this article.
Funding
The authors received no financial support for the research, authorship, and/or publication of this article.
Supplemental Material
Supplemental material for this article is available online.
References
Supplementary Material
Please find the following supplemental material available below.
For Open Access articles published under a Creative Commons License, all supplemental material carries the same license as the article it is associated with.
For non-Open Access articles published, all supplemental material carries a non-exclusive license, and permission requests for re-use of supplemental material or any part of supplemental material shall be sent directly to the copyright owner as specified in the copyright notice associated with the article.