
Abstract
Purpose:
The goal of the study described in this protocol is to build a multimodal artificial intelligence (AI) model to predict abdominal aortic aneurysm (AAA) shrinkage 1 year after endovascular aneurysm repair (EVAR).
Methods:
In this retrospective observational multicenter study, approximately 1000 patients will be enrolled from hospital records of 5 experienced vascular centers. Patients will be included if they underwent elective EVAR for infrarenal AAA with initial assisted technical success and had imaging available of the same modality preoperatively and at 1-year follow-up (CTA-CTA or US-US). Data collection will include baseline and vascular characteristics, medication use, procedural data, preoperative and postoperative imaging data, follow-up data, and complications.
Proposed Analyses:
The cohort will be stratified into 3 groups of AAA remodeling based on the maximum AAA diameter difference between the preoperative and 1-year postoperative moment. Patients with a diameter reduction of ≥5 mm will be assigned to the AAA shrinkage group, cases with an increase of ≥5 mm will be assigned to the AAA growth group, and patients with a diameter increase or reduction of <5 mm will be assigned to the stable AAA group. Furthermore, an additional fourth group will include all patients who underwent an AAA-related reintervention within the first year after EVAR, because both the complication and the reintervention might have influenced the state of AAA remodeling at 1 year. The preoperative and postoperative CTA scans will be used for anatomical AAA analysis and biomechanical assessment through semi-automatic segmentation and finite element analysis. All collected clinical, biomechanical, and imaging data will be used to create an AI prediction model for AAA shrinkage. Explainable AI techniques will be used to identify the most descriptive input features in the model. Predicting factors resulting from the AI model will be compared with conventional univariate and multivariate logistic regression analyses to find the best model for the prediction of AAA shrinkage. The study is registered at www.clinicaltrials.gov under the registration number NCT06250998.
Clinical Impact
This study aims to develop a robust and high-performance AI model for predicting AAA shrinkage one-year after EVAR, with great potential for optimizing both EVAR treatment and follow-up. The model can identify cases with an initially lower chance of early AAA shrinkage, in whom EVAR-treatment could be tailored by including additional preoperative coil embolization, active sac management and/or postoperative tranexamic acid therapy, which have shown to promote AAA shrinkage rate but are too complex and costly to perform in all patients. The model could aid in stratification of post-EVAR surveillance based on the patient’s individual risk and possibly decrease follow-up for the 40-50% of patients who will experience AAA sac shrinkage. Overall, the AI prediction model is expected to improve patient survival and decrease the number of reinterventions after EVAR and associated healthcare costs.
Keywords
Introduction
The ultimate goal of abdominal aortic aneurysm (AAA) repair is to prevent AAA rupture and subsequent mortality. When comparing endovascular aneurysm repair (EVAR) with open surgical repair (OSR), EVAR has an early benefit regarding morbidity and mortality. However, the long-term reintervention rate, rupture risk, and mortality rates of EVAR are still higher when compared with OSR.1,2
Abdominal aortic aneurysm remodeling after EVAR has repeatedly been associated with long-term EVAR outcomes. Abdominal aortic aneurysm sac expansion of ≥5 mm is thought to represent treatment failure, whereas AAA shrinkage generally indicates successful exclusion of the AAA from systemic circulation and predicts a low risk of failure during the first 5 postoperative years.3–5 Until recently, a stable sac diameter was associated with treatment success. O’Donnell et al 6 however, reported in a study with >30 000 EVAR patients that not only sac expansion, but any failure of the sac to regress after EVAR is associated with higher long-term mortality, independent of reinterventions or the presence of endoleaks. Houbballah et al 5 reported that patients with significant AAA sac shrinkage had significantly lower rates of endoleak types 1 and 2, reinterventions, and rupture compared with patients without shrinkage. This was confirmed in a meta-analysis, which also showed that only AAA shrinkage 1 year after EVAR was correlated with a significantly lower rate of reinterventions, late complications, and rupture. 7 Therefore, the view is gradually shifting from AAA growth as a predictor of treatment failure to AAA shrinkage as a predictor of successful treatment.
However, it is still uncertain what factors cause the aneurysm to shrink in one patient and to remain stable in another, and how these factors might interact with each other. Several separate single-center and multi-center studies have found significant associations between AAA shrinkage and clinical variables, such as age, hypercholesterolemia, chronic obstructive pulmonary disease, smoking, renal impairment, presence of a renal cyst, smoking, oral anticoagulant use, presence of endoleaks, C-reactive protein levels.8–14 Furthermore, literature on anatomical predictors showed significant relations between AAA shrinkage and preoperative AAA diameter, lumen diameter, presence of posterior thrombus, thrombus thickness, infrarenal angle, patency of lumbar arteries, and mean thrombus stress.9,11–15 However, despite these efforts, strong convincing evidence of predictors of AAA shrinkage 1 year after EVAR is still missing.
Artificial intelligence (AI) plays an increasingly important role in AAA management and is described as a promising technique to develop aid-decision support for vascular diseases. 16 A multi-modal AI model uses various data types and can aid in uncovering patterns behind biological or disease processes. By nature, AI algorithms are closed systems, or “black boxes,” which are difficult to interpret. These black boxes can be opened with the so-called explainable AI techniques to better analyze the predictive value of the different factors studied. This may lead to improved patient management in clinical practice, as well as new insights into the biological processes.
The aim of this study is to develop a multi-modal AI model to identify predictors of AAA shrinkage 1 year after EVAR, as this indirectly predicts long-term EVAR outcomes. It is anticipated that this multimodal approach will lead to improved performance in personalized AAA sac remodeling prediction. Explainable AI techniques will be used to gain insight into the process behind AAA shrinkage. Moreover, conventional multivariate analysis methods will be applied and compared with the predictions of the multimodal AI model to assess which model is best in predicting AAA shrinkage 1 year after EVAR. The best model could aid differentiation between patients who will benefit greatly from EVAR and those who will benefit less, which could be implemented in treatment optimization and the creation of a patient-specific risk-stratified follow-up program after EVAR.
Methods
Study Design and Patient Population
The primary goal of this retrospective observational multicenter study is to build a multimodal prediction model for AAA shrinkage 1 year after EVAR. Its secondary objective is to identify new factors that play a role in aneurysm remodeling after EVAR. The regional Human Research Committee declared that the study is not subject to the Medical Research Involving Human Subjects Act as it is an observational study using retrospective data (case number: 2021-13304). Also, the institutional review boards approved for data collection and publication. Currently, the study is registered on clincialtrials.gov (identifier: NCT06250998). The Checklist for Artificial Intelligence in Medical Imaging (CLAIM) 17 and the framework for AI-based prediction models in health care 18 will be followed.
Approximately 1000 patients will be enrolled from the hospital records of 5 experienced vascular centers. These five centers together form the RADAR consortium for pRediction of AbDominal aortic Aneurysm Remodeling after EVAR. Detailed information about the consortium and its partners can be found at www.radarconsortium.com.
Patients will be included if they underwent elective EVAR for infrarenal AAA with initial assisted technical success and had the same imaging modalities available preoperatively and at 1-year follow-up (CTA-CTA or US-US). 19 Because of known poor agreement in diameter measurement between CTA and ultrasound imaging, the category of AAA remodeling can only validly be determined by comparing the preoperative and postoperative diameters within the same imaging modality. 20 Only patients who were treated with endografts that are still used in current clinical practice will be included in the study—including the Excluder (W.L. Gore and Associates, Flagstaff, Arizona), Excluder Conformable (W.L. Gore and Associates), Endurant (Medtronic, Minneapolis, Minnesota), Zenith (Cook, Bloomington, Indiana), Incraft (CardinalHealth, Dublin, Ireland), AFX (Endologix, Irvine, California), Anaconda (Terumo Aortic, Inchinnan, UK), TREO (Terumo Aortic), E-tegra (Artivion, Kennesaw, Georgia) endografts. Patients treated with fenestrated or branched endografts, iliac branched devices, non-CE marked devices within a trial setting, or chimney procedures will be excluded, as well as patients with inflammatory, mycotic, symptomatic, ruptured, juxtarenal, suprarenal, thoracic, and thoracoabdominal aneurysms. Required data consist of the DICOM file of the preoperative CTA scan and clinical follow-up data of at least 1 year, including AAA imaging.
Definitions and Data Collection
Data collection will include baseline characteristics (such as age, sex, and medical history), vascular characteristics, medication use, procedural data, preoperative and postoperative imaging data, follow-up data, and complications. Technical success, aneurysm sac changes, and endoleaks will be defined as described by the Society for Vascular Surgery reporting standards. 21 Data will be collected until the latest moment of follow-up. For the clinical data collection and management, a validated software will be used, Research Manager (Research Manager, Deventer, The Netherlands). For the imaging data collection and management, XNAT open-source imaging informatics software (www.xnat.org) will be used.
Sample Size Calculation
The population, model, event rates, and number of predictors affect the required sample size. However, a recent paper about sample sizes for machine learning showed the diminishing returns of including more than 1000 patients, including a range of simulations with datasets with both good and poor effect sizes. 22 Therefore, when training a machine learning model with approximately 1000 patients, the accuracy and the effect size for a range of models are at their maximum and will no longer increase any further when using larger sample sizes. 22 This indicates that our anticipated sample size of 1000 patients will allow for a machine learning model with sufficient effect size and accuracy, although its final performance will also depend on the data quality. 22 For the multivariable logistic regression analysis, this sample size of 1000 patients is also sufficient and allows for 28 predictors in the model, even with a conservative expected population R2 (Nagelkerke) of .3 and the anticipated prevalence of AAA shrinkage of 41%.23,24
Proposed Analyses
Figure 1 shows a schematic overview of the workflow for the data collection, preprocessing, and analysis.
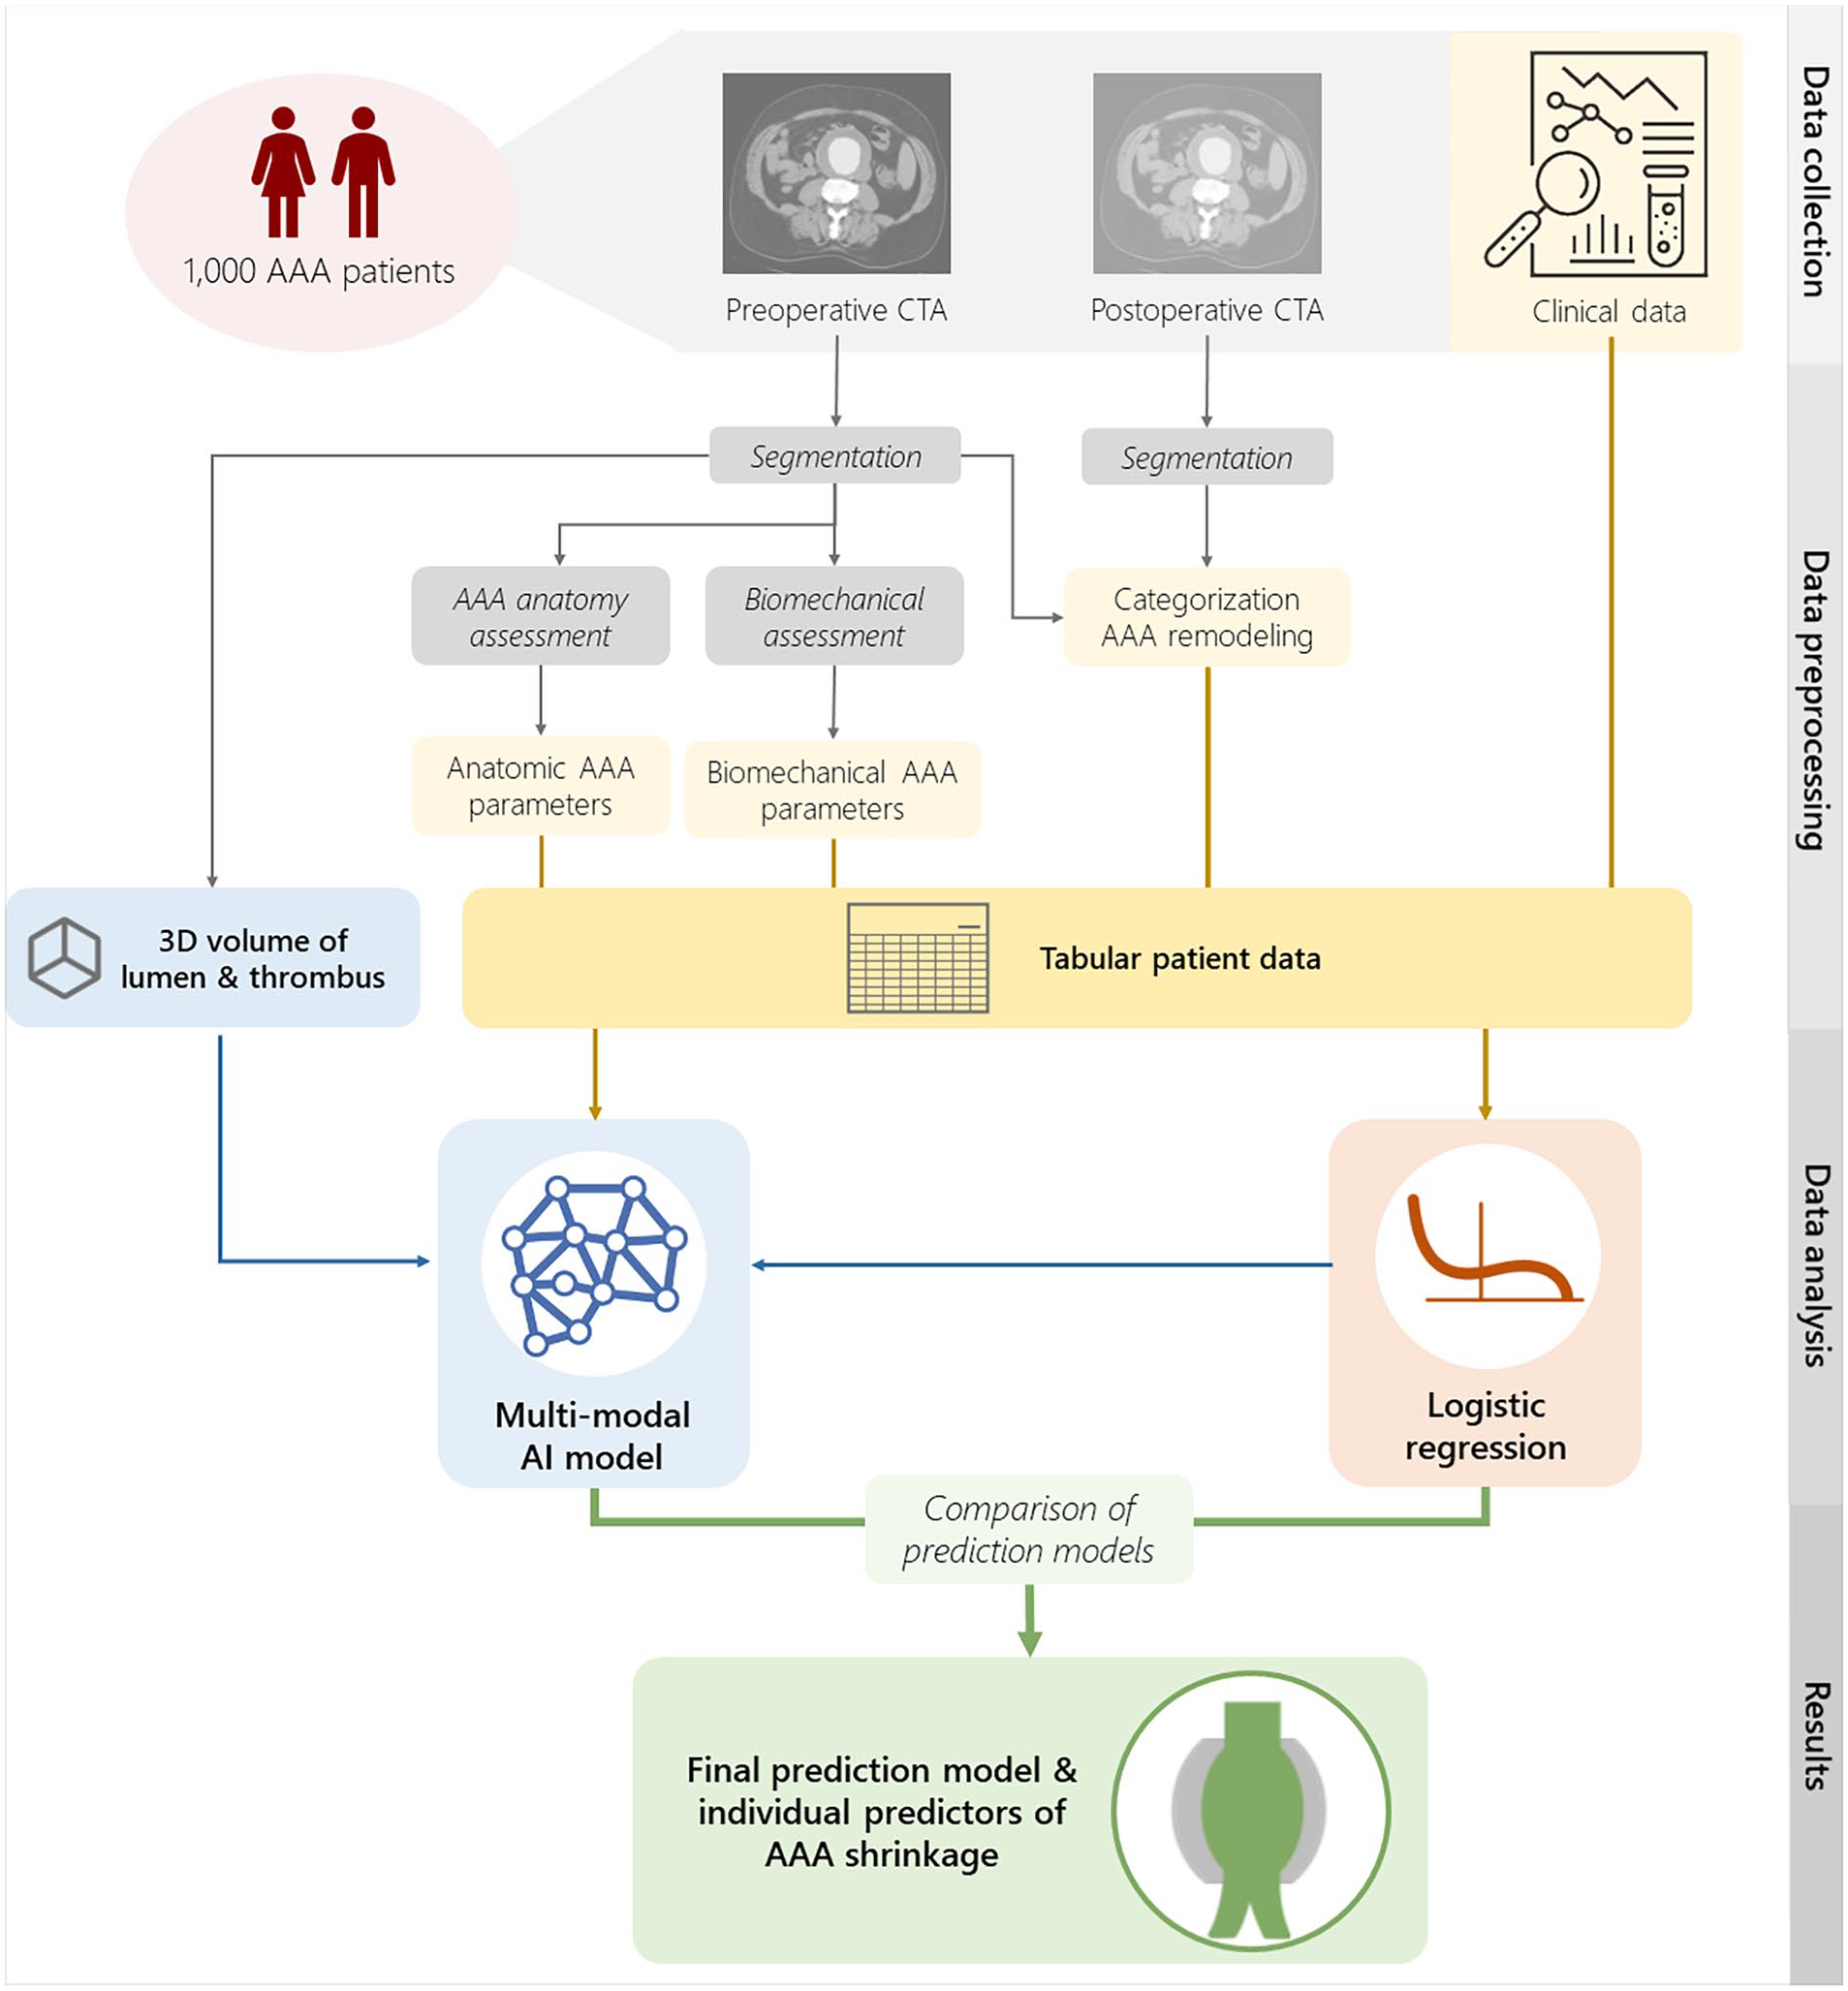
Schematic overview of the data collection, preprocessing, and data analysis.
The included patients will be stratified into 3 groups of AAA remodeling based on the maximum AAA diameter difference between the preoperative and 1-year postoperative imaging. Following the SVS reporting standards, patients with a diameter reduction of ≥5 mm will be assigned to the AAA shrinkage group, cases with a diameter increase of ≥5 mm will be assigned to the AAA growth group, and patients with a diameter increase or reduction of <5 mm will be assigned to the stable AAA group. 21 Furthermore, an additional fourth group will include all patients who underwent an AAA-related reintervention within the first year after EVAR, because both the complication and the reintervention might have influenced the state of AAA remodeling at 1 year.
For this stratification, the maximum AAA diameters will be extracted automatically from the AAA segmentations of the preoperative and 1-year postoperative CTA scans. If there is no 1-year post-EVAR CTA available, the group of AAA remodeling will be determined using the maximum AAA diameters as measured on ultrasound at both time points.
The preoperative and postoperative (up until the 1-year visit) CTA scans will be used for automatic segmentation of the AAA lumen and thrombus using an AI model for AAA diameter measurements. It is followed by semi-automatic segmentation of the external aneurysm wall and finite element analysis for biomechanical assessment of the AAA.14,25 In addition, the 3-dimensional volumes of the preoperative AAA lumen and thrombus segmentations and additional anatomical measurements will be used as an input parameters for the multimodal AI prediction model.
Baseline characteristics will be presented as means ± standard deviations, or median followed by interquartile range, if applicable, for continuous variables and as counts and percentages for categorical variables. Normality will be determined using Shapiro-Wilk test. The baseline characteristics will be computed for the total patient population and also stratified by the 4 AAA remodeling groups. To identify significant differences between the groups, continuous baseline variables will be compared using unpaired Student t test and categorical baseline variables will be compared using the χ2 test (or Fisher exact test, where appropriate). Freedom from death will be analyzed for all groups using Kaplan-Meier analysis with corresponding log-rank test. All statistical analyses will be performed using IBM SPSS Statistics (SPSS version 29.0 for Windows; IBM Corporation, Armonk, New York), where a p value <0.05 is considered statistically significant.
Conventional univariate and multivariate logistic regression analyses will be performed first to create a baseline to compare the AI model to. The maximum number of variables included in the multivariable logistic regression model is determined by the minimum number of events in either class, that is, the number with or without shrinkage. The maximum number of parameters is calculated by dividing this number by 10. 26 Deciding which specific variables to include will be based on possible collinearity, expectations of the predictive value, and p value of the univariate analysis. All variables with a p value below 0.25 will be considered for inclusion, as they can adjust the effects of other variables in the model, even if they do not have any significant p-value themselves. 27 For the resulting variables, a manual stepwise logistic regression analysis will be performed, using Enter, by removing the variable with the largest p-value per step, until the remaining variables have a significant p value. These variables will then be entered in the final multivariate logistic regression analysis with the Enter method.
For the predictive AI model, machine learning models will be considered that are specifically designed to learn and predict based on multi-modal data, such as multiple kernel learning, 28 graph neural networks, 29 and cross-modal transfer learning. 30 The collected clinical, biomechanical, and imaging data from all patients will be separated into a training, validation, and test set according to a 60:20:20 ratio. The training set will be used to optimize the parameters of the machine learning models, the validation set will be used to select proper hyperparameters for our problem (such as the number of decision trees or the number of neural network layers), and the test set will be used for final quantitative evaluation of the method.
By nature, the trained AI model is a closed system, or “black box,” which is difficult to interpret. We will open the black box with explainable AI techniques to identify the most descriptive input features of the model, to know precisely which factors can predict AAA shrinkage. Explainability is defined differently for different AI models. Therefore, the method will be selected based on the used AI model, that is, in multiple kernel learning, we can interpret the weights assigned to different features, and in graph neural networks, we can visualize learned edge weights in out multi-modal graph. Moreover, more advanced tools for interpretability will be used, such as a graph explainability library GraphXAI. 31 The predicting factors resulting from the machine learning algorithm will be compared with conventional univariate and multivariate logistic regression analyses to find the best model for the prediction of AAA shrinkage.
So, in conclusion, the aim of this retrospective observational multicenter study is to build a multimodal prediction model for AAA shrinkage 1 year after EVAR, as this indirectly predicts long-term EVAR outcomes. Its secondary objective is to identify new factors that play a role in aneurysm remodeling after EVAR. The project is expected to last for about a year and be finished in the first half of 2025. Better understanding of the factors that play a role in AAA sac remodeling after EVAR can help to optimize EVAR treatment and to create a patient-specific risk-stratified post-EVAR surveillance protocol. Future studies could then investigate the clinical impact of the developed AI model on AAA care. Overall, the AI prediction model is expected to improve patient survival, decrease the number of reinterventions after EVAR, and reduce the associated health care costs.
Footnotes
Authors’ Note
One of the authors of this article is the Editor in Chief of the journal. To avoid a conflict of interest, an alternate member of the Editorial Board handled this submission.
Declaration of Conflicting Interests
The author(s) declared no potential conflicts of interest with respect to the research, authorship, and/or publication of this article.
Funding
The author(s) disclosed receipt of the following financial support for the research, authorship, and/or publication of this article: The research of this article was supported by Stichting Lijf en Leven [project number 71]. KK Yeung received an unrestricted research grant from W.L. Gore & Associates on this subject.