
Abstract
Purpose:
Unfractionated heparin is widely used to lower the risk of arterial thromboembolic complications (ATECs) during interventions for peripheral arterial disease (PAD), but it is still unknown which heparin dose is the safest in terms of preventing ATECs and bleeding complications. This study aims to evaluate the incidence of complications during interventions for PAD and the relation between this incidence and different heparinization protocols.
Materials and Methods:
A retrospective analysis of a prospective multicenter cohort study was performed. Between June 2015 and September 2022, 355 patients who underwent peripheral interventions for PAD were included. All patients who were included before July 2018 received 5000 international units (IU) of heparin (group 1). Starting from July 2018, all included patients received an initial dose of 100 IU/kg, with potential additional heparin doses based on activated clotting time (ACT) values (group 2). Data on ACT values and complications within 30 days post-procedurally were collected.
Results:
In total, 24 ATECs and 48 bleeding complications occurred. In group 1, 8.7% (n=11) of patients suffered from ATEC, compared with 5.7% (n=13) in group 2. Thirteen percent of patients (n=17) in group 1 had a bleeding complication, compared with 14% (n=31) in group 2. Arterial thromboembolic complications were more often found in patients with peak ACT values of <200 seconds, compared with ACT values between 200 and 250 seconds, 15% (n=6) versus 5.9% (n=9), respectively, p=0.048. Patients with peak ACT values >250 seconds had a higher incidence of bleeding complications compared with an ACT between 200 and 250 seconds, 24% (n=21) versus 9.8% (n=15), respectively, p=0.003. Forty-four percent of patients (n=23) in group 1 reached a peak ACT of >200 seconds, compared with 95% (n=218) of patients in group 2 (p=0.001).
Conclusion:
ATEC was found in 6.8% (n=24) and bleeding complications in 14% (n=48) of patients who underwent a procedure for PAD. There was a significantly higher incidence of ATECs in patients with a peak ACT value <200 seconds, and a higher incidence of bleeding complications in patients with a peak ACT value >250 seconds. The findings obtained from this study may serve as a basis for conducting future research on heparinization during procedures for PAD, with a larger sample size.
Clinical Impact
Heparin is administered during arterial interventions for peripheral arterial disease (PAD) to decrease the risk of arterial (thrombo)embolic complications (ATEC) during or shortly following surgery. The effect of heparin is unpredictable in the individual patient, and the optimal dosage of this anticoagulant has not yet been established. Using the activated clotting time (ACT), the anticoagulatory effect of heparin can be monitored periprocedurally. Previous research on the incidence of both ATEC and bleeding complications, or on the optimal dosage of heparin administration, is scarce. This study aims to investigate the incidence of ATEC and bleeding complications between 2 different dosage protocols of heparin—a standard bolus of 5000 IU or ACT-guided heparinization—and thereby provide clarity on the optimal dose of heparin during peripheral arterial interventions for PAD.
Introduction
Peripheral arterial disease (PAD) is the third leading clinical presentation of atherosclerosis, after stroke and coronary artery disease.1,2 The prevalence of PAD has increased with 17% in 2015, compared with 2010, 2 contributing to a great burden of disease worldwide.2–5
Interventions for PAD consist of percutaneous transluminal angioplasty (PTA) with or without stenting, open bypass surgery, or open (thrombo)endarterectomy (TEA).5,6 During these noncardiac arterial procedures (NCAP), unfractionated heparin is the most commonly used periprocedural form of prophylactic anticoagulation worldwide.7–13 Despite its daily use, there is still no scientific consensus on what the optimal dose of heparin is in NCAP, with lowest risk of arterial thromboembolic complications (ATEC) or bleeding complications.
Up to now, a fixed bolus of 5000 international units (IU) of heparin is the most commonly used dosage of unfractionated heparin during NCAP.7,8,14,15 However, there is increasing evidence that 5000 IU of heparin does not provide an adequate anticoagulatory effect in a majority of patients.14,16 Heparin has a nonlinear dose response curve, making the anticoagulatory effect unpredictable in the individual patient.11,17–19 The effect of heparin can be monitored by measuring the activated clotting time (ACT): the time in seconds it takes for whole blood to clot after being exposed to an activator. The ACT is a point of care test, making the measurements easily accessible and therefore a practical way to test the coagulation during surgery.16,20,21 To provide an adequate level of anticoagulation and manage the unpredictability of heparin, ACT-guided heparinization is gaining popularity among surgeons and angiologists.8,13 Nonetheless, according to recent literature, the applications of heparin remain guided by historical experience rather than robust clinical trials. This literature also emphasizes the necessity for further investigative studies to evaluate the indication, optimal dosing, and monitoring required for heparin use. 22
To evaluate the effectiveness of intraoperative heparin administration and monitoring with ACT during NCAP, a prospective data registry (MANCO [measuring the ACT during NCAP], NCT number: NCT03426293) was created. The secondary outcome measure was the incidence of complications after a bolus of 5000 IU of heparin or an ACT-guided heparinization protocol. The previous analyses from the MANCO registry mainly focused on designing a safe and effective ACT-guided heparinization protocol.14,16,23 However, with the increasing study population of the MANCO registry, more clarity can be achieved on the incidence of ATEC and bleeding complications during and after interventions for PAD as previous research on this subject is scarce. Therefore, the aim of this study was to analyze the incidence of ATEC and bleeding complications during interventions for PAD and compare these adverse events between 2 heparin dosing protocols and explore optimal ACT range.
Materials and Methods
Study Design
This study is a retrospective analysis of the ongoing, prospective database of the MANCO registry, designed to investigate the optimal heparin dose protocol and optimal ACT values during NCAP. The MANCO registry is registered at clinicaltrials.gov (NCT number: NCT03426293) and encompasses data of patients above 18 years of age who underwent NCAP in Dijklander Hospital Hoorn and Amsterdam UMC location VUmc, the Netherlands. This registry includes patients from June 2015 onward. The Medical Ethical Committee of Noord-Holland reviewed the MANCO-trial protocol, and local permission was gained from all participating hospitals. An opt-out procedure for informed consent was carried out. Exclusion criteria were emergency procedures, patients with coagulation disorders, or an estimated glomerular filtration rate (eGFR) below 30 mL/min.
In this sub-analysis of the MANCO registry, data were used from patients who underwent one of the following procedures: peripheral endarterectomy, peripheral bypass surgery, or PTA either with or without stent placement. Data were collected from June 2015 until September 2022.
Primary endpoints were the incidence of ATEC and bleeding complications during procedures for PAD, and the relation between this incidence, the 2 heparinization protocols, and ACT values.
Heparin Administration and ACT Measurements
All patients who were included before July 2018 received 5000 IU of heparin (group 1). Starting from July 2018, all included patients received ACT-guided heparinization (group 2).
Group 1 consists of patients who received a standard bolus of 5000 IU of heparin. Group 2 consists of patients who received an initial bolus of heparin of 100 IU per kilogram of bodyweight, and whose ACT was measured throughout the procedure to potentially receive additional heparin doses guided by their ACT values. In open procedures, heparin was administered a couple of minutes before arterial clamping and in endovascular procedures after sheath insertion.
In group 2, a baseline ACT was measured before administration of heparin. The second measurement was performed approximately 5 minutes after the initial heparin dose. Based on this ACT value, additional heparin could be administered to the patient. If the ACT was more than 200 seconds, no extra heparin was administered in that moment. If the ACT was between 180 and 200 seconds, an additional heparin dose of 30 IU/kg was administered. If the ACT was under 180 seconds, 60 IU/kg was administered. Five minutes after every heparin administration, the ACT was measured again. If no additional heparin dose was administered, the ACT was measured every 30 minutes until the end of the procedure. Figure 1 shows a schematic overview of the ACT measurements and heparin administration protocol used in group 2.
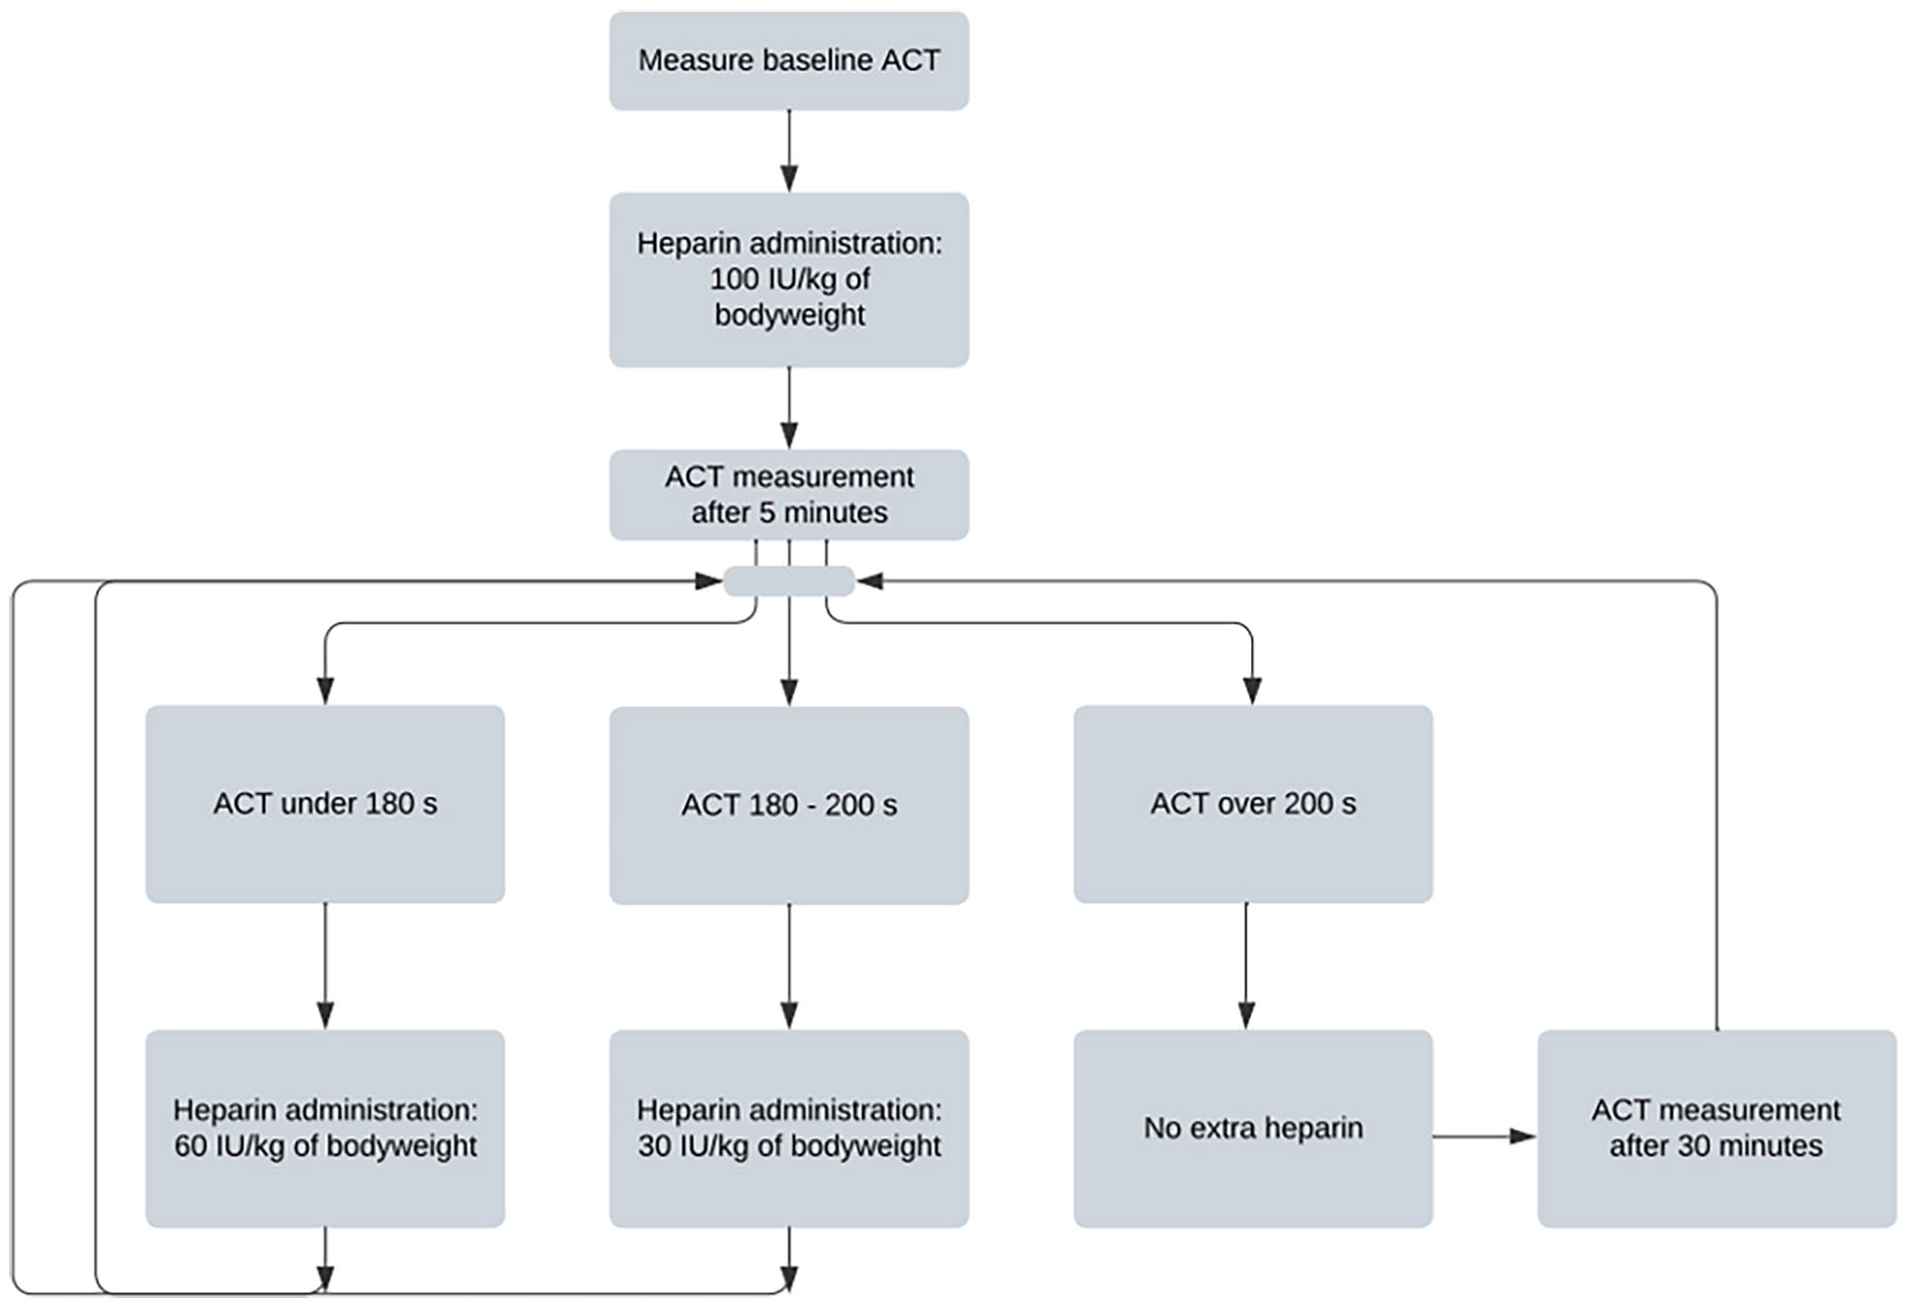
Flowchart of heparin administration and ACT measurement protocol. ACT, activated clotting time; IU, international units.
In every procedure, additional heparin could be administered at the surgeon’s discretion to maintain patient safety. Similarly, protamine could be administered to counteract the anticoagulatory effects of heparin, 24 if deemed necessary by the surgeon.
The ACT was measured using the Hemostasis Management System Plus (HMS Plus, Medtronic, Minneapolis, MN, USA) instrument using high-range cartridges. For each measurement, a new cartridge was used and approximately 3 mL of blood was drawn from a radial artery catheter in open procedures and directly from the sheath in endovascular procedures. Beforehand, 5 mL of blood was withdrawn to prevent contamination of heparin residues in the sheath.
The ATECs and Bleeding Complications
The ATECs were classified as myocardial infarction, graft thrombosis, pulmonary embolism, and athero-embolism.25–28 The bleeding complications were classified according to a grading system proposed by the European Multicenter Study on Coronary Artery Bypass Grafting (E-CABG). 29 No use of transfusion, with the exception of 1 unit of red blood cells (RBC), was classified as grade 0. Grade 1: transfusion of platelets, fresh frozen plasma, or 2 to 4 units of RBCs. Grade 2: transfusion of 5 to 10 units of RBCs or reoperation for bleeding. Grade 3: transfusion of >10 units of RBCs. Grades 1, 2, and 3 were considered bleeding complications in this study. The primary outcomes were the incidence of ATEC and bleeding complications; secondary outcomes were blood loss and ACT values.
Data Collection
Using a case report form, data from all participating patients were collected and saved in Castor Electronic Data Capture (EDC). 30 Patient demographics, such as sex, age, height, weight, BMI, smoking habits, and medical history were collected. Relevant medical history comprised cardiac disease, myocardial infarction or CVA (cerebrovascular accident), hypertension, hypercholesterolemia, pulmonary disease, renal impairment (eGFR between 30 and 40 mL/min), diabetes, malignancy, and previous arterial interventions. Furthermore, preoperative use of anticoagulation and Fontaine classification was also included in Castor EDC, as well as the type of intervention, periprocedural complications, periprocedural anticoagulation or protamine use, blood loss (categorized into <500, 500–999, 1000–1499, and >1500 mL of blood lost), and use of transfusions. After 30 days, all postoperative variables and relevant complications were registered in Castor EDC as well.
Statistical Analysis
Statistical analysis was conducted using the IBM SPSS statistical program Version 27. 31 Normality of continuous variables was tested using the Kolmogorov-Smirnov test. Normally distributed continuous data were analyzed using an independent t test, whereas skewed continuous variables were tested using the Mann-Whitney U test, and presented as median values and IQR (interquartile range). Dichotomous variables were tested using the χ2 test and were expressed with counts and percentages. The effect of potential confounders was tested using univariate and multivariate logistical regression. Multivariate logistical regression was applied if a possible confounder showed a p value of 0.10 or less in univariate analysis. A p value <0.005 was considered as statistically significant.
Results
Baseline Characteristics
A total of 355 patients were included, of whom 127 patients were in group 1 and 228 patients were in group 2. Table 1 shows the patient demographics and pre-procedural anticoagulation use. The mean age was 71 years and 66% of the patients were male.
Baseline Patient Characteristics and Details of Pre-Procedural Anticoagulation Use.
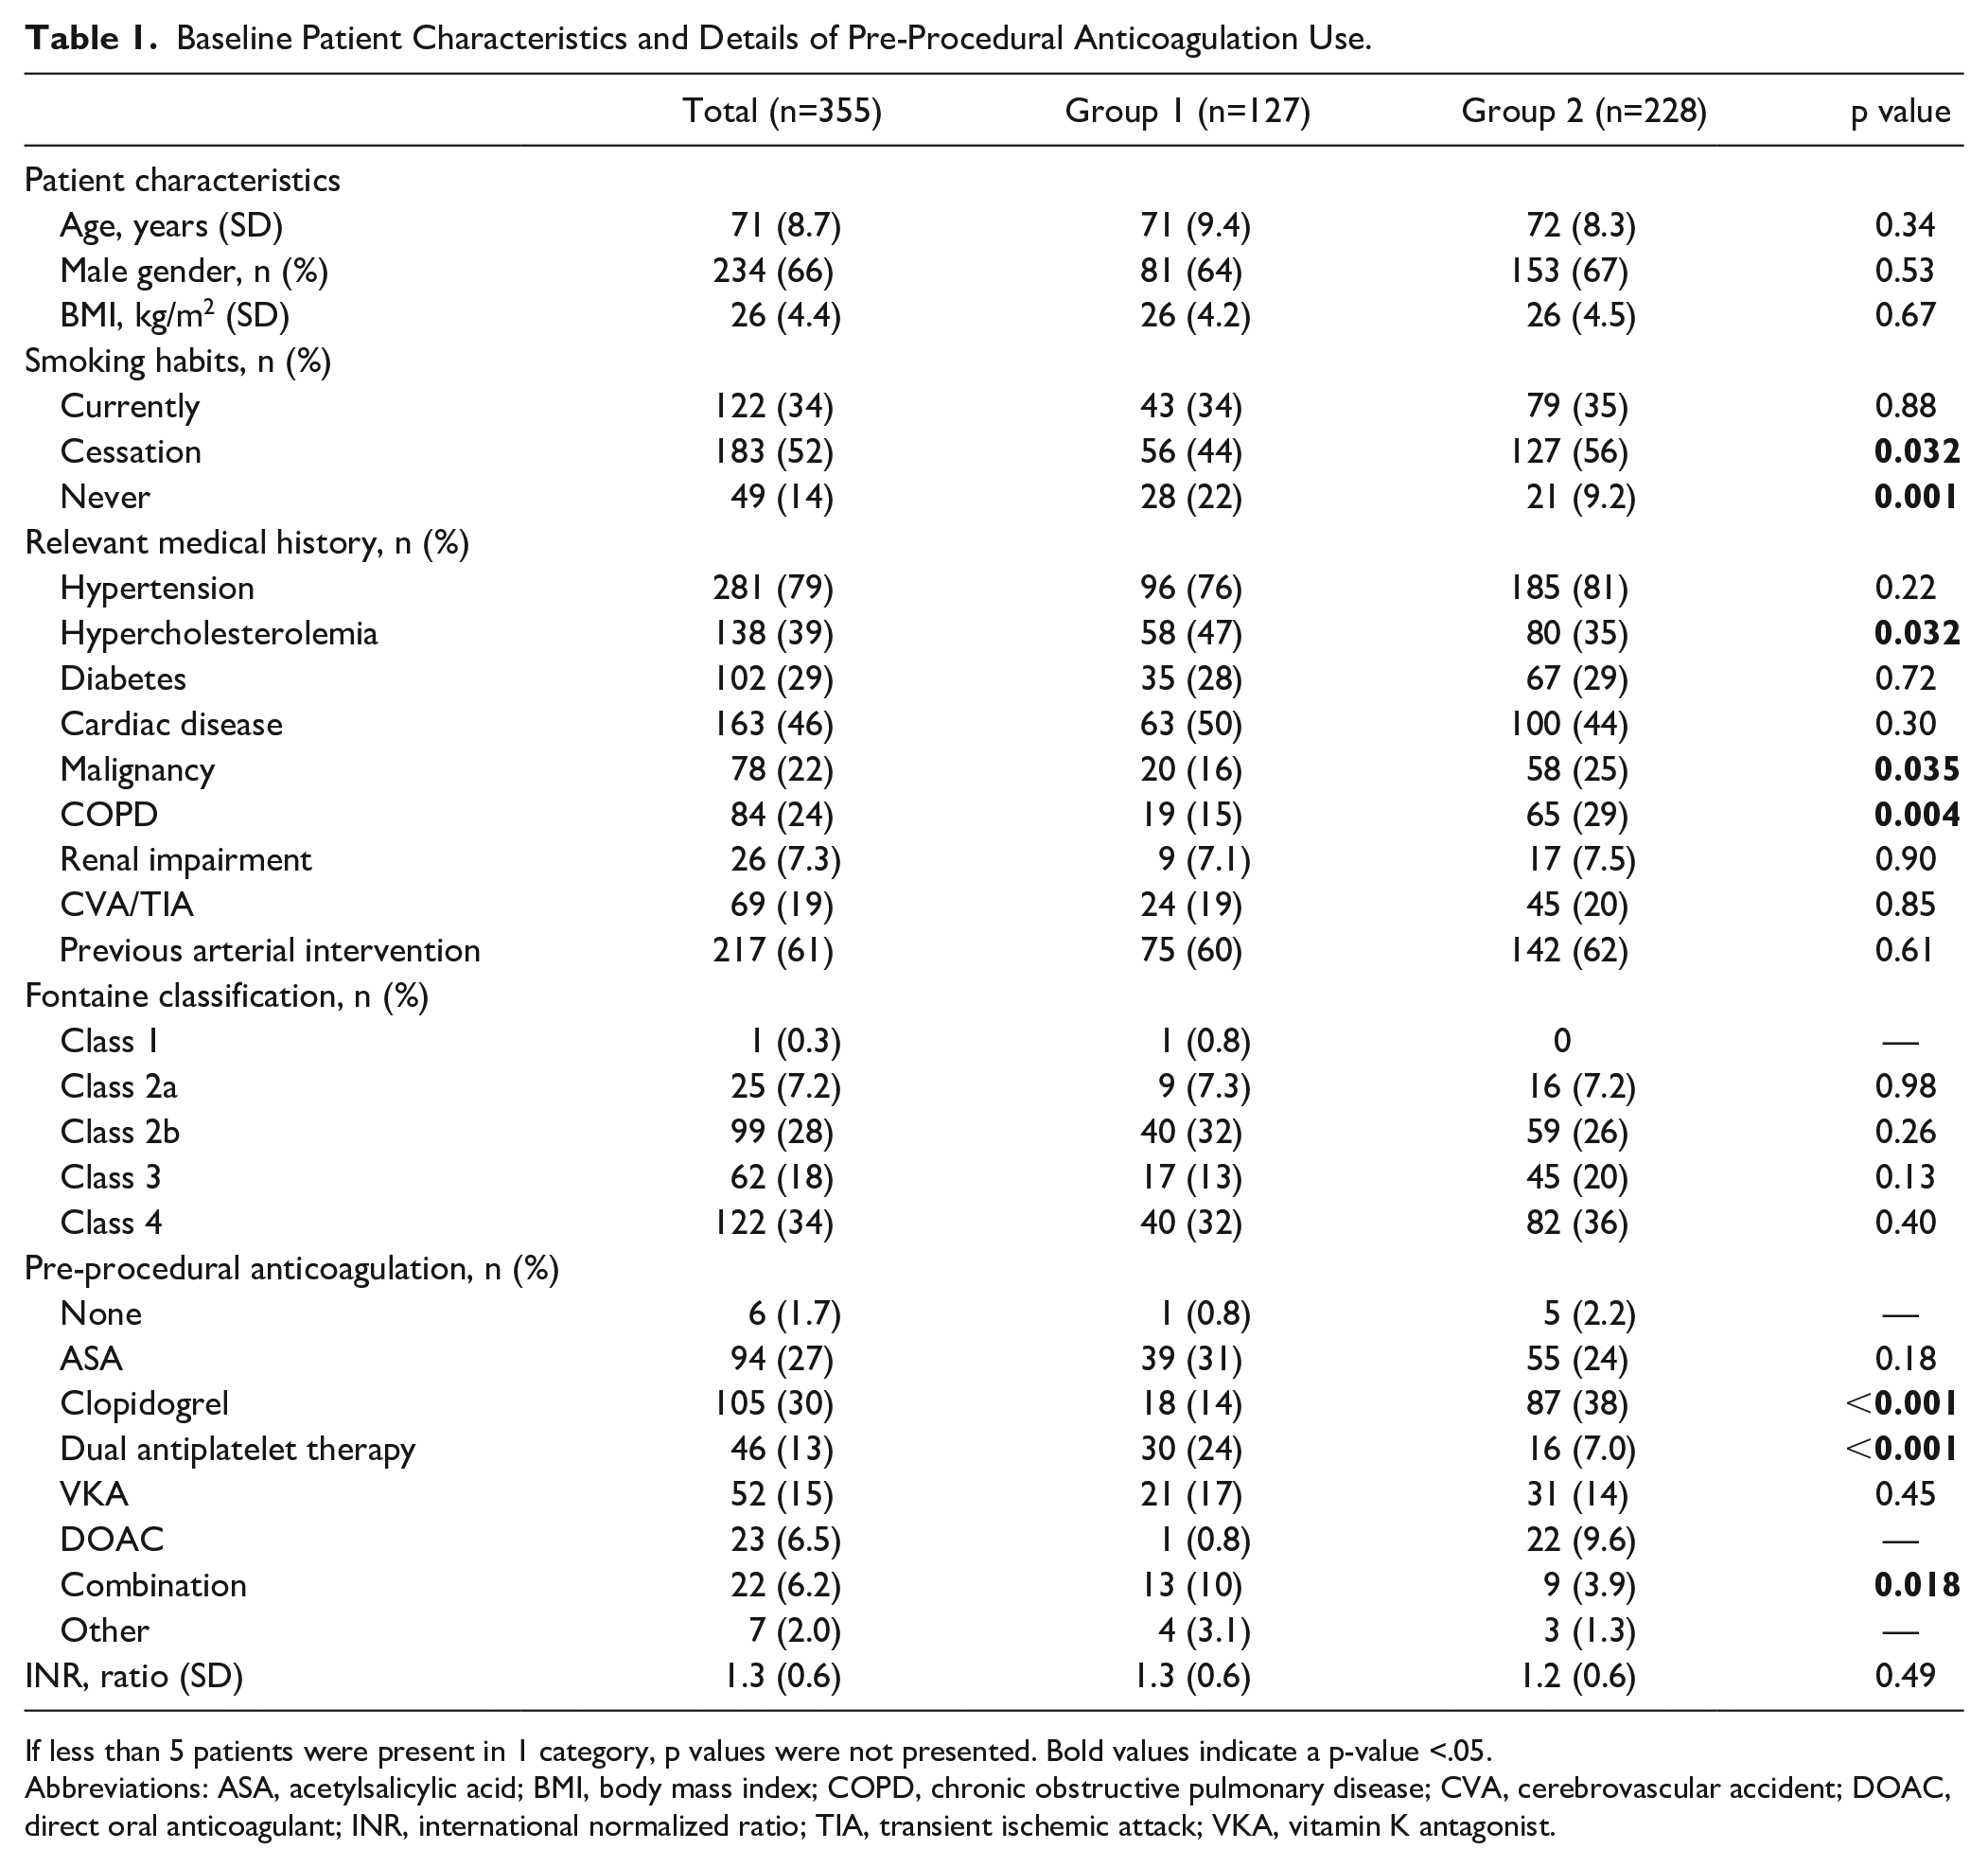
If less than 5 patients were present in 1 category, p values were not presented. Bold values indicate a p-value <.05.
Abbreviations: ASA, acetylsalicylic acid; BMI, body mass index; COPD, chronic obstructive pulmonary disease; CVA, cerebrovascular accident; DOAC, direct oral anticoagulant; INR, international normalized ratio; TIA, transient ischemic attack; VKA, vitamin K antagonist.
People who have quit smoking were significantly more abundant in group 2 (56%) than in group 1 (44%; p=0.032). People who never smoked were more frequently found in group 1 (22%) compared with group 2 (9%; p=0.001). Furthermore, significantly more patients in group 1 had hypercholesterolemia (47%) compared with group 2 (35%, p=0.032). However, in group 2, malignancy and COPD (chronic obstructive pulmonary disease) were significantly more frequent (p=0.035 and 0.004, respectively). Fontaine classification did not differ between groups.
Overall, acetylsalicylic acid and clopidogrel were the 2 most frequently used forms of anticoagulation in this cohort. In group 2, clopidogrel was used significantly more often than in group 1 (38% vs 14% of patients, p<0.001). Dual antiplatelet therapy was more frequently used in group 1 than in group 2 (24% vs 7%, p=<0.001). A combination of anticoagulation was found significantly more often in group 1 (p=0.018). Acetylsalicylic acid and clopidogrel were usually not discontinued prior to the intervention, whereas vitamin K antagonists and DOACs mostly were discontinued. The INR (international normalized ratio) in patients who continued vitamin K antagonist use did not differ significantly between group 1 and group 2. Dual antiplatelet therapy was discontinued in 28% of patients.
Procedure Specifics and Heparin Administration
Table 2 shows what type of procedures were performed. Surgery for occlusive aortoiliac disease was significantly more frequently performed in group 1. Furthermore, no significant differences in procedural details were present between the 2 groups.
Details on Procedures, n (%).
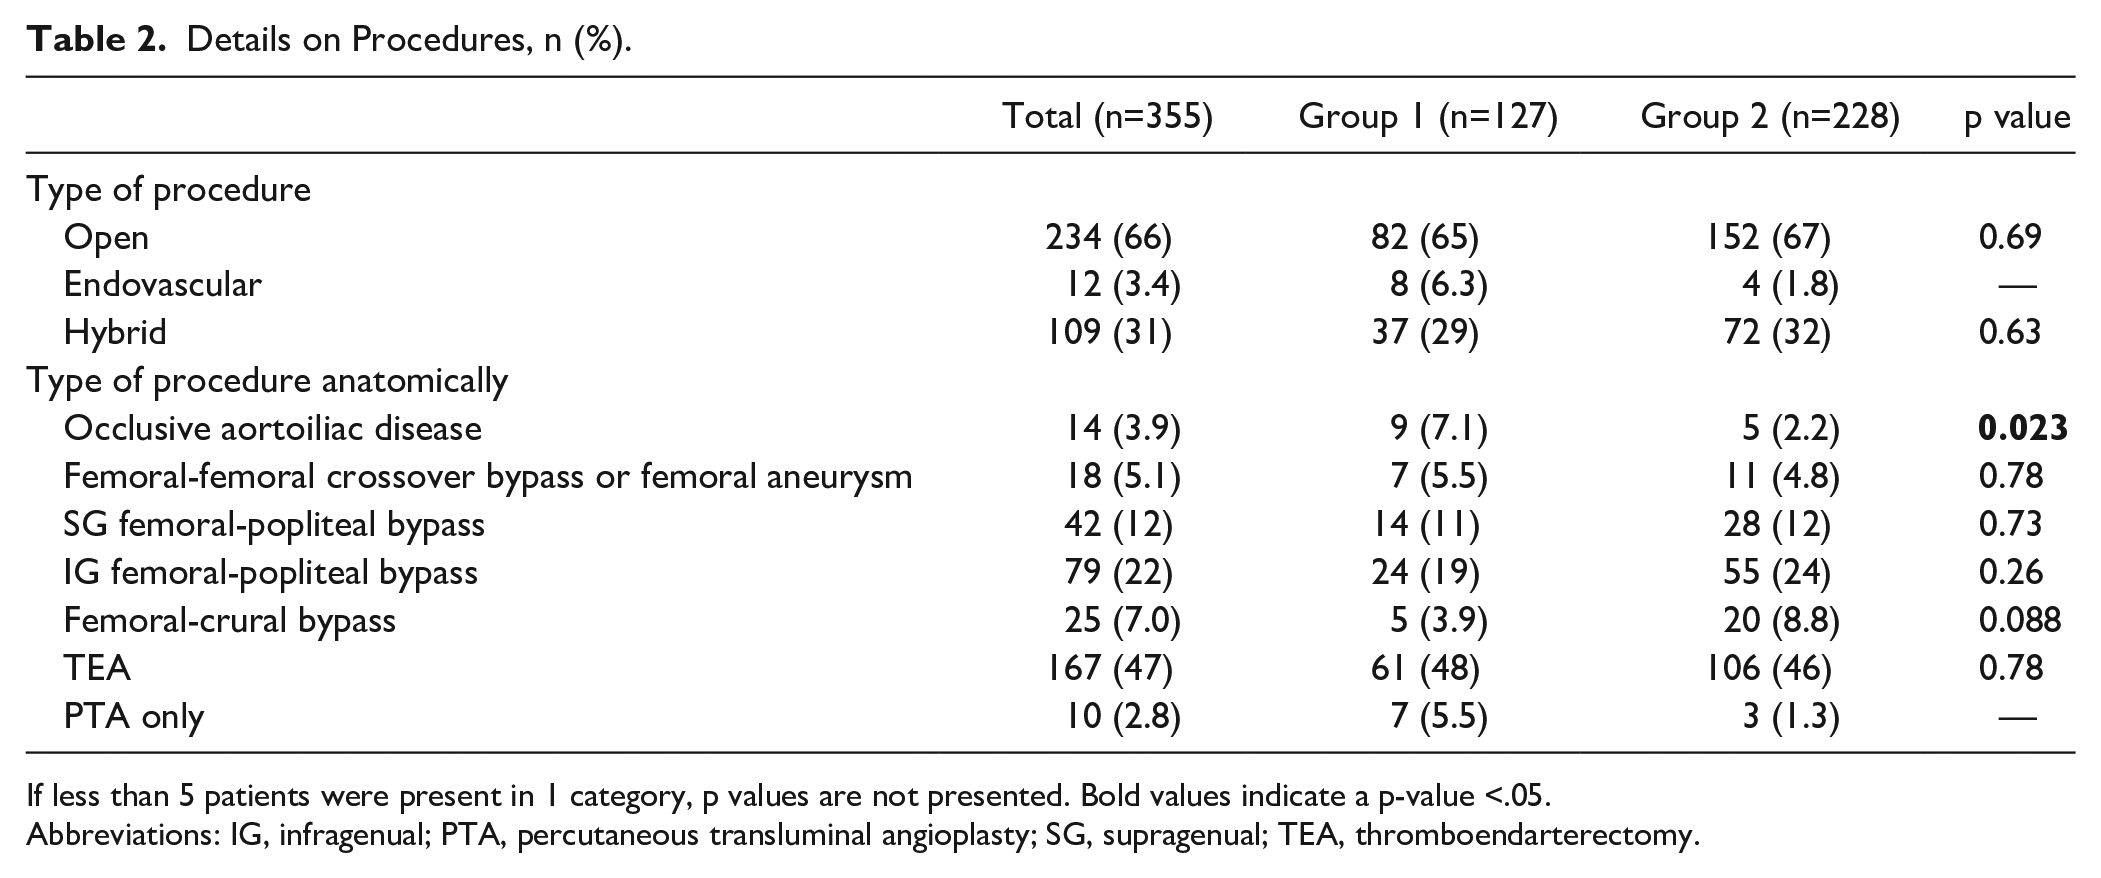
If less than 5 patients were present in 1 category, p values are not presented. Bold values indicate a p-value <.05.
Abbreviations: IG, infragenual; PTA, percutaneous transluminal angioplasty; SG, supragenual; TEA, thromboendarterectomy.
In group 1, one patient received an additional dosage of heparin during surgery. Three patients in this group received protamine at the end of surgery. In group 2, 130 patients received at least a second dose of heparin and 117 patients received protamine.
Blood Loss
In both groups, most patients lost less than 500 mL of blood (71% in group 1 and 73% in group 2) and 19% of patients lost between 500 and 999 mL of blood. Only 4.4% of patients lost both 1000 to 1500 and >1500 mL of blood. No significant differences were found between the 2 groups.
Complications
A total of 24 ATECs (6.8%) occurred, of which 11 (8.7%) were in group 1 and 13 (5.7%) were in group 2. The most common type of ATEC was graft thrombosis. See Table 3 for details. In total, 48 (14%) bleeding complications occurred. Seventeen of these were in group 1 (13%) and 31 in group 2 (14%).
Number of ATECs and Type of ATECs, n (%).
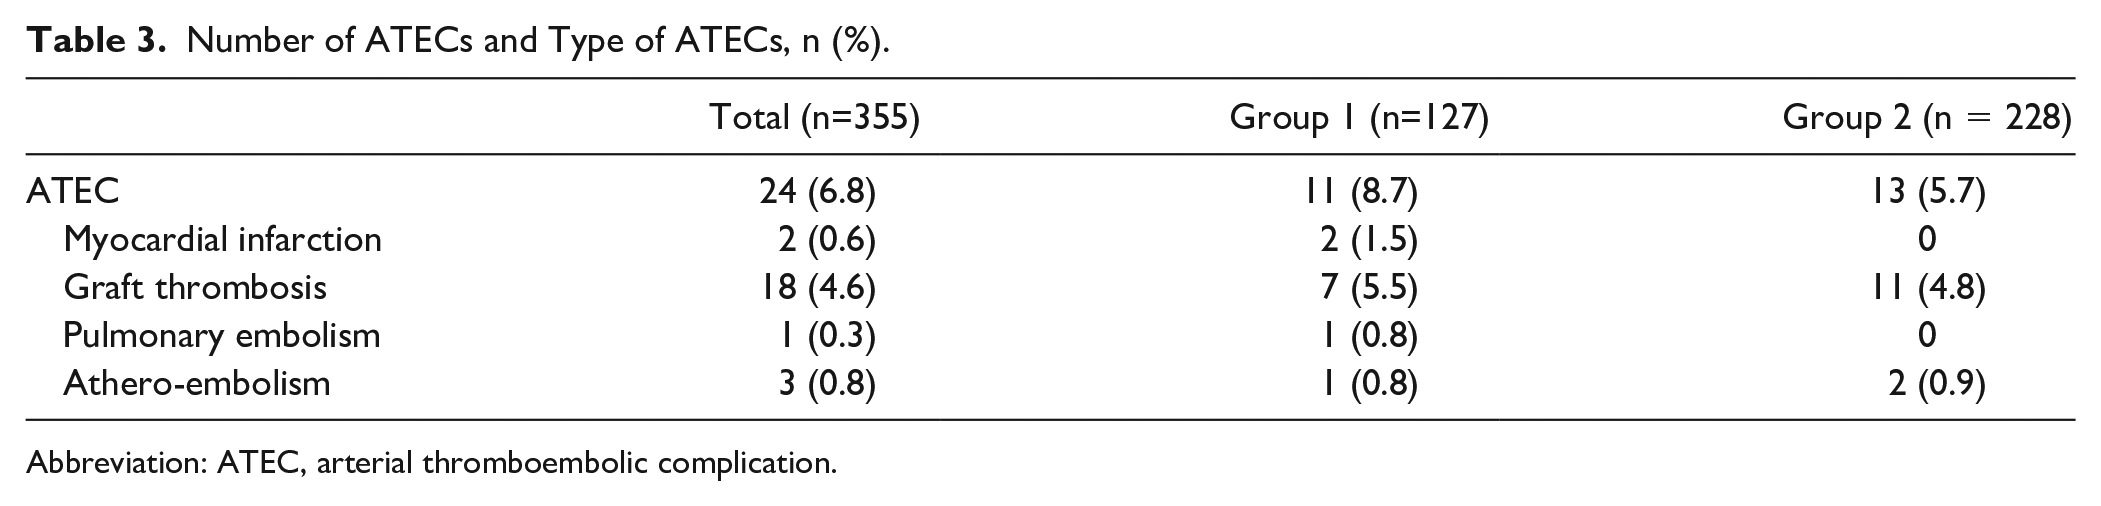
Abbreviation: ATEC, arterial thromboembolic complication.
One patient in group 1 died, consequent to suffering hypokalemia and myocardial infarction. Two patients from group 2 underwent an unexpected below-the-knee amputation, of whom 1 patient suffered from severe necrosis prior to the intervention. One patient in group 2 underwent a transmetatarsal amputation. One patient in group 1 underwent a transmetatarsal amputation, which was already planned before the initial procedure.
Covariate Analysis
Univariate and multivariate analyses were performed to assess the possible effect of confounding factors on the occurrence of ATEC and bleeding complications. Univariate analyses for effect of patient demographics and pre-procedural anticoagulation on ATEC showed a considerable effect (p<0.10) of sex, age, and diabetes (Supplemental Table S1). For bleeding complications, univariate analyses showed a considerable effect of sex, age, and Fontaine classification 4.
After multivariate sex, age and diabetes showed a significant effect on the incidence of ATEC (Supplemental Table S2). Women have a higher chance of suffering ATEC compared with men (OR: 2.410, 95% CI: [1.044–5.565], p=0.039). For every year of aging, the chance of suffering ATEC after NCAP got slightly smaller, with an OR of 0.95 (95% CI: [0.907–0.996], p=0.032). Patients with diabetes also have a smaller chance of ATEC compared with patients without diabetes (OR: 0.211, 95% CI: [0.049–0.917], p=0.038).
After multivariate analysis for bleeding complications, all 3 variables showed a significant effect on the incidence of bleeding complications (Supplemental Table S3). Women (OR: 3.229, 95% CI: [1.73–6.025], p=<0.001), patients of older age (OR: 1.066 for every year, 95% CI: [1.026–1.107], p=0.001), and patients with Fontaine class 4 (OR: 2.134, 95% CI: [1.154–3.949], p=0.016) compared with other Fontaine classes, had a higher chance of suffering bleeding complications.
The ACT Values
For the analyses on ACT values, only data of patients whose ACT values were measured during surgery were used. Therefore, group 1 consisted of 52 patients compared with 228 patients in group 2.
The median baseline ACT values did not differ between the 2 groups (group 1: 130, group 2: 133 seconds), and end values did not differ either (162 vs 174 seconds). The ACT values, 5 minutes after first heparin administration (T5), were significantly higher in group 2 (194 vs 231 seconds, p=<0.001). The peak ACT values were also higher in group 2 (197 vs 238 seconds, p=<0.001).
Table 4 shows the distribution of how many patients from each group reached the target ACT value of 200 to 250 seconds. At T5, a majority (62%) of patients from group 2 reached the target value, whereas only 31% of group 1 did. The end ACT was <200 seconds in almost all patients. In group 2, this was mainly the result of protamine administration.
Distribution of ACT Throughout the Procedure, n (%).
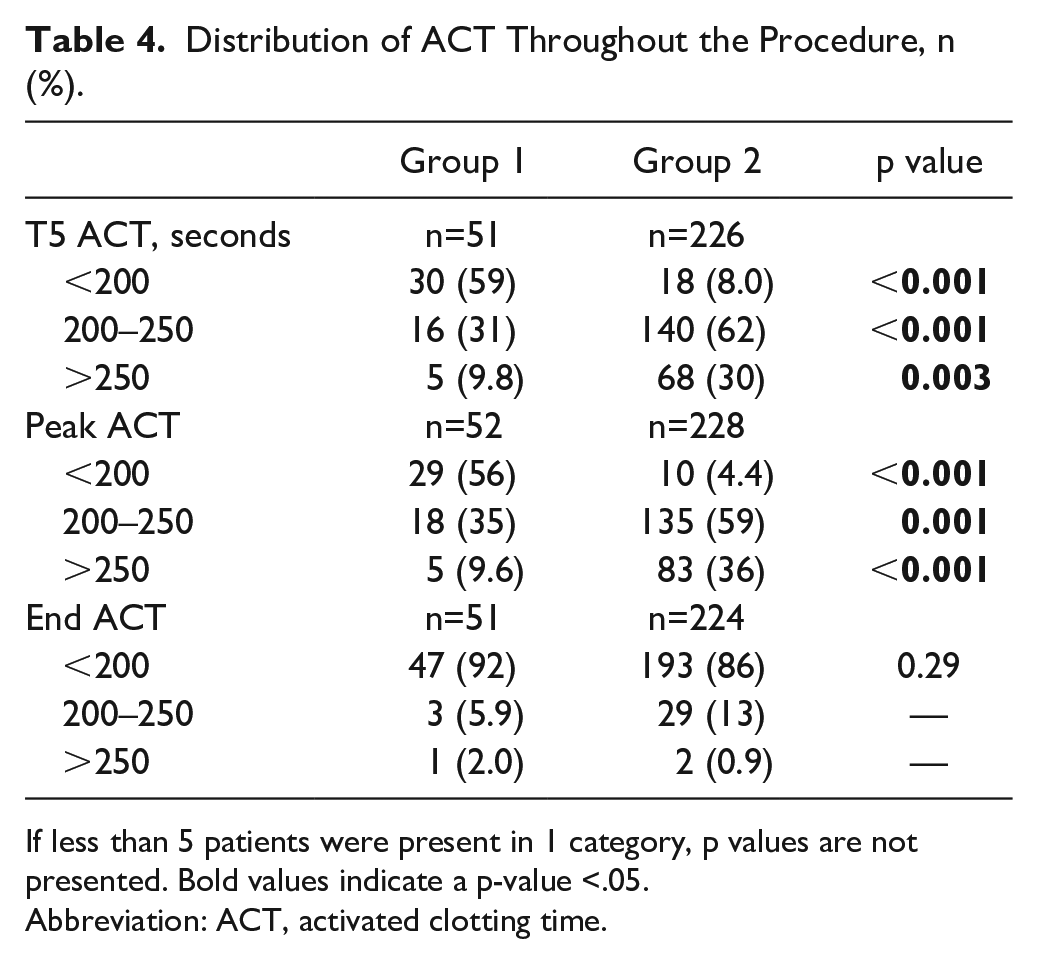
If less than 5 patients were present in 1 category, p values are not presented. Bold values indicate a p-value <.05.
Abbreviation: ACT, activated clotting time.
Table 5 shows the incidence of ATEC and bleeding complications over different categories of peak ACT values. Most bleeding complications occurred in patients with peak ACT >250 seconds; 24% of these patients suffered from this complication. The difference between the incidence of bleeding complications was significant when comparing the group of 200 to 250 seconds with the group of >250 seconds (p=0.003). Fifteen percent of patients with a peak ACT <200 seconds suffered from ATEC, compared with 5.9% and 4.5% of patients from the group of 200 to 250 and >250 seconds, respectively. This difference was significant (p=0.048) when the first and second group were compared with each other; however, the total number of complications was too low to perform any additional analyses.
Incidence of Complications Among Different Peak ACT Values, n (%).
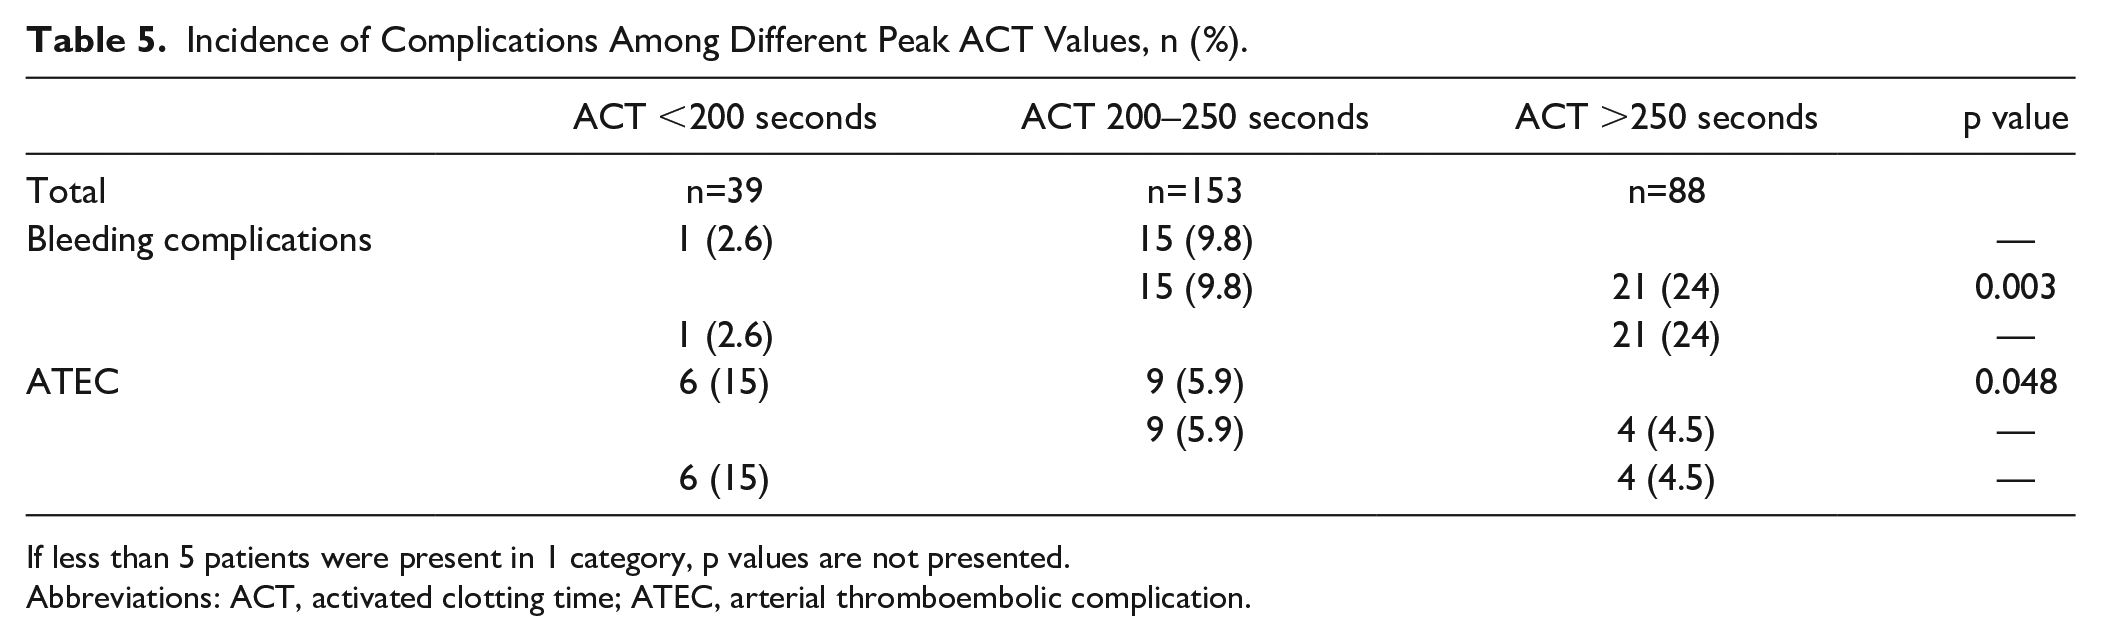
If less than 5 patients were present in 1 category, p values are not presented.
Abbreviations: ACT, activated clotting time; ATEC, arterial thromboembolic complication.
Discussion
The aim of this study was to gain insight into the incidence of ATEC and bleeding complications during and after interventions for PAD, and how this incidence differs between the 2 heparin administration protocols. An ACT-guided protocol, as studied in this research, could offer a solution for maintaining a safe balance between the risks of ATECs and bleeding complications by monitoring the effect of heparin.
Overall, the incidences of ATECs and bleeding complications were 6.8% and 14%, respectively. Patients with lower peak ACT values suffered more often from ATECs, whereas patients with higher peak ACT values suffered more often from bleeding complications.
Only 44% of patients in group 1 reached a peak ACT >200 seconds, compared with 95% of patients in group 2. This shows that the heparin administration protocol was followed successfully in this study, and ACT-guided heparinization seems to be effective in reaching higher ACT values. Furthermore, 59% of patients who received ACT-guided heparinization reached the target ACT of 200 to 250 seconds during their procedure, whereas only 35% of patients in group 1 did. This shows that the ACT-guided heparin protocol is significantly more efficient in reaching the target ACT value compared with a standardized heparin bolus. Most ATEC occurred in patients with peak ACT values less than 200 seconds, where 15% of patients suffered from this complication. Most of these patients were in group 1, and this could indicate that a standardized heparin bolus of 5000 IU does not prevent the occurrence of ATEC as optimally as possible. The opposite was found for bleeding complications. Twenty-four percent of patients with peak ACT values >250 seconds suffered from bleeding complications and most patients who reached peak ACT values >250 seconds have received ACT-guided heparinization.
Previous research regarding optimal ACT values is scarce. In some studies, a target range of 200 to 250 seconds was used based on expert opinions.32–35 One study found that bleeding complications were significantly more present in patients with ACT values >250 seconds, and also suggests maintaining an ACT between 200 and 250 seconds. 13 Our results are in line with this suggestion, where an ACT between 200 and 250 seconds seems to be a desirable target range.
Female patients were at a higher risk of suffering from both ATECs and bleeding complications, which is in line with previous research. Research has repeatedly found an increased risk of complications in women in peripheral vascular interventions.19,36,37 Our results support previous data, but it is still unclear why women tend to have poorer outcomes than their male counterparts during and after surgical procedures. Possible explanations may be hormonal differences and differences in pharmacodynamics and pharmacokinetics and body composition.38,39 Further research is needed to better investigate what causes the differences in clinical outcomes between the 2 genders in NCAP for PAD and how to improve outcomes for women.
Furthermore, older people had a lower risk of developing ATEC, but a higher risk of suffering from bleeding complications. Research has shown that older people are more susceptible to bleeding than younger people, owing to different risk factors as polypharmacy and more comorbidity.40,41 In addition, a recent study on risk prediction scores for major bleeding events after treatment of patients with PAD showed, among others, age above 80 years as independent predictor. 42 The lower risk of developing ATEC is not reported previously.
As anticipated, patients with Fontaine class 4, who suffer from gangrene or ulceration as a consequence of their PAD, had a greater chance of suffering from bleeding complications in this study. This could be a result of overall frailty and worse condition of blood vessels and soft tissue, thus more easily predisposing for bleeding, or owing to the more extensive nature of the procedure itself in later stages of disease.
A strength of this study is that this is one of the first cohort studies that explored the relation between heparin dosages, ACT values, and the incidence of ATEC and bleeding complications in procedures for PAD. Second, there are not many missing values because of the prospective nature of this study’s database. A limitation of this study is that, despite the large cohort included, a much larger patient group is needed for subgroup analysis, making it challenging to draw reliable conclusions. Another limitation is that the database does not encompass data on additional possible confounders. Variables such as baseline lesion characteristics and sheath size are foremost important for technical success; however, they could also wield an influence over the occurrence of ATEC and bleeding complications. Despite these limitations, the insights derived from this study could form the foundation for further research, with a greater number of participants to increase power and incorporating variables that can affect the incidence of complications.
Conclusions
This study analyzed the incidence of ATEC and bleeding complications during procedures for PAD and the relation between this incidence and different heparinization protocols. There was a significantly higher incidence of ATECs in patients with a peak ACT value <200 seconds, and a higher incidence of bleeding complications in patients with a peak ACT value >250 seconds.
To prevent ATEC or bleeding complications as optimally as possible during procedures for PAD, it seems advisable to maintain a target ACT between 200 and 250 seconds. The findings obtained from this study may serve as a basis for conducting future research on heparinization during procedures for PAD, with a larger sample size.
Supplemental Material
sj-docx-1-jet-10.1177_15266028231213611 – Supplemental material for The Additional Value of Activated Clotting Time–Guided Heparinization During Interventions for Peripheral Arterial Disease
Supplemental material, sj-docx-1-jet-10.1177_15266028231213611 for The Additional Value of Activated Clotting Time–Guided Heparinization During Interventions for Peripheral Arterial Disease by Liliane C. Roosendaal, Mila Radović, Max Hoebink, Arno M. Wiersema, Jan D. Blankensteijn and Vincent Jongkind in Journal of Endovascular Therapy
Footnotes
Author Contributions
The manuscript was studied and approved by all authors.
Declaration of Conflicting Interests
The author(s) declared no potential conflicts of interest with respect to the research, authorship, and/or publication of this article.
Funding
The author(s) disclosed receipt of the following financial support for the research, authorship, and/or publication of this article: This research was partially supported by a grant from Medtronic. Furthermore, Medtronic had no involvement in the collection, analysis, and interpretation of data; in the writing of the report; and in the decision to submit the article for publication.
Supplemental Material
Supplemental material for this article is available online.
References
Supplementary Material
Please find the following supplemental material available below.
For Open Access articles published under a Creative Commons License, all supplemental material carries the same license as the article it is associated with.
For non-Open Access articles published, all supplemental material carries a non-exclusive license, and permission requests for re-use of supplemental material or any part of supplemental material shall be sent directly to the copyright owner as specified in the copyright notice associated with the article.