
Abstract
Purpose:
Leg muscle microvascular blood flow (perfusion) is impaired in response to maximal exercise in patients with peripheral artery disease (PAD); however, during submaximal exercise, microvascular perfusion is maintained due to a greater increase in microvascular blood volume compared with that seen in healthy adults. It is unclear whether this submaximal exercise response reflects a microvascular impairment, or whether it is a compensatory response for the limited conduit artery flow in PAD. Therefore, to clarify the role of conduit artery blood flow, we compared whole-limb blood flow and skeletal muscle microvascular perfusion responses with exercise in patients with PAD (n=9; 60±7 years) prior to, and following, lower-limb endovascular revascularization.
Materials and Methods:
Microvascular perfusion (microvascular volume × flow velocity) of the medial gastrocnemius muscle was measured before and immediately after a 5 minute bout of submaximal intermittent isometric plantar-flexion exercise using contrast-enhanced ultrasound imaging. Exercise contraction-by-contraction whole-leg blood flow and vascular conductance were measured using strain-gauge plethysmography.
Results:
With revascularization there was a significant increase in whole-leg blood flow and conductance during exercise (p<0.05). Exercise-induced muscle microvascular perfusion response did not change with revascularization (pre-revascularization: 3.19±2.32; post-revascularization: 3.89±1.67 aU.s−1; p=0.38). However, the parameters that determine microvascular perfusion changed, with a reduction in the microvascular volume response to exercise (pre-revascularization: 6.76±3.56; post-revascularization: 2.42±0.69 aU; p<0.01) and an increase in microvascular flow velocity (pre-revascularization: 0.25±0.13; post-revascularization: 0.59±0.25 s−1; p=0.02).
Conclusion:
These findings suggest that patients with PAD compensate for the conduit artery blood flow impairment with an increase in microvascular blood volume to maintain muscle perfusion during submaximal exercise.
Clinical Impact
The findings from this study support the notion that the impairment in conduit artery blood flow in patients with PAD leads to compensatory changes in microvascular blood volume and flow velocity to maintain muscle microvascular perfusion during submaximal leg exercise. Moreover, this study demonstrates that these microvascular changes are reversed and become normalized with successful lower-limb endovascular revascularization.
Keywords
Introduction
Peripheral artery disease (PAD) is characterized by limited blood flow to the lower limbs because of atherosclerotic stenosis or occlusion of the conduit arteries. Patients with PAD have an impaired exercise tolerance, which is attributed to various hemodynamic and nonhemodynamic factors. 1 Studies of leg skeletal muscle demonstrate that muscle capillary density and structure are also compromised by PAD and are associated with the reduced exercise capacity in this patient group.2 –4 There are, however, conflicting findings, with some reports that muscle capillary supply is similar, 5 or even greater in patients with PAD compared with control participants. 6 Therefore, the role that muscle microvascular dysfunction plays in the exercise intolerance of patients with PAD remains unclear.
Contrast-enhanced ultrasound (CEU) imaging enables the measurement of real-time muscle microvascular blood flow, which is determined as the product of microvascular blood volume (A—the volume of microvessels being perfused, considered a marker of capillary recruitment) and microvascular blood flow velocity (β—the filling rate of the microvessels being perfused). Previous studies using CEU to assess leg muscle perfusion in patients with PAD have shown that peak perfusion is impaired in response to maximal or high-intensity plantar-flexion exercise7,8 and maximal treadmill walking. 9 During such high-intensity exercise, blood flow demand is high, and it is likely that the limited muscle perfusion responses in patients with PAD can be attributed mainly to their impaired upstream conduit artery flow due to arterial stenosis or occlusion.
In response to submaximal leg exercise, which is more typical of the activity patients undertake on a day-to-day basis, we recently demonstrated that gastrocnemius muscle microvascular perfusion was maintained in patients with PAD compared with age-matched control participants. 10 An important finding was that the increase in perfusion with exercise relied on a larger increase in microvascular blood volume (parameter A) in patients with PAD compared with controls. This was interpreted to reflect a reduction in microvascular resistance, and/or additional capillary recruitment, facilitating a redistribution of blood volume to maintain local capillary flow and enhance the endothelial surface area available to support the delivery of oxygen and nutrients to myocytes. 11 It is hypothesized that the increase in microvascular volume during submaximal exercise may be a compensatory response for the limited arterial inflow and microvascular flow velocity in patients with PAD, similar to that previously reported in studies of ischemic myocardium. 12 However, this has yet to be confirmed in the skeletal muscle microvasculature of patients with PAD.
Lower-limb revascularization, including endovascular and open surgery procedures, is used to restore conduit artery blood flow in patients with PAD with severe lifestyle-limiting symptoms or critical limb ischemia. As such, these procedures provide the opportunity to investigate the influence of changes in arterial inflow on the muscle microvascular responses to exercise in patients with PAD. Previous studies using CEU have shown that revascularization leads to enhanced muscle microvascular perfusion at rest 13 and during post-occlusion reactive hyperemia. 14 However, there has only been one exploratory investigation of the effect of revascularization on exercise-induced muscle microvascular perfusion. 7 In a pilot study of 3 patients with moderate to severe PAD, Davidson et al 7 reported an increase in peak gastrocnemius muscle perfusion during high-intensity (20 W) plantar-flexion exercise with successful revascularization. To confirm whether the restoration of conduit artery blood flow alters the distribution of microvascular blood flow, there is a need to assess microvascular flow volume and velocity in response to submaximal exercise, at an intensity that is within the hemodynamic limits of patients.
Therefore, to better understand the influence of conduit artery blood flow on muscle microvascular perfusion during exercise, we aimed to compare whole-leg blood flow and gastrocnemius muscle microvascular perfusion responses to submaximal leg exercise, before and after lower-limb revascularization, in patients with PAD.
Materials and Methods
Participant Recruitment
Nine patients with PAD and activity-limiting intermittent claudication (Fontaine stage II-III; 60±7 years) who were scheduled to undergo lower-limb revascularization were recruited through local vascular clinics. Inclusion criteria included an ankle-to-brachial blood pressure index (ABI) <0.90 and/or duplex ultrasound evidence of a hemodynamically significant arterial stenosis or occlusion. Patients who were not able to walk independently or had uncontrolled hypertension (systolic blood pressure >180 mm Hg or diastolic blood pressure >110 mm Hg), complicated diabetes with nephropathy or peripheral neuropathy, unstable angina, congestive heart failure, or critical limb ischemia were excluded. All patients gave written informed consent to participate in the study, which was approved by The Prince Charles Hospital Human Research Ethics Committee (HREC 16/QPCH/148). All procedures were conducted in accordance with the Declaration of Helsinki.
Study Overview
Outcome assessments were performed on the leg undergoing revascularization before revascularization (20±14 days prior) and were then repeated following recovery from successful revascularization (50±16 days post). Three experimental sessions were performed at each time point with stable laboratory and test conditions, at least 48 hours apart. During session 1, patients underwent an assessment of resting ABI, as well as anthropometric measures to estimate calf muscle mass as previously described. 15 Patients were familiarized with the plantar-flexion exercise protocol and performed a maximum force test, which was followed by the assessment of contraction-by-contraction whole-leg blood flow using strain-gauge plethysmography during a 5-minute bout of submaximal intermittent isometric plantar-flexion exercise (300 N). During session 2, muscle microvascular perfusion of the medial gastrocnemius was assessed using CEU before and after the same submaximal plantar-flexion exercise protocol. Within each session, plantar-flexion exercise test procedures were conducted twice, separated by 15 minutes, and average responses were used for analysis. The test protocols used in sessions 1 and 2 are illustrated in Figure 1. During session 3, patients completed secondary outcome assessments including a 6-minute walk test and self-reported walking capacity using the Walking Impairment Questionnaire (rating 0–100 from worst to best), as previously described.16,17 Patients were instructed to avoid exercise for 24 hours, maintain typical medication use, and abstain from caffeine and alcohol for 12 hours before each session.
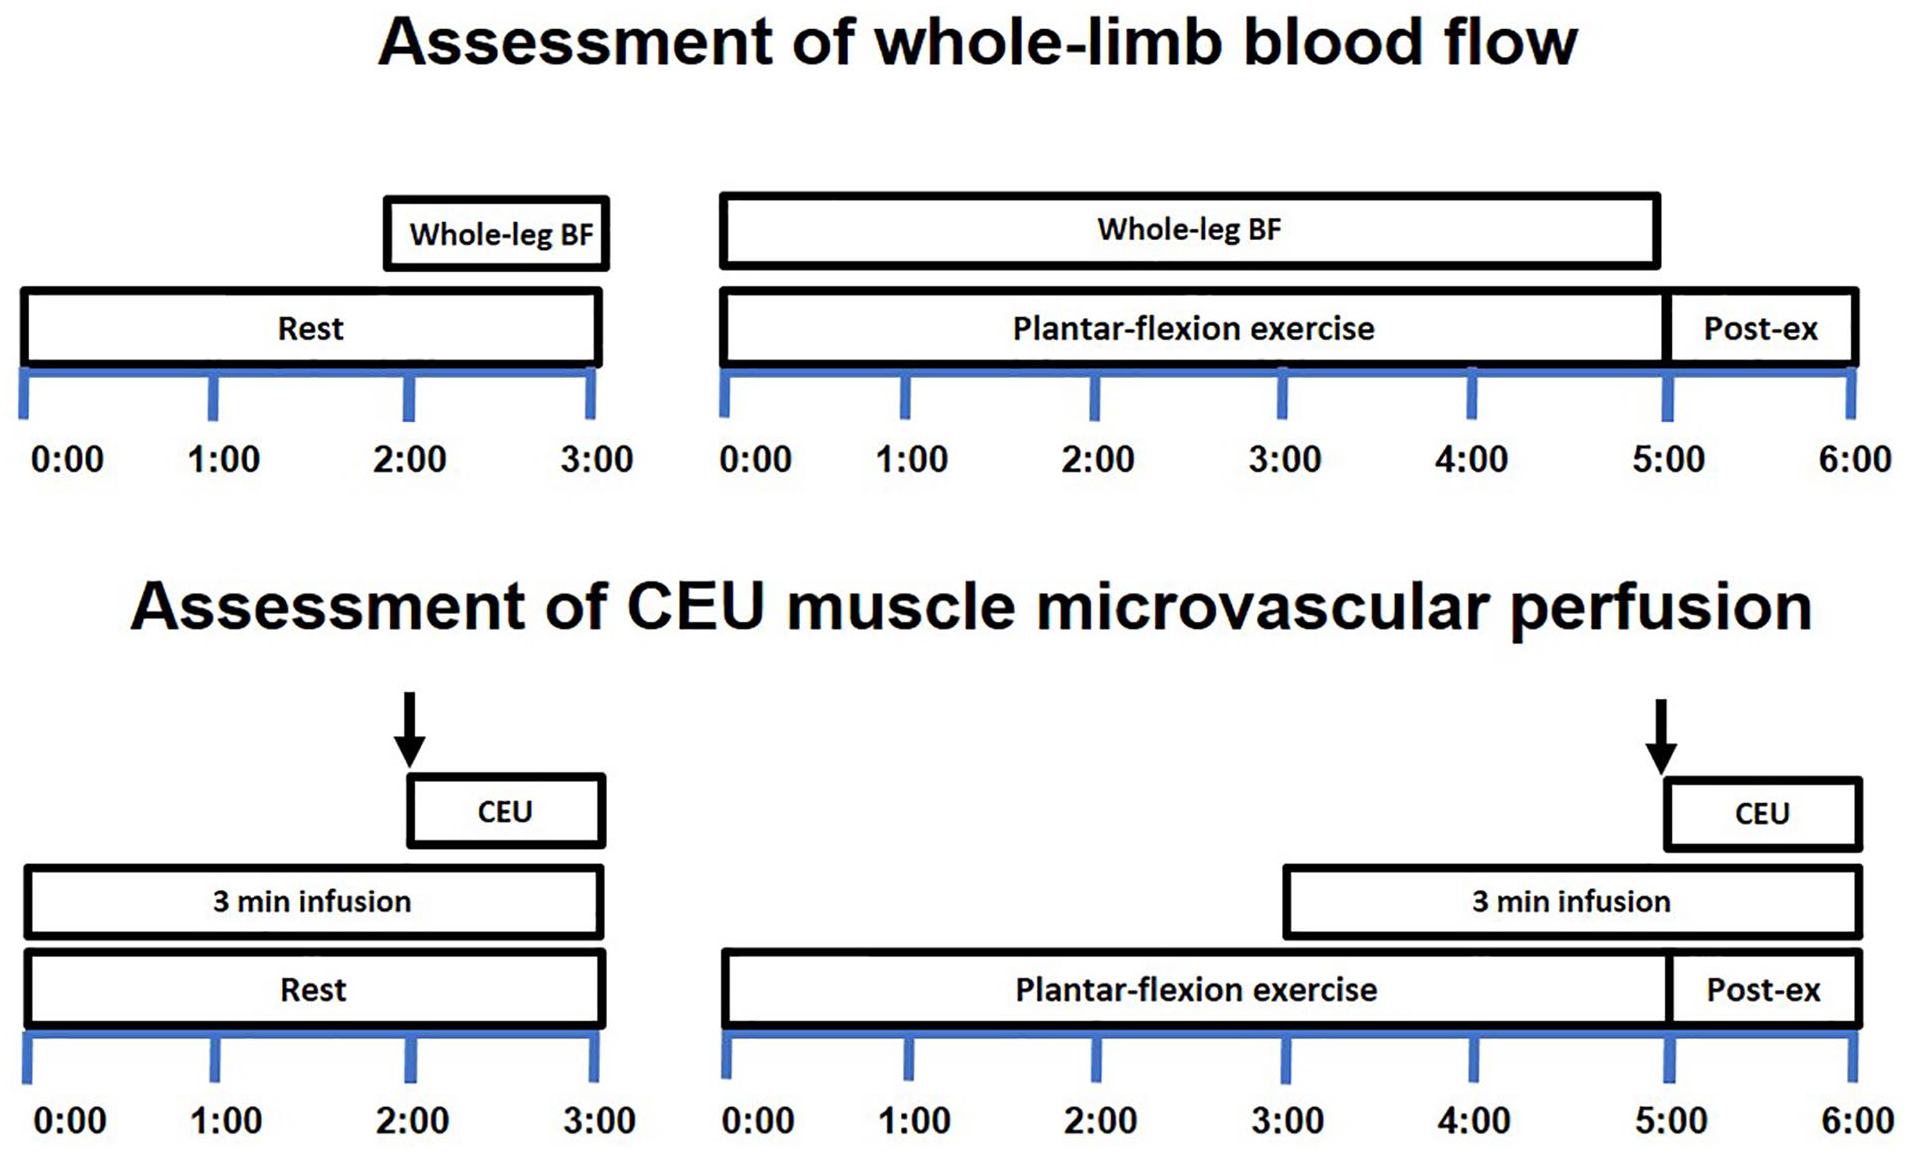
Protocol timelines for the measurement of whole-leg BF and muscle microvascular perfusion during exercise using strain-gauge plethysmography and CEU assessment protocol. The top panel shows the protocol for the assessment of contraction-by-contraction whole-leg BF using strain-gauge plethysmography undertaken during session 1. The bottom panel shows the protocol for the assessment of muscle microvascular perfusion in response to plantar-flexion exercise using CEU undertaken during session 2. Measurements during each session were performed in duplicate, separate by a 15 minute rest interval. ↓ represents the pulse (flash) of high-intensity energy ultrasound for microbubble destruction. BF, blood flow; CEU, contrast-enhanced ultrasound. Time is shown in minutes.
Plantar-Flexion Exercise Test
Participants were tested using a plantar-flexion dynamometer while in the seated position with their hips and knees flexed at 90° and their foot on an immovable footplate. A calibrated load cell (Xtran S1W; Applied Measurement, Melbourne) was positioned over the distal-thigh, and the contraction force signal was displayed on a monitor, which allowed participants to follow the target force accurately. After being familiarized with the exercise task, participants performed 5 maximum voluntary contractions (MVC), each separated by 60 seconds rest, and the average was reported as the maximum force. Then, after 15 minutes rest, the plantar-flexion exercise test was performed at a fixed contraction intensity of 300 N (contraction:relaxation duty cycle: 2:3 seconds) for a total of 60 contractions more than 5 minutes. After each exercise, bout patients were asked to rate their exercise-associated calf muscle pain (“1=no pain,” “2=pain or discomfort begins,” “3=mild pain or discomfort,” “4=moderate pain” or “5=severe pain”) and rate their perceived exertion according to the modified Borg scale. 18
Whole-Leg Blood Flow
Whole-leg blood flow was assessed at rest and during plantar-flexion exercise using strain-gauge plethysmography (EC6 Plethysmograph; Hokanson, Bellevue, Washington), as previously described.10,19,20 Briefly, a rapid inflation cuff (Hokanson) was placed around the upper thigh, and a mercury-in-silastic strain-gauge was placed around the calf at the largest circumference. Contraction-by-contraction leg blood flow was assessed following each contraction as the change in limb volume over the first cardiac cycle, free of movement artifact, from the onset of the 3 second relaxation phase. Single-lead electrocardiogram, heart rate (ADInstruments, Sydney), and beat-by-beat finger blood pressure (Finapres Medical Systems, Enschede) were continuously monitored during exercise. Leg vascular conductance was calculated as leg blood flow divided by mean arterial pressure. Contraction-by-contraction whole-leg blood flow and vascular conductance were averaged across both trials within each session for analysis. Data over the last minute of exercise (plateau) were averaged to determine the responses during exercise.
Calf Muscle Microvascular Perfusion
Calf muscle perfusion was determined using CEU using similar procedures described previously. 10 The ultrasound transducer was secured to the leg at the widest girth of the calf in the trans-axial plane, with images incorporating the medial gastrocnemius muscle. Continuous harmonic power-Doppler imaging (Philips EPIQ 7c ultrasound; Philips Medical Systems, Andover, Massachusetts) was performed with a linear-array transducer (Philips L12-3), using a low mechanical index (0.10), 59% gain, and 5 cm depth. Images were captured at rest and immediately after the cessation of exercise. Contrast solution consisting of 1.5 mL of lipid-shelled octafluoropropane microbubbles (Definity; Bristol-Myers Squibb Medical Imaging, New York City, New York) mixed to 50 mL with saline was infused intravenously via an antecubital vein at a constant rate of 200 mL/h, using a syringe pump (Alaris PK, Auckland) that was continuously mechanically rocked to prevent agent sedimentation. Prior to each measurement, 2 minutes of contrast infusion was required to achieve a steady-state image intensity and concentration of microbubbles, as previously described. 8 This was followed by a pulse (flash) of high-energy ultrasound (mechanical index=0.86) for microbubble destruction, and approximately 60 seconds of image acquisition to assess the kinetics of microbubble replenishment with infusion continuing throughout the duration of the image acquisition.
Microvascular image analysis
QLab software (Philips Healthcare, Bothell, Washington) was used to generate time-intensity curves for the analysis of microbubble replenishment kinetics, as previously described. 10 A quadrilateral region of interest (899±187 mm2) was manually selected by a single examiner (AM) and automatically transposed for repeated measurements. Time-intensity data were exported for background subtraction (Excel 15.0, Microsoft Corporation), where the background intensity was set at 0.98 second (resting data) or 0.49 second (exercise data) from the moment of bubble-destruction to exclude the contributions of the faster-filling, larger noncapillary vessels from the analysis. 21 The time-to-peak acoustic intensity was determined as the duration from the onset of change in acoustic intensity after microbubble destruction until its peak intensity using a 3 second moving average. The area under the curve was calculated as the total accumulated change in acoustic intensity during the first 50 to 60 seconds after exercise.
For the determination of perfusion parameters, time-intensity data were fitted to an exponential function y=A[1-e−βt], where y=video acoustic intensity at time t (in seconds); e=2.71828 which is a mathematical constant that is the base of the natural logarithm allowing for generation of the exponential curve; A is the peak acoustic intensity reflecting microvascular blood volume; and β is the rate constant of the response that reflects microvascular blood velocity. 22 Muscle microvascular blood flow (perfusion) was calculated as the product of A and β. Sigmaplot software version 13.0 (Systat Software, San Jose, California) was used for curve fitting. The adjusted R2 for the CEU microvascular blood flow data was 0.95±0.03.
Statistical Analysis
Skeletal muscle microvascular perfusion was the primary outcome of interest and therefore a priori sample size calculations were based on previously reported changes in muscle perfusion following revascularization in patients with PAD. 7 We expected a change of 50% of the difference reported by Davidson et al 7 because we used a submaximal exercise protocol (compared with the maximal protocol used by Davidson). Based on this, we assumed an effect size of 2.0, an alpha level of .05 and a power of 90%, and a minimum sample size of 6 participants was required to detect this effect.
The Gaussian distribution and homogeneity of variance of the data were confirmed using Shapiro-Wilk and Levene tests. The effects of “treatment” (pre- and post-revascularization) and “time” (pre- and post-exercise) on whole-leg blood flow and microvascular perfusion parameters were assessed using a 2-way repeated-measures analysis of variance. Tukey post hoc test was performed when there were significant main effects or interactions. The relative changes in whole-leg blood flow and microvascular perfusion parameters (Δ, delta) before and after revascularization were compared using dependent sample (paired) t tests to account for any differences in resting parameters. A p value of <0.05 was considered statistically significant. Statistical analyses were performed using SPSS version 24 for Windows. Data are presented as mean±SD unless stated otherwise.
Results
Patient characteristics are presented in Table 1, and a description of the revascularization site and procedure for each participant is presented in Table 2. Three patients had previous revascularization procedures in the limb of interest (>2 years prior) and another 2 patients had previous procedures in the contralateral limb. Endovascular revascularization led to an increase in the pain-free walking distance (pre: 71±31, post: 382±196 m; p<0.01) and total distance during the 6-minute walk test (pre: 398±77, post: 463±87 m; p<0.01). Total score on the Walking Impairment Questionnaire improved with revascularization (pre: 25±11, post: 88±24; p=0.02), including significant improvements in self-reported walking distance (pre: 17±16, post: 86±28; p=0.02), speed (pre: 25±11, post: 85±24; p=0.02), and stair climbing scores (pre: 33±15, post: 92±22; p=0.03).
Patient Characteristics.
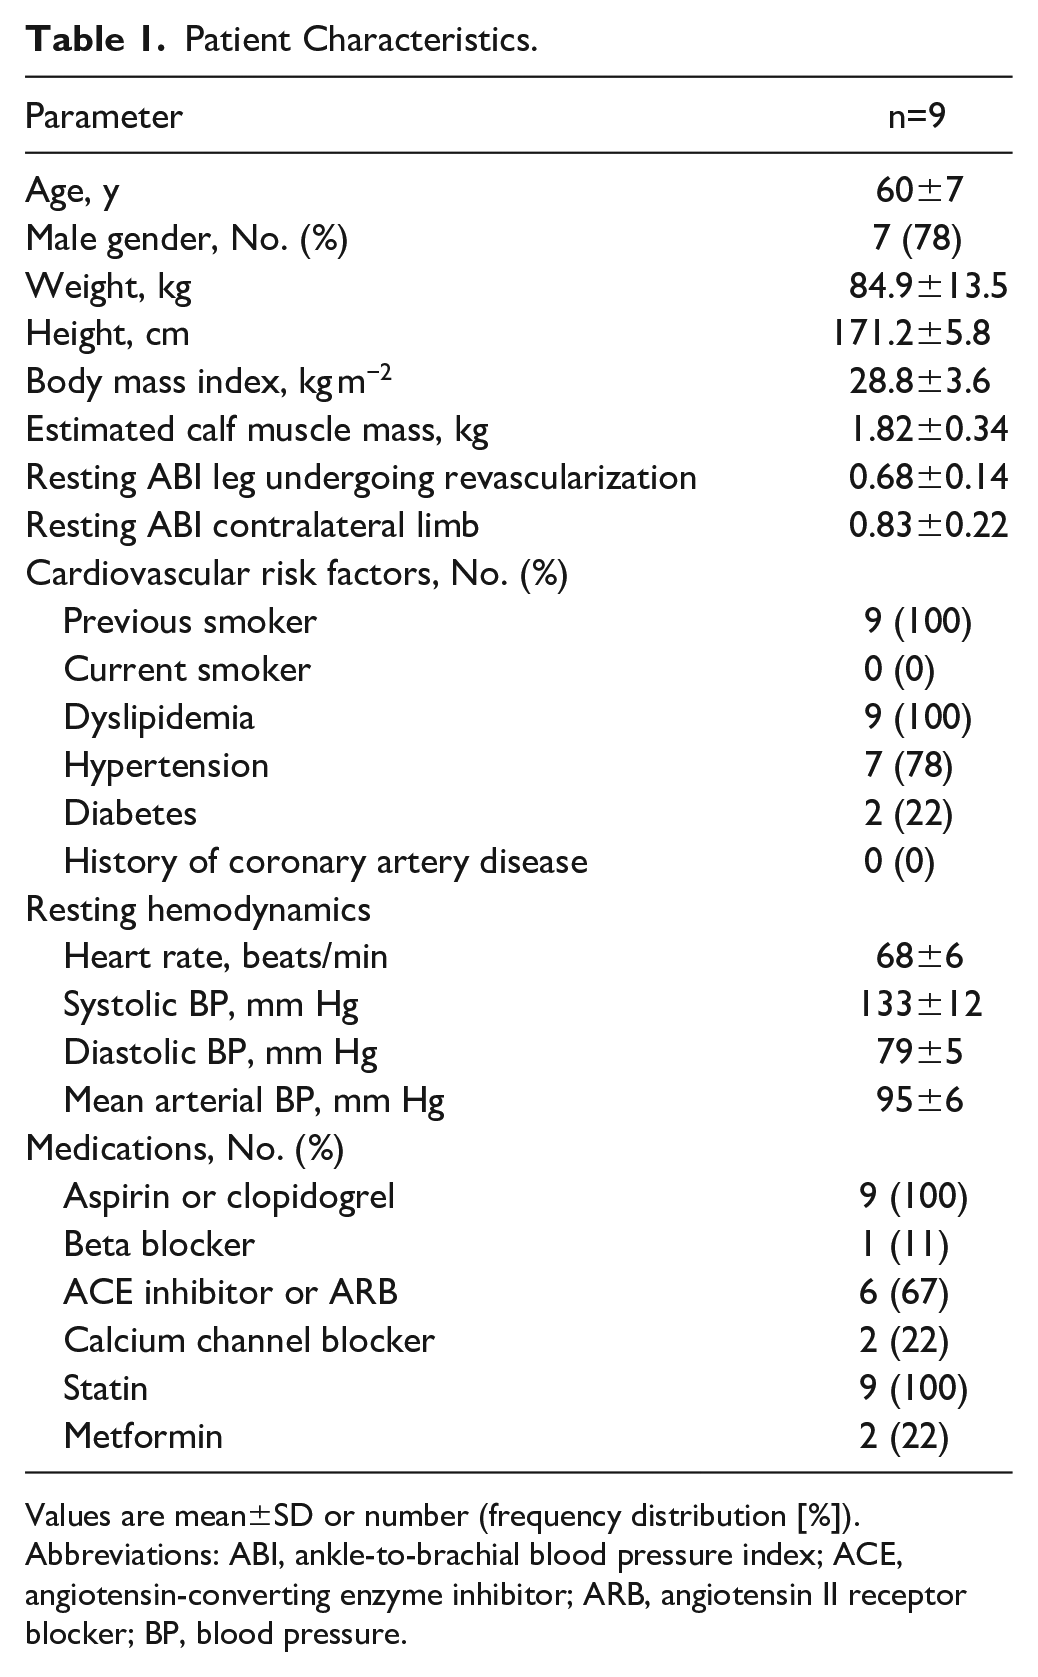
Values are mean±SD or number (frequency distribution [%]).
Abbreviations: ABI, ankle-to-brachial blood pressure index; ACE, angiotensin-converting enzyme inhibitor; ARB, angiotensin II receptor blocker; BP, blood pressure.
Patient Revascularization Characteristics.
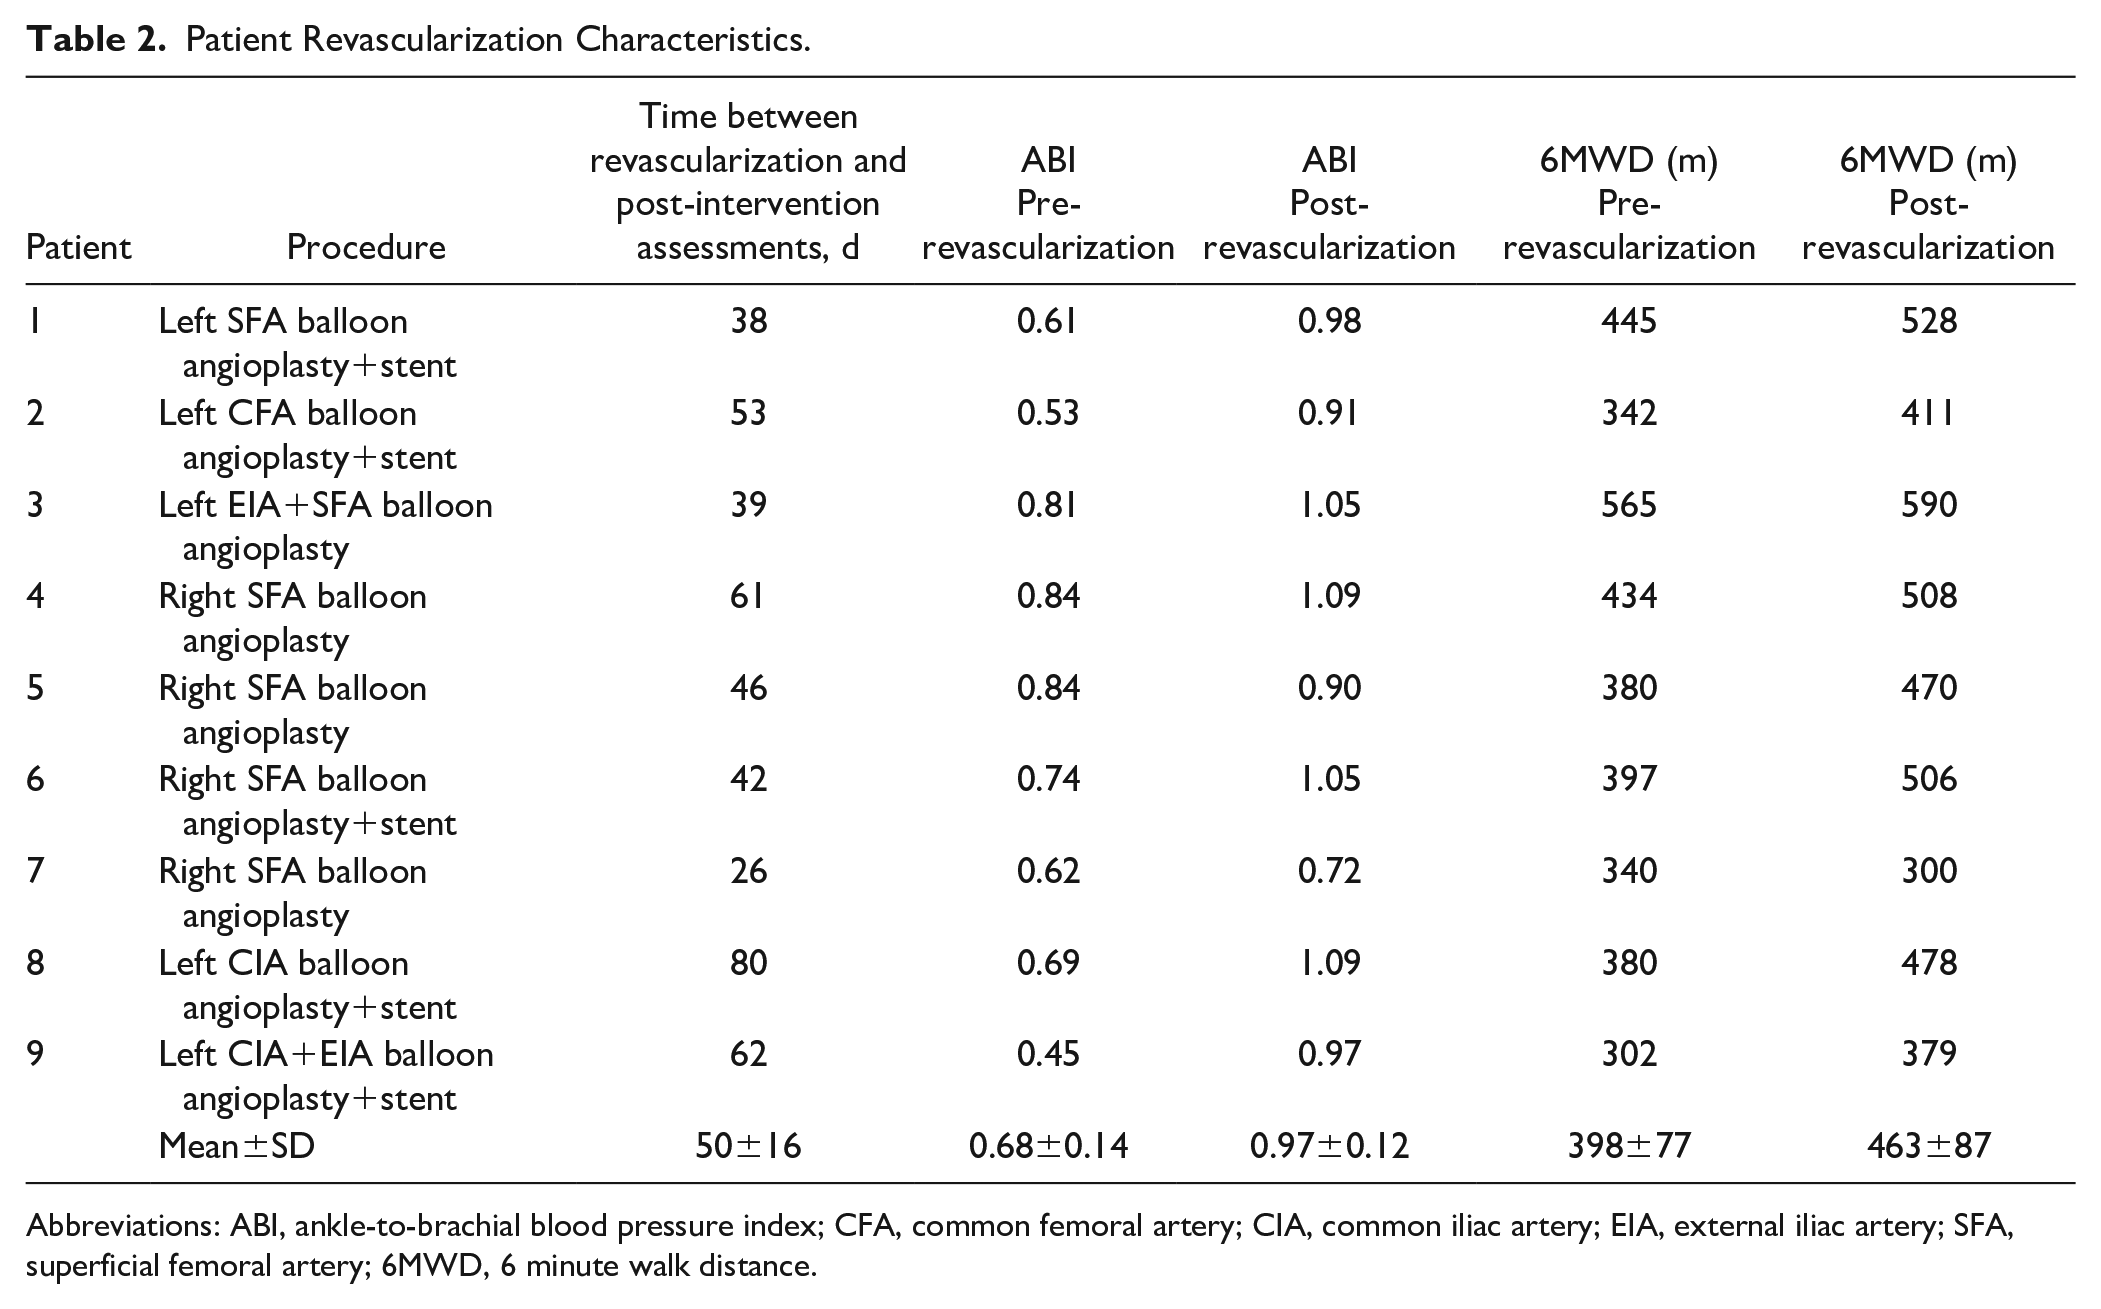
Abbreviations: ABI, ankle-to-brachial blood pressure index; CFA, common femoral artery; CIA, common iliac artery; EIA, external iliac artery; SFA, superficial femoral artery; 6MWD, 6 minute walk distance.
Estimated calf muscle mass did not change with revascularization (p=0.37; Table 3). Plantar-flexion MVC force did not change significantly with revascularization (p=0.56; Table 3); and therefore pre- and post-revascularization submaximal exercise tests were performed at similar relative intensities (p=0.49; Table 3). These results remained unchanged after correcting MVC force for estimated calf muscle mass (p=0.79; Table 3). Revascularization led to a significant improvement in symptoms during the plantar-flexion exercise test from mild pain (mean score: 3±1) to no pain (mean score: 1±0; p=0.02), whereas there was no significant change in perceived exertion with revascularization (pre: 4±2; post: 3±1; p=0.15).
Leg Muscle Force and Hemodynamic Parameters Before and After Revascularization (n=9).
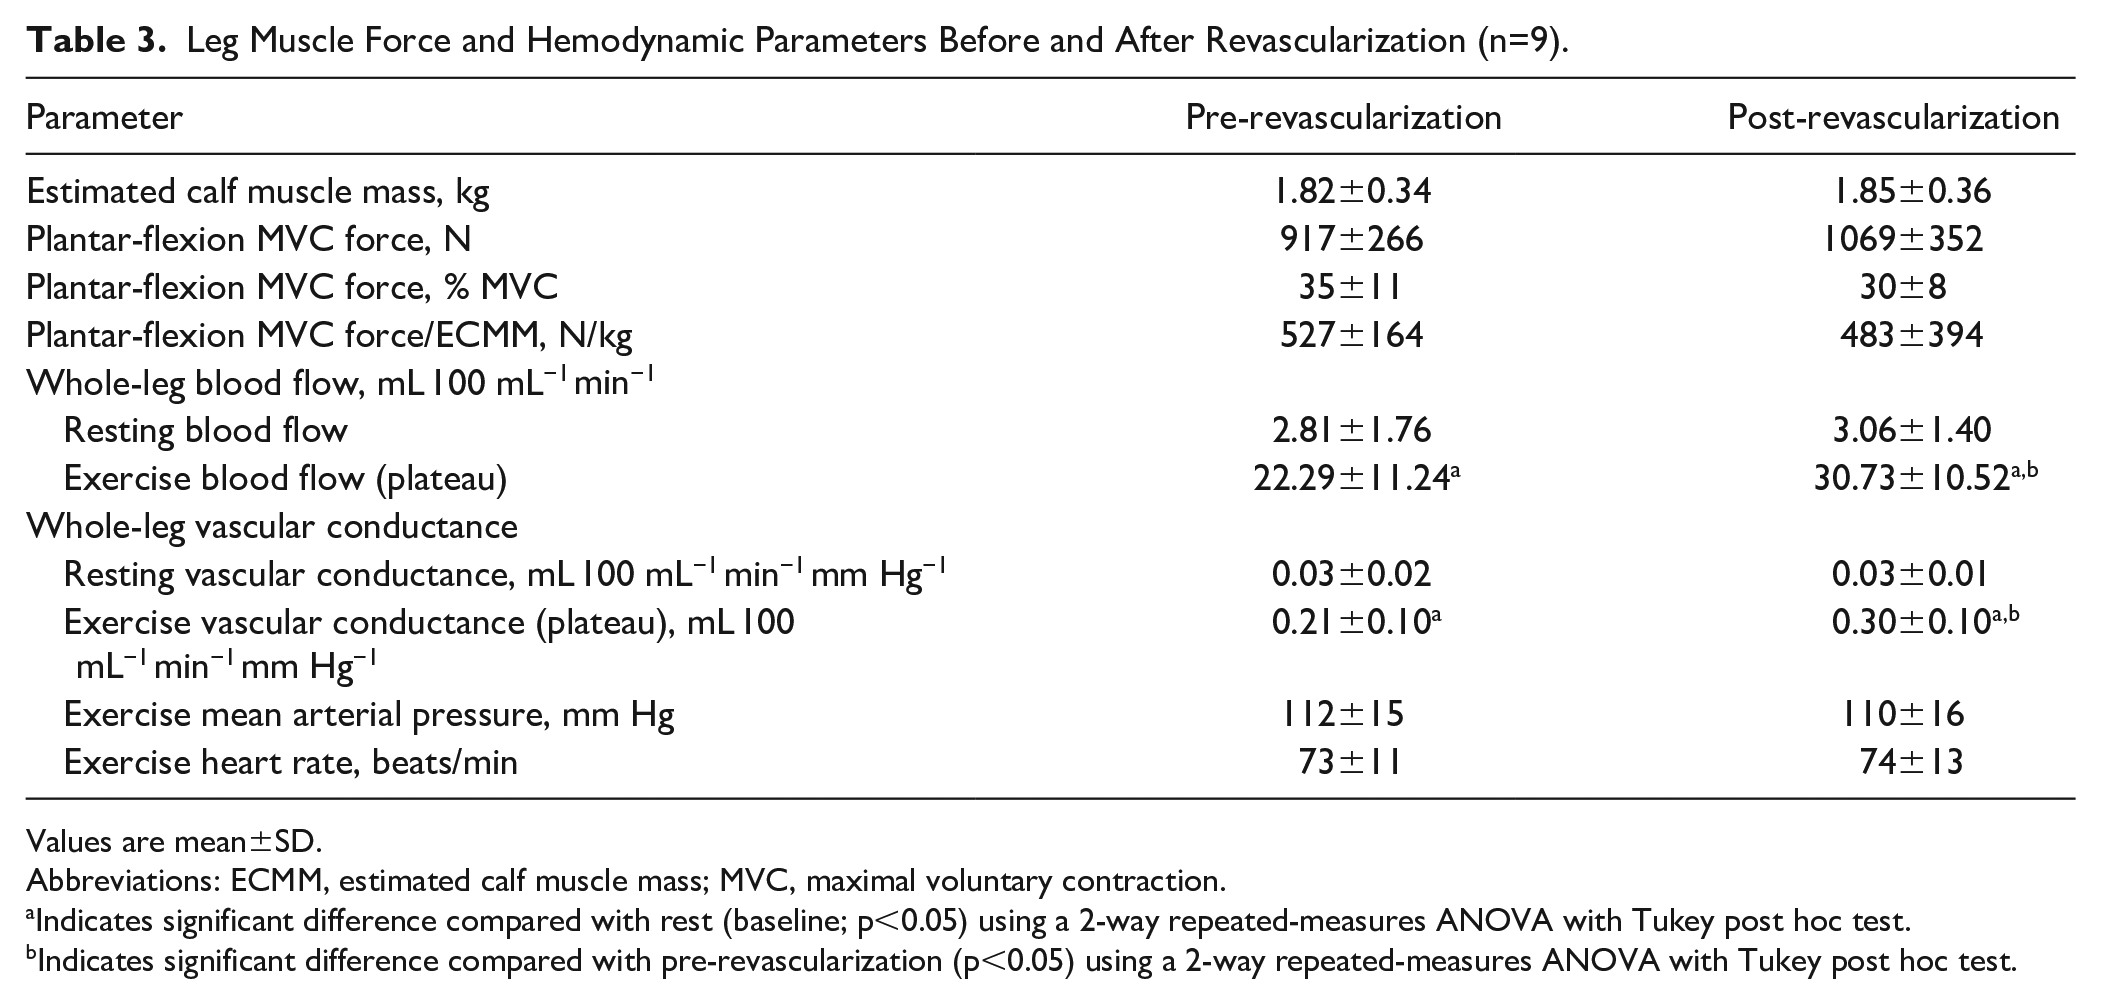
Values are mean±SD.
Abbreviations: ECMM, estimated calf muscle mass; MVC, maximal voluntary contraction.
Indicates significant difference compared with rest (baseline; p<0.05) using a 2-way repeated-measures ANOVA with Tukey post hoc test.
Indicates significant difference compared with pre-revascularization (p<0.05) using a 2-way repeated-measures ANOVA with Tukey post hoc test.
Leg Blood Flow
With revascularization there was a significant increase in resting ABI (pre: 0.68±0.14 post: 0.97±0.12; p<0.01). Resting whole-leg blood flow and vascular conductance were not different before and after revascularization (p>0.05; Table 3). In comparison with rest (baseline), whole-leg blood flow increased during exercise before and after revascularization (p<0.01), and the total rise in whole-leg blood flow during exercise was greater after revascularization (p=0.04; Table 3). Results remained unchanged when differences in blood pressure during exercise were accounted for by expressing the blood flow responses as leg vascular conductance (Table 3).
Calf Muscle Microvascular Perfusion
Figure 2 illustrates the mean CEU time-intensity curves before and after revascularization. The pre- and post-revascularization curves show the replenishment kinetics of microbubbles during the period immediately following plantar-flexion exercise. Time-to-peak acoustic intensity was shorter (pre: 27.87±13.80; post: 18.05±9.20 seconds; p=0.04), and the area under the curve was lower after revascularization (pre: 487±232; post: 311±145 aU.s; p=0.03).
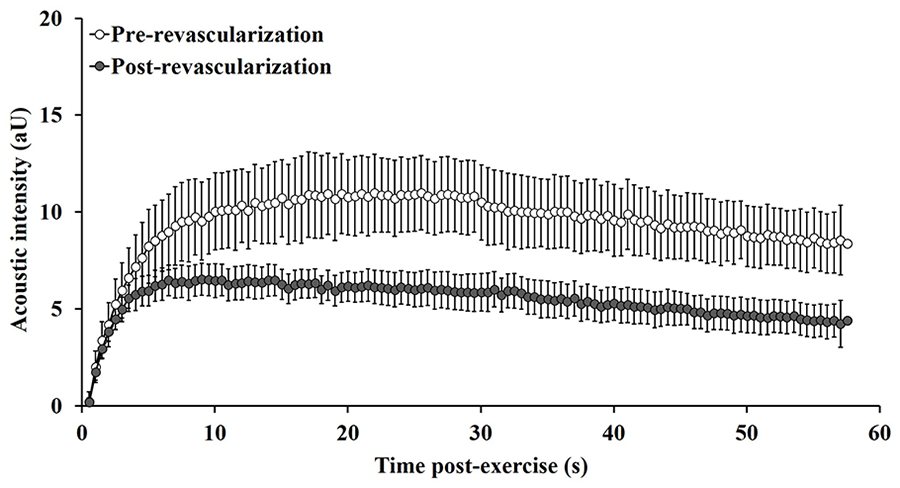
Post-exercise CEU time-intensity curves in patients with PAD (n=9) before (open circles) and after (shaded circles) lower-limb endovascular revascularization. Data points represent group mean and error bars are SEM. CEU, contrast-enhanced ultrasound; PAD, peripheral artery disease; SEM, standard error of the mean.
Figure 3 shows the calf muscle microvascular parameters at rest and in response to exercise before and after revascularization. Resting microvascular perfusion and microvascular volume were not different before and after revascularization; however, resting microvascular flow velocity was significantly higher after revascularization (p=0.04). All microvascular parameters increased significantly from rest to exercise (p<0.01). The response of microvascular perfusion to exercise did not differ significantly with revascularization (pre: Δ3.19±2.32; post: Δ3.89±1.67 aU.s−1; p=0.38; Figure 3C). However, the parameters that determine muscle perfusion changed with revascularization, with a decrease in the exercise-induced microvascular volume response (pre: Δ6.76±3.56; post: Δ2.42±0.69 aU; p<0.01; Figure 3A), and an increase in the microvascular flow velocity response (pre: Δ0.25±0.13; post: Δ0.59±0.25 s−1; p=0.02; Figure 3B).
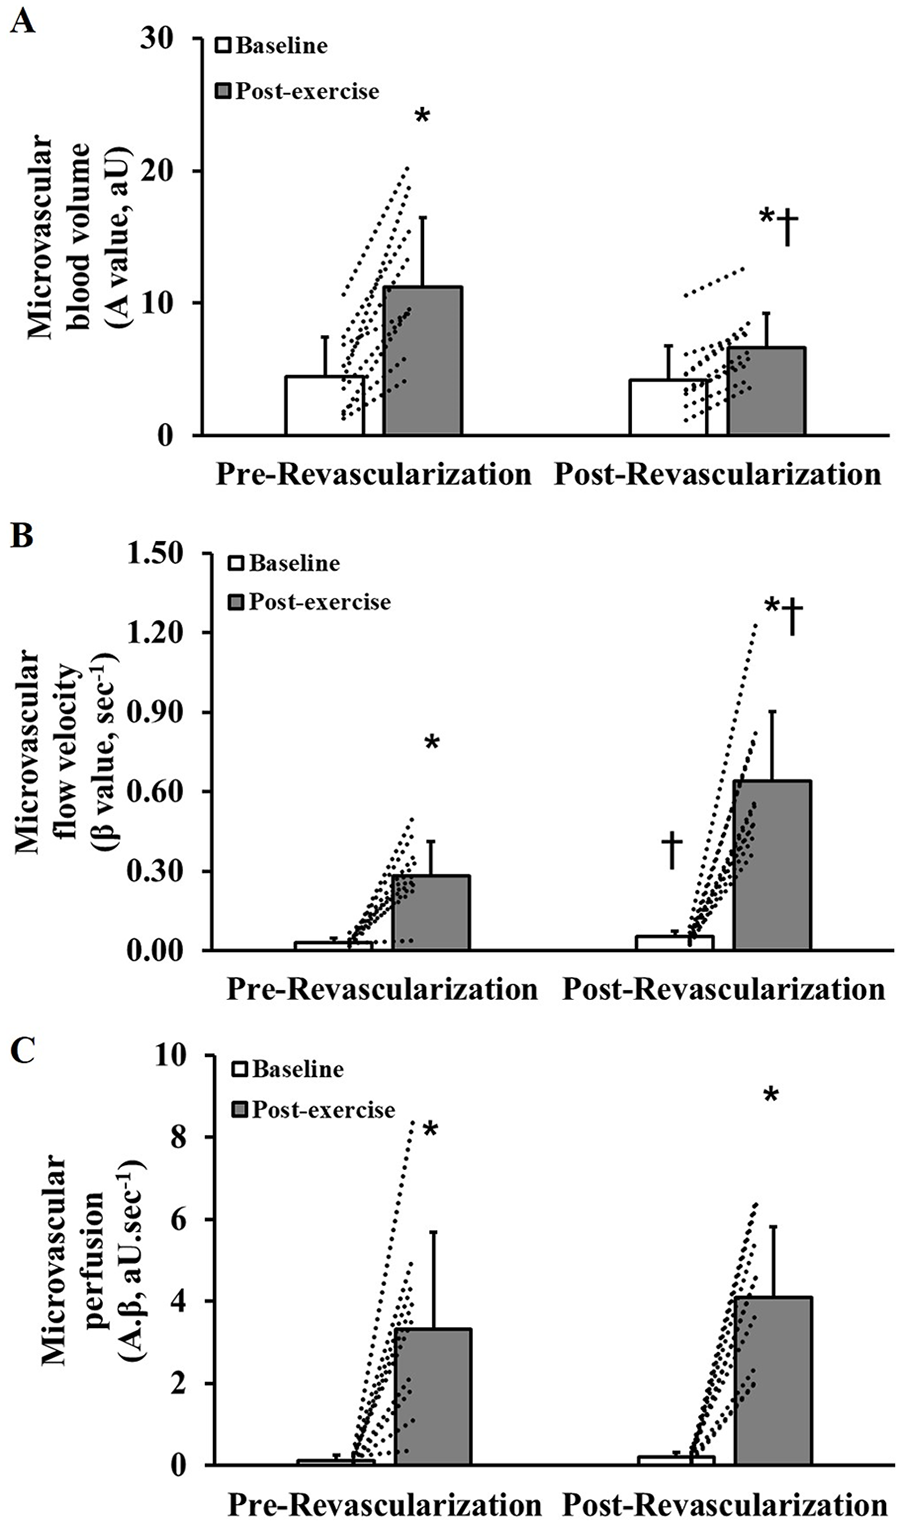
Baseline and post-exercise calf muscle microvascular blood volume (panel A), flow velocity (panel B) and perfusion (panel C) in patients with peripheral artery disease (n=9) before and after lower-limb endovascular revascularization. Values are mean and SD. Dotted lines indicate individual participant responses. *Indicates significant difference compared with baseline (p<0.05) using a 2-way repeated-measures ANOVA with Tukey post hoc test. †Indicates significant difference compared with same time point at pre-revascularization (p<0.05) using a 2-way repeated-measures ANOVA with Tukey post hoc test.
Discussion
To understand the influence of conduit artery blood flow on muscle microvascular perfusion in PAD, the present study aimed to compare whole-leg blood flow and gastrocnemius muscle microvascular perfusion responses to submaximal leg exercise, before and after lower-limb revascularization. With revascularization there was an increase in whole-leg blood flow and vascular conductance during exercise. The exercise-induced muscle microvascular perfusion response did not change significantly with revascularization. However, the parameters that determine the exercise-induced changes in microvascular perfusion were altered with revascularization, where microvascular flow velocity increased, and this was offset by a decrease in microvascular volume.
The efficacy of lower-limb revascularization for improving short-term resting ABI and walking capacity in patients with PAD is well established. 23 Revascularization was successful in all patients in the current study. We showed that revascularization increased resting ABI toward normal values and led to an increase in pain-free and total walking distance during the 6-minute walk test by an average of 311 and 65 m, respectively. This improvement exceeds the minimum clinically important difference in 6-minute walk distance for patients with PAD (≥87 and ≥38 m, respectively; effect size=0.80). 24 This improvement was also reflected in the patients’ self-reported walking impairment, which is consistent with previous findings.19,25 Importantly, patients reported not being engaged in exercise training or regular physical activity at both time points. Therefore, their improved capacity to walk and perform physical activities after revascularization can be attributed to the improved lower-limb hemodynamics and are unlikely to be associated with any meaningful change in physical activity levels.
While it is often assumed that leg blood flow during exercise is impaired in patients with PAD, few studies have attempted to quantify conduit artery or whole-leg blood flow during submaximal exercise in this patient group.26,27 We used a fixed-intensity (300 N) tightly controlled submaximal plantar-flexion exercise protocol. This corresponds to ~30% to 35% of the patients’ MVC force, a workload that reflects activities of daily living that can be sustained within the symptomatic limits of patients. Using a similar approach (400 N), we have previously shown that whole-leg blood flow did not differ during exercise between patients with PAD and healthy older adults. 10 In the present study, we found that restoration of conduit artery blood flow with revascularization resulted in a small but significant increase in whole-leg blood flow during exercise. While patients were not limited in their ability to complete the plantar-flexion exercise test prior to revascularization, this small improvement in whole-leg blood flow with revascularization corresponded with the improvement in symptoms and maximal walking capacity.
Despite the improvements in resting ABI and whole-limb blood flow during leg exercise, an important finding was that there was no change in the exercise-induced calf muscle microvascular perfusion with revascularization. It is assumed that muscle perfusion during exercise is tightly matched with metabolic demand which, for a given muscle mass, is primarily determined by the intensity of exercise. Given that the plantar-flexion exercise was performed at a consistent submaximal intensity, it can be assumed that the metabolic and blood flow demand did not change between the pre- and post-revascularization tests. Our findings contrast with results from a pilot study reported by Davidson et al, 7 which showed a marked increase in exercise-induced calf muscle perfusion following lower-limb revascularization in patients with PAD. Importantly, the intensity of exercise used in that study was much greater (20 W vs ~5 W in the present study) and was likely near or beyond the hemodynamic limits of the patients prior to revascularization. As such, the restoration of conduit artery blood flow with revascularization likely contributed to the significant increase in muscle perfusion to more fully meet the demands of the high-intensity exercise. Whereas in the present study, even with the restoration of conduit blood flow and an improvement in symptoms, there was no change in muscle microvascular perfusion confirming that the submaximal exercise was within the hemodynamic limits of the patients (before and after revascularization).
Skeletal muscle perfusion is determined by the product of microvascular blood volume and microvascular flow velocity (rate). It has previously been reported that a failure to augment muscle perfusion during high-intensity leg exercise primarily occurs due to an attenuation in microvascular flow velocity in patients with PAD. 7 In our previous study, we observed that the increase in muscle perfusion in response to submaximal leg exercise relied on a greater increase in microvascular blood volume, which offsets the attenuated increase in flow velocity, in patients with PAD compared with healthy control participants. 10 Our present study confirms that this is likely to be a compensatory response for the limited conduit artery blood flow capacity of patients with PAD. With the restoration of conduit artery blood flow (with successful revascularization), the microvascular response was “normalized,” where there was an increase in the flow velocity response and a reduction in the microvascular blood volume response, with no net change in total microvascular flow (perfusion) in response to submaximal leg exercise. Indeed, the microvascular volume and flow velocity responses to submaximal leg exercise following revascularization in patients with PAD were similar to the responses we have previously observed in younger and older adults without PAD. 20
These findings add to our understanding of the impact of conduit artery blood flow limitation on the characteristics of skeletal muscle microvascular perfusion. Although the mechanisms for these responses are not clear, we hypothesize that the impaired conduit artery blood flow in patients with PAD limits the microvascular velocity response to exercise, and that a contraction or exercise-mediated increase in microvascular volume enables muscle perfusion to be maintained during submaximal exercise. This response would depend on a redistribution of blood flow to the working muscle, facilitated by vasodilation of the local microvascular network and/or de novo capillary recruitment.28,29 Redistribution of muscle capillary blood flow has previously been described during moderate-intensity exercise independent of changes in limb inflow.30,31 A similar compensatory or autoregulatory response has been reported in a canine model of ischemic heart disease, where myocardial perfusion is maintained with increasing severity of coronary artery stenosis through progressive increases in microvascular volume. 12 However, the reported impact of artery stenosis on microvascular volume was less clear in response to muscle contraction and a vasodilator (adenosine) stimulus in a canine model of PAD. 32 In the previously mentioned study by Davidson et al, 7 the increase in muscle microvascular volume during high-intensity exercise was ~25% lower in patients with PAD compared with the control group. This indicates that there is likely to be a limit to this functional compensatory response that may contribute to the limited muscle microvascular perfusion, and potentially the limited exercise capacity of patients with PAD during higher intensity exercise.
Given the positive association between CEU measures of muscle microvascular volume and muscle capillary density, 33 the microvascular volume response to high-intensity exercise may also be limited by morphological changes, including a reduced capillary density2,4 or capillary-to-fiber ratio 3 in patients with PAD. Therefore, it is likely that both functional and structural changes at the microvasculature contribute to the close association between muscle capillary supply and exercise tolerance in patients with PAD.2 –4 It is plausible that functional vascular impairments, for example, limited capacity for microvascular vasodilation and slowed blood flow kinetics, are evident during submaximal exercise, and ultimately muscle perfusion is capped or restrained at its maximum during high-intensity exercise by the limited muscle capillary density or structure. To better understand the structural and functional contribution to the perfusion impairment in patients with PAD, there is a need to assess the responses of microvascular perfusion parameters, including microvascular flow, rate and volume, to different intensities of exercise (submaximal to high-intensity), and to test their association with muscle capillary density and structure. Moreover, a better understanding of the structural and functional vascular limitations associated with PAD would facilitate the development of targeted treatment strategies, for example, where lower-limb revascularization is combined with exercise training or other angiogenic therapies to maximize muscle microvascular perfusion capacity.34 –36
While the assessment of muscle oxygen uptake was beyond the scope of the current study, it is plausible that alterations in microvascular blood volume or velocity, even when perfusion is maintained, may lead to changes in muscle oxygen extraction. Previous experimental studies show that decreasing exercise limb blood flow via the inhibition of nitric oxide 37 or decreasing post-exercise muscle microvascular volume using compression garments 38 may augment muscle oxygen extraction. Using near-infrared spectroscopy, it has previously been reported that muscle oxygen uptake kinetics are slowed during walking exercise in PAD, 39 but that the magnitude of tissue desaturation is greater during fatiguing calf exercise in PAD compared with control. 40 Future investigations exploring muscle oxygen uptake and utilization might help clarify the specific impact of change in microvascular velocity, volume, and flow, and the subsequent effects on functional outcomes.
We have considered several potential study limitations. While the current study included a relatively small study sample, a priori power calculations were performed for the key outcome variables, including exercise-induced muscle perfusion, and the sample size was similar or larger than that recruited for previous experimental studies of this nature.7,41,42 Patients presented with a wide range of arterial lesions that differed in hemodynamic severity and location, and we are not able to determine whether lesion characteristics affected muscle microvascular perfusion responses. Our study design does not allow for comparison between limbs as only single-limb measures were made. Measuring the contralateral limb may provide a strong control for similar studies in future, although it is noteworthy that 5 out of 9 patients included in our study had bilateral disease. Patients reported taking various prescribed medications, including antiplatelet agents and statins, which are known to affect vascular function in patients with PAD.43,44 However, any effect of medications on the outcome measures is likely to be minimal, as medication dose was unchanged, and patients acted as their own control. The time frame between pre- and post-revascularization assessments was guided by the treating vascular surgeons and the recovery of each participant, where patients were re-assessed as soon as they were deemed able to resume normal activities of daily living (including bathing, driving, etc). It is possible that patients who had a longer recovery period following revascularization may have undergone some training-like vascular adaptations that impacted the findings. This is unlikely given that patients were in a state of recovery and were likely sedentary during this period, although we are not able to verify this with objective measures of physical activity. It was not possible to make simultaneous measurements of whole-leg blood flow and calf muscle microvascular perfusion as CEU is prone to motion artifacts caused during exercise. 45 Synchronized measures would have strengthened our ability to investigate the association between conduit artery flow and microvascular perfusion during exercise in patients with PAD. Finally, we have previously demonstrated that our method for the assessment of muscle microvascular perfusion is highly reliable at rest (intraclass correlation coefficient: 0.91 [95% confidence interval [CI]: 0.83–0.96]) and in response to exercise (0.95 [95% CI: 0.88–0.98]). 10 Recent work using CEU for measures of skeletal muscle perfusion has suggested normalizing measures to the total microsphere concentration in the body, which is done by using an arterial microsphere measure at a submaximal infusion rate to account for variance in blood volume/body morphology between participants or variations in the concentration of the contrast agent. 46
Conclusion
The findings from this study support the notion that the impairment in conduit artery blood flow in patients with PAD leads to compensatory changes in microvascular blood volume and flow velocity to maintain muscle microvascular perfusion during submaximal exercise. Moreover, this study demonstrates that these microvascular changes are reversed and become normalized with successful lower-limb endovascular revascularization. Findings from this study are important from a clinical and basic science perspective and provide further insight into the role that muscle microvascular impairment may play in the symptoms and exercise tolerance of patients with PAD.
Footnotes
Acknowledgements
We thank Mrs Suzanne Ryan and Mrs Sandra Allen from the Sunshine Coast University Hospital, and Mrs Jill Webber from the Sunshine Vascular Clinic for their assistance with patient recruitment. We also sincerely thank the patients who volunteered to take part in this study.
Declaration of Conflicting Interests
The author(s) declared no potential conflicts of interest with respect to the research, authorship, and/or publication of this article.
Funding
The author(s) disclosed receipt of the following financial support for the research, authorship, and/or publication of this article: This study was supported by grants from the University of the Sunshine Coast, the National Health and Medical Research Council ([NHMRC] 1063476 and 1000967) and Queensland Government. J.G. holds a Practitioner Fellowship from the NHMRC (1117061) and a Senior Clinical Research Fellowship from the Queensland Government, Australia.