
Abstract
Introduction:
While the operator radiation dose rates are correlated to patient radiation dose rates, discrepancies may exist in the effect size of each individual radiation dose predictors. An operator dose rate prediction model was developed, compared with the patient dose rate prediction model, and converted to an instant operator risk chart.
Materials and Methods:
The radiation dose rates (DRoperator for the operator and DRpatient for the patient) from 12,865 abdomen X-ray acquisitions were selected from 50 unique patients undergoing standard or complex endovascular aortic repair (EVAR) in the hybrid operating room with a fixed C-arm. The radiation dose rates were analyzed using a log-linear multivariable mixed model (with the patient as the random effect) and incorporated varying (patient and C-arm) radiation dose predictors combined with the vascular access site. The operator dose rate models were used to predict the expected radiation exposure duration until an operator may be at risk to reach the 20 mSv year dose limit. The dose rate prediction models were translated into an instant operator radiation risk chart.
Results:
In the multivariate patient and operator fluoroscopy dose rate models, lower DRoperator than DRpatient effect size was found for radiation protocol (2.06 for patient vs 1.4 for operator changing from low to medium protocol) and C-arm angulation. Comparable effect sizes for both DRoperator and DRpatient were found for body mass index (1.25 for patient and 1.27 for the operator) and irradiated field. A higher effect size for the DRoperator than DRpatient was found for C-arm rotation (1.24 for the patient vs 1.69 for the operator) and exchanging from femoral access site to brachial access (1.05 for patient vs 2.5 for the operator). Operators may reach their yearly 20 mSv year dose limit after 941 minutes from the femoral access vs 358 minutes of digital subtraction angiography radiation from the brachial access.
Conclusion:
The operator dose rates were correlated to patient dose rate; however, C-arm angulation and changing from femoral to brachial vascular access site may disproportionally increase the operator radiation risk compared with the patient radiation risk. An instant risk chart may improve operator dose awareness during EVAR.
Introduction
Endovascular aortic repairs (EVARs) are now primarily performed in hybrid operation rooms (ORs) because of the high level of intraoperative sterility, 3-dimensional (3D) imaging systems, and improved image quality, but at the cost of higher patient and staff radiation dose hazards.1,2 These radiation hazards are the highest for the first and second operators who are standing closest to the X-ray source. They are exposed to both, ionizing radiation dose scattered from the patient and radiation leakage from the X-ray tube. 3 Epidemiologic studies on radiation-induced cataract formation have shown that the eye lens may be a more radiosensitive tissue than previously considered. 4 The International Commission of Radiological Protection (IRCP) has used this evidence to propose a new occupational dose limit for the eye lens of 20 mSv (vs 150 mSv previously), averaged over a defined period of 5 years, with no single year exceeding 50 mSv. 5 These new dose limits are also affecting operators performing EVARs and primarily those who perform fenestrated and branched EVARs. Without appropriate radiation protection and training in the use of the protective devices, operators are now at a higher risk for reaching their yearly dose thresholds if not adequately protected. 6
The occupational radiation dose rates fluctuate during and between EVAR procedures in the hybrid OR and depend on various radiation predictors, including patient radiation dose fluctuation, the operating position, the type, how, and where the available shielding is applied.7,8 Current radiation dose software and hardware developments provide measurements of the patient and staff’s specific radiation dose during each image or X-ray acquisitions. 9 These strategies do provide a more thorough analysis to identify each radiation predictor’s effect sizes instead of being restricted to the cumulative radiation dose outcomes or phantom studies only.
In this study, we analyze the estimated effective radiation dose hazard as measured for each X-ray acquisition and determine the effect sizes for the various radiation dose rate predictors for the operator measured during EVAR procedures. The outcome of the prediction model is used to develop an instant operator risk chart to visualize the predictors of the exposed radiation dose rates that can be expected during EVAR in the hybrid OR.
Materials and Methods
Study Design
The intraoperative patient and occupational radiation dose rates were recorded between February 2015 and April 2016 during all EVARs acquired in a hybrid OR, of which the cumulative radiation dose per procedure and per procedural step has previously been published. 7 All patients undergoing thoracic EVAR, patients for whom the first operator (FO) or the second operator (SO) were missing, and patients in whom X-ray acquisitions acquired during femoral access and those acquired during brachial access could not be distinguished were excluded. We excluded X-ray acquisitions from all of the included patients with a run time of <1 second, X-runs acquired in a protocol other than the abdomen protocol. The X-ray acquisitions with missing (or zero) values for both first and second operator for the same X-ray acquisitions were also excluded. Distribution analysis was performed between included (nonzero) and excluded (zero or missing) X-ray acquisitions.
Dose Measurements
All X-ray acquisitions and patient dose rate measurements were acquired with the Philips AlluraClarity Xper FD20 Flexmove system (Philips Medical Systems, Best, the Netherlands) while the operator dose rates were measured with the Dose Aware Xtend (DAX, Philips Medical Systems).
The personal dose meter (PDM) of the DAX was attached on top of the lead apron of the right breast of both the FO and SO. The PDMs have been calibrated for personal dose equivalent Hp(10) (ISO 4037) at a depth of 10 mm and have a dose range between 40 µSv/h and 500 mSv/h (Supplementary Data). Because the hybrid OR facilitates working on both sides of the operating table, all radiation protection equipment is present for both sides while working from the femoral access site, including 2 ceiling-mounted lead screens, 2 radiation-absorption blankets (Radpad; Worldwide Innovations & Technologies Inc, Kansas City, MO; US type 5511A), and 2 table skirts attached to the table. Only a single ceiling-mounted lead screen could be used during brachial access (Figure 1). The first included patient in this study was treated 18 months after our transition to the hybrid OR, and thus, all staff were familiar with the radiation equipment and using the radiation shielding materials, as well as a focus on using active collimation, and minimize the air gap. Also, the operators were aware of the higher dose rates during digital subtraction angiography (DSA) acquisitions, as was previously shown. 2 Cone-beam computed tomography–based 3D image fusion was utilized during fenestrated and branched EVAR to assist target vessel cannulation and stenting. Operators remained primarily at the tableside during 2 fps (frames per second; which were generally shorter) and fluoroscopy roadmaps but took additional distance from the table during longer 3 fps acquisitions (primarily acquired posttreatment to evaluate the novel graft on potential endoleaks).
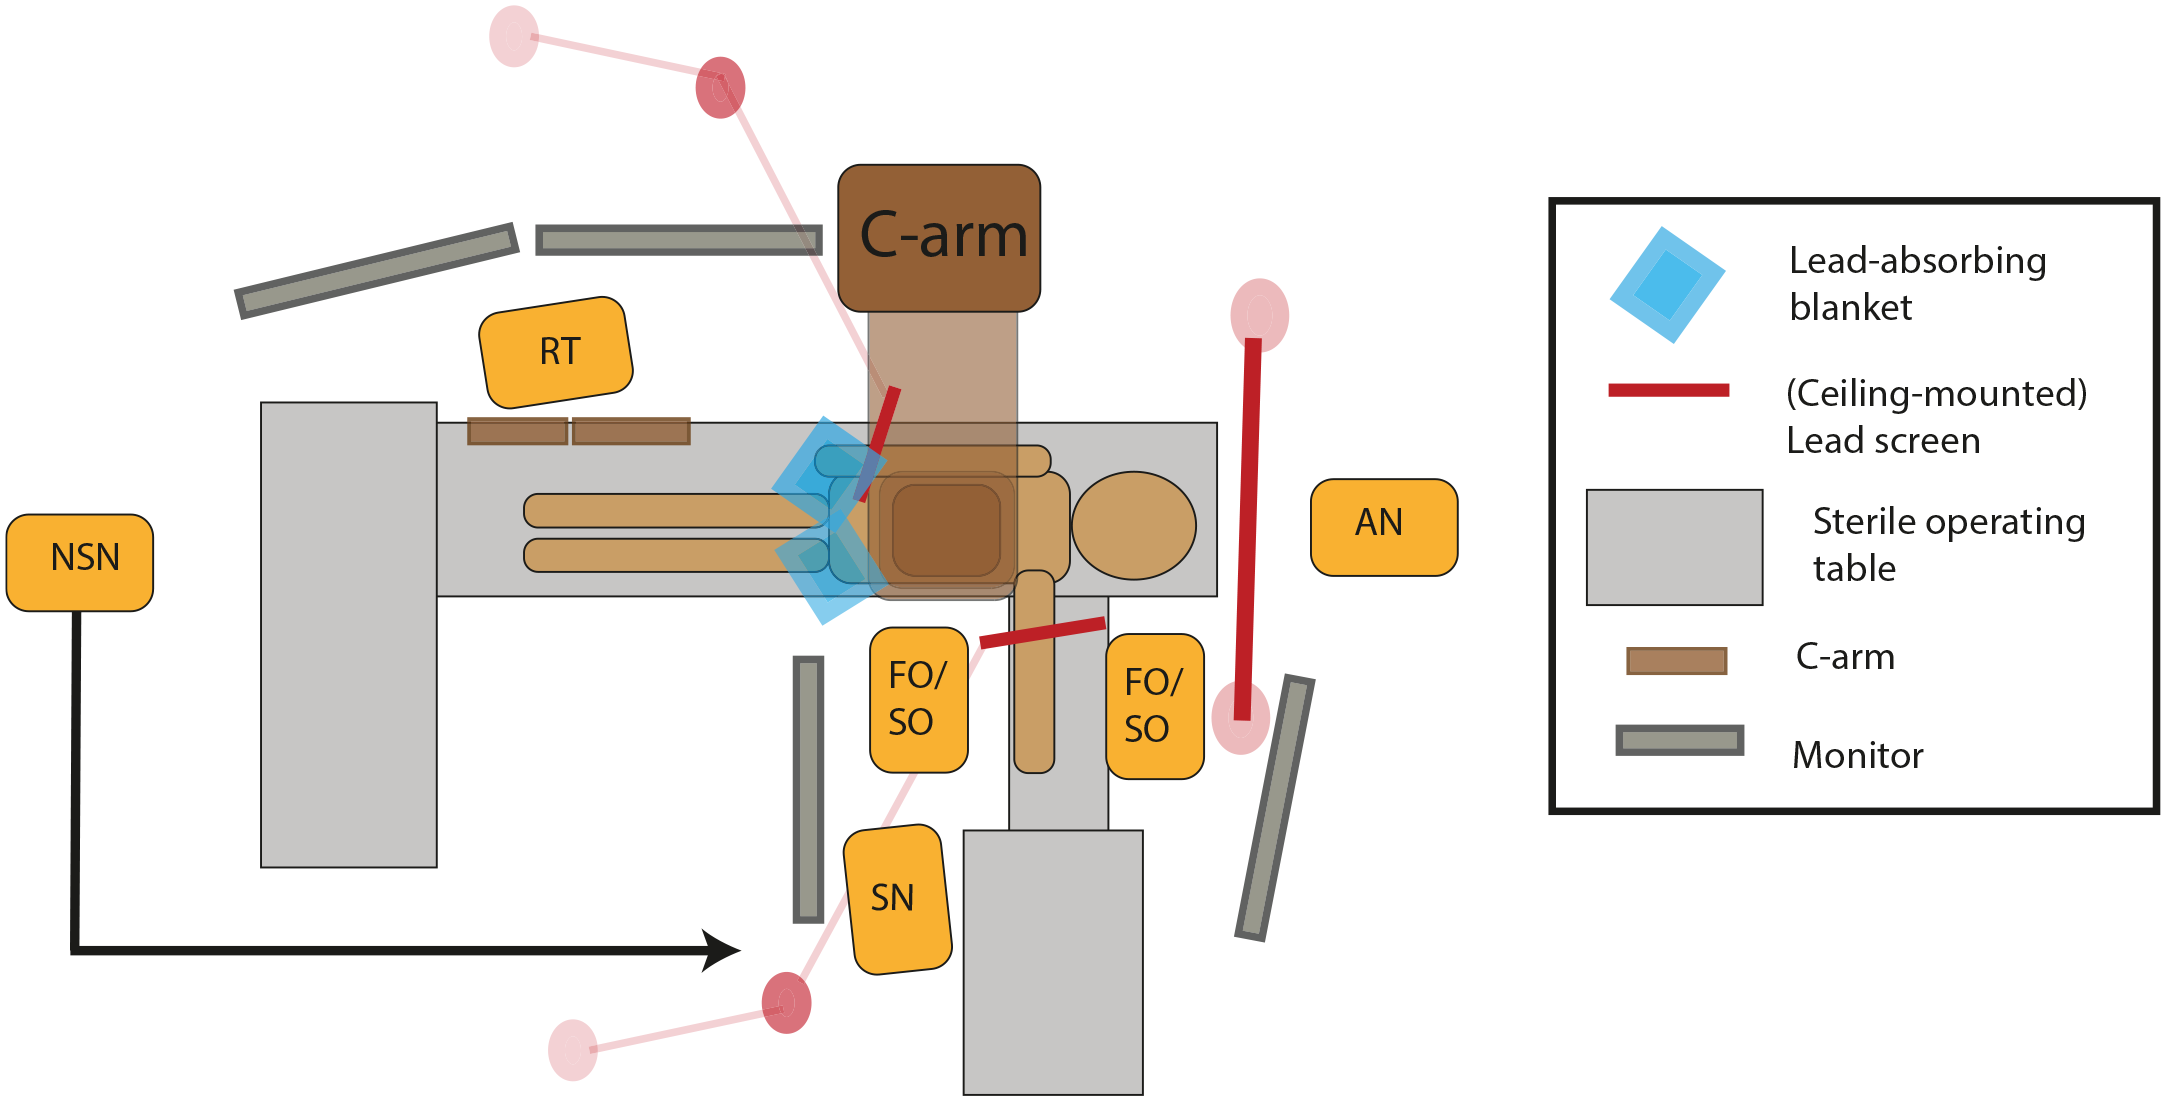
Overview of our hybrid operation room setting during brachial access. FO, first operator; SO, second operator; SN, sterile nurse; NSN, nonsterile nurse; AN, anesthesiologist; RT, radiation technologist.
Dosimetry
Patient radiation dose rates and C-arm characteristics and settings were extracted from the structured dose (SR) digital imaging and communications in medicine (DICOM) reports as submitted by the C-arm. The operator dose rates were extracted from the SR DICOM as created by the Dose Aware Xtend using Matlab 2016a software (Mathworks, Natick, MA, USA). The patient and operator radiation dose rates of each acquisition were merged based on the matching X-ray timestamps. Additionally, the vascular access site was manually noted during the procedures, including a change in the vascular access site from femoral to brachial access.
The mean dose area product (DAP) per X-ray acquisitions was chosen as the primary predictor for the patient radiation dose rates, DRDAP, which was further referred to as DRpatient in Gy·cm2/s. DAP is a stochastic metric that represents the cumulative radiation dose given to the patient.
In addition, the operator (estimated) effective (E) radiation doses rate (DRoperator) was established by taking the highest dose rate as that was measured from either the FO or the SO for each X-ray acquisition and was measured in mSv/h. This method’s rationale is that the FO and SO are not fixed to the patient’s left or right sight but frequently change operating positions during and between patients, especially during longer procedures such as fenestrated or branched EVAR. This outcome is also referred to as the maximum operator dose but is further referred to as the operator dose. The effective dose is a tissue-weighted sum of the irradiated organs’ absorbed dose and represents the stochastic radiation risks.
Radiation Predictors
The radiation predictors included in the uni- and multivariate patient and operator dose models have been described in more detail in Supplemental Table S1. Of the included radiation predictors, the radiation protocols, the absolute C-arm angulation and rotation (ranging from 0° to 90° for rotation and from 0° to 40° for angulation), the field size and body mass index (BMI), and the air gap [which is 120 cm minus the source-to-image distance (SID)], have been evaluated in a patient radiation dose model before. 10 In the current study, the vascular access site (femoral vs brachial access) was added to the patient and operator dose rate models. In addition, a third DSA protocol was added besides the 2 and 3 fps, which was referred to as a roadmap. During this protocol, the contrast was injected combined with fluoroscopy-based acquisition parameters.
Statistical Analysis
Statistical analyses were performed using R 2.15.1 software (R Core Team, 2012), using lme4 packages (version 1.1-8). Radiation dose rates were nonnormally distributed and are presented as median with the interquartile range (IQR). Medians were compared using the Mann-Whitney test, and significance levels were set at an α of <0.05. For further analysis, data were stratified between fluoroscopy X-ray acquisitions and DSA X-ray acquisitions.
First, the distribution of all the predictors was tested between all X-ray acquisitions where operator (thus SO and FO) values were 0 or were missing compared with the X-ray acquisitions that were included in the model, understanding whether there was a trend in the amount of radiation runs where the operator dose was missing.
Second, we conducted a univariable and multivariable log-linear regression analysis, using a (hierarchic) mixed-effects model, with the radiation predictors (BMI, air gap, rotation, angulation, access site, and protocol) as the fixed effect and patient as the random effect, similar to the analysis described previously. 10 This mixed model was chosen because runs acquired in a similar patient are not independent, and a mixed model accounts for patient-level clustering. All predictors were incorporated in the multivariable model independent of significance from the univariable model.
Visual inspection of the residual plots was done on apparent deviations from homoscedasticity or normality. The variance inflation factor was assessed to identify any multicollinearity; outliers in each model were checked to find a pattern. P values were obtained by likelihood ratio tests of the full model with the predictor against the model without the predictor in question. The intraclass correlation coefficient and goodness of the fit (r2) were obtained for each model.
β-Estimates and bootstrapped confidence intervals, obtained from univariable and multivariable models, were back-transformed to a nonlogarithmic scale and are presented as odds ratios. An odds ratio of 1 does not influence the radiation dose, whereas an odds ratio of >1, for example, 1.5, increases the radiation dose with a 50% per increase step value. In addition, step sizes were increased for larger continuous variables: for angulation and rotation, 1 step consisted of a 30° C-arm angulation or rotation; for field size, 1 step consisted of a 200 cm2 decrease in field size toward maximum collimation; and for the air gap, 1 step consists of a 5-cm decrease in the air gap toward detector is maximum extended.
Odds of patient and operator’s prediction models were visually compared to analyze discrepancies and similarities between effect size and effect direction of each radiation predictor on dose rate.
Prediction Model
The estimates of the multivariable DRoperator were used to predict the operator radiation dose hazards under varying radiation predictors in mSv/h. Next, the predicted operator dose rates were converted to the number of radiation dose minutes that the operator can work under this configuration until the operator may reach the annual effective radiation dose year limit of 20 mSv. For example, at a dose rate of 1 mSv/h, operators could work 1200 minutes (or 20 hours) until they reach their maximum annual dose limit of 20 mSv. The predicted operator dose rates were translated into an operator dose rate risk chart, similar to a previously reported patient radiation risk chart. 10
Results
Patient and operator radiation dose rates from 24 noncomplex EVAR and 26 complex (fenestrated or branched) EVAR procedures were included, after excluding 2 patients for missing radiation dose date from both FO and SO, 4 patients for missing radiation dose date SO, and 2 patients for missing the vascular access site. The mean BMI of the included patient population was 26.6±3.2 kg/m2. Within the complex EVAR group, 88 target vessels were stented, on average 3.4±0.5 per intervention, divided by 74 (88%) from the femoral access and 14 (12%) from the brachial access site.
From the 19,317 X-ray acquisitions in the 50 patients, 6452 X-ray acquisitions were excluded (n=3072 for X-ray acquisitions of <1 second, n=73 non-abdomen protocol, n=158 missing vascular access site, n= 871 thoracic region). Besides, the DRoperator was zero (or below the measurement range) for 2272 (15.7%) of the fluoroscopic acquisitions and for 6 (1%) of the DSA acquisitions, which were excluded from the univariate and multivariate analysis.
A comparison between the included and excluded X-ray acquisitions can be found in Supplemental Table S2. A higher percentage of runs were excluded for the lower dose fluoroscopy runs protocol compared with the higher dose fluoroscopy protocol.
Protocols
A total of 12,226 (95%) fluoroscopy and 639 (5%) DSA acquisitions were included (Tables 1 and 2). During fluoroscopy, the median DRoperator was 0.119 mSv/h, while the median DRoperator during DSA was 0.833 mSv/h. The correlation between the patient and operator dose rates for the included X-ray acquisitions is shown in Figure 2.
Fluoroscopy X-Ray Distribution, Median Operator Dose Rate, and Median Amount of Minutes Until 20 mSv Is Reached.

Abbreviations: BMI, body mass index; DR, dose rate; IQR, interquartile range.
Digital Subtraction Angiography (DSA) X-Ray Distribution, Median Operator Dose Rate, and Median Amount of Minutes Until 20 mSv Is Reached.

Abbreviations: BMI, body mass index; DR, dose rate; IQR, interquartile range.
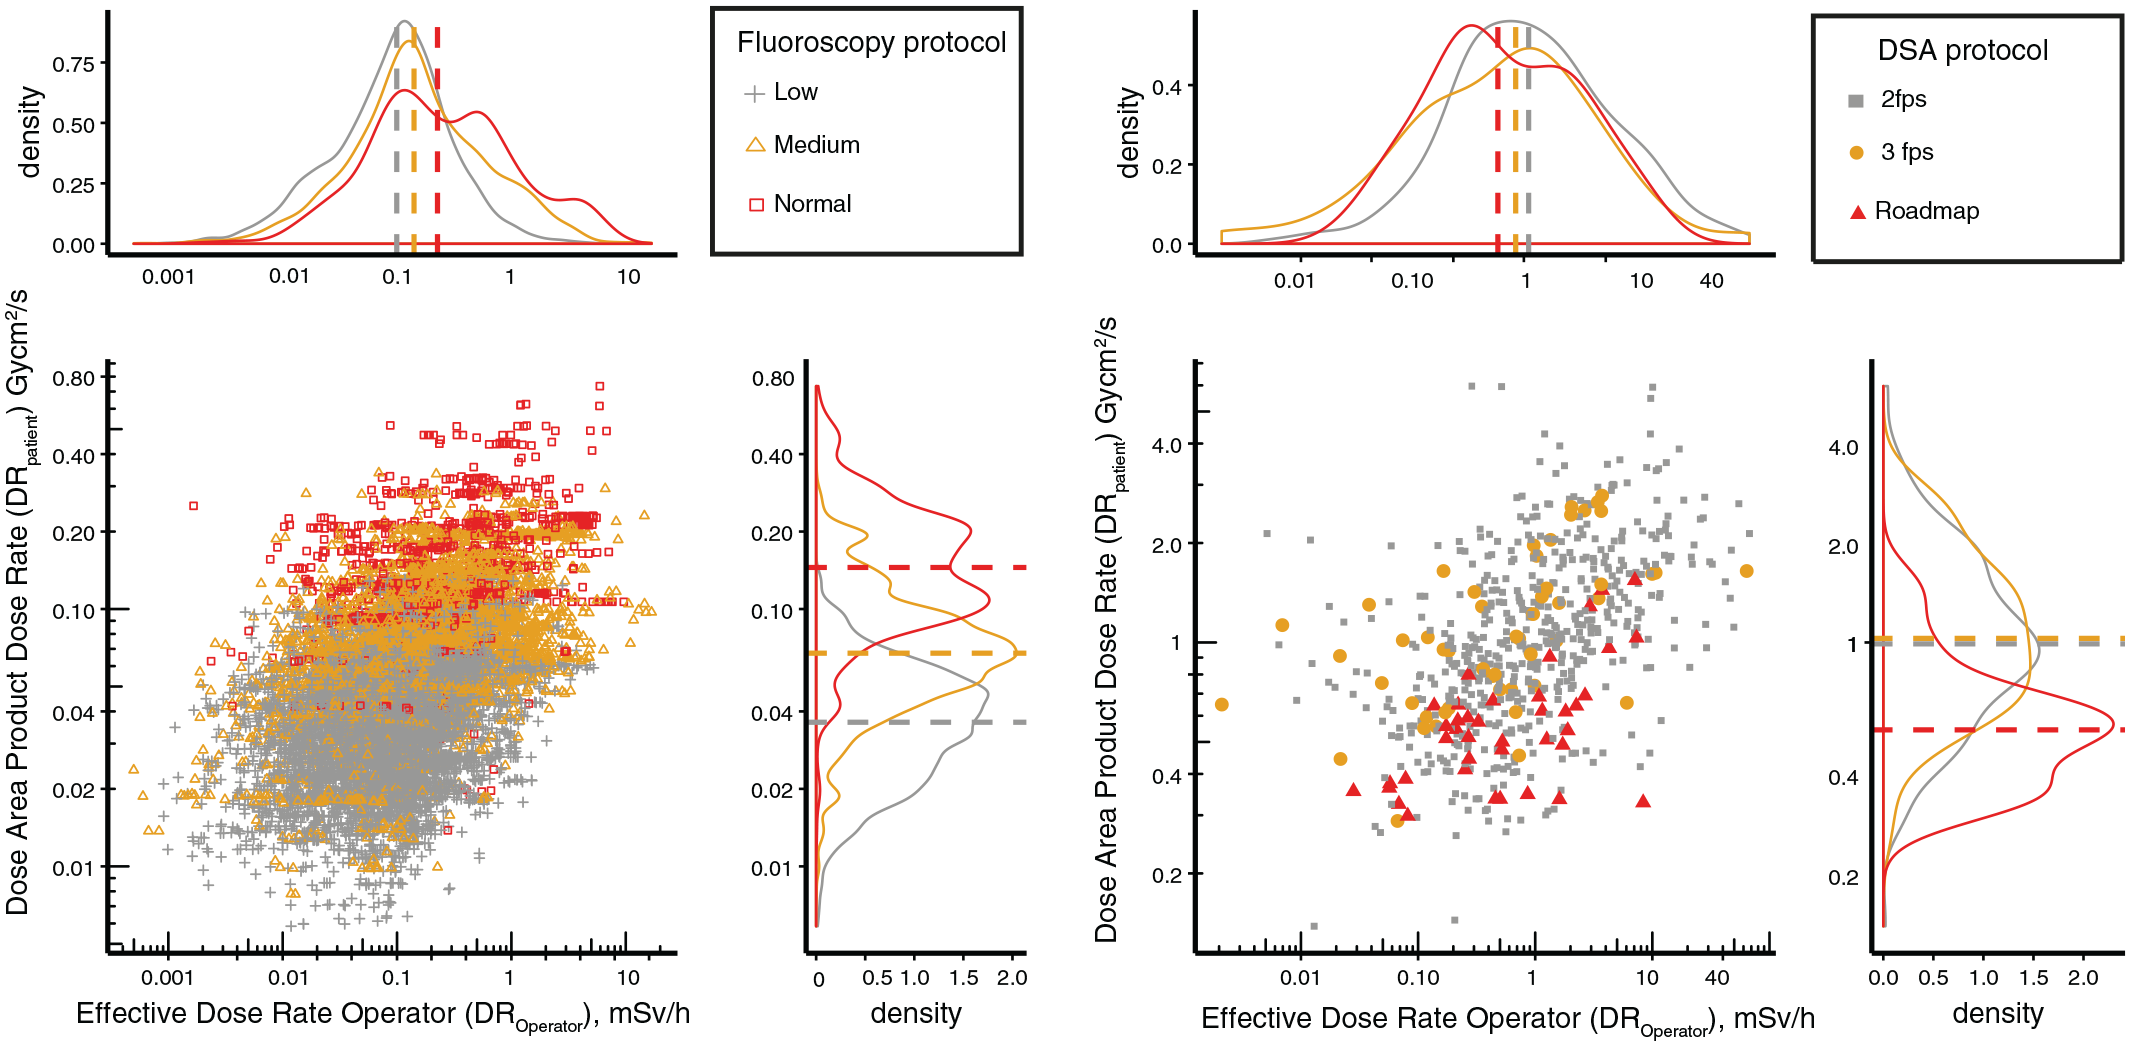
Scatter and density plot of DRpatient (in Gy·cm2/s) and DRoperator (in mSv/h) divided by fluoroscopy (A) and DSA (B). Additionally, colors correspond with the varying fluoroscopy radiation protocols that can be chosen (“levels 1 or “low,” vs level 2 “Medium” vs Level 3 Normal”) and for DSA (“2 fps” vs “3 fps” vs “Roadmap”). Dashed lines in de the density plots correspond with the median dose rate for these protocols for the patient (upper density plots) and operator (right density plots). DSA, digital subtraction angiography; fps, frames per second; DR, dose rate.
Body Mass Index
The median DRoperator was 0.104 mSv/h for X-ray runs acquired in patients with a BMI between 20 and 25 kg/m2 and was 0.226 mSv/h for patients with a BMI of >35 kg/m2.
C-Arm Rotation and Angulation
The median DRoperator increased approximately 4 times when rotating the C-arm from 0° to 15° to 75° to 90°, from 0.104 mSv/h to 0.443 mSv/h.
Field Size
For field size, the highest median DRoperator was measured between 1000 and 1200 cm2, at 0.194 mSv/h, whereas the lowest DRoperator was measured between 0 and 200 cm at 0.101 mSv/h.
Vascular Access Site
The femoral access site corresponded with a median DRoperator of 0.111 mSv/h vs 0.379 mSv/h for the brachial site. Tables 1 and 2 summarize all estimated effective dose rates specific for fluoroscopy and DSA.
Univariate and Multivariable Dose Rate Prediction Model
Fluoroscopy
The overall predictive value of the fluoroscopy DRpatient multivariate model was 0.82 (p<0.001), while the overall predictive value of the fluoroscopy multivariate DRoperator model was 0.38 (p<0.001).
All included radiation dose predictors for fluoroscopy were significant for both DRpatient and DRoperator in both the univariable (Supplemental Table S3) and multivariable prediction models (Figure 3). In the multivariate model, lower operator than patient effect sizes were observed for the selected X-ray protocol and C-arm angulation. A similar operator and patient effect size were observed for BMI and irradiated field size. Higher operator compared to patient effect size were observed for C-arm rotation and vascular access site.
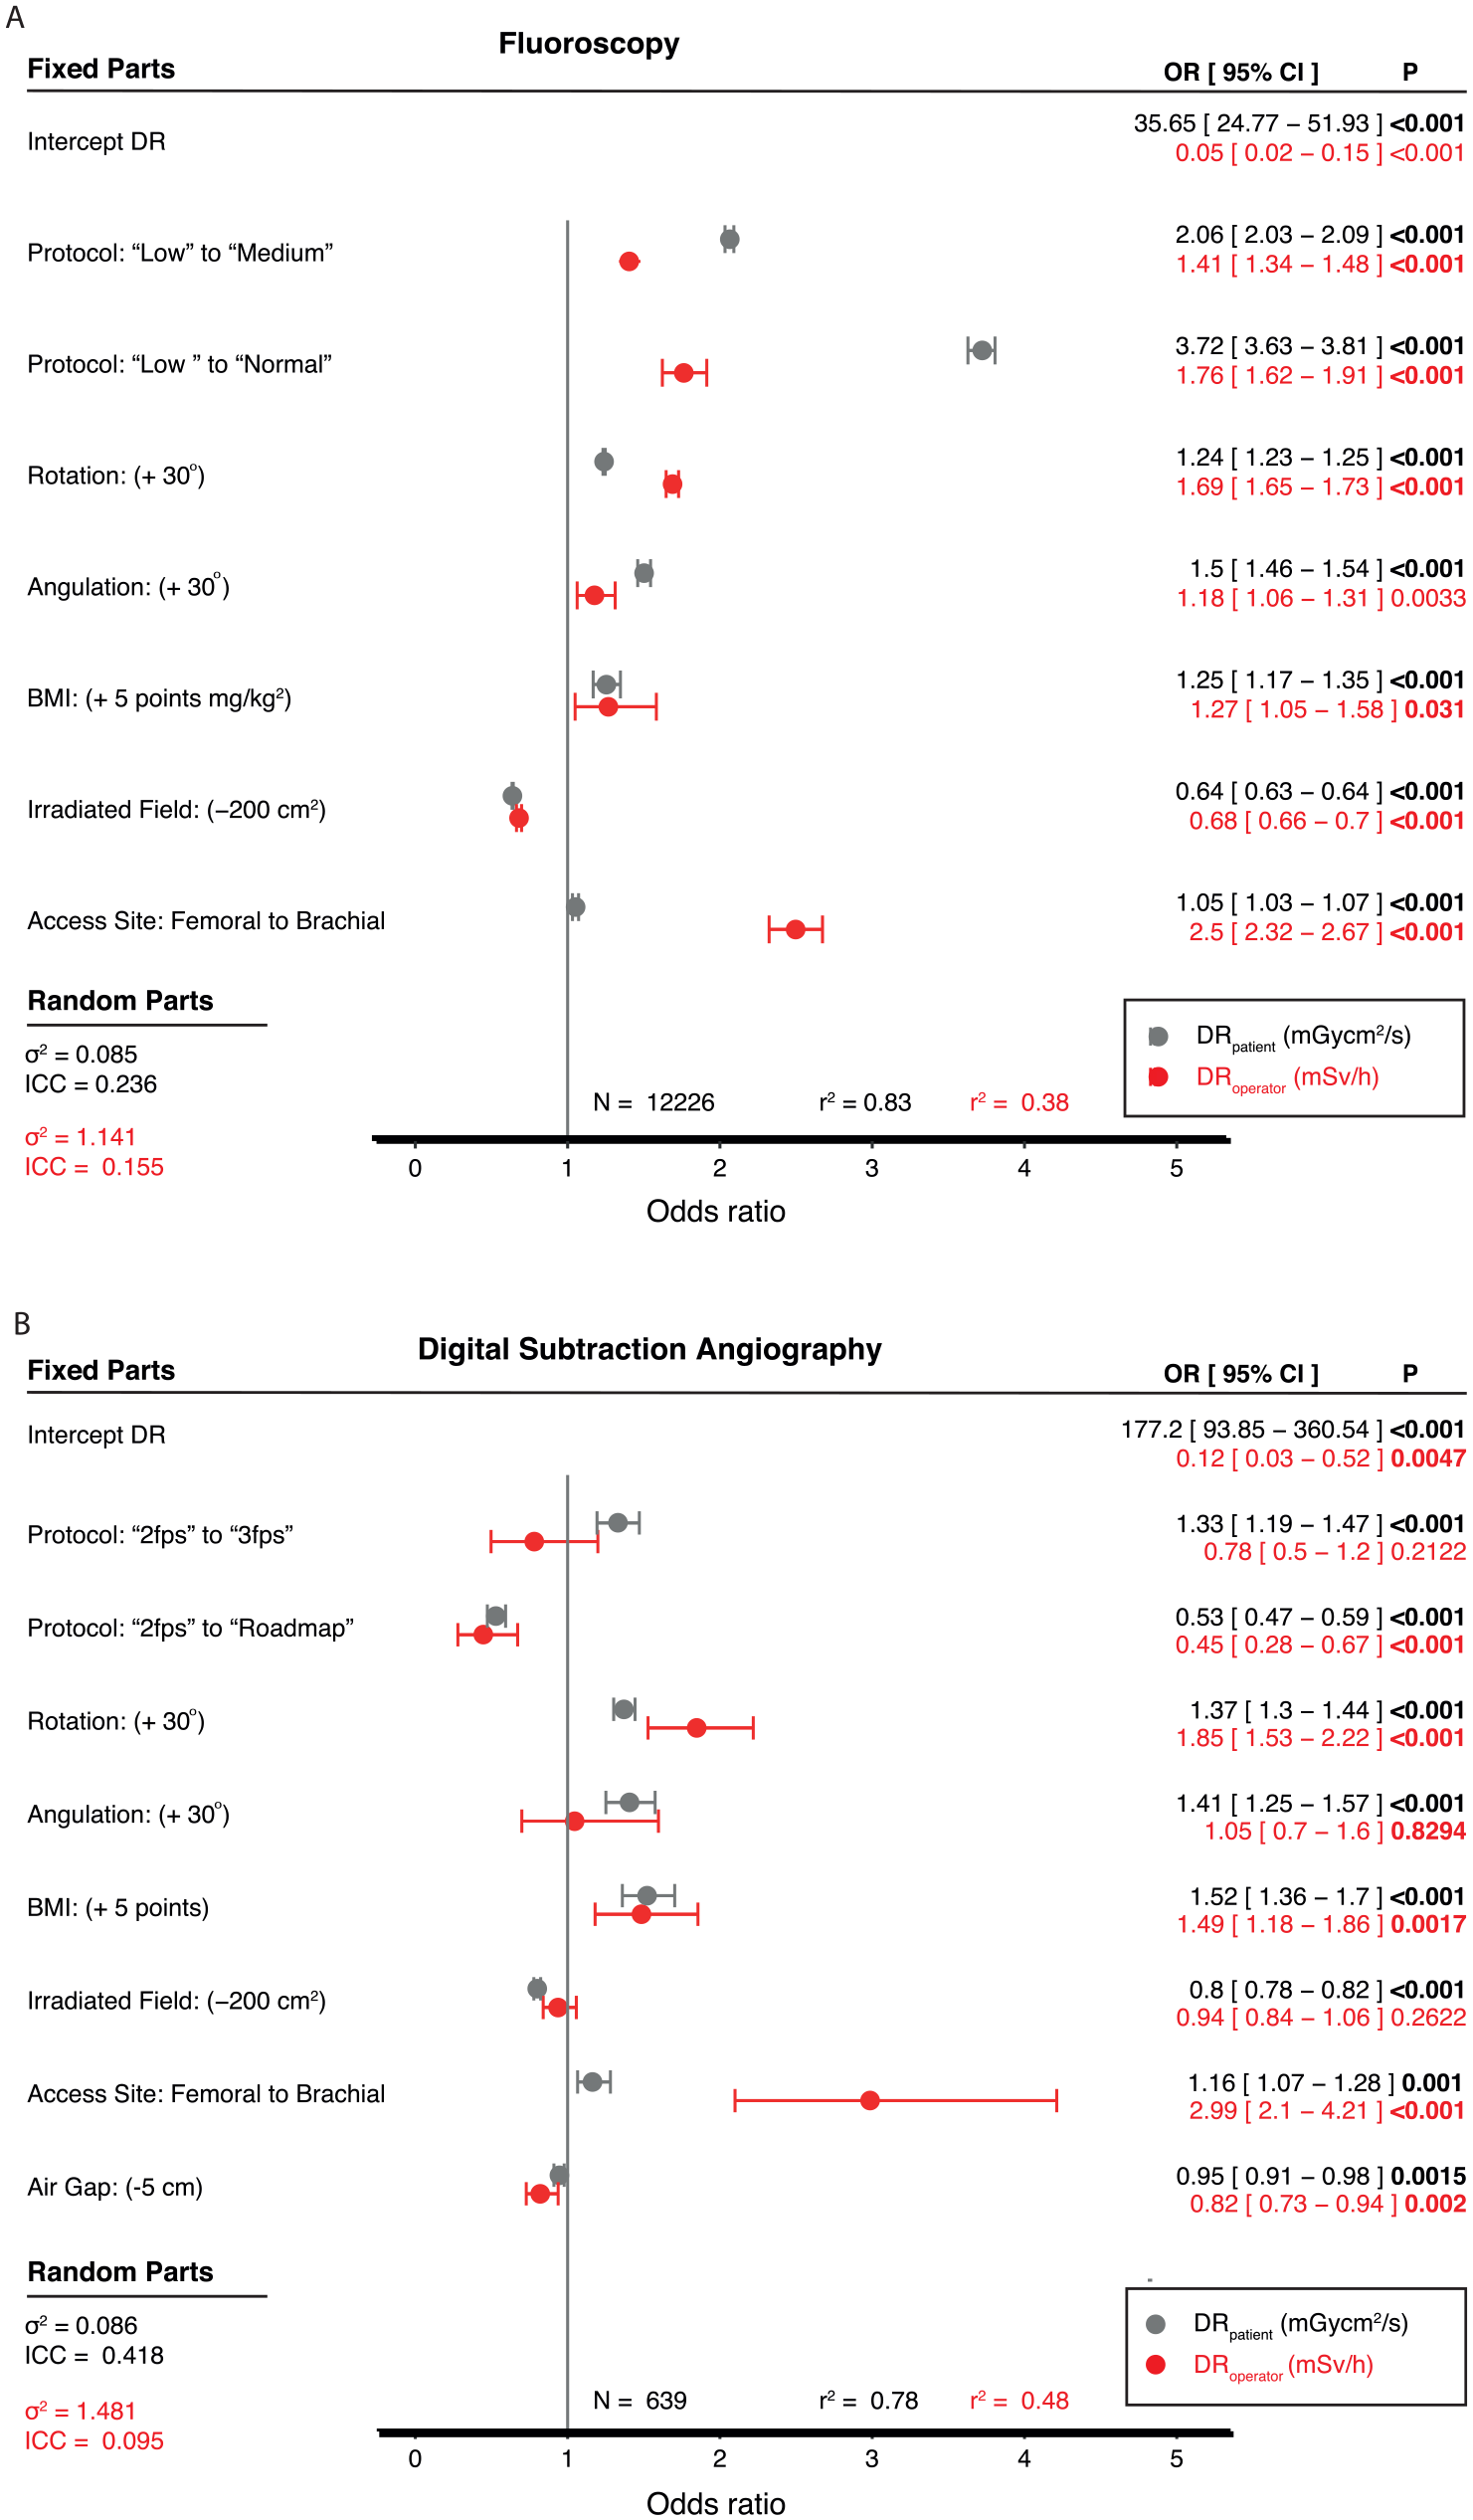
Odds ratio (OR) of multivariate models for DRpatient (in Gy·cm2/h) in gray and DRoperator (in mSv/h) in red for fluoroscopy (A) and digital subtraction angiography (B). An OR of 3 corresponds to a 300% increase in DR compared with the reference. ICC, intraclass correlation coefficient; OR, operation risk; CI, confidence interval; DSA, digital subtraction angiography; fps, frames per second; DR, dose rate; BMI, body mass index.
Primary discrepancies between patient and operator dose rate effect size were observed for protocol (higher for patient dose rates), C-arm rotation, and vascular access site (both higher for operator does rates).
For C-arm rotation, the DRoperator was 1.69 (corresponding to a 69% increase) vs DRpatient 1.24 (corresponding with a 24% increase) per 30° increase in rotation toward 90°. While the DRoperator increased by 250% (corresponding with an OR [95% CI] of 2.5 [2.32–2.67] when changing vascular access site from femoral to brachial access.
Digital Subtraction Angiography
The overall predictive value of the DSA DRpatient multivariate model was 0.78 (p<0.001), while the overall predictive value of the DRoperator multivariate model was 0.48 (p<0.001). In the multivariable DSA prediction model, only “2 fps to roadmap”, C-arm rotation, BMI, and access site and air gap were significant predictors for DRoperator. Changing from “2 fps to roadmap” corresponded with an effect size of 0.45, comparable to a 55% reduction in the operator dose rate. Also, C-arm rotation and vascular access site correlated with higher operator dose-effect size (85% increase in DRoperator per 30° of C-arm rotation toward 90°) and vascular access site (300% increase in DRoperator when changing from femoral to brachial access site).
Operator Risk Chart
Figure 4 illustrates the operator risk charts based on the predicted radiation dose rates according to the operator radiation dose rate prediction models. Green corresponds to low operator radiation dose rates between 0 and 0.2 mSv/h, orange corresponds to medium dose rates between 0.2 and 2 mSv/h, and red corresponds to dose rates >2 mSv/h. The operator risk charts reveals that a patient with a BMI of 30 kg/m2, using the fluoroscopy “medium” protocol, at 800 cm2 irradiated field, a 45° C-arm rotation, and femoral access results in a predicted operator dose rate of 0.28 [0.07–1.11] mSv/h, which corresponds with 4297 [16889–1077] minutes or radiation exposure until the 20 mSv operator dose limit may be reached. Changing the access site from femoral to brachial access would result in a predicted operator dose rate of 0.7 [0.18–2.72] mSv/h, which corresponds with 1724 [6657–441] minutes of radiation exposure until the 20 mSv dose limit may be reached.
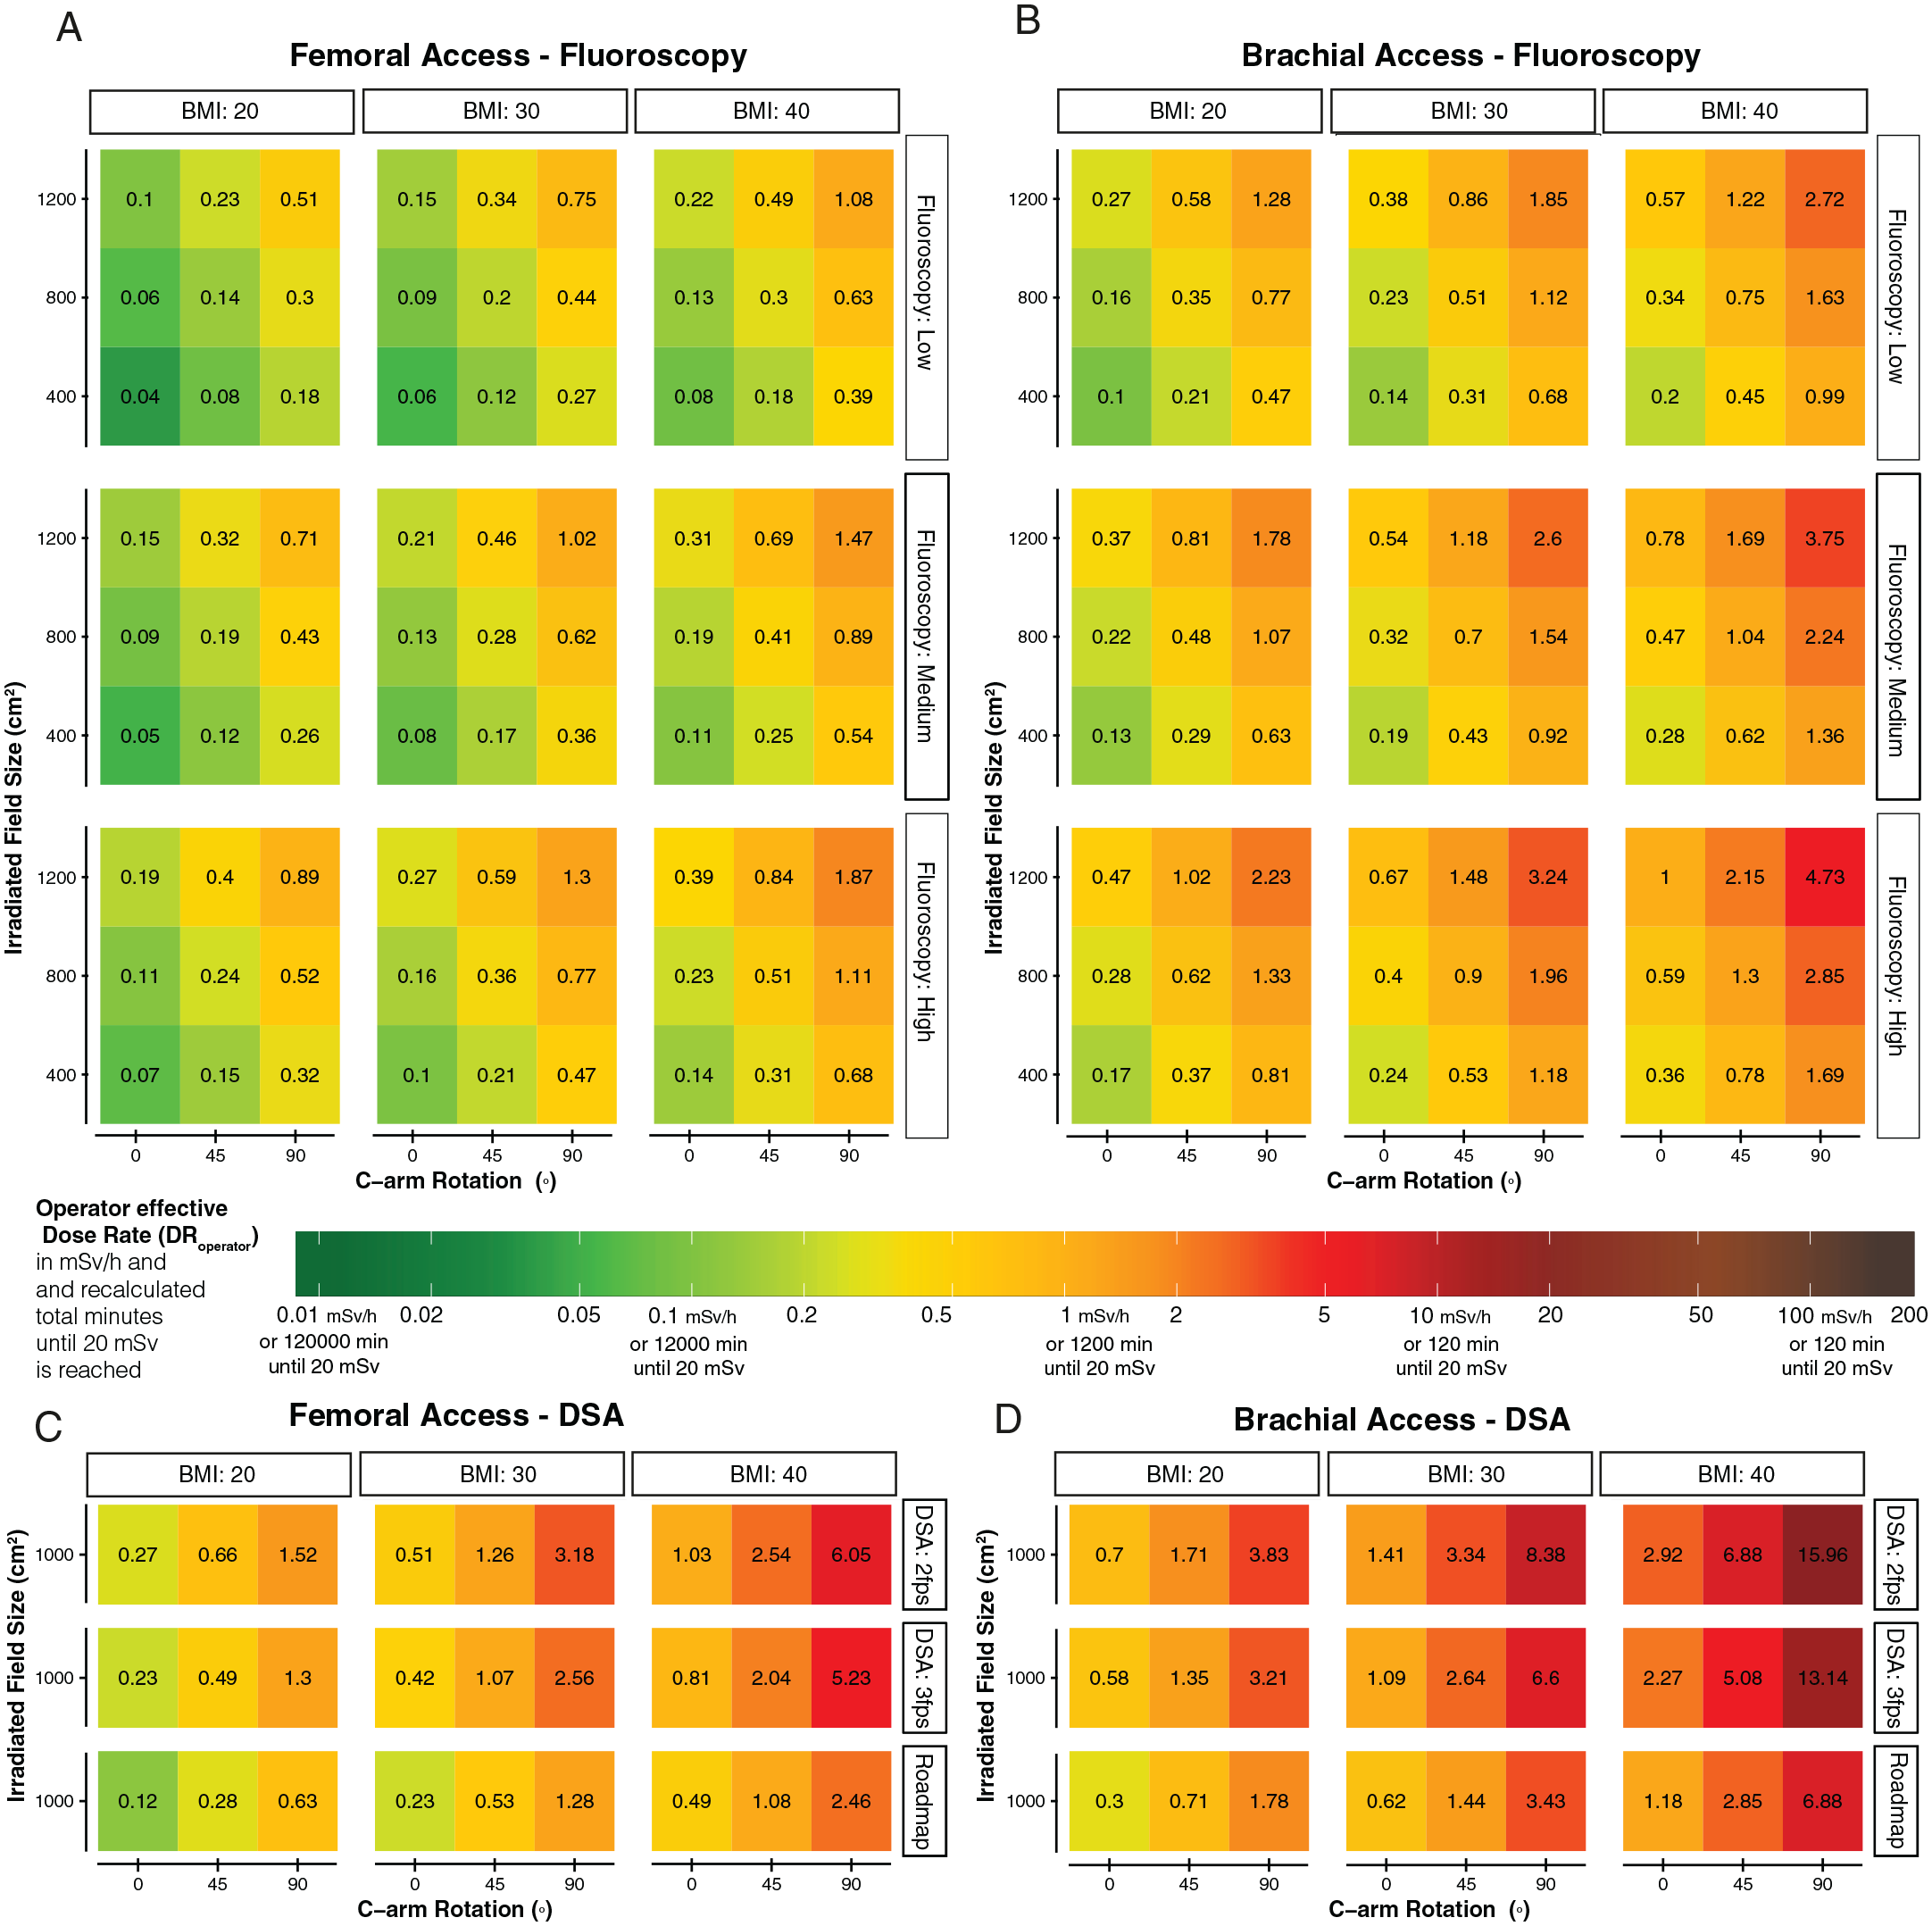
Operator risk chart of the predicted DRoperator for fluoroscopy femoral access (A), fluoroscopy brachial access (B), digital subtraction angiography femoral access (C), and digital subtraction angiography brachial access (D). The color coding represents the predicted amount of radiation minutes that can be acquired until the operator will reach his yearly dose limit of 20 mSv. Each risk chart interpretation should start with differentiation between the BMI of the patient (20, 30, or 40 kg/m2) and which protocol has been chosen fluoroscopy: (“low,” “medium,” “normal”) or for digital subtraction (“2 fps” and “3 fps” or “Roadmap”). Third, the y-axis is the chosen field size (1200 vs 800 vs 400 cm2) and on the x-axis is the C-arm rotation (0°, 45°, or 90°). For all predictions, the C-arm angulation was set at 0°. The SID was set at 100 cm. There is a major increase between femoral access and brachial access, with much higher radiation doses while working from the brachial access site. The numbers and colors in the chart correspond with the actual DRoperator value in mSv/h. The color bar also shows for each dose rate the number of minutes the operator could work in this configuration until the yearly dose may be reached. For example, 1 mSv/h (orange) corresponds with 1200 minutes of operating until the operator reaches its yearly dose. DR, dose rate; BMI, body mass index (mh/kg2); SID, source-to-image distance; DSA, Digital subtraction angiography.
Switching from fluoroscopy to a DSA acquisition at a 1000 cm2 field size, using “2 fps” DSA protocol, while accessing through a femoral access site, results in a predicted DRoperator of 1.28 [0.26–6.95] mSv/h. This dose rate can be translated to approximately 941 [4622–173] minutes of radiation exposure until the operator is at risk for reaching the 20 mSv year dose threshold. Exchanging from femoral to brachial access site, operators may reach their yearly 20 mSv year dose limit after 358 [1691–72] minutes.
Discussion
In this study, the discrepancies between the predictive value of patient BMI, C-arm settings, and vascular access site to the operator effective dose rates during EVAR in the hybrid OR have been assessed. It was shown that C-arm rotation and vascular access sites have a much higher effect on the exposed first or second operator effective radiation dose rates, as would have been expected from interpreting the patients exposed radiation dose rates in both fluoroscopy and DSA acquisitions.
We have shown that each 30° of additional C-arm rotation increases the operator dose by 69% (for fluoroscopy) and 85% for DSA imaging, whereas only a 24% (for fluoroscopy) or 37% (for DSA) increase would be expected when accounting for the increased dose rate to the patient. These results are consistent with previous radiation dose studies on C-arm rotation and correlative dose increase to the operator.11,12
The current fluoroscopy and DRpatient prediction model’s predictive value was compared with the previously reported DAP patient prediction models predictive value and the novel operator dose rate model’s predictive value. Unfortunately, the operator dose rate models were much less predictive (0.38 for fluoroscopy and 0.48 for the DSA operator dose rate model) than the patient dose rate prediction models. A lower overall predictive value of the model is expected for the operator models, as the patient radiation dose is strictly controlled by the system and the defined protocol settings, whereas dose limits are not restricted for the operator. The operator dose rate is much more multifactorial as many factors are affecting operating doses that were not included in this study, including variance in the bed position location, variance in the operator’s location, variance in badge sensitivity, location of the operator at the bedside, and so on. Data may also have been skewed as many radiation acquisitions were excluded as the PDM did not measure a dose rate, probably when the dose rate was below or above the calibrated dose ranges of the PDM. If the radiation dose rates were actually zero, or if the PDM did not record a dose rate due to a measurement error of the equipment or PDM position is unknown. The prediction model may overestimate the dose rates during these settings as a higher volume of X-ray acquisitions more runs were excluded in the “lower” dose protocols. Therefore, the generalization of this operator dose prediction model may be limited as compared to the patient radiation dose models.
Noticeable, but not significant, was the opposite effect that was observed for the operator’s effective dose rate during the 3 fps DSA imaging. Compared with 2 fps DSA, a reduction in exposed dose rate to the operator was observed with the 3fps DSA (although not significant), whereas an increase in the patient-exposed dose rate is provided with the increase in framerate.
The operator radiation protection habit of leaving the operating table during these longer acquisitions at a higher frame rate, whereas the operator remains at the operating table during the 2 fps standard DSA, may explain this effect. However, one can consider replacing the 2 fps DSA run with a fluoroscopy roadmap run to effectively reduce both patient and operator radiation hazards by 50% when leaving the operating table is not feasible. These “fluoroscopy roadmap” acquisitions are also accompanied by a lower signal-to-noise contrast and thus may only be feasible for a limited number of acquired DSAs in specific areas. This setting was primarily used during fenestrated and branched EVAR to evaluate whether the correct target vessel was cannulated.
Notable was the reduction in field size (by collimation or magnification), which significantly reduced the operator dose rates (as expected) during fluoroscopy, but this effect was not significant during DSA. Two explanations for this effect may be that generally larger field sizes are used during DSA or that DSA already accords for very high dose rates, and field size may become less critical. It has been shown that DSA acquisition, BMI, and rotation are the most important factors in defining the patient’s exposed radiation dose. 2
More concerning are the much higher operator radiation dose rates when working from brachial access sites, which exceed 2.5 to 3 times those of femoral access. Approximately 15% of the total runs were acquired from the brachial site. These higher dose rates are in line with the randomized trials on the cardiac catheterization access site, showing higher radiation doses for the operator during radial access. 13 While brachial access was the only method to gain successful vessel cannulation at the time of the study, a recent study has shown that the use of steerable guiding sheaths may reduce the need for brachial access in complex EVAR. 14
An unexpected finding was the increase in patient dose rates when changing from femoral to brachial vascular access site. One reason could be that the brachial access site may also correlate with the use of higher magnifications, a known cofounder that was unknown in this study because the magnification and SID were not reported in the SR DICOM files. While the operators are able to reach the maximum amount of shielding during femoral access, the shielding may not be optimal during brachial access. The design of a hybrid OR with the intention to perform brachial access site procedures should focus on the integration of additional radiation shielding that are more efficient for the operators who are working from the brachial access site.
Although we did not measure the operator eye lens dose in this study, previous research shows a 20% deviation in the lens dose from the measured radiation dose on top of the lead apron may be relevant. Therefore, the models’ coefficients may change, but the expected effect size of an incorporated radiation predictor may still be relevant to accord with the eye lens’s radiation risk hazards. That the occupational eye lens dose has been estimated as approximately 20% lower than the average radiation dose measured at chest level should be noted, but this factor depends on the position of the over-apron dosimeter and other geometric factors during the procedures. 15
The dose rate of the dose aware PDM ranges between 40 µSv/h and 500 mSv/h, and the badge response is angular and temperature-dependent, meaning that an additional variation in accuracy can be expected between 5% ± 30% at 50° of angulation, until within 180° of angulation of the badge in accordance with the C-arm source. From our prediction model, dose rates less than 40 µSv/h can also be expected. In particular, the operator dose rates in the lower dose ranges were missing or were too low to measure and were therefore excluded from the model but could have affected the model. Other inhomogeneity in our staff measurement dose rates may result from the different surgeons and the different operation positions. For example, our two primary operators differ in height, and therefore, badges are not at consistently similar heights. The surgeons may also differ in their working habits and strategies, in the amount of the shielding, or how they stand in relation to the patient.
We did not incorporate the exact position or changes in positions of the ceiling-mounted lead screens. It is known that the operator who is standing on the opposite obliquity of the C-arm may be exposed to lower radiation doses compared to the operator standing next to the C-arm. In this study, FO and SO frequently changed positions during most procedures, but their exact position related to their badges were not recorded in this study but could have affected the radiation dose model. A second validation radiation dose badge for each operator was absent, which could have helped to identify interoperator-based radiation dose rates difference between the operators.
A limitation of this study was that operators were allowed to track their real-time radiation dose on in-room dose tracking screens. An operator who may observe a very high radiation dose may have changed the shielding material without changing C-arm characteristics, such as using additional collimation, but these effects were not included in the study. Although the current prediction model provides an estimated operator dose rate, especially for doses in ORs without real-time operation feedback, the proposed chart may still underestimate those radiation doses in the interventional suites and hybrid ORs where there is no real-time dose monitoring system. Awareness of radiation dose exposure rates is mandatory for all operators during EVARs in the hybrid OR at all times.
The predicted operator radiation risk hazard is just one method to improve the understanding of the model’s predictors. A risk chart increases the awareness that dose rates are not fixed but vary during and between a multivariable model of predictors. Personal dose tracking for every operator in a hybrid operating room, combined with tracking cumulative radiation doses over time, is recommended for all staff.
One or both of the operators were exposed to measurable low-dose radiation during at least 80% of the fluoroscopy, and 99% of the DSA runs. Chronic exposure to low radiation dose rates may be less noticeable but may increase long-term stochastic risk.
New radiation reducing techniques that are efficient in reducing radiation doses but have not been evaluated in this study are image fusion, Fiber Optic RealShape navigation, and endovascular robotics. 16
Except for 3D image fusion, these techniques are not yet commercially available on a larger scale and still need to be proven to be safe and effective. Also, novel machine learning techniques and artificial intelligence may improve radiation dose prediction models in the hybrid operation room or perform radiation dose tracking more accurately. Computer vision combined with augmented reality could integrate a real-time track to improve real-time awareness of personal radiation dose rates in the operating room.
Conclusions
This study revealed the discrepancies in the effect size between the patient radiation dose rates in relation to the operator radiation dose rates. Primary discrepancies where the operators were at a relatively higher radiation risk compared to the patient radiation risk was found for C-arm rotation and switching from femoral to brachial access site. An operator radiation dose rate risk chart of the dose rate prediction models may facilitate increased dose awareness among operators.
Supplemental Material
sj-docx-1-jet-10.1177_15266028211007458 – Supplemental material for Radiation Awareness for Endovascular Abdominal Aortic Aneurysm Repair in the Hybrid Operating Room: An Instant Operator Risk Chart for Daily Practice
Supplemental material, sj-docx-1-jet-10.1177_15266028211007458 for Radiation Awareness for Endovascular Abdominal Aortic Aneurysm Repair in the Hybrid Operating Room: An Instant Operator Risk Chart for Daily Practice by Quirina M. B. de Ruiter, Frans L. Moll, Constantijn E. V. B. Hazenberg and Joost A. van Herwaarden in Journal of Endovascular Therapy
Footnotes
Acknowledgements
We thank Thijs Dijkgraaf for his help with the DICOM dose reports transmission and Nicoletta Kayha for her support with the dose aware Xtend.
Declaration of Conflicting Interests
The author(s) declared no potential conflicts of interest with respect to the research, authorship, and/or publication of this article.
Funding
The author(s) disclosed receipt of the following financial support for the research, authorship, and/or publication of this article: The institution has received an institutional grant from Philips Healthcare.
Supplemental Material
Supplemental material for this article is available online.
References
Supplementary Material
Please find the following supplemental material available below.
For Open Access articles published under a Creative Commons License, all supplemental material carries the same license as the article it is associated with.
For non-Open Access articles published, all supplemental material carries a non-exclusive license, and permission requests for re-use of supplemental material or any part of supplemental material shall be sent directly to the copyright owner as specified in the copyright notice associated with the article.