
Abstract
Keywords
Introduction
Endovascular aneurysm repair (EVAR) has become the standard of care for the treatment of infrarenal abdominal aortic aneurysms (AAA). Despite numerous advances in EVAR devices, the need for secondary interventions to treat complications such as endoleaks and migration remains an issue.1,2 One of the latest innovations is endovascular aneurysm sealing (EVAS), a technique based on polymer filling of endobags surrounding dual stent frames that aimed to prevent endoleaks of any type. 3 Early results were promising, but the applicability was reduced significantly by a refinement of the instructions for use (IFU), driven by the incidence of late failures.3,4
Like EVAR, a prosthetic graft infection may also occur after EVAS. Prosthetic graft infection, with an incidence ranging from 0.16% to 0.77%, is a life-threatening complication with a mortality rate of 18% to 50%.5–7 Diagnosing vascular prosthetic graft infection is a challenge as clinical signs vary greatly and are often nonspecific. 8 In the early phase after implantation, the postimplantation syndrome (PIS) might interfere with the diagnosis of a true infection. 9
Hybrid fluorine-18-fluorodeoxyglucose (FDG) positron emission tomography (PET) combined with computed tomography (FDG-PET/CT) is frequently used as the preferred diagnostic tool for graft infection.3,10 Visual examination, the standard uptake value (SUV), and the tissue to background ratio (TBR) are parameters that reflect the intensity of FDG uptake. A linear, diffuse, and homogeneous uptake is not indicative of an infection, whereas focal or heterogeneous uptake with a projection matching the vessel on CT is highly suggestive. 11 In addition to infection, a (moderately) increased FDG uptake is also associated with scar tissue, native vessels, and postsurgical inflammatory changes. 12 A chronic aseptic inflammation due to the synthetic graft material mediated primarily by fibroblasts, foreign-body giant cells, and macrophages may also cause a potential base for some FDG uptake.13,14 False-positive FDG-PET/CT imaging may result in a diagnostic error and antibiotic overuse, particularly in the first 6 to 8 weeks after surgery. 15
Little is known about the physiological FDG uptake after EVAR. A recent publication by Marie et al 16 showed no increased FDG uptake 1 month after EVAR compared with the preprocedure FDG uptake. However, after 6-month follow-up a significant increase in FDG uptake was observed, which was related to patients with minimal AAA shrinkage.
So far, no study has provided information on the physiological FDG uptake after EVAS. This is important to assess the applicability of FDG-PET/CT scanning for the detection of an (early) endograft infection. Therefore, a study was undertaken to examine the physiological effect of EVAS on the FDG uptake in the vascular wall in patients who underwent an uncomplicated EVAS procedure.
Materials and Methods
Study Design
This prospective, within-subject, exploratory study evaluated patients scheduled for elective AAA treatment using the Nellix endoprosthesis (Endologix, Irvine, CA, USA) between January 2015 and January 2017. Patients were ineligible for the study if they had diabetes, known inflammatory disease, or malignancy. Medical files of the included patients were screened for demographic data and scored according to the reporting standards. 17
This study was conducted in accordance with the principles of the Declaration of Helsinki and Good Clinical Practice guidelines. The study was approved by the medical ethics committee of the region Arnhem-Nijmegen (NL50251.091.14) and the local institutional review board. All participants in the study gave informed consent. The trial was registered on the National Institutes of Health website (ClinicalTrials.gov; identifier NCT02349100).
EVAS Technique
The procedures were performed according to the manufacturer’s IFU and under antibiotic prophylaxis, as previously described. 18 Briefly, after gaining access to the femoral arteries, angiography with a calibrated catheter was performed to establish the specific device length needed. After positioning the devices so that the endobags were below the most caudal renal artery, the outer sheaths were retracted. The endobags are evacuated, and the stent balloons were simultaneously inflated to deploy the stents. A prefill of the endobags was performed with nonheparinized saline under pressure monitoring to assess the volume of polymer required to exclude the aneurysm. After emptying the endobags, the polymer was injected at a target pressure of 180 mm Hg. During polymer curing the balloons were reinflated. After polymer filling, final angiography was performed to confirm the complete seal of the aneurysm sac and absence of endoleaks.
Scanning Protocol
FDG-PET/CT scans (Philips Gemini TF64; Philips Medical Systems, Best, the Netherlands) were performed in all patients before and 6 weeks after treatment. FDG (Cyclotron BV, Amsterdam, the Netherlands) was used as a tracer for detection of inflammatory activity. Patients had to fast for 6 hours prior to scanning and drink 1 L of water 2 hours prior to scanning. One hour prior to scanning the FDG was administered intravenously, and the patients rested for 30 minutes. The administered amount of FDG (Mbq) was based on patient body weight (bw) [(3.125/kg bw) * 1.17 MBq]. Data concerning body mass index (BMI), glucose levels, and FDG doses and scanning time were recorded for each scan.
IDS7 (version 19.1; Sectra, Linköping, Sweden) was used to analyze the FDG-PET/CT scans. Regions of interest (ROI) were drawn using a free hand tool. The SUVmax, defined as the SUV of the voxel with the highest SUV within a selected ROI, was used for semiquantitative analysis of the FDG-PET/CT data. The program automatically corrected for BMI and the time of injection. Correction for glucose was performed manually using a correction factor [glucose level (mmol/L) / 5 (mmol/L) * SUV]. Furthermore, TBR, which represents the SUV corrected for background noise, was calculated by dividing the SUVmax by the SUVmax of the ascending aorta blood pool lumen. The slice where the ascending aorta was observed as a round structure was used for calculations. The abdominal aorta was divided in 4 subregions as depicted in Figure 1. Five consecutive slices were selected in the cranial direction for the suprarenal region and another 5 consecutive slices below the lowest renal artery for the infrarenal neck region. The aneurysm sac region was defined over 5 equally spaced slices between the last slice of the infrarenal neck region and the apex of the aortic bifurcation. The iliac region consisted of 5 consecutive slices selected caudal of the apex of the aortic bifurcation. In every slice, the SUVmax was determined in a manually selected ROI (Figure 2) around the edges of the activity of the vascular wall. Thrombus and/or calcification were included in the ROI.
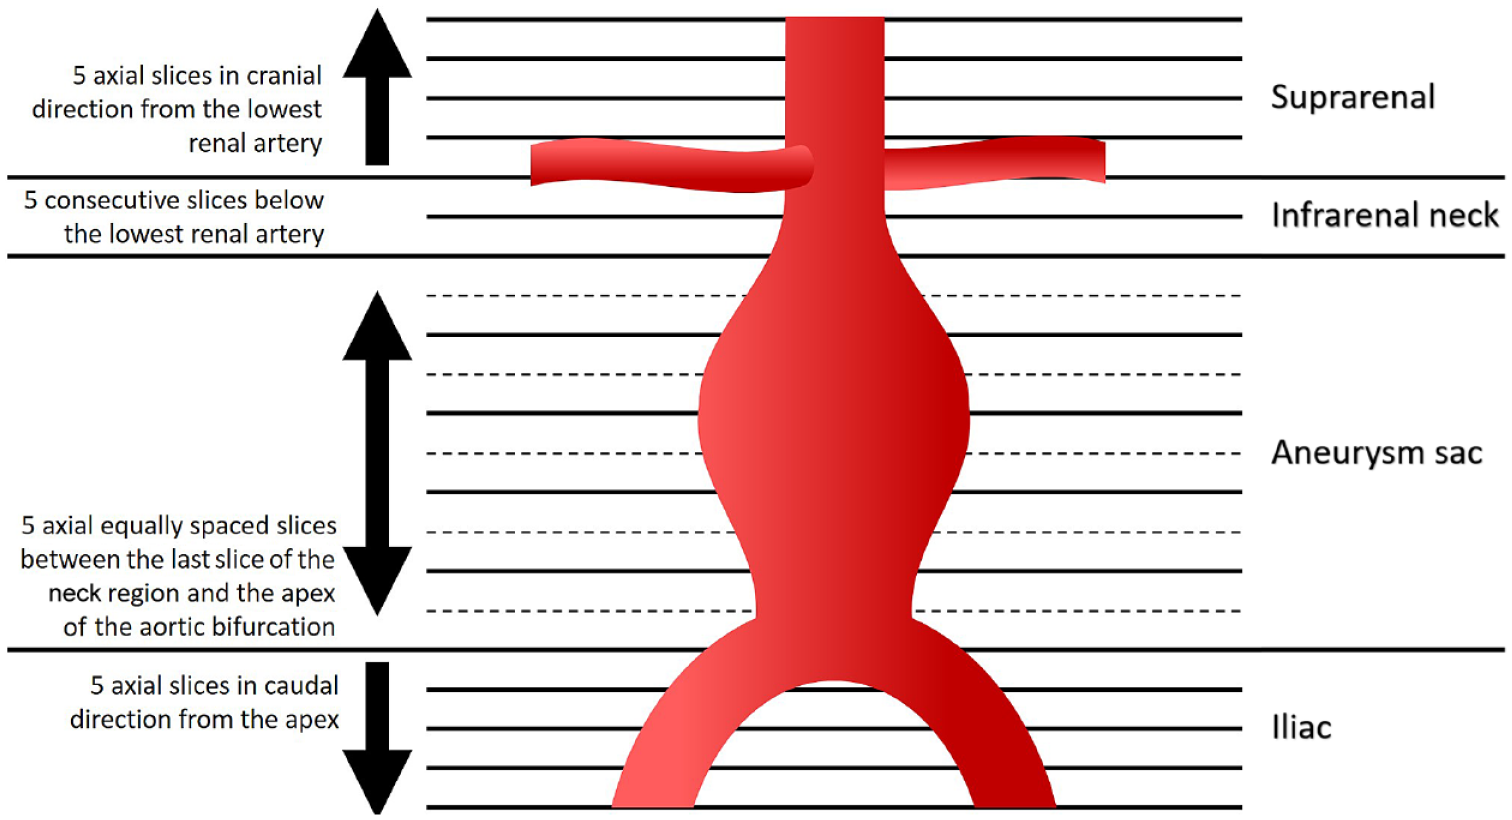
Overview of measurement regions. The arrows indicate the direction of measurement.
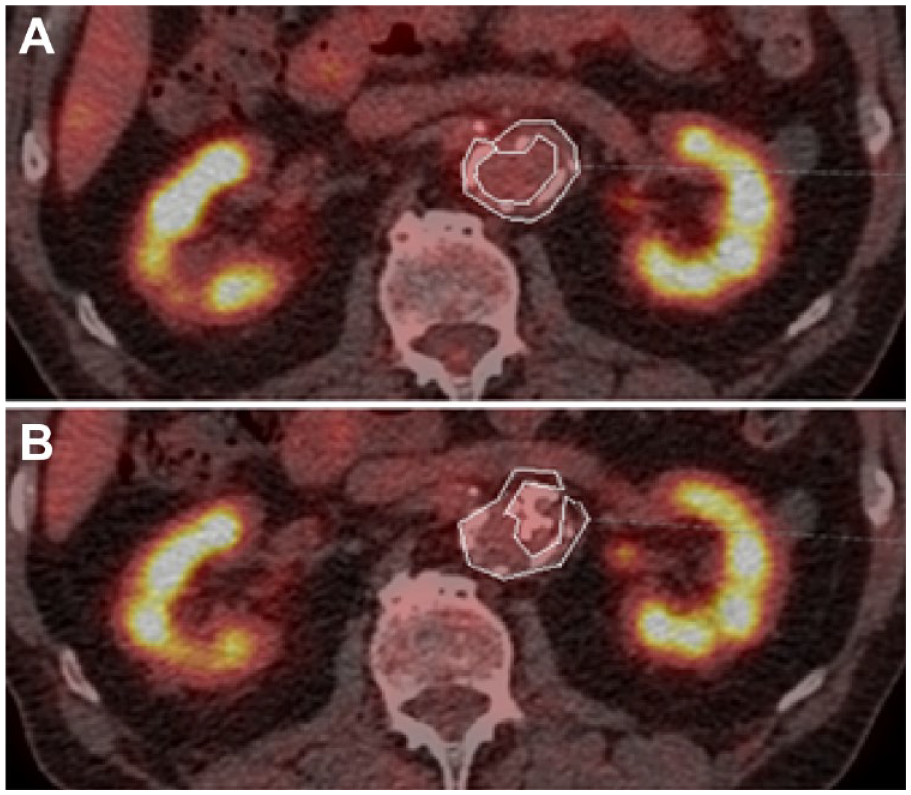
FDG-PET/CT fused-image axial slice of the abdomen including the region of interest (white lines) on the first slice of the infrarenal neck region showing infrarenal anatomy (A) before and (B) after endovascular aneurysm sealing; CT, computed tomography; FDG, fluorine-18-fluorodeoxyglucose; PET, positron emission tomography.
Besides determination of the SUV and TBR, visual assessment was performed by a nuclear medicine physician (RS). The FDG-PET/CT scans were assessed on heterogeneity and intensity of FDG uptake, which was graded on a 4-point scale. 11 Grade 1 is an FDG uptake similar to that in the background. Grade 2 implies low FDG uptake and is comparable with the FDG uptake by inactive muscles and fat. Grade 3 reflects moderate FDG uptake, clearly visible and higher than the uptake by inactive muscles and fat but distinctly less than the physiological urinary uptake by the bladder. Grade 4 means a strong FDG uptake, comparable to the physiological uptake by the bladder. The assessment of heterogeneity was classified as homogeneous, slightly heterogeneous, or heterogeneous.
Statistical Analysis
Data are reported as the median and interquartile range (IQR; Q1, Q3). Significant differences between the pre and post SUV and TBR were analyzed using the Wilcoxon test because of the small sample size and expected nonnormal distribution of the data. Wilcoxon tests were also employed to assess whether the nonnormally distributed visual examinations were significantly different between the pre- to postprocedure examinations. Descriptive statistics were given for all values and measurements. Differences were considered significant at the p<0.05 level. Data were analyzed using SPSS software (version 25; IBM Corporation, Armonk, NY, USA).
Results
Of 11 patients recruited for the study, 8 male patients (median age 78 years) were analyzed after exclusion of 3 unevaluable cases. Two patients were excluded because a malignancy was detected on the preprocedure FDG-PET/CT; the third was converted to open repair during surgery due to occlusion of the left renal artery by a bulging left endobag after secondary fill. The baseline patient characteristics are given in Table 1, parameters of the FDG-PET/CT scans are summarized in Table 2, and operative details are given in Table 3.
Characteristics of the 8 Patients. a
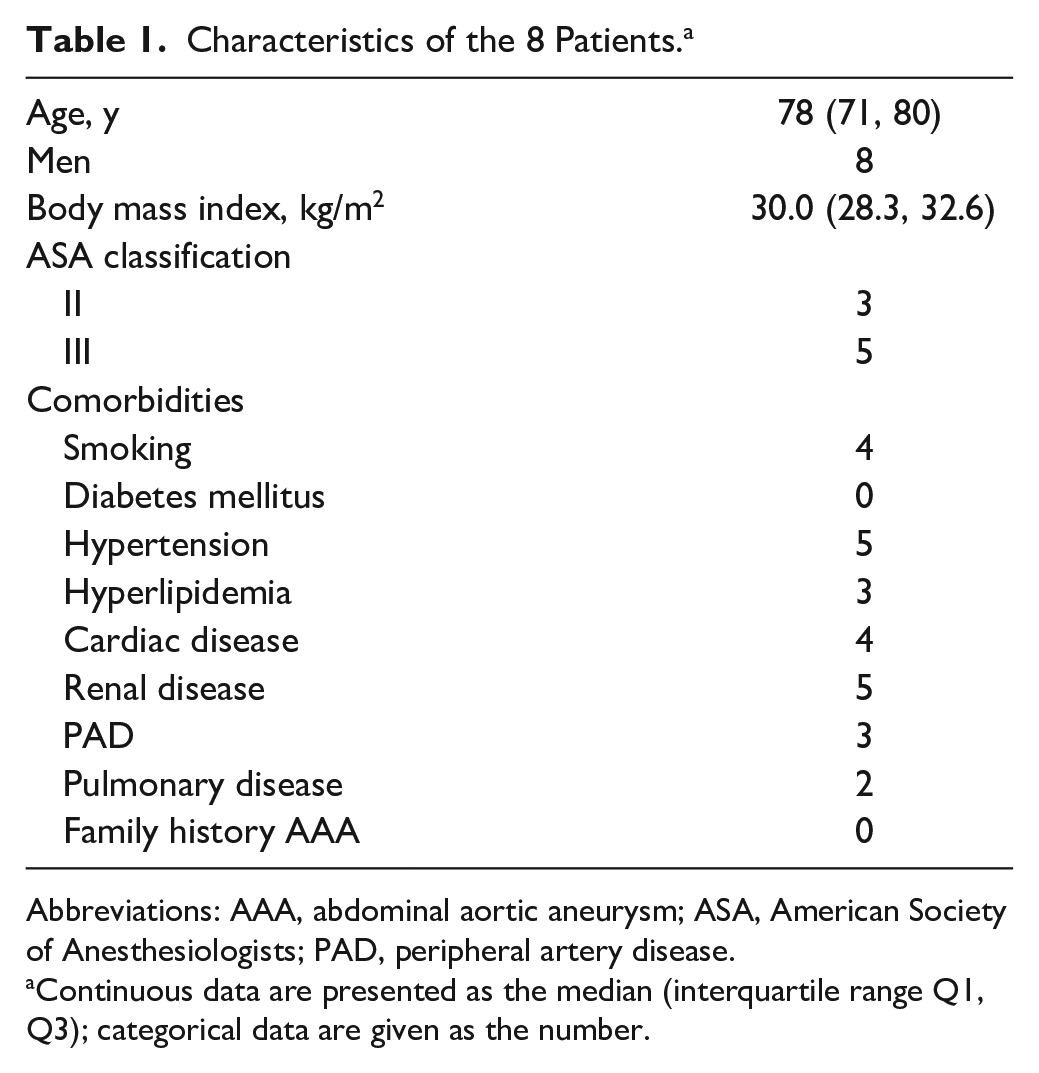
Abbreviations: AAA, abdominal aortic aneurysm; ASA, American Society of Anesthesiologists; PAD, peripheral artery disease.
Continuous data are presented as the median (interquartile range Q1, Q3); categorical data are given as the number.
FDG-PET/CT Scanning Parameters. a
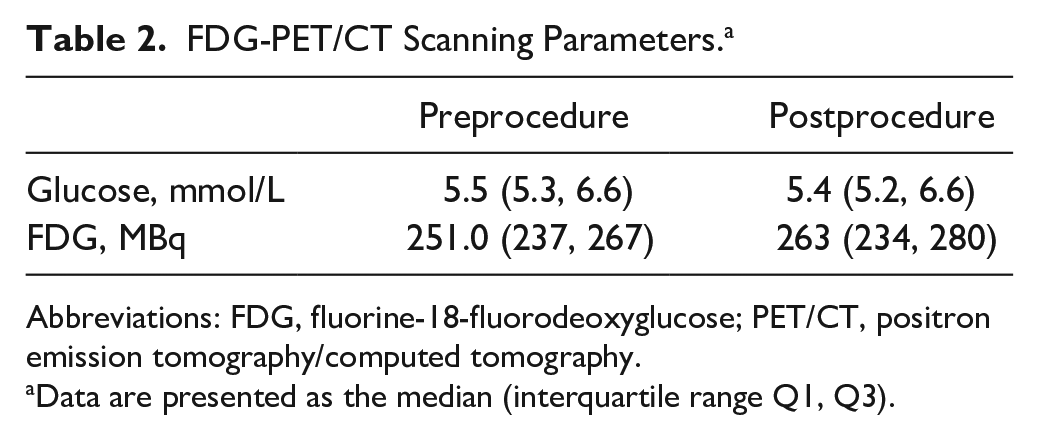
Abbreviations: FDG, fluorine-18-fluorodeoxyglucose; PET/CT, positron emission tomography/computed tomography.
Data are presented as the median (interquartile range Q1, Q3).
Procedure Details. a
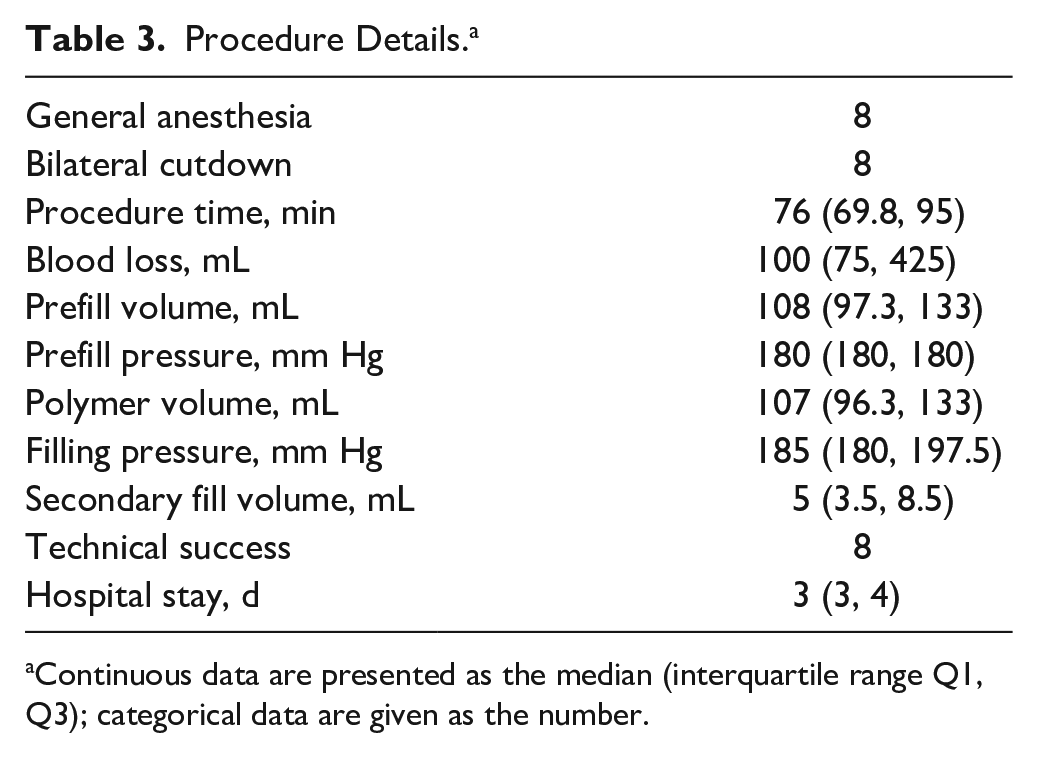
Continuous data are presented as the median (interquartile range Q1, Q3); categorical data are given as the number.
Visual examination of the FDG-PET/CT scans showed no significant differences between the pre- and postprocedure studies (Table 4). All but 1 patient showed homogenous uptake, comparable to the background signal. Slightly heterogeneous but low uptake was observed in 1 patient due to increased uptake in the prostate and left abdomen.
Visual Assessment.
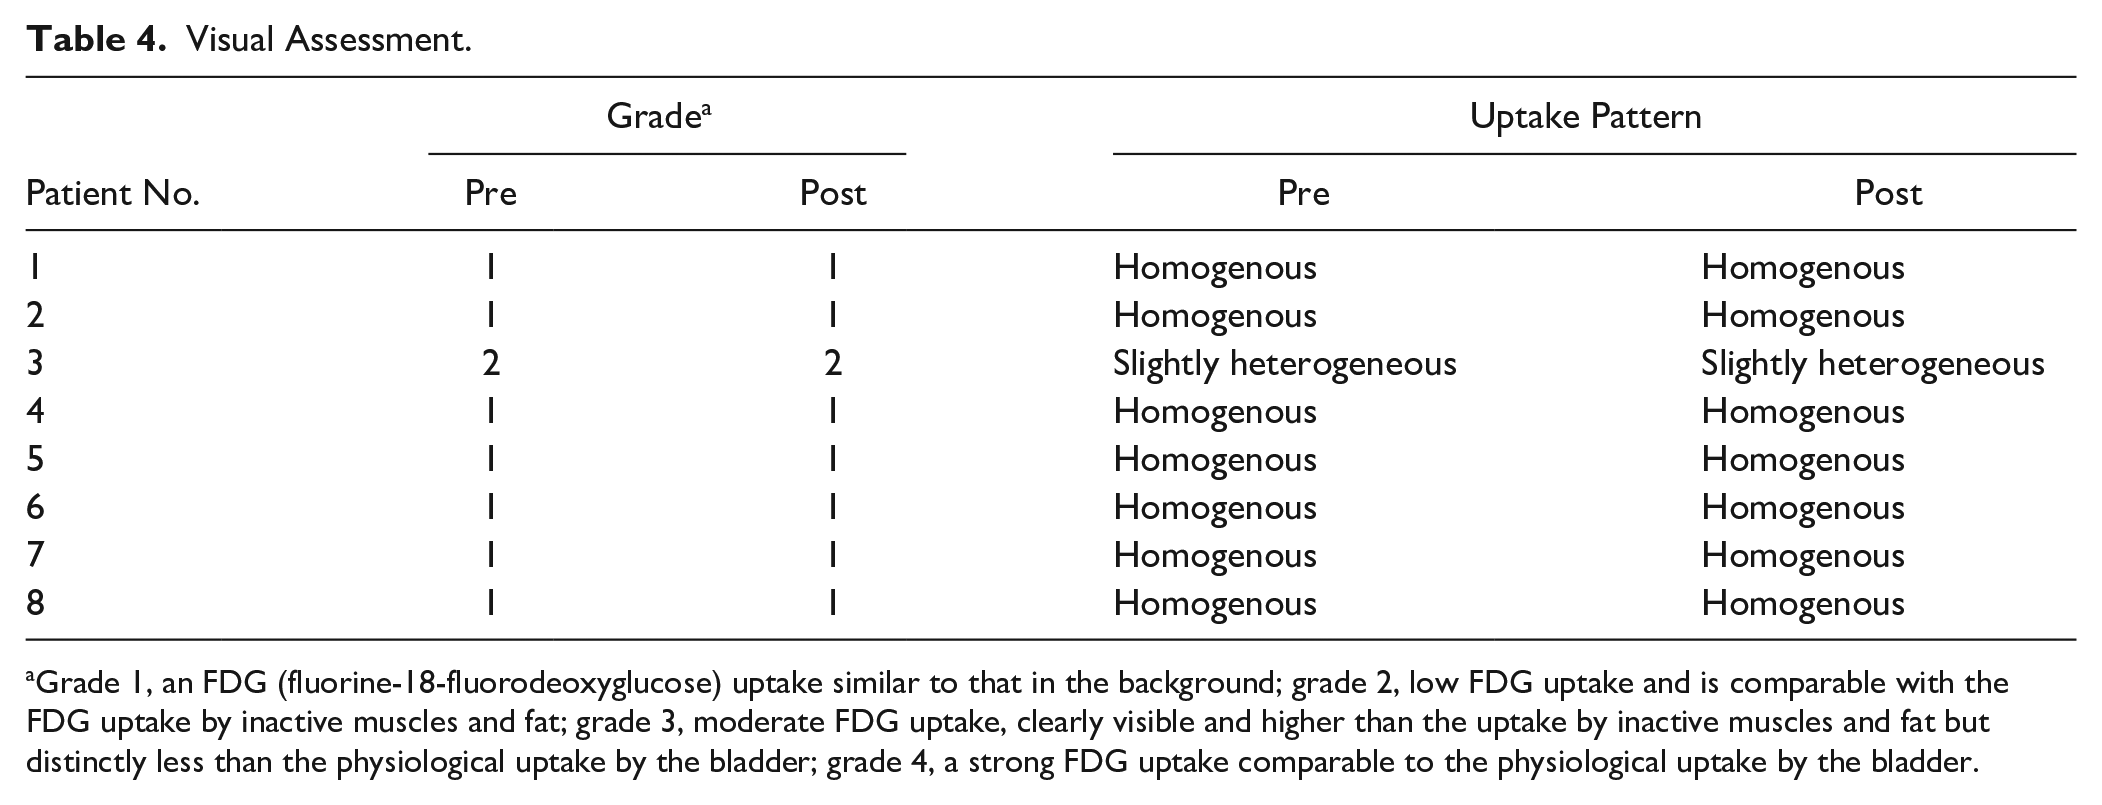
Grade 1, an FDG (fluorine-18-fluorodeoxyglucose) uptake similar to that in the background; grade 2, low FDG uptake and is comparable with the FDG uptake by inactive muscles and fat; grade 3, moderate FDG uptake, clearly visible and higher than the uptake by inactive muscles and fat but distinctly less than the physiological uptake by the bladder; grade 4, a strong FDG uptake comparable to the physiological uptake by the bladder.
SUV and TBR outcomes per region are displayed in Table 5. In the suprarenal region there were no significant differences between pre- and postprocedure SUVmax and TBR. For the infrarenal neck region, TBR did not decrease significantly between pre- and postprocedure scans. For the aneurysm sac and iliac regions, all obtained measures decreased significantly between the pre- and postprocedure scans.
Standard Uptake Value (SUV) and Tissue to Background Ratio (TBR) per Region. a
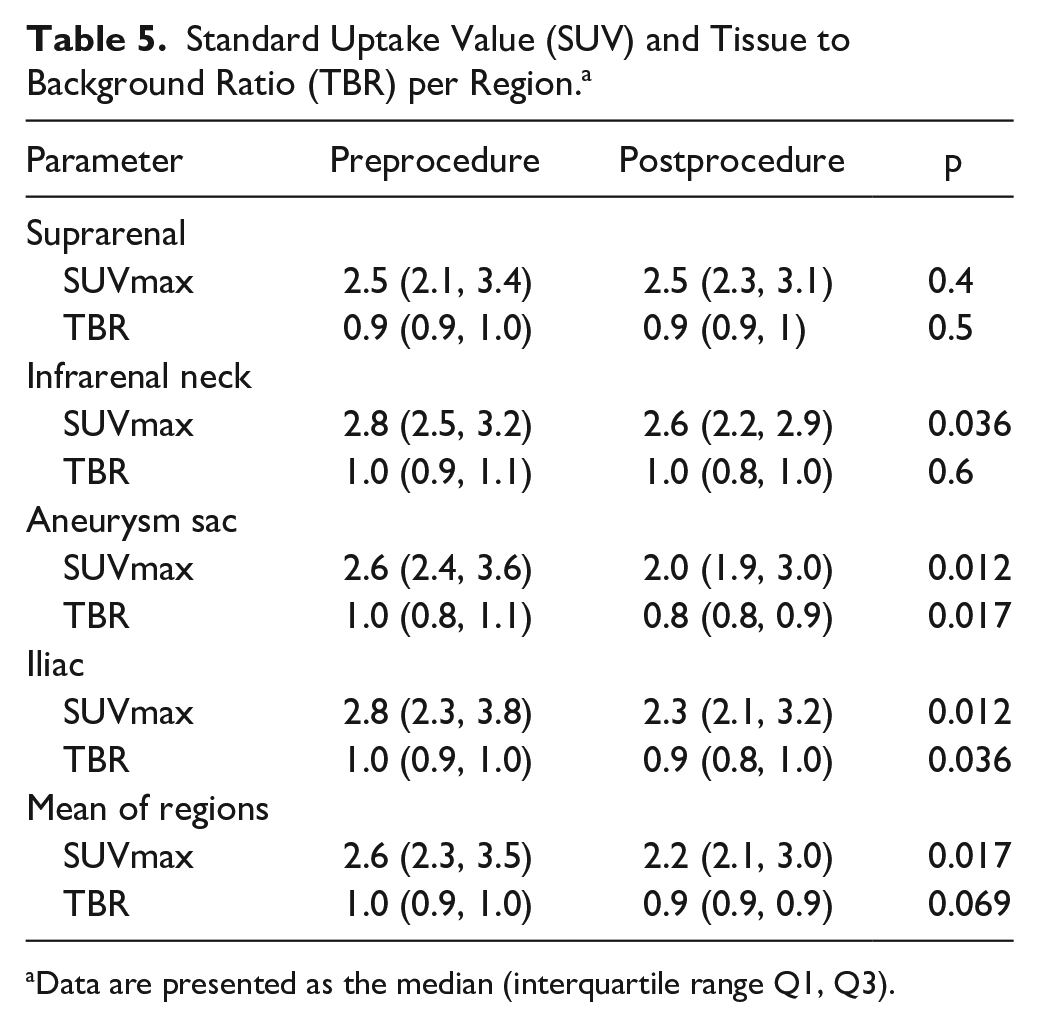
Data are presented as the median (interquartile range Q1, Q3).
Endobag migration of 30 mm was observed in 1 patient after 48 months, leading to a type Is2 endoleak (categorized according to the work of van den Ham et al 19 ) and 7-mm sac enlargement. The SUVmax in the suprarenal region increased for this patient from 2.1 to 2.4 between the pre- and postprocedure FDG-PET/CT scans. All the SUVmax in the other regions remained unchanged or decreased. The patient refrained from further treatment. One other patient showed 8-mm device migration, a type Is2 endoleak, and sac growth of 4 mm after 24 months. At 30 months, the Nellix graft was explanted and replaced by an aortobifemoral graft. No increase in SUVmax was observed for this patient.
Discussion
The present study has shown that FDG uptake after EVAS is significantly lower in the infrarenal and iliac segments compared to the preprocedure FDG uptake. This indicates that there is no increase in physiological inflammatory response of the aneurysm wall following EVAS. The preprocedure SUVmax results from our cohort were in range with those published for untreated AAAs and showed a homogenous uptake. 20 Furthermore, these SUVmax results were higher compared to those obtained in nonaneurysmal aortas, indicating the presence of an inflammatory process. 20 Last, the homogenous uptake on postprocedure visual inspection were in line with previously published SUVmax data from Keidar and Nitecki. 12
In general, the literature suggests a cutoff value for the SUVmax of 8 in the perigraft area to distinguish infected grafts from noninfected grafts.11,21 The SUVmax results in the current study were all far below this cutoff value. Tolenaar et al 22 presented 2 cases of endograft infection after EVAS that both showed high focal uptake (SUV 7.2 and SUV 9.7) in the infected area. The results of Tolenaar et al 22 may justify the use of FDG-PET/CT as a diagnostic tool to identify infection after EVAS, particularly since the current study showed that the physiological uptake after EVAS is low. In addition, Zogala et al 23 published a sensitivity of 89% and a specificity of 100% based on SUVmax, TBR, and visual grading of FDG-PET/CT scans to diagnose stent-graft infection.
When analyzing the results per region, the suprarenal segment did not show a decrease in SUVmax in comparison to the infrarenal regions. The suprarenal region is not covered by the endobags; blood flow perturbations caused by the endobag plateau (creating a step in the aortic diameter) in this area could mediate inflammatory processes in the vessel wall and an increase in FDG uptake. An increased FDG uptake during follow-up could also be related to PIS, something that can be difficult to distinguish from true infection. Berg et al 24 found that the incidence of PIS is significantly lower after EVAS compared with a polyester stent-graft in EVAR, with a lower body temperature and lower serum leukocyte and C-reactive protein levels. 24
Marie and colleagues 16 recently reported no significant increase in FDG-PET/CT uptake between 3 months before EVAR and 4 weeks after treatment. The FDG-PET/CT uptake between 3 months pre-EVAR and 6 months thereafter significantly increased, both under the threshold for infection (SUVmax 2.2 vs 2.6, respectively). An explanation between the decreased uptake we observed and the steady uptake shown by Marie et al 16 after 4 weeks could be related to the high percentage of endoleaks (43% at 4 weeks and 39% at 6 months) in the Marie cohort, maintaining inflammatory processes in the vessel wall because of contact with the circulation. Marie et al 16 also reported 6-month data, but it is questionable if our short-term results can be extrapolated to the 6-month time point. Therefore, additional follow-up at 6 or 12 months would be of added value in future studies.
Along the same line, Courtois et al 25 recently presented results about the predictive value of FDG-PET/CT in the detection of complications after EVAR. Our study cohort had 2 patients with complications (migration leading to type Ia endoleak and sac enlargement in both cases at 24 and 48 months). The FDG-PET/CT data showed only a minor increase in activity for the suprarenal region in one of these patients between the pre- or postprocedure scan.
Limitations
Comparison of FDG-uptake values between studies should always be done with great care, as there may be differences in the PET/CT scanner performance and the acquisition and interpretation of the data, as was recognized by the EARL standard. 26 Furthermore, several methods exist to standardize the FDG uptake, either using the ascending aorta or the mediastinum. This could induce differences in reported FDG uptake values. Our method consisted of sampling 4 areas of the infrarenal vasculature using 5 slices per area. Other authors report results using all slices available; however, our software tool did not allow easy inclusion of a volume including all slices. This could influence the average FDG uptake per area.
Also, in AAAs without thrombus formation, the blood lumen (with high activity) is often partly included when assessing FDG uptake in the vessel wall. The EVAS endobags (without any activity) are adjacent to the vessel wall, causing lower postprocedure SUVmax readings. Last, the current study did not include any patients with a graft infection, so no conclusions on the cutoff for graft infection after EVAS can be reported.
Conclusion
The current study shows there is no increase, but stable or decreased physiological FDG uptake after EVAS. Future research is needed to assess the applicability and cutoff values of FDG-PET/CT scanning to detect endograft infection after EVAS.
Footnotes
Declaration of Conflicting Interests
The author(s) declared the following potential conflicts of interest with respect to the research, authorship, and/or publication of this article: Michel M. P. J. Reijnen has received speaker honoraria from Endologix, Terumo Aortic, and Bently and research grants from Endologix Inc.
Funding
The author(s) disclosed receipt of the following financial support for the research, authorship, and/or publication of this article: This work was supported by an unrestricted research grant from Endologix, Inc.