
Abstract
To ensure good measurement quality, survey questions should be clear, concise, and easily understandable for all respondents. One way of achieving this is to use plain language, an approach comprising a set of measures relating to the wording, sentence structure, and design of texts. Using a between-subjects design in a web survey, we tested whether a multi-item scale in plain language leads to better measurement quality while having similar scale properties to the original, standard language scale. Our results showed that the plain-language version led to greater response differentiation, fewer midpoint responses, and shorter response times than the original version, and that the two language versions had similar scale properties.
Introduction
Respondents’ attitudes, beliefs, evaluations, and self-descriptions in survey research are typically measured using multi-item scales rated on a Likert-type or other scale. Multi-item scales measure latent—i.e., not directly observable—theoretical constructs. As these constructs are usually very abstract and often multidimensional (e.g., job satisfaction), they must be operationalized into a series of statements that respondents then rate (Robinson 2018). For example, a job satisfaction scale might include the items “Most of the time I like to go to work” and “I often get bored at work,” to be rated on a scale from strongly agree to strongly disagree.
Despite their advantages and widespread use, multi-item scales are prone to undesirable response behaviors such as acquiescent and extreme responding. Acquiescent responding, “the tendency to agree with items regardless of content,” increases with cognitive load and item ambiguity; extreme responding, “the tendency to select the most extreme response categories regardless of content,” is more common when stimuli “are important or involving to respondents” (Baumgartner and Steenkamp 2001:145). Respondents also exhibit midpoint responding, which is encouraged by increased language complexity and a lack of item clarity (Velez and Ashworth 2007). Other undesirable response behaviors include nondifferentiation and item nonresponse, which are often due to respondents’ inability to understand a question or their unwillingness to expend the cognitive effort required to answer it, and which are exacerbated by question complexity (Beatty and Herrmann 2002; Roßmann et al. 2018; Yan 2008). Such response behaviors may distort reliability estimates and alter the dimensionality, factorial structure, and criterion-related validity of multi-item measures; mean values may be either inflated or deflated; and associations with other measures or constructs may be over- or underestimated (Baumgartner and Steenkamp 2001; Kreitchmann et al. 2019).
Several models describe the cognitive response process in surveys (e.g., Sudman et al. 1996; Tourangeau and Rasinski 1988). These models generally agree on four steps: understanding the meaning of a question, retrieving relevant information, forming a judgment, and providing a response by mapping the judgment onto the given response options. For surveys to gather complete and accurate responses, it is essential that respondents correctly understand the language and meaning of the questions and diligently execute all subsequent steps of the cognitive response process without becoming overburdened (Sudman et al. 1996:59–75). The linguistic, syntactic, or conceptual complexity of questions determines how cognitively taxing the cognitive response process is for respondents and how motivated they are to process questions thoroughly (Holbrook et al. 2006; Lenzner 2012). If the questions are too complex—at least for some respondents—this may lead to comprehension problems in the first step of the cognitive response process, thereby hampering the subsequent steps. Thus, as studies have shown, task complexity and respondents’ motivation and ability can affect the difficulty of answering survey questions and consequently the quality of survey data (Holbrook et al. 2006; Lenzner 2012; Wenz et al. 2021).
Plain language (PL) can help reduce the complexity of survey questions and thus the effort and difficulty of understanding them. PL is clear, concise, and easily understandable language aimed at ensuring comprehensibility for a diverse audience, including those with limited literacy skills, and reducing the cognitive processing effort compared with standard language (SL; Hansen-Schirra and Maaß 2020; Leskelä et al. 2022). The PL approach comprises a set of measures relating to text wording, sentence structure, and layout. These include (1) using common, simple words and the active voice while avoiding jargon and negatives; (2) employing shorter sentences with a simple structure (e.g., one aspect at a time) or providing additional content (e.g., examples) for clarification; and (3) presenting information clearly through bulleted lists or a new line for each sentence (see Cutts 2020 for an overview). These PL principles are also well known from survey research and previous findings on using verbal and visual features for optimal questionnaire design (Bradburn et al. 2004; Dillman et al. 2014). However, whereas these studies focus mainly on individual aspects of survey questions, such as replacing individual words (e.g., Lenzner 2012) or changing the alignment of response categories (e.g., Toepoel and Dillman 2010), PL takes a holistic approach encompassing the wording, structure, and visual design of textual information.
Applying PL principles to multi-item scales may be a promising approach to simplify item wording and the labeling of response options, thus reducing undesirable response behaviors, especially among respondents who likely have low literacy skills (Bauer et al. 2025). However, survey research already has a wealth of well-established item scales with prescribed response option labels on various topics. Ideally, scales that have already been validated should be used verbatim or, at most, minor changes should be made to the items and response option labels (Robinson 2018). For even minor differences in the wording of items or differences in the response scales can lead respondents to process and interpret items differently and arrive at other responses (Dykema et al. 2021; Kamoen et al. 2013). Differences in response behavior can bias measurements and make valid comparisons between studies or over time more difficult. Therefore, a meaningful comparison of two scales in different language versions intended to measure the same constructs requires equivalent measures of these constructs. If major changes are made, researchers should check the scale properties (i.e., reliability and validity) of the modified scale against those of the original (Robinson 2018).
The desire to minimize adjustments to existing item scales seems to contradict the holistic PL approach, which involves changing various features of written text. Furthermore, as there are no guidelines for translating survey questions from SL to PL, survey researchers depend on PL experts. Therefore, in the current study, we investigate the possibilities of using PL to reduce the complexity of a multi-item scale, facilitate the cognitive response process, and ultimately reduce undesirable response behavior while measuring the same construct.
Current Study
To investigate the use of PL in surveys, we compared two language versions of an established multi-item scale—the original in SL and a PL translation. We also investigated whether the effects of language simplification differ depending on respondents’ literacy skills (using education as a proxy measure). We aimed to answer the following research questions (RQ):
Regarding RQ1, we expected that translating the item wording and response option labels into PL would help reduce task complexity and make both components easier to read and understand for all respondents, especially for those with lower literacy skills. Consequently, we expected that simplifying the language would reduce comprehension and mapping difficulties and keep respondents’ cognitive load low, ultimately reducing undesirable response behavior.
Regarding RQ2, to be comparable across studies or over time, both language versions of the multi-item scale should measure the same theoretical constructs and equally represent the multidimensional structure of the scale. Although we expected that the PL scale would lead to less undesirable response behavior, item and scale means of the two language versions should not differ markedly.
We examined common indicators of response quality and scale properties. In what follows, we describe in more detail the sample, multi-item scale, and dependent variables. We then present the main results and conclude with a discussion of the key findings.
Data and Methods
Sample
We conducted a web survey in December 2022 among respondents from a German nonprobability online access panel. The quota sample was based on gender, age, and educational attainment. We invited 5,661 panelists to participate; 4,353 started the survey, 907 were screened out due to age restrictions (18–69 years) or full quotas, and 3,256 completed the survey. Among complete cases, 49% were female, the average age was 46 years, and 41% had a higher education entrance qualification. The average time to complete the questionnaire was 14 minutes. We used a responsive questionnaire design so that the questionnaire layout dynamically adapted to different screen sizes; 42% of the respondents completed the survey on their smartphones.
Experimental Question
We used the German-language version of Jarvis and Petty’s (1996) 16-item Need to Evaluate Scale, which was developed by von Collani (2003). The scale captures people’s need and willingness to make evaluative judgments about attitude objects. It comprises two subscales: need for evaluation (E; 10 items) and need for neutrality (N; six items). Experts at Lebenshilfe Bremen e.V., an organization offering professional PL translations, developed a PL version based on the original German-language SL version. As survey researchers with no training in translating SL to PL, we left the experts’ translation largely unchanged, as we wanted to test its adequacy in an unbiased way.
Of the item texts translated, six had medium or large changes in wording, sentence structure, and design (i.e., different wording, two sentences instead of one, with each sentence starting on a new line), and five had only small changes (i.e., one or two words differed). The wording of the remaining five items was identical (see Table A1 in the Supplementary Material for the German SL and PL versions of the multi-item scale and the English translations). The items were answered on a 7-point scale, with the endpoints Completely inapplicable (1) and Completely applicable (7) in SL, and No, that is not true at all (1) and Yes, that is exactly true (7) in PL.
The 16-item scale was spread across four web pages, each comprising four items. Items were presented in an item-by-item format on all devices. Response options were aligned horizontally on large and vertically on small screens (e.g., smartphones).
Based on a between-subjects design, respondents were randomly assigned to one of the two language versions. Random assignment was successful, as there were no significant differences in gender, age, educational attainment, or device between the two language versions.
Response Quality Indicators
We calculated several indicators of response quality. A binary item nonresponse variable indicates whether a respondent left at least one of the 16 items unanswered (0 = no, 1 = yes). A binary straightlining variable indicates whether a respondent used the same response option for all items (0 = no, 1 = yes). As some items contradicted others, straightlining was not expected. To measure response differentiation, we computed rho, with a value of 0 representing straightlining and higher values indicating that the respondent selected more different response options. We also calculated the proportion of extreme responses (Options 1 and 7), midpoint responses (Option 4), and acquiescent responses (Options 6 and 7). Lastly, response time was measured by adding up page-wise timestamps (in seconds) for the four web pages on which the 16 items were presented.
The calculation of item nonresponse was based on the entire sample, while the other indicators were based only on cases that had answered all 16 items. In addition, for the response time indicator, we excluded outliers at two standard deviations above the group mean. We reran these analyses controlling for respondents’ educational attainment (see Table A2 in the Supplementary Material).
Scale Properties
We used principal component analysis followed by varimax rotation to identify the underlying components in the multi-item scale in SL and PL. The percentage of variance explained by the principal components enabled us to assess the quality of measurement provided by the two language versions.
We calculated Cronbach’s alpha as a coefficient of the internal consistency of the multi-item scale to assess how well the scale items measured the latent construct. Due to the two-dimensional structure of the scale (von Collani 2003), we considered the internal consistency of the subscales to be more informative than the internal consistency of the overall scale.
Finally, we computed the corrected item–total correlations (ITCs), which measure the relationship between a single item and the total scale minus the item assessed. We report ITCs based on the respective subscale items (i.e., according to the two-factor solution).
We reran all analyses of scale properties controlling for respondents’ educational attainment (see Table A3 in the Supplementary Material).
Results
RQ1: Does the PL Scale Lead to Less Undesirable Response Behavior than the SL Scale?
Table 1 depicts the results for our indicators of response quality.
Response Quality of the Standard Language (SL) and Plain Language (PL) Versions of the German-language Need to Evaluate Scale.
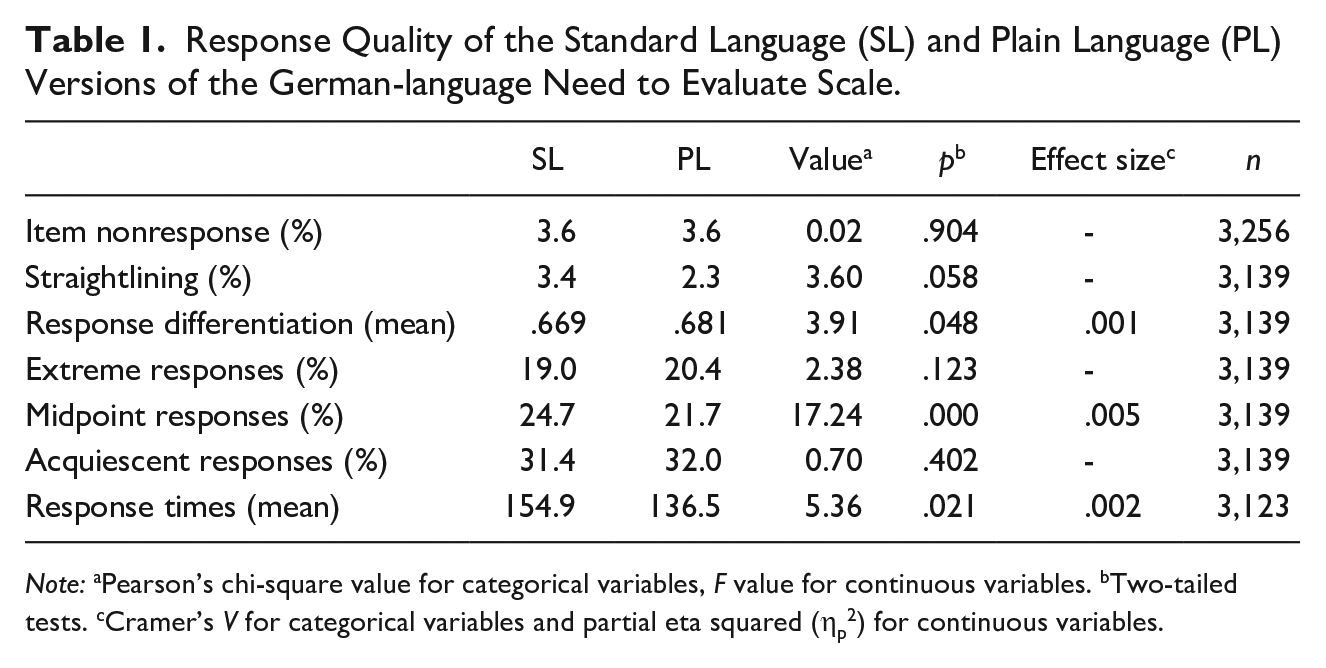
Note: aPearson’s chi-square value for categorical variables, F value for continuous variables. bTwo-tailed tests. cCramer’s V for categorical variables and partial eta squared (ηp2) for continuous variables.
At 3.6%, item nonresponse (i.e., at least one item unanswered) was low for both the SL and PL scales and did not differ between the two language versions. Similarly, at 3.4% in SL and 2.3% in PL, the extent of straightlining was low, with no significant difference between the two versions. However, response differentiation was slightly but statistically significantly higher for PL (.681) than for SL (.669). The two language versions had similar rates of extreme and acquiescent responding, but the proportion of midpoint responses was three percentage points lower in PL (21.7%) than in SL (24.7%). Additionally, response times differed between the two language versions, with respondents taking 18.4 seconds less to answer the scale in PL (136.5 seconds) than in SL (154.9 seconds).
The effects were due mainly to respondents with medium or high levels of education, with PL leading to significantly less straightlining, more response differentiation, more extreme responding, and less midpoint responding compared with SL; no such differences were found for respondents with lower levels of education (see Table A2 in the Supplementary Material).
RQ2: Are the Scale Properties Comparable between the PL and SL Versions?
Table 2 summarizes the results for item and scale means, standard deviations, corrected ITCs, and loadings for the two-factor solution. Principal component analysis revealed a two-component solution for both language versions, consistent with von Collani’s (2003) results based on the SL version. The two-component solution accounted for 42.5% of the overall variability for PL, which was slightly higher than the 38.7% for SL. The loadings describing how much each item contributes to a particular principal component were broadly comparable between the two language versions of the 16-item scale (see Table 2).
Means, Standard Deviations, Corrected Item–Total Correlations with Subscales (ITC-S), and Loadings for the Two-component Solution (F1, F2) for the Standard Language (SL) and Plain Language (PL) Versions of the German-language Need to Evaluate Scale (n = 3,139).
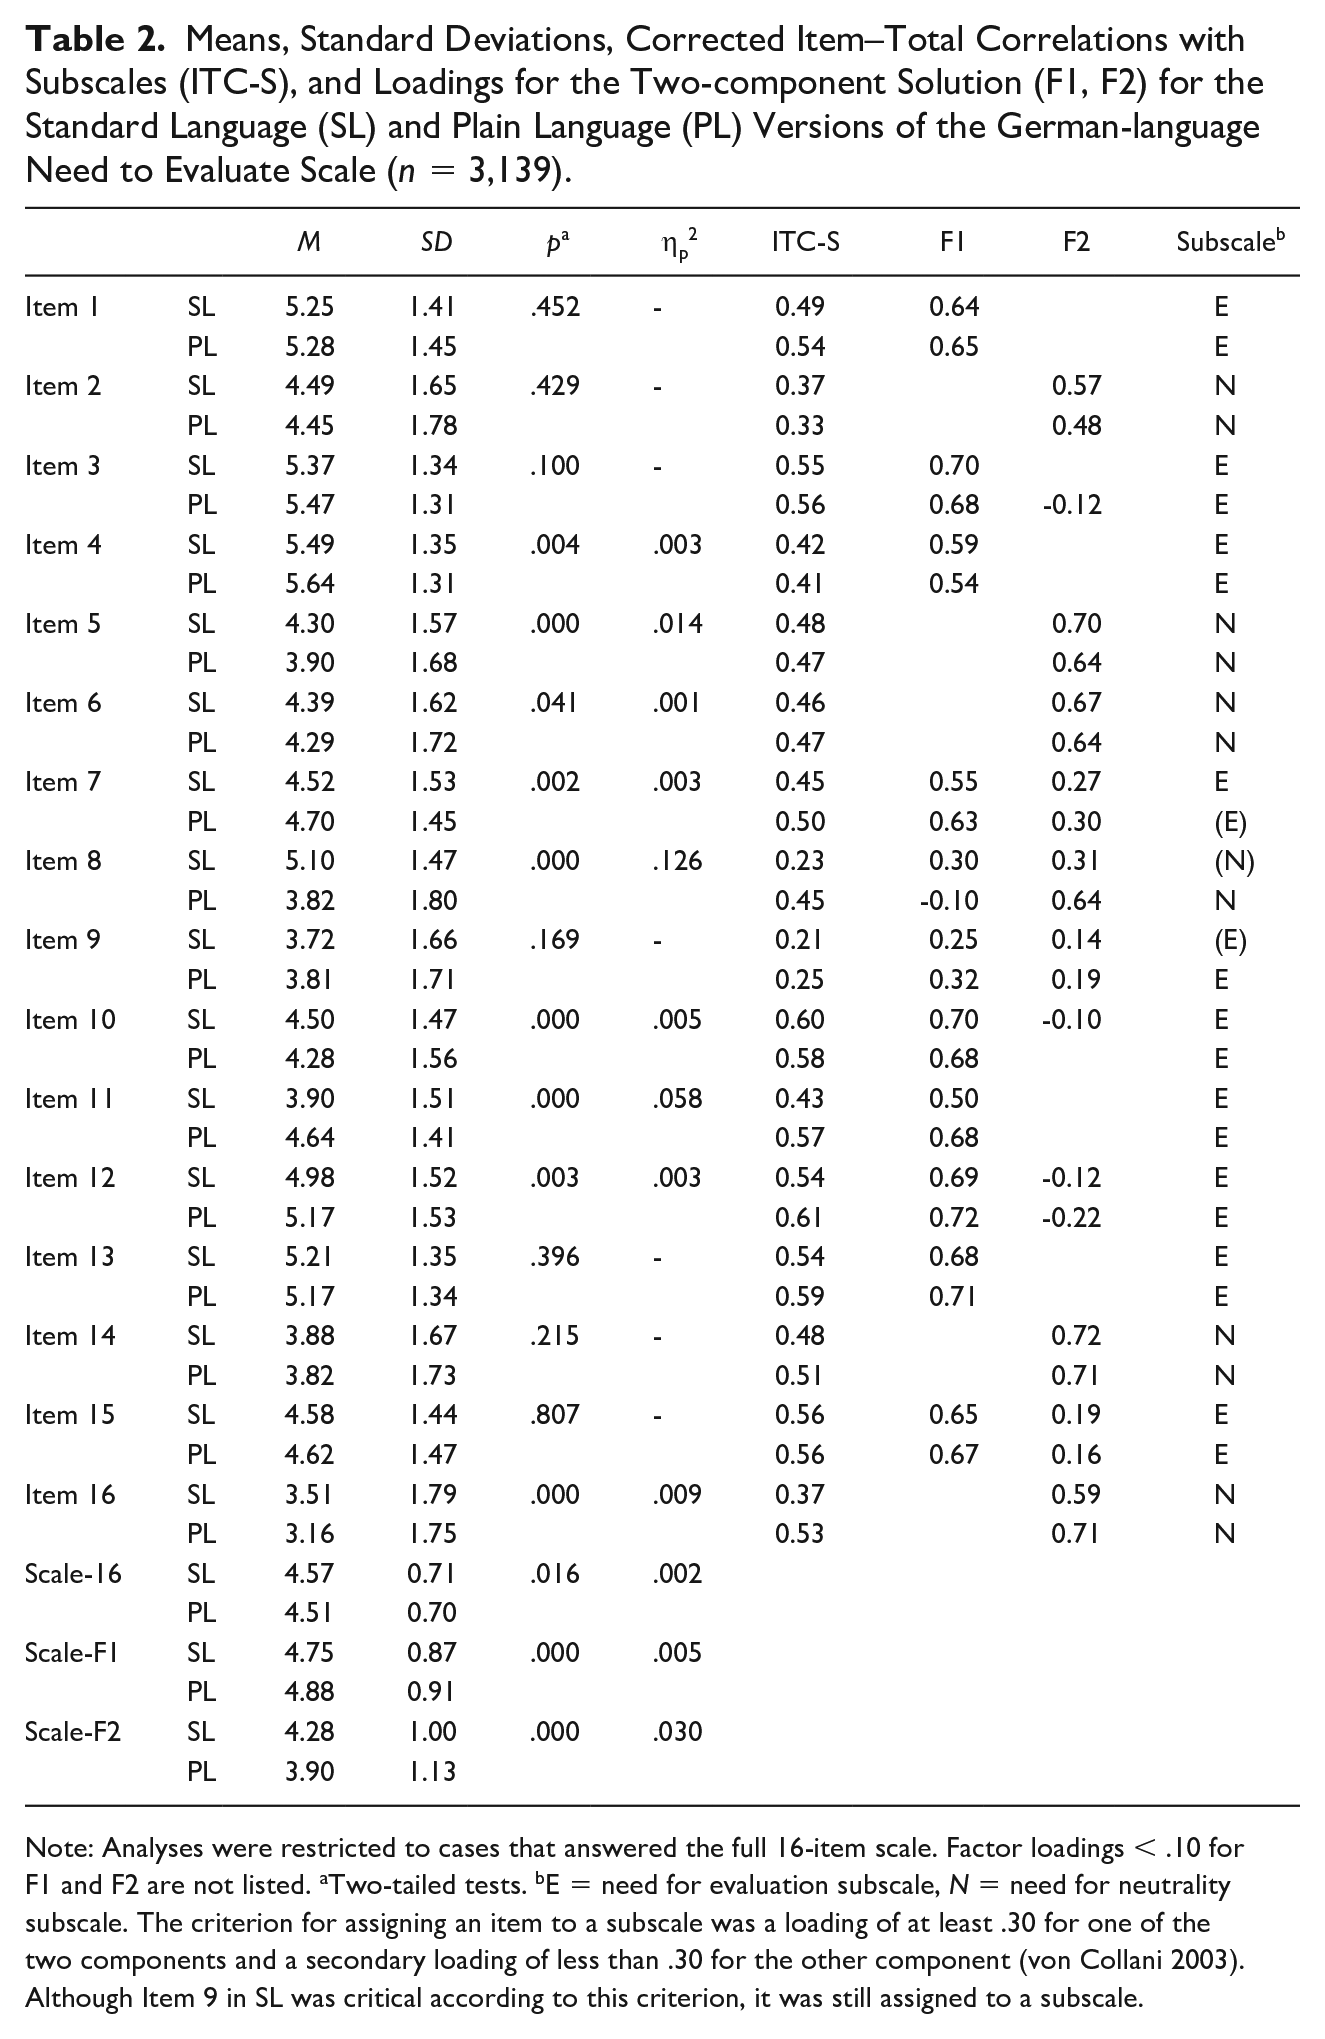
Note: Analyses were restricted to cases that answered the full 16-item scale. Factor loadings < .10 for F1 and F2 are not listed. aTwo-tailed tests. bE = need for evaluation subscale, N = need for neutrality subscale. The criterion for assigning an item to a subscale was a loading of at least .30 for one of the two components and a secondary loading of less than .30 for the other component (von Collani 2003). Although Item 9 in SL was critical according to this criterion, it was still assigned to a subscale.
Cronbach’s alpha for both subscales was slightly higher for PL (.826 and .724) than for SL (.799 and .666). Corrected ITCs were comparable between the two language versions, with a tendency toward slightly higher correlations for PL, especially for Items 8, 11, and 16. Only Item 9 in both language versions and Item 8 in SL had very low corrected ITCs (< .30), suggesting they should possibly be omitted from the scale (also considering the low loadings of around .30).
At the item level, one-way ANOVAs yielded significantly different means for nine items. The mean differences were considerable for Items 8 and 11, which is unsurprising given the large differences in wording, sentence structure, and design between the two language versions. Items 5 and 16 also showed significant mean differences, although the translation-related changes were considered moderate or small. A small but significant mean difference was noticeable for Item 4, although this was one of five items that were identical in both versions. Here, the difference in mean scores can be attributed to the differences in the labeling of the response options.
At the scale level, we found significant mean differences between the PL and SL versions for the overall scale and both subscales. The E subscale had slightly higher means in PL, while the N subscale showed slightly lower means than SL. The effect size indicated a meaningful difference between the two language versions for the latter subscale.
Looking at the differences between the two language versions separately by educational level, we found broadly similar patterns in the scale properties of the PL and SL versions (i.e., differences in item and scale means, corrected ITCs, and loadings for the two-factor solution; see Table A3 in the Supplementary Material).
Discussion
There is general agreement that to ensure good measurement quality, survey questions should be easy for all respondents to understand and answer. If respondents easily and correctly understand the questions, they can provide thoughtful and accurate responses. Using PL can help make survey questions easier to understand and improve the quality of the data collected. However, using different language versions raises doubts about whether the survey instruments are still comparable and whether items in PL are more straightforward for respondents to answer, thus leading to better measurement quality. This study compared an established multi-item scale in SL with the same scale translated into PL. We investigated whether the PL version reduced undesirable response behavior while maintaining comparable scale properties.
Regarding RQ1 (Does the PL scale lead to less undesirable response behavior than the SL scale?), the multi-item scale in PL showed higher response differentiation, fewer midpoint responses, and shorter response times than the SL scale. No differences between PL and SL were found regarding item nonresponse, acquiescent responding, and extreme responding. Thus, PL allowed respondents to answer more quickly while expressing more nuanced opinions and taking a clearer position on statements. This applied especially to respondents who can be assumed to have sufficient literacy skills and less to respondents at greater risk of comprehension difficulties. Regarding RQ2 (Are the scale properties comparable between the PL and SL versions?), we found largely comparable scale properties in both language versions. The multi-item scale in PL measured the same theoretical construct as the scale in SL did, and a two-dimensional scale structure was replicated equally in both versions. The PL version yielded slightly higher internal consistency and corrected ITCs compared with the SL scale. Mean values differed between the two language versions, with slightly but consistently higher agreement on the E subscale and consistently less agreement on the N subscale when the items were provided in PL instead of SL.
Our findings have implications for designing and adapting multi-item scales. First, translating an established multi-item scale into PL showed that existing scales do not necessarily conform to PL principles. The translation changed most items, with some changes being substantial. Our results also showed that using PL to reduce question complexity led to less undesirable response behavior. In other words, there seems to be leeway in existing multi-item scales to facilitate the cognitive response process. Thus, when developing or adapting multi-item scales, we recommend examining their complexity according to PL principles.
Second, some standards for labeling response options in rating scales have become established. Labels are usually short phrases like “Agree strongly,” “Extremely dissatisfied,” or “Not applicable at all.” In this study, both the scale items and the labels were translated into PL. Our findings regarding undesirable response behavior suggest that labels in SL may be too abstract or unclear for at least some respondents; more concrete and unambiguous labels in PL may reduce comprehension and mapping difficulties. Our experimental design cannot disentangle the effects of translated item texts and response option labels. However, our findings suggest that survey research should scrutinize current standards for labeling response options in multi-item scales.
Third, although our data provide promising initial evidence that PL can be used to renew and expand the corpus of existing multi-item scales, we consider it particularly useful for developing new multi-item scales to improve response quality while circumventing concerns about retrospective comparability.
Our study has limitations that hold opportunities for future research. First, we relied on PL experts when translating the multi-item scale from SL to PL. However, no clear standards or rules exist for adapting survey items to PL. Thus, PL experts may produce different translations depending on their expertise. We argue that developing transparent rules and best practices for applying PL in surveys is essential to ensure the quality and comparability of translation results. We encourage future research on the translation process and how established translation procedures (e.g., the TRAPD method for translating items into different languages based on a team approach; Harkness 2003) can be used for translations into PL. In this study, we aimed to examine the use of PL translations produced by PL experts without significant input from survey experts. This worked very well for some items, but not all. The fact that individual items led to very different answers showed how important it is to involve survey experts in the translation process to ensure that key aspects of good questionnaire design are considered (e.g., avoiding socially desirable wording and double-barreled items). In addition, cognitive pretesting with potential respondents (including those at risk of having comprehension and mapping difficulties) can further improve the PL translation process. To further improve comprehensibility according to the needs of those concerned, respondents can be asked during pretesting about their detailed understanding of the items and the reasons for any problems they may have.
Second, we relied on a nonprobability sample of respondents accustomed to answering web surveys. We suggest a replication based on a probability sample to test the generalizability of our results and to investigate the use of PL in the general population. It would also be advisable to have an external benchmark to assess whether language simplification brings survey researchers closer to or takes them further away from the “true” values in the population. Another interesting option would be to use a (nonprobability) sample of people who are particularly at risk of struggling with survey questions, such as those with lower task-related skills or low literacy.
Third, we tested the use of PL with one multi-item scale. To further examine the effects of PL, we suggest replicating the results with additional multi-item scales on other topics and with other question formats. Moreover, the interpretation of quality indicators is not always straightforward and unambiguous. For example, shorter response times alone are not an indicator of good or bad response behavior. For that reason, we used various quality indicators and interpreted them in combination. However, we recommend that even more indicators be used in future studies.
Finally, our study design was not intended to disentangle the effects of translated item texts and response option labels. Although the translated item texts largely account for the effect of PL on response behavior, we found preliminary evidence that PL-related changes in response option labeling matter, too. Therefore, to distinguish these two effects, we consider it worthwhile to systematically vary the extent of changes in item text and response option labeling in future experiments. As the PL approach comprises a set of measures, future studies should also examine these measures individually or in systematic combinations (e.g., changing single words, splitting a sentence into two) rather than all at once or in random combinations. This systematic comparison would enable the evaluation of which PL measures best increase comprehensibility and would provide further guidance on which aspects of a multi-item scale and the PL translation process need special attention when adapting existing or developing new scales.
Supplemental Material
sj-docx-1-fmx-10.1177_1525822X251322031 – Supplemental material for Measurement Quality of a Multi-item Scale in Plain Language
Supplemental material, sj-docx-1-fmx-10.1177_1525822X251322031 for Measurement Quality of a Multi-item Scale in Plain Language by Tanja Kunz, Tobias Gummer and Cornelia E. Neuert in Field Methods
Footnotes
Funding
The author(s) received no financial support for the research, authorship, and/or publication of this article.
Declaration of Conflicting Interests
The author(s) declared no potential conflicts of interest with respect to the research, authorship, and/or publication of this article.
Supplemental Material
Supplemental material for this article is available online.
References
Supplementary Material
Please find the following supplemental material available below.
For Open Access articles published under a Creative Commons License, all supplemental material carries the same license as the article it is associated with.
For non-Open Access articles published, all supplemental material carries a non-exclusive license, and permission requests for re-use of supplemental material or any part of supplemental material shall be sent directly to the copyright owner as specified in the copyright notice associated with the article.