
Abstract
QR codes are increasingly used in postal invitations to web surveys to facilitate participation. We experimentally tested how a QR code in the invitation letter affects participation in a push-to-web survey of the German family panel (pairfam). The response rate was three percentage points higher with QR codes than without. The QR code effect on response did not differ by gender or education, but it was significantly higher for middle-aged than for younger individuals. Additionally, the proportion of respondents using mobile devices to complete the survey increased substantially. This increase was exclusively due to a 12-percentage-point higher proportion of smartphones, with no increase in the proportion of tablets.
Introduction
Given the widespread use of the Internet by the general population, it is not surprising that social sciences are increasingly using online methods for data collection. In particular, online surveys have become a standard in survey-based research. Many studies have switched from previously dominant modes such as face-to-face or telephone surveys to a push-to-web design, e.g. the UK panel study Understanding Society, the US Panel Study of Income Dynamics, and the Swiss Household Panel Survey (Couper and McGonagle 2019; Jäckle et al. 2015; Tillmann et al. 2022). However, without interviewers present to establish contact and motivate individuals to participate, participation rates in online surveys tend to be lower than in other modes (Daikeler, Bosnjak and Lozar Manfreda 2020). Therefore, care should be taken when designing postal invitations and reminders for a web survey as these may be the only contacts with the sampled individuals (Kaplowitz et al. 2012).
A means to enhance participation may be including a Quick Response (QR) code in the postal invitation letter. QR codes can make survey access more convenient, allowing respondents to scan the code rather than typing the URL of the web survey into the browser on their computer, tablet, or smartphone. In the past few years, QR codes have become more popular in surveys because of built-in QR code readers in most smartphones (Endres et al. 2023). However, it remains unclear whether QR codes increase response rates as effects were tested experimentally only in a few studies, with mixed evidence (Endres et al. 2023; Lugtig and Luiten 2021; Marlar 2018; Marlar and Schreiner 2024). Further, QR codes may increase the use of smartphones or tablets instead of computers, which may affect data quality, be it due to inadequately displayed questions on small screens, difficulties in entering correct or complete answers, or distractions when answering the survey in unfavorable circumstances (Tourangeau et al. 2018).
We experimentally tested the effects of a QR code in the postal invitation letter to the web survey of the German Family Panel (pairfam) (Brüderl et al. 2023a), when a mode switch from face-to-face interviews to a sequential push-to-web strategy was implemented. A random split half of the panel members received a letter with a QR code additionally to the URL of the survey homepage and the remaining group received the same letter without a QR code. We address three research questions: First, did the QR code in the invitation letter increase response rates? Second, did the effect of the QR code on response differ between sociodemographic groups? And third, did the QR code influence the device used to complete the survey?
This study contributes to the literature in several ways. By providing evidence for Germany, we add to the mixed results regarding the effects of QR codes on response rates. Positive effects have been found by US-American studies but not in Europe so far. As smartphone use and survey participation processes differ between cultures, testing QR codes in different populations is valuable. Moreover, as technology and its use evolve rapidly, it is important to reevaluate the effect of measures such as QR codes regularly. In particular, we investigate differences in the QR code effect according to sociodemographic characteristics such as gender, birth cohort, and education.
Background and Hypotheses
QR codes are included in postal web survey invitations to facilitate participation. Without a QR code, respondents must manually enter the URL from the invitation into their web browser to access the survey homepage. In contrast, scanning the QR code, a graphical representation of the URL, takes respondents directly to the survey homepage.
Researchers may use the same URL and QR code for all invitations or generate personal URLs and QR codes for one-time use, which offer the advantage of tracking participation of sampled individuals. Furthermore, an optional personalized access code can be implemented. Like individual URLs and QR codes, individual access codes serve to identify respondents completing the survey and prevent multiple completion. If the same access code procedure is used for both the URL and the QR code in the invitation letter, the only difference for respondents is the convenience of scanning the QR code to access the survey homepage rather than manually entering the URL.
This slight difference might, however, significantly affect response. Survey participation can be understood as the result of a decision-making process in which individuals weigh the costs and benefits of participating (Singer 2011). They only decide to participate if the subjectively perceived benefits outweigh the perceived costs. Rather than being based on careful consideration the decision may be instantaneous and based on heuristics (Gigerenzer 2008; Singer 2011). The requirement to manually enter a URL to access the survey may be perceived as burdensome, increasing the perceived cost of survey participation. Conversely, if respondents scan the QR code with their device, accessing the survey takes only a few seconds, which may reduce the perceived cost and thus increase the likelihood of survey participation. Accordingly, we expect that a QR code in the invitation letter will increase response rates.
Only a few studies have experimentally tested the effect of QR codes on survey participation. Lugtig and Luiten (2021) implemented an experiment in the web part of the Dutch Survey of Consumer Sentiments, a Web-CATI sequential mixed-mode survey and found no differences in login and break-off rates of the web-survey between individuals who had to enter a URL, a personal ID code, and a password, and those who additionally received a QR code in the invitation letter that allowed them to access the survey without entering the ID code and password. In contrast, Endres et al. (2023) report a positive effect of QR codes on response rates from an experiment in a sequential web-telephone mixed-mode survey with invitation letters sent either before or after the telephone contact. The likelihood of participation was significantly higher when the invitation letter contained a QR code in addition to the URL (both personalized and without access code). Marlar and Schreiner (2024) analyzed two experiments conducted in 2015 and 2022, respectively, in mixed-mode (web and PAPI) surveys in the USA. They found a significant difference in overall response rates between the groups with and without QR codes in 2022, but not in 2015.
However, QR codes will only reduce the perceived cost of participation for those who have a QR code reader on their device and are accustomed to using it. We assume that younger individuals are more likely to be familiar with QR code readers due to their greater interest in experimenting with new technologies (Keusch et al. 2023; Ozkaya et al. 2015; Sindermann et al. 2020). Moreover, evidence suggests that men tend to be more technology-savvy than women, although results are ambiguous (Li et al. 2008; Rojas-Méndez et al. 2017). Accordingly, we hypothesize that the impact of QR codes on response rates will be greater among younger individuals and men.
In contrast, it is unclear how education affects the impact of QR codes on participation. On the one hand, individuals with higher levels of education may be more experienced in using smartphones (Keusch et al. 2023), but on the other hand, a QR code may be easier to use than entering a URL, which may lower the barrier to participation for the less educated.
Given that desktop and laptop computers typically lack QR code readers, a QR code in the invitation letter is likely to encourage respondents to use mobile devices to complete the survey. Studies by Lugtig and Luiten (2021), Marlar and Schreiner (2024), and Endres et al. (2023) found that the proportion of respondents using a smartphone or tablet was higher when a QR code was offered. Therefore, we hypothesize that the proportion of respondents using mobile devices will be higher with QR code in the invitation letter.
Data and Methods
The experiment was implemented in wave 14 of the German Family Panel (pairfam) (Brüderl et al. 2023a), a longitudinal study with focus on topics related to intimate relationships, fertility, and family relations (Huinink et al. 2011). The sample of individuals from the birth cohorts 1971-73, 1981-83, 1991-93 was nationwide randomly drawn from population registers in 2008, and a fourth cohort born in 2001-03 was added in the sample refreshment in 2018. After interviews had been conducted annually face-to-face since the first panel wave in 2008, a mode switch to self-administered push-to-web mode was implemented in wave 14. 1 In this wave, as in prior waves, all panel members who had participated in at least one of the two previous panel waves were invited to the survey. (For details on the survey design see Brüderl et al. 2023c.)
Fieldwork for wave 14 began in October 2021 with an invitation to the online survey sent by postal mail, including an unconditional cash incentive of €5. Reminders were sent two and five weeks later, the second one including the paper-and-pencil questionnaire as an alternative to the online survey. To reduce panel attrition and retain as many participants as possible in the panel, individuals who had not completed the survey until the indicated end of the fielding period in February 2022 received a reminder phone call in late February if a phone number was available. As the phone contact may bias the results of the QR code experiment, we exclude this final fielding period from our analysis. The web survey had a mean duration of 20 minutes and was adapted to smartphones (responsive design); the mail questionnaire included the identical question program and spanned 26 pages.
Before fielding, the gross sample was randomly split in two equal groups (complete random assignment). In the experimental group, a QR code was included in the invitation and the two reminder letters. It was printed next to the URL and the access code needed to start the survey, with no mention of the QR code in the invitation text. Upon scanning the QR code, individuals were directed to the website indicated by the URL to enter their access code. This last step was required regardless of the QR code. The control group received only the URL and the access code in their invitation letter. Invitation and reminder letters were identical in both groups except for the QR codes (see Figures A1 and A2 in the Appendix).
From 6,226 individuals invited to the mixed-mode survey (gross sample), 41 invitation letters were returned due to incorrect or unknown addresses. In 18 completed interviews the date of the interview was missing so that it could not be ascertained whether the survey date was before the reminder phone call. These cases were excluded, resulting in 6,167 cases in our analysis sample, of these 3,079 (49.9%) in the experimental group and 3,088 (50.1%) in the control group. The two groups do not differ significantly in demographic characteristics, as shown in Table A1 in the Appendix, which presents the distribution of the variables for the two experimental groups and the results of the tests for differences (last column).
Analytic Strategy
We compare the experimental groups using a χ2 test and a linear probability model (LPM) to assess the impact of the QR codes in the invitation letter on the likelihood of survey participation. We then examine whether gender, birth cohort and education moderate the effect of QR codes, i.e. whether the influence of QR codes differs by individuals’ characteristics. For this, we estimate a separate LPM regression for each characteristic of interest, modeling the interaction between the respective characteristic and the QR code, and controlling for potential confounding variables and their interaction with the treatment variable (QR code). Finally, we compare the distribution of the devices used to complete the survey between respondents with and without a QR code in the invitation letter and test for differences using Pearson’s χ2 tests. Analyses were conducted using Stata 18.0.
Measures
Our dependent variable is the response in Wave 14, coded 1 for completed interview, and 0 for non-contact, refusal, and break-off.
The experimental treatment variable indicates whether a QR code was printed in the invitation letter and the reminders, coded 1 for invitations with a QR code (experimental group), and 0 for invitations without a QR code (control group).
Information on individual characteristics is drawn from previous waves. Age is captured by the four birth cohorts available, i.e. 1971–1973, 1981–1983, 1991–1993, and 2001-2003. Years of education are used as a linear measure of educational attainment (for details, see Brüderl et al. 2023b). An additional dummy variable identifies individuals still in school (1 if in school, 0 otherwise), with years of education coded as 0 for those in school, so that the effect of years of education applies only to those who have completed school.We account for gender and cohort in all models.
The device used to complete the survey was automatically recorded as paradata. We distinguish desktop/laptop computer, smartphone (including phablet), tablet, and paper questionnaire (PAPI).
Descriptive statistics for all variables, including information on missing values, are provided in Table A2 in the Appendix.
Results
In line with our hypothesis, the response rate 2 is higher for those who received a letter with a QR code than for those who received a letter without a QR code (63.9% vs. 60.6%). The difference is 3.3 percentage points and significant (χ2(1)=7.1191, p=0.008). We will refer to this difference as the QR code effect. The LPM exactly reproduces this QR code effect (Figure 1). Figure 1a displays the probability of response with and without QR codes based on this model. Figure 1b displays the corresponding QR code effect from the LPM and, additionally, from a logistic model (Best and Wolf 2012) as a robustness check. The linear and logistic models yield consistent results (see Appendix, Table A3 for complete regression results), and we continue with the simpler linear model.
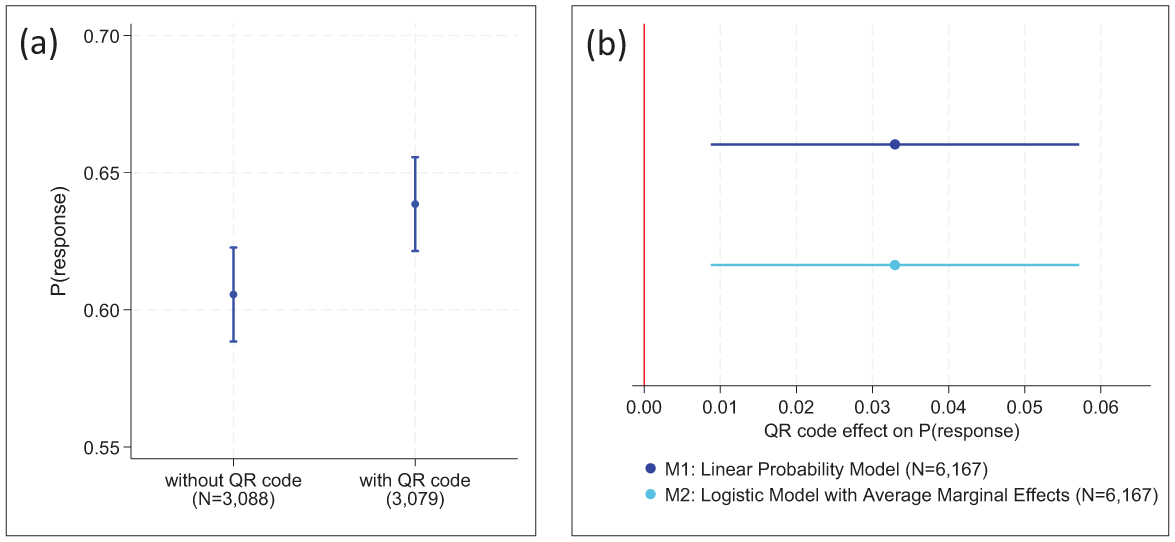
The effect of a QR code in the invitation letter on the response probability.
Next, we examine whether the QR code effect differs between men and women, birth cohorts, and educational levels. Figure 2 presents the results for gender. The top panel shows the response probabilities with and without a QR code by gender, with the resulting gender-specific QR code effect below. While we find a QR code effect of 4.5 percentage points for men, the QR code effect is smaller and not significant for women. However, the gender difference in the QR code effect is not significant (no significant interaction between gender and QR code in Table A4 in the Appendix). Therefore, our hypothesis that the QR code effect is larger for men is not fully supported.
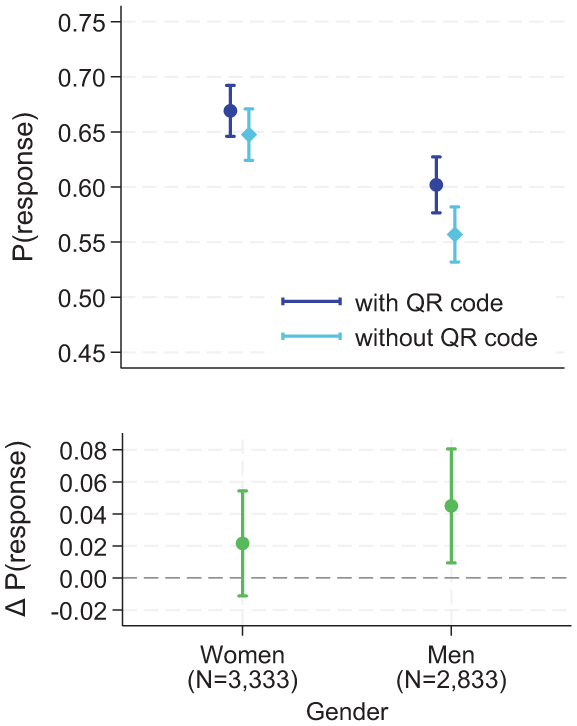
QR code effect on response by gender.
Figure 3 displays the results for birth cohorts. We find a positive QR code effect (six percentage points) for the two oldest cohorts but not for the two younger cohorts. The response probability for the youngest cohort even tends to be lower with QR codes than without. The QR code effects in the two oldest cohorts differ significantly from the effect in the youngest cohort (significant interaction effects of cohort and QR code in Table A4 in the Appendix). Therefore, our hypothesis that the QR code effect is larger in younger birth cohorts is not supported.
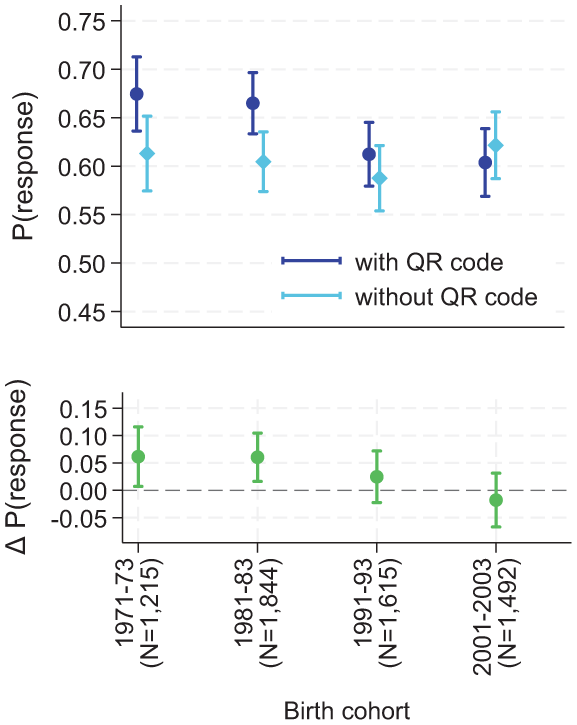
QR code effect on response by birth cohort.
Figure 4 shows that response heavily depends on years of education in both groups, with and without QR codes. However, the QR code effect is significant only for those with between 12 and 17 years of education. It increases only slightly with additional years of education, and this increase is not significant (as indicated by the non-significant interaction effect in Table A5 in the Appendix). Note that the estimate is based only on individuals who have completed school.
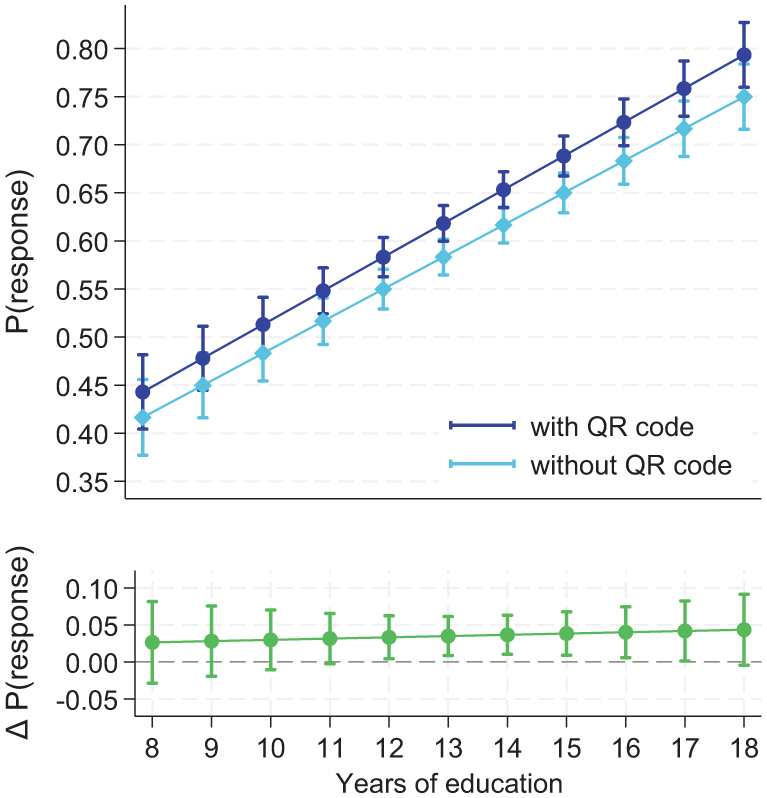
QR code effect on response by years of education.
Figure 5 shows the distribution of devices used to complete the interview for the groups with and without QR codes. The distribution is significantly different between the two groups (χ2(3)=71.8, p=0.000). The proportion of smartphone use is 12 percentage points higher in the QR code group (35%) than in the control group (23%). The higher smartphone share comes at the expense of the use of desktop/laptop computers, which is lower in the QR code group than in the control group (52% versus 63%). In contrast, there is hardly any difference in the use of tablets and paper questionnaires. Comparing the proportion of mobile devices (smartphones and tablets) versus desktop/laptops and PAPI yields a significant difference (χ2(1)=51.2, p=0.000), supporting the hypothesis of a higher proportion of mobile devices with QR codes.
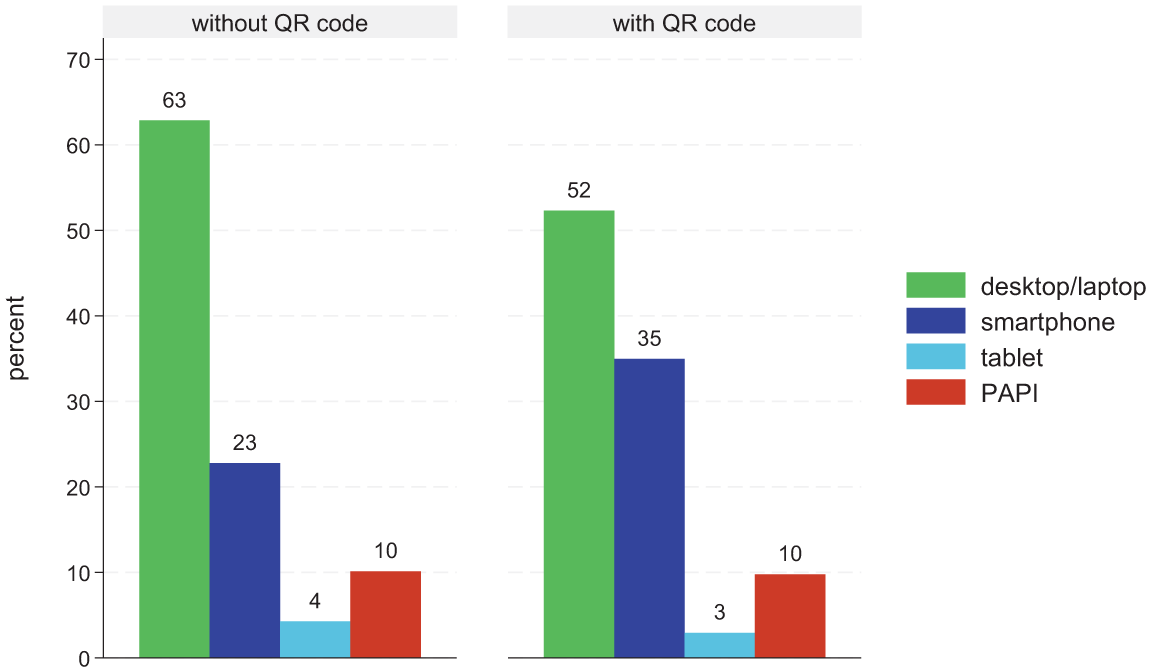
Distribution of the device used for completing the interview with and without QR code.
Discussion
This study aimed to answer three questions: First, whether QR codes in invitation letters and reminders affect survey response rates; second, whether this effect varies across different sociodemographic groups; and finally, whether QR codes affect the devices used to complete the survey.
We found that the response probability was more than three percentage points higher with QR codes than without. This is good news for survey researchers, as the cost of including QR codes in invitation letters is minimal. Our results are consistent with Endres et al. (2023) and the more recent of the two experiments reported by Marlar and Schreiner (2024), but in contrast to Lugtig and Luiten (2021). The reasons for this contrast are unclear; for instance, it might be due to a different presentation of the QR code in the invitation letter, lower power of their experiment due to smaller group size, a different age structure of the target population, or cultural differences in the use of QR codes.
In our experiment, the QR code effect on response did not vary significantly with gender and level of education. This is also positive because it means that QR codes do not cause a bias in the composition of the net sample concerning these characteristics. In contrast, the QR code effect differed between birth cohorts, although not as expected: It was largest in the oldest birth cohort and smallest in the youngest birth cohort, and thus increased the proportion of older compared to younger individuals in the net sample.
A tentative explanation may be that the QR codes does not affect response among younger cohorts because time is a less scarce resource for them. Therefore, the small time savings associated with the QR code may not influence their participation decision. In contrast, for middle-aged individuals, who often struggle to balance the demands of work, care, and leisure, the slight time reduction may make a difference.
As expected, QR codes increased the proportion of mobile devices used to complete the survey. This increase was driven by a 12 percentage point increase in the proportion of smartphones, with no increased use of tablets. The higher proportion of smartphones may be a disadvantage of using QR codes if smartphone use is associated with lower data quality. However, results on the impact of mobile devices on data quality are mixed (Décieux and Sischka 2024; Schlosser and Mays 2018; Sommer et al. 2017; Tourangeau et al. 2018). The impact of smartphone use on data quality likely depends on many factors, such as the type of questions, survey length, and how well the questionnaire design is adapted to mobile devices. Accordingly, for some surveys, the negative impact of QR codes on data quality due to the increased use of smartphones may outweigh their positive effect on response rates. However, as smartphones are frequently used to take surveys even without QR codes, questionnaire design should consider these devices to obtain high-quality survey data. We therefore recommend using QR codes as a cost-effective means of increasing response rates, provided that the specifics of the study do not preclude it.
Our study is not without limitations. First, our experiment was implemented in an ongoing panel, and QR code effects may be different in cross-sectional studies. Second, elderly persons were not part of our target population. Finally, as we did not record whether the QR code was used to open the survey page, we cannot test potential mechanisms underlying the QR code effects. Instead of the easier access (via smartphone), the effects may be caused by signals sent by the QR codes: the survey may seem more up-to-date or user-friendly with a QR code, and taking the survey on a smartphone may seem more acceptable. In this case, individuals would be affected by the QR code even without using it. Future research may disentangle these effects.
Supplemental Material
sj-docx-1-fmx-10.1177_1525822X241308522 – Supplemental material for Does a QR Code in the Invitation Letter Increase Participation in a Push-to-web Survey?
Supplemental material, sj-docx-1-fmx-10.1177_1525822X241308522 for Does a QR Code in the Invitation Letter Increase Participation in a Push-to-web Survey? by Claudia Schmiedeberg, Jette Schröder and Christiane Bozoyan in Field Methods
Footnotes
Acknowledgements
This article uses data from the German Family Panel pairfam, coordinated by Josef Brüderl, Sonja Drobnič, Karsten Hank, Johannes Huinink, Bernhard Nauck, Franz J. Neyer, and Sabine Walper. From 2004 to 2022 pairfam was funded as priority program and long-term project by the German Research Foundation (DFG).
Declaration of Conflicting Interests
The authors declared no potential conflicts of interest with respect to the research, authorship, and/or publication of this article.
Funding
The authors received no financial support for the research, authorship, and/or publication of this article.
Ethical Approval and informed consent statements
The ethics committee of the Faculty of Management, Economics and Social Sciences of the University of Cologne (address: Albertus-Magnus-Platz, 50923 Köln, Germany) approved the German family panel (pairfam) in July 2019. Reference Number: 19016KH. All participants provided verbal informed consent prior to enrolment in the study.
Data availability statement
Supplemental Material
Supplemental material for this article is available online.
Notes
References
Supplementary Material
Please find the following supplemental material available below.
For Open Access articles published under a Creative Commons License, all supplemental material carries the same license as the article it is associated with.
For non-Open Access articles published, all supplemental material carries a non-exclusive license, and permission requests for re-use of supplemental material or any part of supplemental material shall be sent directly to the copyright owner as specified in the copyright notice associated with the article.