
Abstract
The article investigates satisfaction of Hungarian adolescents aged 12–14, comparing data from a home survey and a school survey. Satisfaction items are measured on a 0–10-point scale. We estimate the effect of survey settings on satisfaction through ordered logit regression analysis. Contrary to potential expectations, the analysis finds that adolescents are not conformists, they express dissatisfaction with school or home matters even if they are interviewed at the respective place the question is focused on, indicating that adolescents are more critical with items contributing to their satisfaction levels that are more strongly related to the survey location. The analysis identified some satisfaction items that seem to be less sensitive to survey effects, thus these might be more reliable indicators of child satisfaction with broader relevance. Our results suggest that social desirability of the answers does not necessarily depend on survey settings.
Keywords
The Dual Aim of the Study
While there is a growing focus on adolescents as the target group of research in many studies, survey methodology frequently fails to adequately consider the specificities of such data collection. Schools and home are two natural but very different places in their lives where adolescents have different roles, duties, and social positions. This article focuses on a methodological question: Do survey settings influence children’s satisfaction? By survey settings, we mean whether adolescents were interviewed in school or at home; while satisfaction refers to their positive or negative opinion on various circumstances connected to their everyday life experiences. Other factors, such as the variation in survey mode might also influence their answers, and social desirability and question sensitivity might work in different ways.
While mode effects are more frequently studied, our article fills a gap in terms of social desirability bias, which is rarely examined in sociological research on adolescents’ satisfaction. Social desirability bias means that respondents give answers that they think are more approved, to give a positive image of themselves. They over-report desired behavior and attitudes and under-report undesired ones. This bias may be more frequent for more sensitive questions. Moreover, social desirability bias may be related to the location of the interview depending on where external expectations are perceived as stronger.
We use data from two independently conducted surveys in which the survey settings unintentionally diverged from each other. Both questionnaires included the 12 satisfaction items that we later utilized. One survey was conducted in adolescents’ homes, while the other was administered in schools in the presence of an instructor taking the role of the interviewer at the group level. For simplicity, we will label these surveys as “home survey” and “school survey.” The article begins with a literature review on investigating adolescents’ satisfaction with an emphasis on methodological challenges. In the next section, we outline the assumptions and then present our data. This is followed by the statistical analysis we perform with two aims. On the one hand, we examine whether survey settings make a difference in the level of satisfaction for adolescents aged 12–14 in Hungary. On the other hand, we examine whether any difference due to survey settings can be associated with the occurrence of social desirability and the specific topics concerning adolescents’ satisfaction. The article ends with the discussion of the findings.
Literature Review and Hypotheses
Previous Research on Adolescents’ Satisfaction
Adolescents as “data providers” differ from the adult respondents of empirical studies. Gaining access to them is more difficult because interviewing adolescents below 18 years of age requires parental permission in most countries. Taking their cognitive ability into account is particularly crucial regarding the quality (reliability) of the data (Borgers et al. 2000). Also, while adults are more autonomous when expressing opinions, the anonymous survey situation might be a special occasion for adolescents to report on their feelings and satisfaction from their own viewpoint, based on their own interpretation (Ben-Arieh 2005). At the same time, opinions and evaluations by adolescents seem to be “overestimated,” as only a minority express negative attitudes (Bradshaw and Rees 2018; Thomaes et al. 2017). Therefore, the distribution of adolescents’ satisfaction is rather skewed in the positive direction. Even those in a deprived situation may be satisfied with their lives, because they know no better, or they have become reconciled to it (Bradshaw et al. 2013). Nevertheless, Christensen and James (2017) argue that if choosing appropriate methods for the particular research contexts (which do not necessarily differ from methodologies used in research involving adult respondents), one can get valuable and detailed insights into their perspectives.
Previous research, such as Health Behaviour in School-aged Children (HBSC) and Programme for International Student Assessment (PISA) shows that adolescents’ satisfaction is clearly structured by certain demographic and social characteristics (Inchley et al. 2020; OECD 2019). Findings of these studies indicate that girls, younger adolescents, and respondents from socioeconomically advantaged families, typically report higher satisfaction levels. Our school survey utilizes the data from the third wave of the International Survey of Children’s Well-being (ISCWeB), fielded in 2019 in schools across 35 nations (Rees et al. 2020), which exhibits the presence of similar demographic and social background effects.
Previous Research on the Influence of Variation in Survey Settings
Research with adolescents is limited in studies dealing with the implications the place of data collection might have for the survey outcomes. In survey practice, both home and school are often considered as suitable interview locations by researchers as these are familiar places for adolescents where they would feel comfortable, although they differ in some respects. According to Hood et al. (1996), for adolescents, home as a place is associated with ideologies and emotions and its privacy has high value. Consequently, they might interpret the concept of home differently from adults, parents, or researchers. In their study, interviews with adolescents outside the home resulted in freer discussions in contrast to the home interviews, particularly if these interviews were conducted in pairs or groups of peers (Hood et al. 1996). Thus, researchers could not be sure whether adolescents were more confident because of the location outside the home or the supportive peer company. In any case, the school might not always provide good circumstances for a free discussion when the topic is a school-related sensitive issue (Hennessy and Heary 2005).
A further important lesson from the literature is that adolescents spontaneously provided examples from the school context during interviews conducted at school, whereas researchers had to prompt them specifically for examples from the home environment (Hallett et al. 2003, as cited in Punch 2007). Similarly, when Punch (2007) interviewed siblings at home, they were talking about home-related stories, not about their life in the school or outside the home. This highlights that the environment of the investigation has a particular impact on the topic.
The different research setting can easily cause social desirability bias for adolescents, namely whether the data were collected in a school or home environment (Krumpal 2013). This holds particularly for sensitive research topics, such as drug use (Fendrich and Johnson 2001); inconsistencies in reports of smoking among adolescents aged 10–18 (Griesler et al. 2008); or other health risk behaviors (Brener et al. 2006; Kann et al. 2002), when comparing data from school- or home-based surveys.
From the perspective of our study on adolescents’ satisfaction, however, social desirability is a more relevant issue in relation to certain aspects of their subjective well-being, for example their self-reported perceptions of family or peer relationships. A good relationship with family members and peers is seen mostly as a value; over-reported positive states or behaviors and under-reported negative experiences or actions can be associated with socially desirable responding (Camerini and Schulz 2018). Survey location is an issue here because social desirability has a perceived situational component. When talking about family, the home interview location is assumed to increase over-reporting satisfaction with family relations; when talking about peers, conducting interviews at school settings might lead to over-reported satisfaction with classmates. Previous research reveals that satisfaction with school life and with classmates are mutually reinforcing (Corominas et. al. 2022).
Another possible source of social desirability bias is the relationship between the adolescent and the interviewer. According to De Leeuw (2008), the presence or absence of the interviewer is the main difference in data collections. A bias toward positive responses due to the presence of an interviewer can be accounted for the desirability of social expectations of appropriate responses to certain questions, especially sensitive ones (Conti and Pudney 2011). The differences are presumably linked to the unintended involvement of the interviewer and the closeness between interviewer and respondent, which tend to be pronounced in face-to-face surveys compared to other survey modes (Berzelak and Vehovar 2018; Preisendörfer and Wolter 2014). This connection may be stronger for adolescents, as they perceive the interviewer as a representative of the adult world with presumed expectations of appropriate answers. This claim is supported by the results of Miller et al. (2015) who reported significantly higher degree of social desirability bias for an interview assessment than a classroom assessment. Since Miller (2012) found no social desirability bias for students in higher education in the National Survey of Student Engagement, (NSSE), literature seems to confirm the greater reliability of self-report surveys in this sense.
Item nonresponse is a final relevant issue with particular features when surveying adolescents. Missing responses may be connected to adolescents’ cognitive development (which typically improves with age) (Borgers and Hox 2001; Borgers et al. 2000) and educational achievement (Haunberger 2014), so missing responses are less common among older adolescents and higher achievers. Inattention can also lead to unintentional omission of answers in self-completed surveys; however, the likelihood of such a mistake can be reduced if the questionnaire is administered by an interviewer. Nevertheless, in this case, the child might not answer a sensitive question for the interviewer that would be answered in a self-administered questionnaire. That makes item nonresponse an indicator of topic-specific sensitivity and a possible sign of social desirability bias (Yan 2021).
Assumptions
The literature review suggests that difference in settings has not always caused social desirability bias in the same way. On the one hand, home surveys may be a more reliable data source than school surveys given the more informal environment where adolescents tend to experience fewer external social expectations. We assume that some adolescents might find satisfaction items on school or classmates sensitive when completing the questionnaire in the classroom. On the other hand, the same sensitivity is likely to occur in the home survey for satisfaction items related to home or family relationships. An interviewer’s presence may heighten the risk of social desirability bias in the home survey. At the same time, the presence of the interviewer and the questionnaire method largely mitigates peer effects in the school survey, making the difference between home and school environments smaller in our case. Consequently, we expect that social desirability will turn to topic-specific issues in adolescents’ responses (home-related items in the home context and school-related items in the school context). This would mean that topic-specificity plays the main role in affecting how survey settings influence adolescents’ satisfaction with the various aspects of their lives.
Data, Variables, and Methods
The article takes advantage of the existence of two independent data collections where survey settings unintentionally happened to differ. The two surveys investigating adolescents of the same age with partly different research objectives contained a very similar battery of 12 satisfaction items.
Survey Setting 1
The school survey was part of the third wave of the ISCWeB, fielded between January and May 2019. A multi-stage stratified probability sampling was applied, aiming to interview 1,000 adolescents from the age group of 12–14-year-olds. Settlements (including the capital and big cities of Hungary by definition) and 119 primary schools were selected randomly, with alternate schools chosen in the same or similar municipality in case of refusal by the school principal. The survey finally took place in 75 schools (response rate: 63%). The school survey was completed in the classroom in the presence of an instructor who helped when needed and ensured anonymity and confidentiality. As intended, no teacher controlled the data collection and pupils’ responses. As parental consent was occasionally lacking, the aim to interview all individuals within a class proved unsuccessful in most cases. Calculating response rates at the individual level is not feasible due to the absence of a list of all adolescents in the selected classes. Data were weighted at school level according to the official statistical distribution of Hungarian primary schools. Demographic details on the school sample at the individual level are presented in the Supplementary Material (Table S3).
Survey Setting 2
The home survey was fielded in November 2017, and applied a quota sampling, targeting families raising adolescents aged 12–16 nationwide, covering all Hungarian regions. (This analysis leaves out those above 14 for the proper comparison to the school survey.) The municipalities were selected randomly. There was no sampling frame defined for the selection of families at the settlements by quota method. A random element appeared in the procedure within the family: If more than one individual belonged to the required age group, the respondent was randomly selected according to the first letter of their name. The home survey data have been weighted by census data on families raising adolescents aged 12–16 to correct for deviations by region, type of municipality, and adolescents’ gender and age. Refusal has certainly occurred during the fieldwork, but there is no available information on the exact response rate. At least one of the parents was at home during the interview (a parental questionnaire was also part of the data collection). Demographic details (based on information from the parental survey) on the home sample at the individual level are presented in the Supplementary Material (Table S3). Parents or any other third party could not be in the room where the interview took place while the adolescent answered the questionnaire.
For this article, we merged the data of the school survey (N=976) and of the home survey (N=531). We selected those respondents who provided a valid answer on all dependent variables, the 12 satisfaction items (see below), thus losing 6.0% of participants from the school survey and 4,9% from the home survey. The analysis is carried out on a dataset of N=1422 (school: N=917, home: N=505). The loss of valid answers is slightly higher for the self-administered school survey than the face-to-face home survey.
Variables
As mentioned above, the two surveys were part of different research projects with various topics and aims, but both questionnaires were partly focused on adolescents’ subjective well-being and approached it by questions on satisfaction with several items. To merge the datasets, we reviewed satisfaction items and paired them according to the content where it was possible. For dependent variables, we selected 12 overlapping satisfaction items, which were measured on a 0–10-point Likert scale, with only the extreme values marked (0 = not at all satisfied, 10 = totally satisfied). The 12 items were grouped into three sets regarding their subject. The first set contains items related to the home and the family: satisfaction with home, family relations, possessions, and neighborhood. The second set is related to the school environment and the peer group: satisfaction with school, classmates, friends, and appearance. The third set contains more general items: satisfaction with life in general, future prospects, leisure time, and health. Satisfaction items in the school survey were previously tested and used as part of the third wave of the ISCWeB. Satisfaction items in the home survey were chosen to be fully comparable with their counterparts in the school survey.
In addition, nine demographic background variables were chosen that were common in the questionnaires. Note that demographic background information comes from the parents in the home survey and partly in the school survey. The exact wording of questions regarding satisfaction and demographic background information as well as detailed information on demographic dummy variables appear in the Supplementary Material (Tables S1–S3).
The main explanatory variable regards survey settings, a dummy variable comparing school setting (coded 1) to home setting (coded 0). All demographics are measured with a dummy or a set of dummy variables. These covariates are the following: gender, age (12/13/14 years), place of residence (capital or big city/other town or city/village), household size (2/3/4/5 or more persons), information on whether the respondent lives always in the same household, and whether the respondent lives with grandparent(s); subjective assessment of the material situation of parents (good (living comfortably or doing alright)/bad); academic achievement (last year’s grades: better (very good or excellent)/worse).
There is no significant difference between the two samples in terms of place of residence, but proportions of girls, younger respondents, smaller families, one-parent households, worse subjective material conditions and better-performing students differ between the two surveys. Thus, we must control for these composition differences, since demographic variables themselves also influence satisfaction levels.
Analytical Strategy
Initially, to determine the differences in means between the satisfaction items measured in the home survey and the school survey, we employed separate analysis of variance (one-way ANOVA) tests for each satisfaction item, while the survey setting (home vs. school) served as the independent variable. Then, in the multivariate step, we applied 12 separate ordered logit regression models to analyze the effect of survey settings on the 12 satisfaction items. We used ordered logit models due to the ordinal nature of the outcome variables (dependent variables were measured on 11-point ordered scales). Additionally, given that satisfaction is a latent, difficult-to-quantify measure, the points given by the respondents on the scales only approximately reflect their true, unobserved satisfaction levels.
The regression models are nested: The first model includes the main explanatory variable, survey settings. To control for the sample differences and their potential effects on observed satisfaction scores, the multivariate analysis includes demographic variables in the second and third regressions models. The third model also contains interaction terms between the survey settings dummy and those demographic variables, which turned out to be significant predictors in the second model. We add the interaction terms to test our assumption that topic-specificity plays a role in how survey settings influence adolescents’ satisfaction.
Results
Adolescents’ Satisfaction and Survey Settings: Bivariate Associations
The main interest of this analysis is the variation in satisfaction levels according to the survey settings. Figure 1 shows the differences of means for the 12 satisfaction items between the home survey and the school survey, measured on 0–10-point scales. In most of the cases (nine items out of 12), the difference of means is significant (p<0.05). Exceptions are satisfaction with friends, leisure time and health. Adolescents interviewed in school are more satisfied (p<0.001) with three of the home-set items: home, family relations, and possessions, while those interviewed at home are definitely more satisfied (p<0.001) with three of the school-set items: school, classmates, and physical appearance. Satisfaction with neighborhood, life in general and with future prospects also differ by the survey setting but less markedly (p= 0.028, p=0.012, and p=0.011, respectively). At first sight, topic-specificity makes a difference.
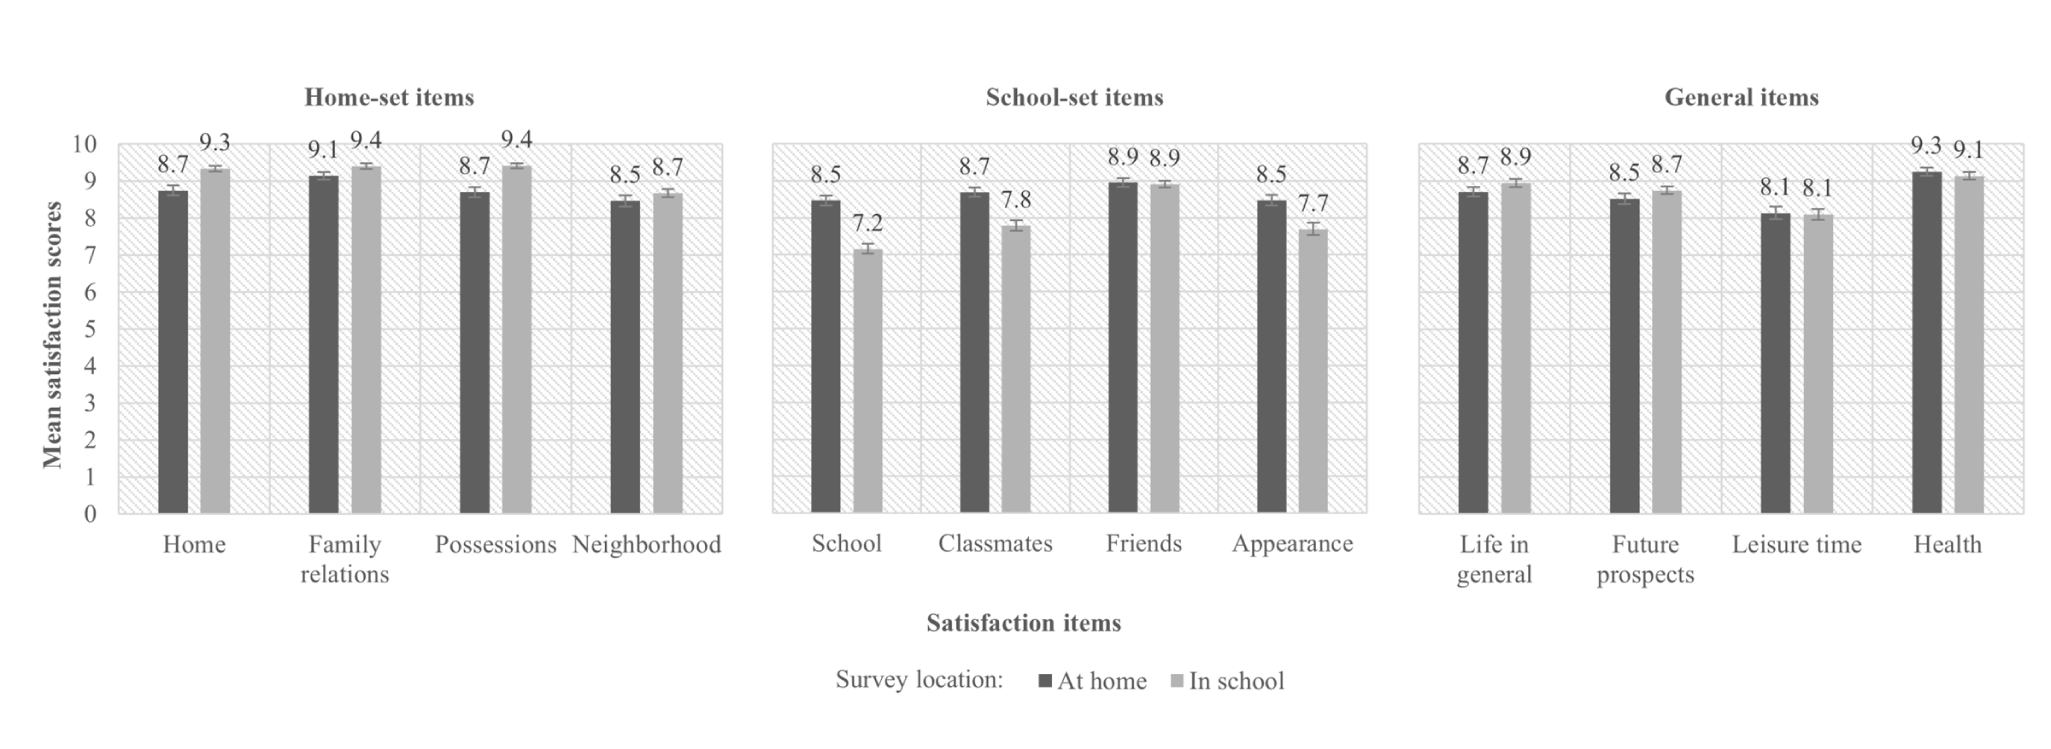
Bivariate relationship between adolescents’ satisfaction items and survey settings (denoted by the place where they have been interviewed: home vs. school).
The Effect of Survey Settings on Adolescents’ Satisfaction: Multivariate Analysis
Table 1 contains unstandardized estimates from ordered logit regressions for the main explanatory variable. The first column displays the uncontrolled estimates, the second one the main effects controlled for the demographic variables, and the estimates in the third column are controlled for the interaction terms, as well. The full set of estimates and cut points are included in the Supplementary Material (Tables S4–S15).
Satisfaction with the twelve items measured on a 0 to 10-point scale by survey location: estimates from the multivariate analysis.
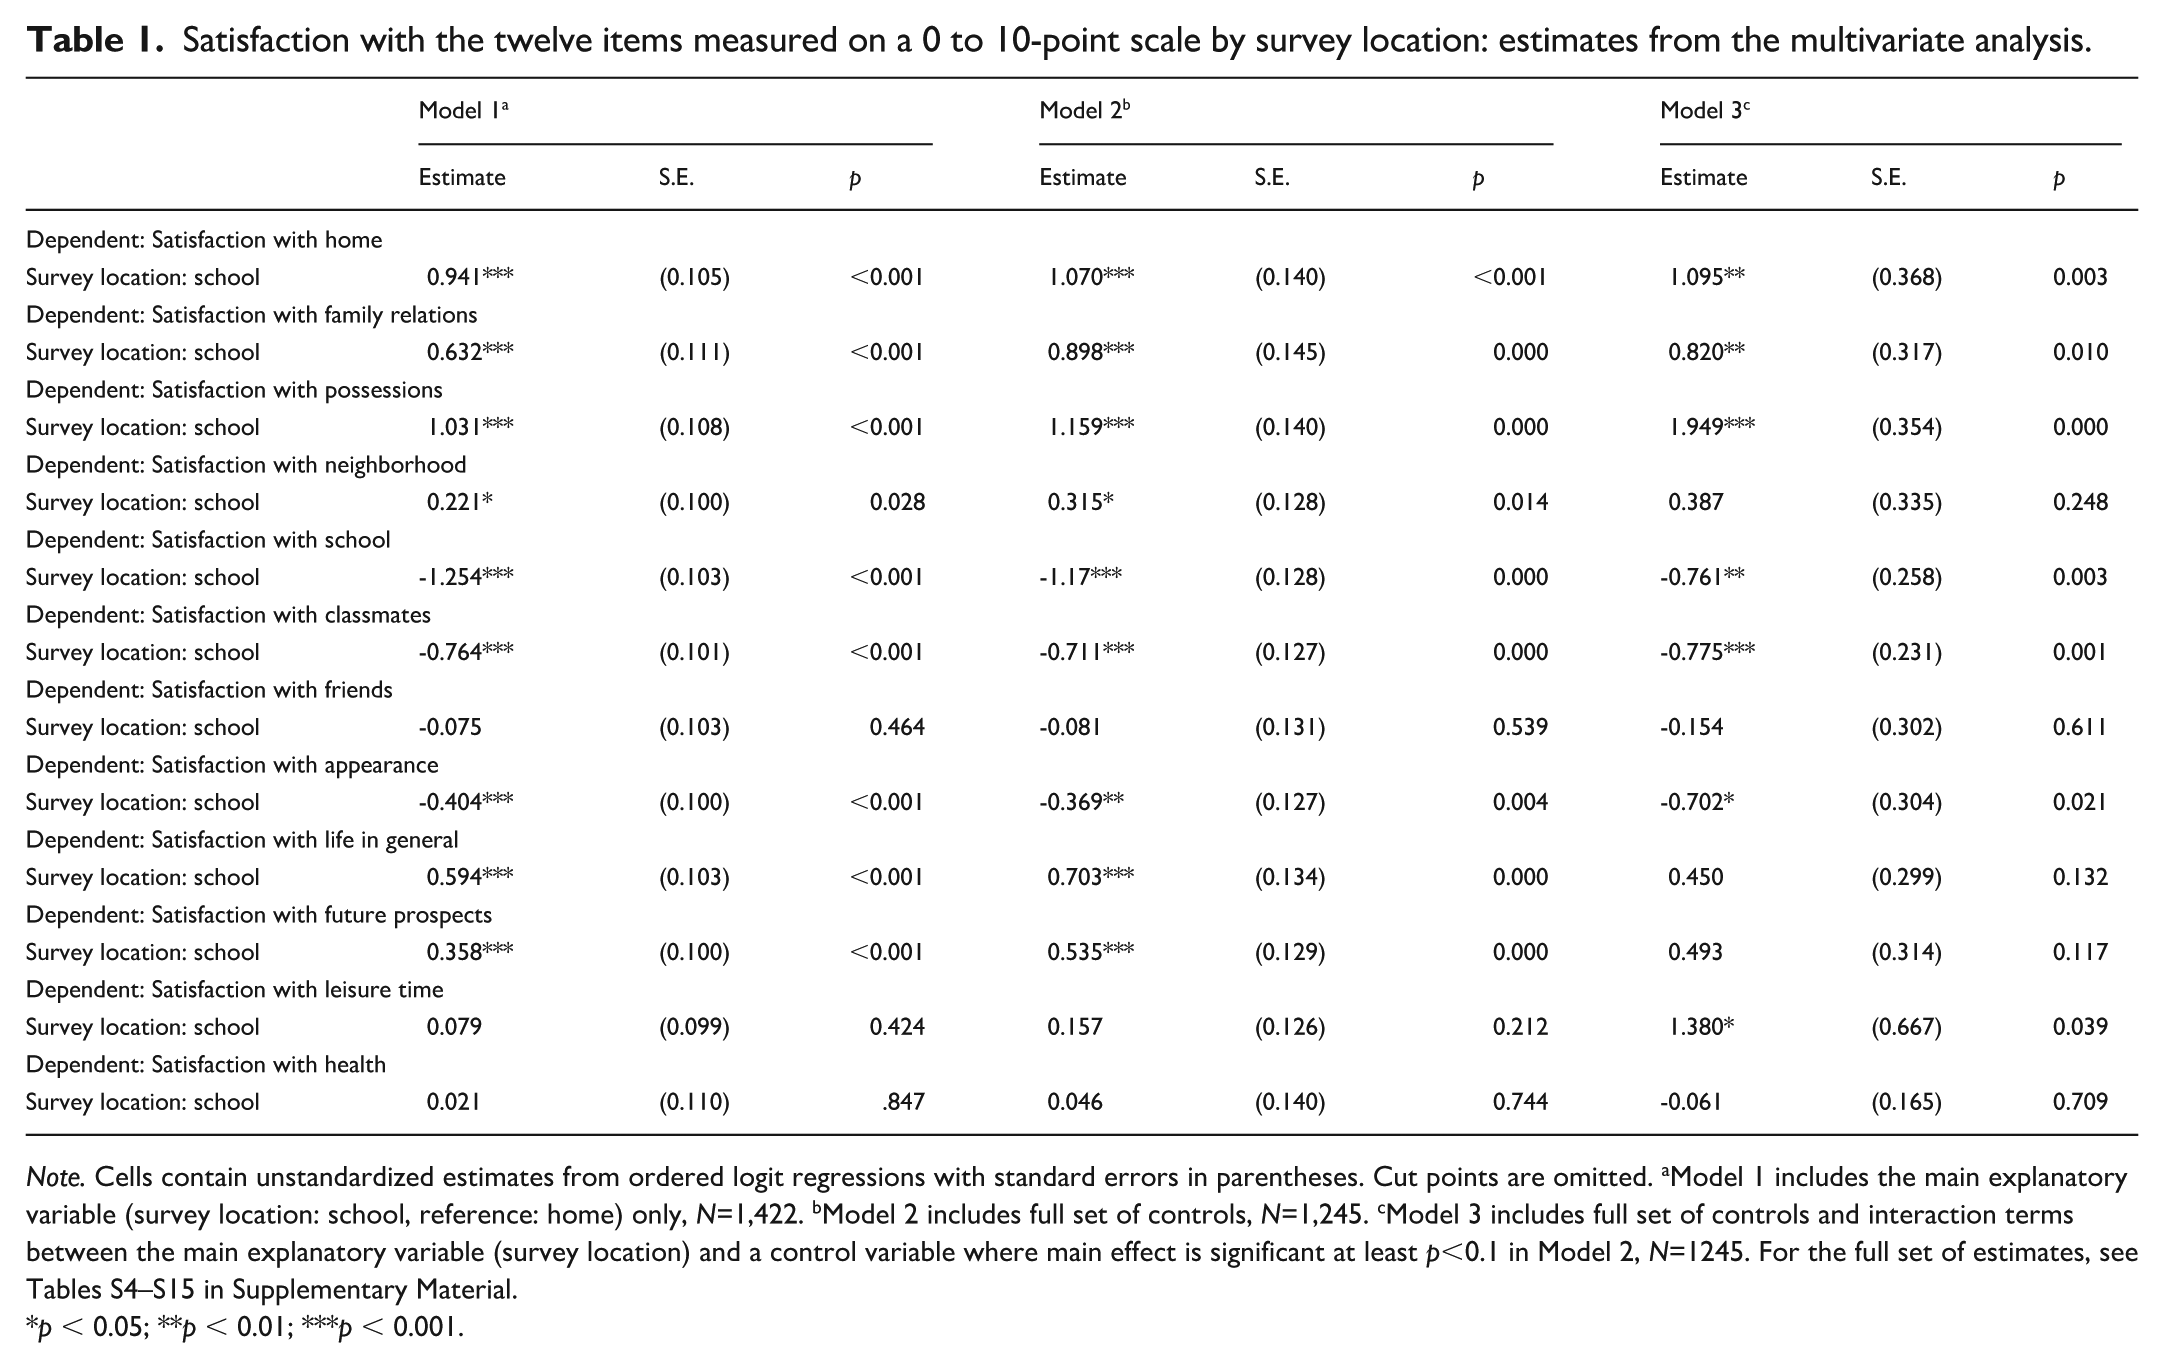
Note. Cells contain unstandardized estimates from ordered logit regressions with standard errors in parentheses. Cut points are omitted. aModel 1 includes the main explanatory variable (survey location: school, reference: home) only, N=1,422. bModel 2 includes full set of controls, N=1,245. cModel 3 includes full set of controls and interaction terms between the main explanatory variable (survey location) and a control variable where main effect is significant at least p<0.1 in Model 2, N=1245. For the full set of estimates, see Tables S4–S15 in Supplementary Material.
p < 0.05; **p < 0.01; ***p < 0.001.
Estimates from Model 1 largely confirm the descriptive results. Adolescents in the school survey have higher odds of being satisfied with home-set items as well as with life in general and future prospects, while home survey participants have higher odds of being satisfied with school, classmates and appearance (i.e., school-set items).
Inclusion of the control variables in Model 2 has an impact on effect sizes (that are greater in case of positive but smaller for negative estimates), but there is no change in the sign of the estimates and level of significance. In Model 3, the interaction terms modify the results to some extent. The main effect of the survey settings is no longer significant for satisfaction with neighborhood (p=0.248), life in general (p=0.132), and future prospects (p=0.117), but turns significant for satisfaction with leisure time (p=0.039), school survey participants being more satisfied. Otherwise, the main findings seem to be robust: settings of the school survey result in higher odds for being more satisfied with home (p=0.003), family relations (p=0.010), and possessions (p<0.001), while home survey settings result in higher odds for being more satisfied with school (p=0.003), classmates (p=0.001), and appearance (p=0.021).
Model 3 reveals some interactions between survey settings and demographics. The interaction terms between gender and survey settings are significant (p<0.1) for satisfaction with home (p=0.006), appearance (p<0.001), life in general (p<0.001), future prospects (p=0.018), and leisure time (p=0.012), increasing the already positive effect of school surveying for boys, except for appearance. In that case, the main effect is negative in Model 3, meaning that girls in the school survey are less satisfied with their appearance than in the home survey, while for boys, survey settings work in an opposite way. This interaction effect is a good example of how survey settings can affect a particular response on satisfaction, and its interpretation is elaborated in the discussion section.
Performance in school is the other control variable with quite many significant (p<0.1) interaction terms in relation to the following satisfaction items: home (p=0.048), family relations (p=0.044), possessions (p<0.001), life in general (p=0.077), leisure time (p<0.001) and school (p=0.004)—all of them have a negative sign. Moreover, interaction terms were significant between survey settings and household size of two persons and five or more persons in case of satisfaction with neighborhood (p=0.047) and with possessions (p=0.046), respectively. We discuss these interaction effects further in the final section of the article. Figures for all significant interaction terms are presented in the Supplementary Material (Figures S1–S13).
Discussion and Conclusion
The article investigated satisfaction of Hungarian adolescents aged 12–14 with a methodological focus. We used data of two harmonized cross-national surveys with 12 identical satisfaction items, measured on the same Likert scale, but with a variation regarding survey settings (school environment vs. home environment). We intended to explore differences in social desirability in relation to the variation in survey settings and topic specificity of the satisfaction items.
Our analysis uncovered significant differences by survey location and topic specificity also played a role in the variation by the two survey settings. However, the analysis produced surprising results, in contrast to our expectations. Hungarian adolescents interviewed at home are less satisfied with their home, family relationships, possessions, and neighborhood (and in the multivariate analysis also with leisure time, but no longer with neighborhood) than their counterparts surveyed at school. Similarly, adolescents in school survey are neither conformist, but rather more critical in their responses about school, classmates, and appearance than their home survey peers. It means that social desirability does not seem to play a decisive role in children’s responses, nor does it play a stronger role in the home survey than in the school survey, as we had expected relying on the results of Brener et al. (2006) or Camerini and Schultz (2018). Instead, the influence of survey settings on satisfaction has an interesting switch: A school environment makes children more satisfied with most home-related aspects, while a home environment makes them more satisfied with most school-related aspects. Apparently, our argument is indirectly supported, since social desirability is not measured as a variable.
Social desirability is a construct, whereby adolescents would answer the satisfaction questions in accordance with the norms (i.e., what they perceive as socially acceptable or favorable). Depending on the context, in a topic-specific way, they would be more satisfied with school items in the school survey and with home items in the home survey. Our empirical results, however, show just the opposite of what we expected: Hungarian adolescents were less satisfied with school conditions in the school survey and less satisfied with home conditions in the home survey. This leads us to interpret our results as an indication that social desirability does not prevail.
A possible explanation is that Hungarian adolescents seem to be influenced by the survey settings in such a way that they are more concerned with issues more strongly related to the survey location: the home situation in the home survey, the school conditions in the school survey, and therefore they are less satisfied with the related aspects of subjective well-being. This interpretation is in line with the previous experiences of Punch (2007) on how place of survey and importance of topic for adolescents are related.
The interaction effects provide further proof for this mechanism. Regarding satisfaction with appearance, girls view themselves more critically, and this attitude is more strongly reflected in the school context, where appearance is more important than in the home context. (See Figure S1 in the Supplementary Material.) Regarding academic achievement, higher grades increase satisfaction in general, and this effect is more pronounced in the home environment than in the school survey situation. For example, in the case of satisfaction with leisure time, when surveyed in the home context, adolescents with better academic achievement are more satisfied, perhaps because their less-performing counterparts must devote more time to their homework and studying at home. In school, however, higher achievers are more aware than in the home context that there is more learning and less leisure time behind their good performance, which might be reflected in their lower satisfaction scores at school than lower-performing students’ scores. (See Figure S6 in the Supplementary Material.)
Apparently, certain comprehensive aspects of satisfaction seem to be independent from the “rule” described above. Satisfaction with life in general, with future prospects, with friends, or with health are not affected by survey settings. Hence, we can argue that these aspects represent more stable indicators of adolescents’ satisfaction in Hungary, since they are less dependent on survey characteristics.
Further analyses of this article’s topic would certainly be useful. Here, we focused on the social environmental difference of the survey settings as well as on how topic sensitivity is related to desirability bias. The main shortcomings of this article are that we apply a single dummy variable for survey settings, and we cannot isolate the various elements of the differences in the two settings. At the same time, our literature review reveals that this limitation also applies to previous studies. Thus, to reinforce our main argument regarding the persuasive role of topic specificity, we relied on the results derived from particular interaction terms. We intended to prove the presence of another mechanism: The more you are affected by an issue (home affairs at home or school affairs at school), the more critically you think about it and this result shades the findings of previous studies on social desirability.
An additional empirical indicator, item nonresponse, is also relevant to our research question on social desirability bias. In our case, item nonresponse was greater for the school survey; it can be either a cognitive issue in case of the self-administered survey (Borgers and Hox 2001; Haunberger 2014), but it can also be a sign of adolescents’ sensitivity to certain topics (Yan 2021). The limitation of our study is that we cannot distinguish between these two possibilities.
Future studies on adolescents’ attitudes toward their life circumstances should consider our results on satisfaction items that are less sensitive or otherwise sensitive to survey effects in terms of topic specific social desirability when looking for more reliable indicators of child satisfaction with broader relevance. Despite its limitations, we believe that the results of this analysis provide an interesting methodological insight into two different surveys, drawing attention to relevant issues to be considered when examining adolescents’ life satisfaction, and thus enriching the literature on the subject.
Supplemental Material
sj-docx-1-fmx-10.1177_1525822X241305974 – Supplemental material for Satisfaction of Adolescents Aged 12–14: The Effect of How They Were Surveyed?
Supplemental material, sj-docx-1-fmx-10.1177_1525822X241305974 for Satisfaction of Adolescents Aged 12–14: The Effect of How They Were Surveyed? by Péter Róbert and Borbála Júlia Szczuka in Field Methods
Footnotes
Acknowledgements
Péter Róbert was a Senior Core Fellow of Institute for Advanced Studies, CEU, between October 2019 and June 2020 in the period in the initiating phase of this project.
Ethical Considerations
The authors declare no harm of any ethical rules and principles regarding research design and practices. The surveys were conducted with respect for voluntary participation, anonymity, and confidentiality. This applies especially to parental permission, given that the respondents were aged 12–14. Both surveys followed the ethical requirements set by the funding agencies.
Funding
The authors disclosed receipt of the following financial support for the research, authorship, and/or publication of this article: Data used for this analysis have been prepared with the financial support of the Hungarian National Research Development and Innovation Office in the framework of two projects: “Children in school: Well-being and beyond,” principal investigator: Péter Róbert, Grant number: NN125715; and “Race against time,” principal investigator: Beáta Nagy, Grant number: K120086.
Declaration of Conflicting Interests
The authors declared no potential conflicts of interest with respect to the research, authorship, and/or publication of this article.
Supplemental Material
Supplemental material for this article is available online.
References
Supplementary Material
Please find the following supplemental material available below.
For Open Access articles published under a Creative Commons License, all supplemental material carries the same license as the article it is associated with.
For non-Open Access articles published, all supplemental material carries a non-exclusive license, and permission requests for re-use of supplemental material or any part of supplemental material shall be sent directly to the copyright owner as specified in the copyright notice associated with the article.