
Abstract
Mostly in web surveys, attention checks have been proposed to identify inattentive respondents in self-administered surveys as previous research has argued that low-quality answers may introduce severe biases in data analyses. The increasing popularity of mixing survey modes for conducting probability-based surveys amplifies the need for systematic research on the implementation of attention checks in these survey designs. Our study investigates whether an instructed response item (IRI) can be an adequate predictor of response quality in a self-administered mixed-mode panel survey with a probability-based German general population sample. By doing so, we compare the results of the attention check with those of other response quality indicators. However, while the results for the online respondents were somewhat promising, the mail respondents result suggests that this response quality indicator seems unreliable, so that we cannot recommend using IRIs in general population mixed-mode surveys, which include a mail option.
Introduction
The strong increase of web-based data collection since the late 1990s (Couper 2000; Couper and Peterson 2017; Daikeler et al. 2020) and the resurgence of mail surveys in mixed-mode designs (Luijkx et al. 2021) have led survey researchers to focus their attention on response quality in self-administered survey data collections (Roßmann and Silber 2020). In this regard, some authors have argued that the response quality in self-administered surveys might suffer due to respondents who inattentively answer questions as no interviewer is present who can motivate and guide them through the interview (e.g., Callegaro et al. 2015:17).
In web-based surveys, attention checks such as instructional manipulation checks (IMC) (e.g., Oppenheimer et al. 2009), bogus items (e.g., Meade and Craig 2012), or instructed response items (IRI) (e.g., Gummer et al. 2021) have been developed to detect respondents, who do not devote their full attention and effort to answering questions (see Shamon and Berning 2020).
Even though methodological research on the application of attention checks (e.g., Anduiza and Galais 2017) and the relationship between inattentiveness and response quality (e.g., Gummer et al. 2021) is increasing, important research gaps remain.
First, to the best of our knowledge, no study has investigated the implementation of attention checks in probability-based mixed-mode surveys that combine a web and a mail mode. Even though nonprobability samples have become widespread, probability-based samples are still considered the gold standard for social science surveys (Cornesse et al. 2020). Second, mailed paper-based questionnaires are often used as a survey mode complementing web-based questionnaires when surveying the general population (e.g., Luijkx et al. 2021). The rationale behind mixing both modes is that there is still a sizable proportion of people who are unable or unwilling to participate in web surveys. This research gap is most evident when considering that several large-scale surveys, which rely on a mix of web and mail modes, report fairly large shares of respondents who participate via the mail mode. For example, the German GESIS Panel reported 33% mail respondents in 2018 (Bretschi et al. 2021) and in the German part of the European Value Survey (EVS) from 2017/2018 that was conducted as self-administered mixed-mode survey (mail and web), between 49% and 84% of the respondents chose the mail mode depending on the mode choice sequence (Gummer et al. 2022). Luijkx et al. (2021) reported further significant shares of mail respondents among four out of five other countries that employed mixed-mode designs in the 2017/2018 round of the EVS. And, finally, for the newly established FReDA panel surveying persons aged 19–49 in Germany, 47% answered by mail when a concurrent mode choice sequence was offered (Christmann et al. 2024).
Initially, we intended to investigate whether a failed IRI attention check is an adequate predictor for low response quality in a probabilistic mixed-mode (mail and online) panel of the general population in Germany. That is, whether respondents with an IRI failed attention check are also more likely to show other adverse response behaviors, such as straightlining in item batteries, item nonresponse, and low survey evaluation ratings.
To address this research question in a controlled setting, we randomly assigned one-third of the respondents in each mode to the control group that did not receive an IRI attention check item, whereas two-thirds of the respondents received an IRI attention check. When pursuing the research question, we found, however, that in the mail mode, 44.9% of the respondents did not pass the IRI attention check, while only 24.5% failed it in the online mode.
This strong mode differences did not disappear even after applying weights controlling for mode and selection effects. Thus, we suspect that the comparatively high incidence of failed IRI attention checks in the mail mode resulted from a more pronounced tendency to not comply with the instructions among respondents in the mail than in the web mode (see Silber et al. 2022). Therefore, we investigated this suspicious mail mode behavior in detail. In doing so, we found that neither grid item nonresponse nor item-differentiations can explain the high mail mode IRI attention check failing rates nor can the IRI serve as an indicator to predict (overall) response quality. However, we did not detect any negative repercussions of implementing an IRI attention check on the respondents' survey experience in the mail or online mode.
Previous Research on the Implementation of Attention Checks
When reviewing previous research on attention checks, the large variation in the share of respondents who failed attention checks across published studies quickly becomes apparent. For example, Curran (2016) reported in his review that the percentage of careless or insufficient effort responders ranged between 1% and 30% in psychological studies, with a modal rate of 8%–12%. Some studies in our own literature review have reported even higher shares of more than 80% of the respondents failing attention checks. In Online Appendix Table A1, we give an overview of the reported share of respondents who failed attention checks in a selection of studies.
From a methodological point of view, the large variation in failure rates should be attributable to various features of these studies: (1) the sampling method (probability-based sampling vs. non-probabilistic selection methods such as applying quotas in volunteer opt-in web panels); (2) the mode of data collection (e.g., web, mail); (3) aspects of the survey design (e.g., cross-sectional vs. panel designs); (4) the type of attention check used (e.g., instructional manipulation checks, bogus items, or instructed response items); (5) the number and placement of attention checks in a questionnaire; (6) the framing of the attention check question (i.e., the wording of the question/instruction); (7) the topic of the respective survey; (8) the sponsor of the survey; or (9) the national or cultural context in which the data collection took place.
Research on other modes than web and samples that rely on probabilistic sampling approaches are especially sparse (see Online Appendix Table A1). Comparing respondent inattentiveness between both self-administered data collection modes was so far only approached in one study by Magraw-Mickelson et al. (2019). These authors compared mode-related inattentiveness across three convenience samples (workers and students from China and Germany), but no clear conclusions emerged. In one of their samples, the web respondents had more failed attention checks, whereas in a second sample the mail respondents had a higher failure rate. In the third sample, they found no differences between modes. With the notable exceptions of Gummer et al. (2021) and Morren and Paas (2020), both web-only, the vast majority of the literature on attention check questions reports results from analyses of non-probabilistic samples such as convenience samples from student populations (e.g., Magraw-Mickelson et al. 2019), MTurk workers (e.g., Hauser and Schwarz 2015), or volunteer opt-in web panels (e.g., Shamon and Berning 2020; Ternovski and Orr 2022). Comparing across sampling methods, Gummer et al. (2021) reported fewer failures to attention checks in a probability-based sample than in non-probability samples, but notably all three studies (Gummer et al. 2021; Magraw-Mickelson et al. 2019; Morren and Paas 2020) were implemented in web surveys.
Data and Method
The GESIS Panel
The data for our study came from the GESIS Panel (GESIS 2018), a probability-based mixed-mode panel of the general population between 18 and 70 years in Germany (Bošnjak et al. 2017). 1 The 2013 recruitment survey reached an AAPOR Response Rate 5 (RR5, Smith et al. 2015) of 38.6%, and 4,888 panelists joined the panel that went fully operational in 2014. We refer to this sample as the “initial sample.” A refreshment sample was drawn as part of the German General Social Survey (ALLBUS) in 2016. The ALLBUS achieved a RR5 of 34.8%, and 1,710 respondents joined the GESIS Panel. We refer to this sample as the “refreshment sample.” As part of the recruitment interviews of both samples, the mode for re-interviews was decided. 2 The web mode was offered to Internet-using respondents as the default option for participation. However, respondents who refused to complete questionnaires on the web were allowed to opt for the mail mode.
In the present study, we rely on data from Wave “ed,” the fourth of six waves in 2017, which was fielded from August to October 2017. All 4,777 active panelists were invited to participate in Wave “ed” (initial sample = 3,287; refreshment sample = 1,490) of which 4,257 completed the questionnaire (initial sample = 2,976; refreshment sample = 1,281), yielding a completion rate of 91.2% for the initial and 86.8% for the refreshment sample. Of the respondents who completed Wave “ed,” 33.1% participated via mailed questionnaires and 67.2% via the web (initial sample = 68.1%; refreshment sample = 65.3%).
Experimental Setup
Respondents in Wave “ed” were randomly assigned to two groups. Two-thirds of the respondents in the web and mail mode (66.4%) were presented a grid question with nine items, including an additional IRI attention check that instructed respondents to select a specific response option “Please select here the answer option ‘disagree’” (see Figure 1). The grid was placed as Question 24 of 30. Acting as a control group, the remaining third of the respondents (33.6%), received the same grid without the IRI attention check item (see Figure 1 for the translated survey question). Grid with instructed response item (translated from German).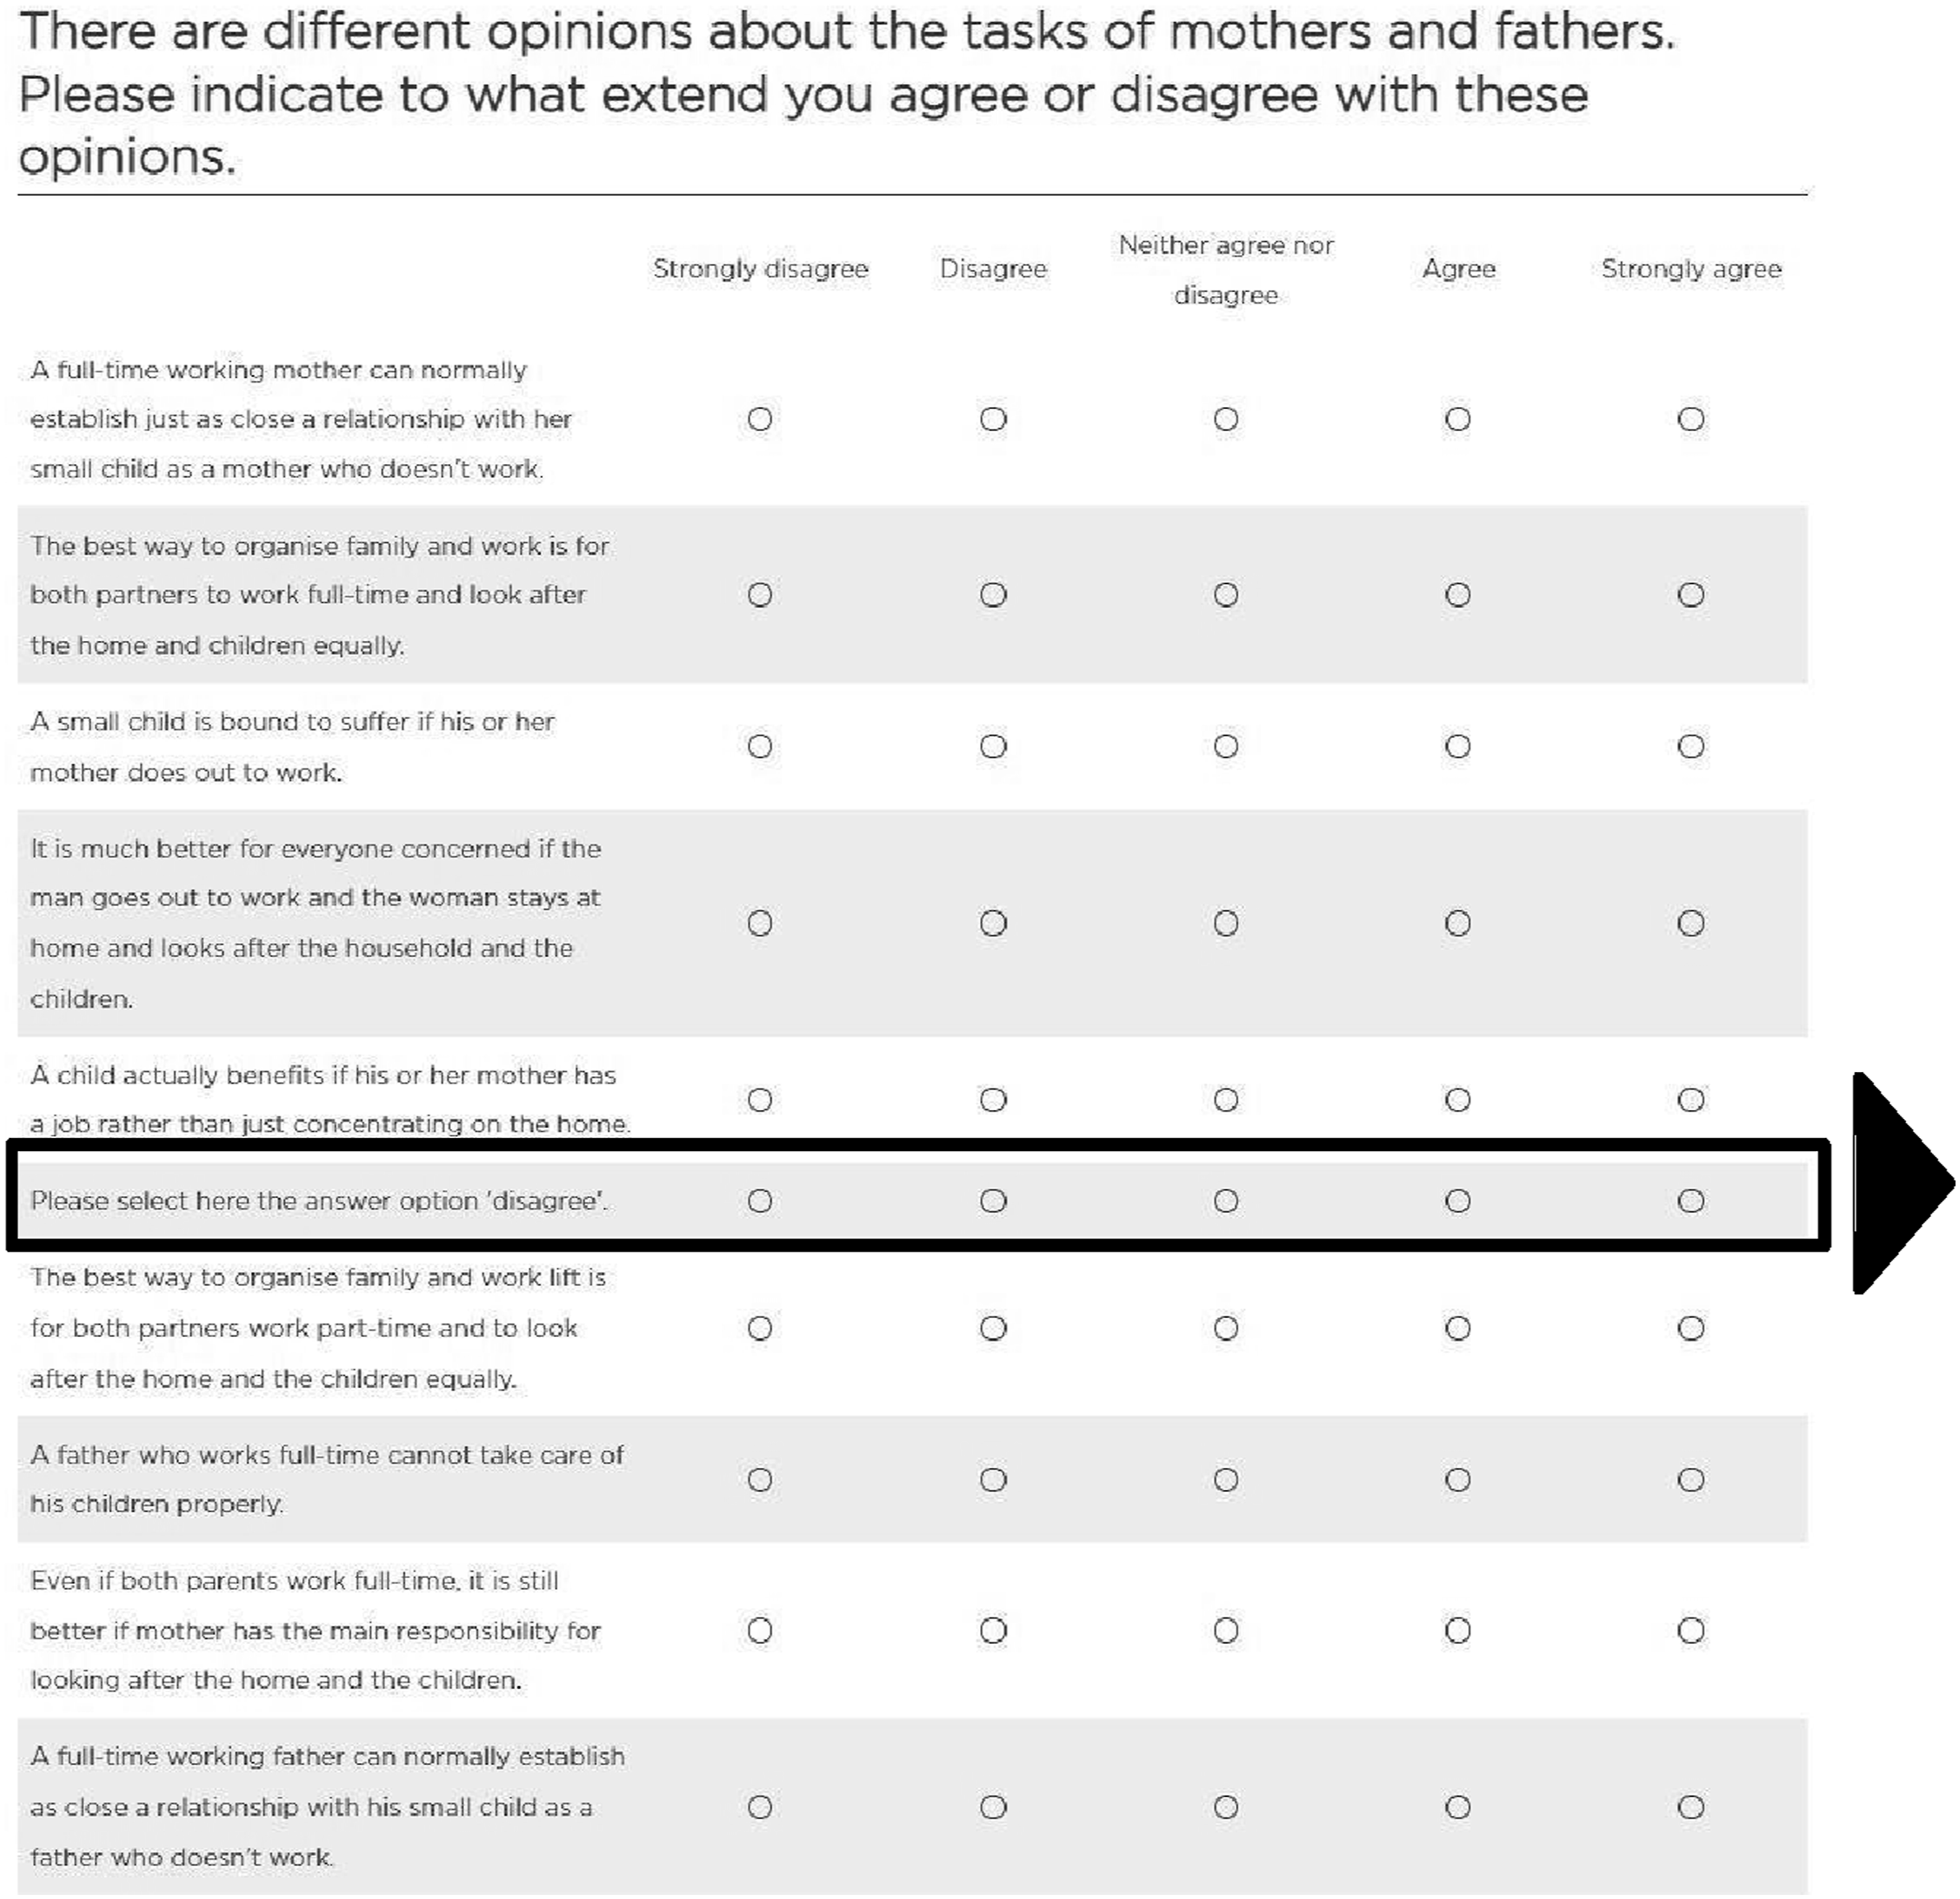
To investigate our research question whether attention checks serve as a predictor for response quality, we applied a threefold approach to measure response quality by investigating whether a failed attention check can predict more item nonresponse in grids, non-differentiated response behavior (e.g., Krosnick 1991), and a worse survey evaluation. In addition, we used the first two indicators for a deepened analysis to investigate whether observed differences in failure rates could be attributed to individual or mode-specific differences in item nonresponses or non-differentiated response patterns.
Item nonresponse was defined as leaving the attention check item blank. Non-differentiation was defined as giving the same answer to at least three 3 items of the grid question. We also explored the repercussions of implementing an IRI attention check on the respondents’ survey experience through an additive index of six survey evaluation items (see Table A.8 for an overview). Analyzing open-ended comments provided at the end of the questionnaire offered additional insights.
Controlling for Self-selection into Mode and Attrition
Since respondents were not randomly assigned to their mode of participation, selection effects may cause respondents of both modes to differ in characteristics that are related to their ability and motivation for attentive responding (Schouten et al. 2013). In addition, panel surveys suffer from attrition of their members (Lynn 2009). If the dropout is systematic for specific subgroups, attrition might bias estimates of population parameters. After detecting the prevalent mode differences in failed attention checks, we used a weighting approach to account for the self-selection into mode and attrition to investigate whether the mode differences are still prevalent after correcting for these two error mechanisms. Specifically, we utilized a propensity score weighting approach, employing a tree-based machine learning model (e.g., Buskirk and Kolenikov 2015; Lee et al. 2010) to estimate respondents' propensity to complete the survey in either web or mail mode, as well as their propensity to attrite from the sample (see Online Appendix “(1) Weighting Approach” for more information).
Results
Outcomes of the Attention Check across Survey Modes
Outcome of the Attention Check by Mode (Unweighted and Weighted).
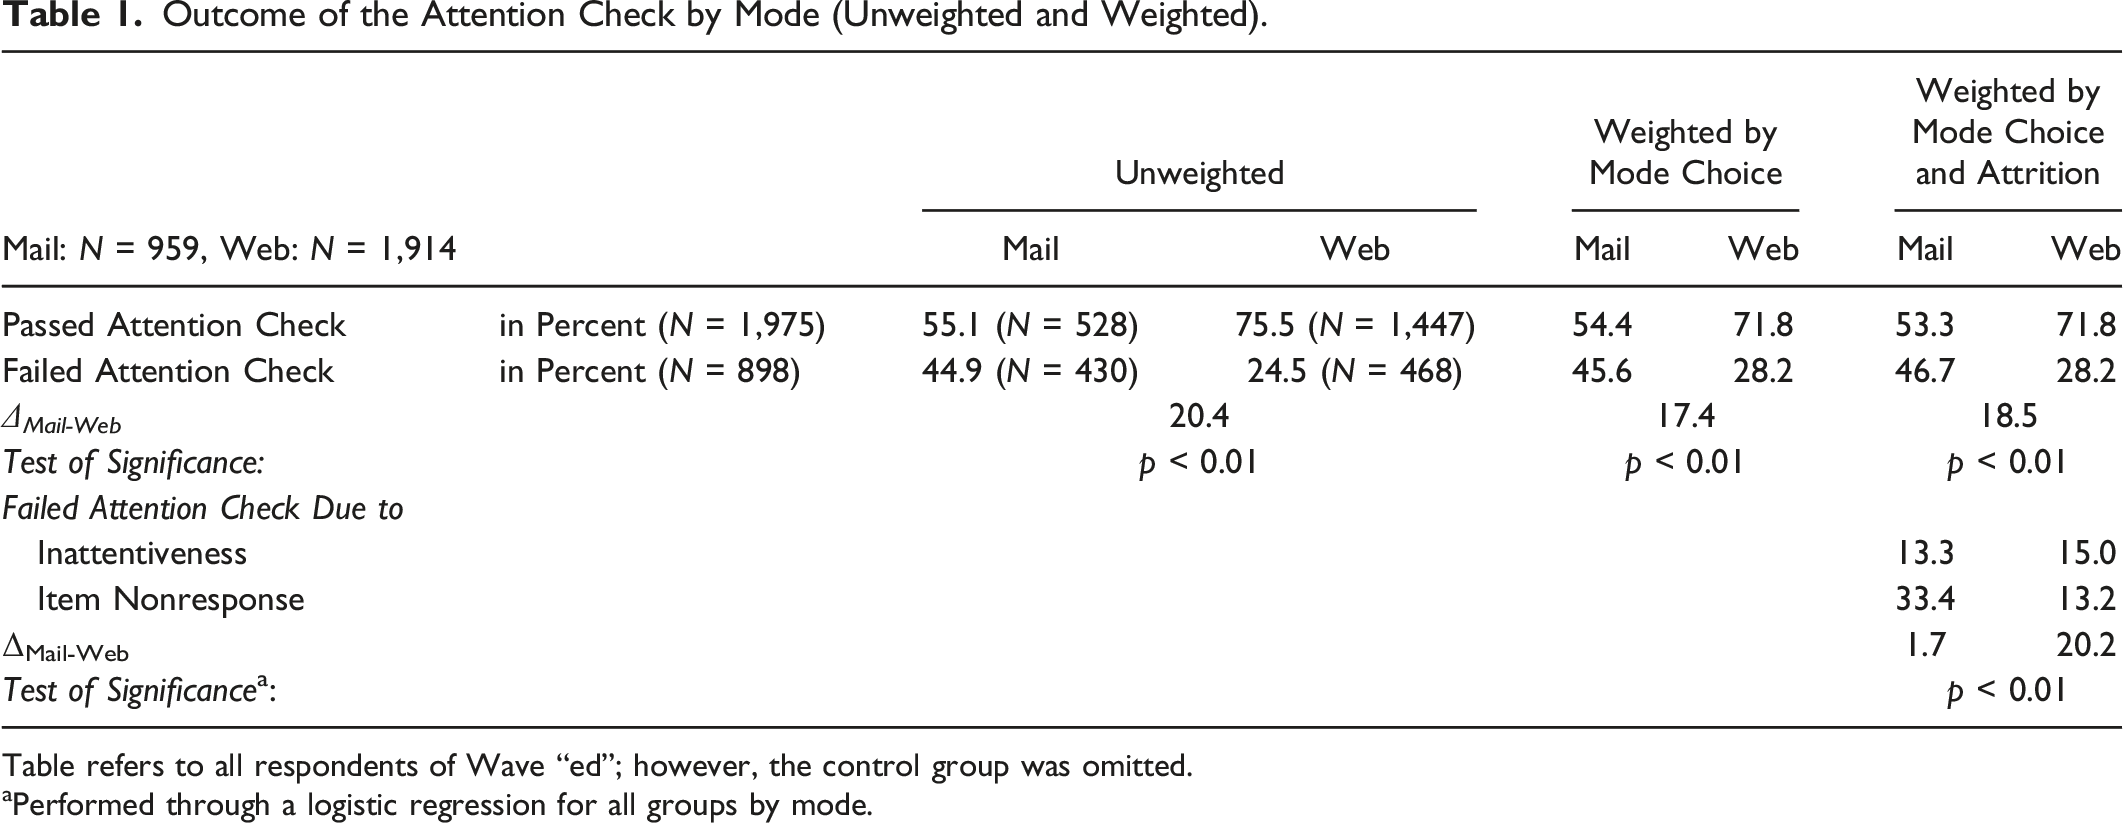
Table refers to all respondents of Wave “ed”; however, the control group was omitted.
aPerformed through a logistic regression for all groups by mode.
Exploring Reasons for the Differences in Attention Check Outcomes across Survey Modes
Following up on our prior analyses, we identified two different routes of how respondents behaved that resulted in failing the attention check. Respondents either (1) checked another but incorrect substantive answer, or (2) left the attention check item blank (i.e., item nonresponse). Table 1 (lower part) depicts the occurrence of these two response behaviors by survey mode. While the percentage of incorrect substantive answers was comparable across modes with 13.3% (mail) and 15.0% (web), we observed a considerable difference between the two modes with respect to item nonresponse. In the web mode, a total of 13.2% of respondents did not respond to the IRI attention check item, whereas it was 33.4% in the mail mode. So more than twice as many respondents did not answer the IRI attention check item in the mail mode compared to the web mode, which is an unexpectedly large difference.
Failed Attention Checks and Item Nonresponse
Next, we investigated whether this finding of different item nonresponse levels between both modes is attributable to whether respondents omitted their answers to the entire grid in which the attention check was placed. Put differently, if the mail respondents omitted only the IRI attention check item, this might indicate that they were indeed attentive but were either unsure how to deal with the IRI attention check item or may have refused intentionally to answer it. If, however, the entire grid was omitted, the relatively high attention failure rate in the mail mode would likely be due to higher mode-related item nonresponse rates. Furthermore, we compared the item nonresponse behavior of respondents for the grid, which included the IRI attention check with the item nonresponse rates of the control group of both modes as well as with a previous grid in this questionnaire to rule out that using an attention check caused differences in the grid in which it was placed.
We first compared the propensity for nonresponse to the entire grid for the mail respondents who received the IRI attention check item with the control group who did not receive the attention check item. The results showed that the mail respondents who received the IRI attention check item had the same probability of skipping the whole grid than the control group (ρexp = 0.04 vs. ρcrl = 0.04, t = −0.94, p = 0.34) (see Online Appendix Table A3). Also, there was no difference for the web respondents, both when comparing respondents between web treatment and web control group (ρexp = 0.04 vs. ρcrl = 0.05, t = −0.50, p = 0.61), and when comparing respondents of both modes (ρexp = 0.04 vs. ρcrl = 0.05, t = −0.50, p = 0.61).
To further rule out that a generally higher level of item nonresponse in the mail mode caused the mode differences, we considered the item nonresponse behavior in a previous grid. Specifically, we explored whether the predicted probabilities of item nonresponse in the previous grid were related to the outcome of the attention check item. The previous grid question consisted of 12 items on willpower (for screenshots of the questions see Online Appendix Figure A2) with a five-point, fully labeled Likert scale ranging from “strongly agree” to “strongly disagree”. On average, 0.18 items per person suffered from item nonresponse. That is, 0.17 items in web and 0.18 items in mail mode were affected (t = −1.79, p = 0.08) (see Online Appendix Table A4). Even though further analyses did not yield significance, they indicated that web respondents were 22% more likely to not complete the IRI attention check when they provided item nonresponse in the previous grid compared to mail respondents (t = 0.11, p = 0.91, N = 2,876). Thus, we conclude that item nonresponse in IRI attention checks relates to the IRI item itself and not to the entire grid nor to generally higher item nonresponse in the mail mode.
Failed Attention Checks and Non-differentiation
Next, we set out to verify whether failing the attention check could be attributed to non-differentiated response behavior and vice versa—whether individuals who tend to fail the attention check were more likely to show non-differentiated response behavior in grid questions so that failed IRI attention checks could predict non-differentiated response behavior. Response non-differentiation was shown by 1.3% (N = 55) of the respondents in our sample, of whom 55% (N = 30) also failed the attention check (t = −6.94, p < 0.01). In its magnitude, non-differentiation was not a relevant behavior we observed in the respective grid. Although the attention check detected a majority of respondents who straightlined and thus engaged in inattentive responding, the detection rate was only barely higher than a coin toss (see Online Appendix Table A5). Moreover, we did not find a difference in straightlining and its detection rate when comparing the mail with the web mode (t = −0.58, p = 0.56).
Further, as not all the items had the same semantic polarity, we analyzed the internal consistency of the scale by computing Cronbach’ alpha (see Online Appendix Table A6). However, we did not find consistent and relevant indication of differences in internal consistency regarding mode or receiving an attention check. Only in the control condition did we find a small difference in internal scale consistency between the modes, indicating lower scale consistency in the web condition (αmail = 0.84 vs. αweb = 0.80, F = 1.26, p = 0.00).
Attention Checks and Survey Experience
We also tested whether an attention check had consequences for the survey experience. Again, we paid special attention to mail respondents with the intention to better understand their conspicuous behavior. Regarding negative consequences of including an attention check, we found no differences in the evaluations of the survey when comparing the experimental group that received the attention check to the control group (see Online Appendix Table A7), which did not receive the IRI. However, we found a slightly more positive survey assessment for respondents in the web than in the mail mode (mweb = 0.71 vs. mmail = 0.69, t = −2.23, p = 0.03). Applying our weighting approach did not yield different results for both analyses (experimental vs. control group: t = 0.20, p < 0.84; mail vs. web: t = −2.23, p = 0.02). Thus, we did not identify any negative repercussions of implementing an IRI attention check on respondents’ survey experience.
In addition, we considered the comments every respondent could provide at the end of the survey in an open-ended question. In total, we received 30 comments mostly in mail mode regarding the attention check item, which was 8% of all 360 comments given by respondents. Most respondents wondered about the reason for the question or expressed comprehension problems (N = 23). Two respondents asked for an explanation, two stated that they did not want to answer the question, and two appreciated the idea. Due to the low case numbers, these findings remain anecdotal evidence. However, the result that 8% of all comments addressed the attention check item seems to indicate that at least some respondents in the sample were not familiar with the concept of these checks or were surprised to receive them.
Discussion
Summary of Results
In the present study, we investigated whether a failed attention check could serve as a response quality predictor across self-administered survey modes in a probability-based mixed-mode study. However, we found a high rate of failed IRI attentions checks among respondents: 46.7% of the respondents in the mail mode and 28.2% in the web mode (weighted results) failed the attention check. When examining these findings more closely, we found that a strikingly large proportion of respondents failed the IRI attention check due to not answering this item. This pattern was particularly evident in the mail mode, where 33.4% of the respondents did not respond compared to 13.2% in the web mode.
In supplemental analyses, we further investigated the reasons for the high item-nonresponse in the mail mode. However, the pattern of high item-nonresponse to the IRI did not appear to be the result of a generally higher level of item nonresponse in the mail compared to the web mode nor did respondents who did not answer the IRI attention check show elevated item nonresponse rates in the remainder of the survey. These results suggest that not answering the IRI attention check correctly is likely not due to mail respondents’ higher inattention, but to their lack of understanding or reluctance to answer the question. The lack of negative consequences of including the IRI also generalizes to the web mode, as item nonresponse and non-differentiated response behavior did not interact with failing an attention check for web respondents.
While we did not find any direct indication that providing respondents with IRI attention checks negatively affected their survey experience, our results raise concerns about whether attention checks work properly in probability-based surveys that employ a mail mode. Our findings resonate well with those of the study by Silber et al. (2022) that found that although many web respondents understood why attention checks were conducted, a significant proportion thought they were controlling or irritating. Importantly, while most respondents in their study passed the attention check, 61% of those failing appeared to have done so on purpose. As the respondents in our probability-based mixed-mode panel survey had previously not been exposed to attention checks within the panel, we suggest that noncompliance with the instructions provides a compelling explanation for the moderately high failure rate across both self-administered modes.
Beyond that, our study revealed serious challenges regarding the implementation of IRI attention checks in the mail mode. At this point, we can only speculate about the underlying causes of the observed pattern of higher item nonresponse to the IRI attention check in this mode. Yet it seems plausible that IRI attention checks in certain respects resemble often-used bot or captcha tests on the Internet, and, thus, might seem more familiar and less irritating when answered on an electronic device compared to a paper questionnaire. Moreover, while both self-administered modes lack the involvement of an interviewer, in the mail mode this lack of support is even more “obvious” (e.g., Meade and Craig 2012). On the web, respondents are accustomed to being controlled by automatic prompts (e.g., when filling out web forms), whereas mail respondents likely feel less or not controlled when filling in a questionnaire in their private environment. Consequently, mail respondents may be less familiar with attention checks than web respondents, so they are more likely to skip the question entirely.
Recommendations and Cautionary Notes
Drawing on our results, we provide practical recommendations as well as cautionary notes for practitioners who consider implementing attention checks in mixed-mode surveys. First, researchers should be cautious regarding the implementation of IRI attention checks in probability-based surveys. In both modes, survey respondents seemed not to be familiar with the requests, which resulted in overall high item nonresponse rates.
Second, researchers who intend to implement an attention check in a mixed-mode survey should strongly consider carefully optimizing it for each mode. While having (slightly) different versions may endanger comparability across modes, our study showed that adjustments are necessary because respondents’ expectations and willingness to follow instructions of attention checks differs across modes.
Third, researchers should be aware that respondents may fail attention checks because they deliberately decide not to comply with the instructions. This could result in high item nonresponse rates like in our sample or in respondents intentionally selecting an incorrect answer category. Because of possible false positives, respondents who do not pass an attention check should only be excluded from substantive analyses if additional indicators (e.g., indicators of non-differentiated responses or speeding) also suggest that low quality responses were provided.
Fourth, respondents’ trust in the researcher and research ethics should be considered when implementing attention checks. On the one hand, attention checks can help detect low quality responses. On the other hand, the use of attention checks may impair a trusting relationship with researchers and fuel distancing from surveys in times of poor and declining survey climate. Thus, attention checks may impose emotional harm and inadequate burden, and should thus be considered a matter of ethical legitimacy.
Limitations
This study is not without limitations and yields further research opportunities. First, as we rely on respondents from a mixed-mode survey, respondents' willingness to comply with instructions may differ between modes. Frequent Internet users are most likely familiar with following instructions to reach their objective (e.g., consent statements on web pages, mandatory prompts in online forms). Likewise, it can be assumed that the mail respondents tend to decide against web-based options in other areas of their lives as well (e.g., tax declaration, public authority concerns), so they might be not used to this type of inquiry and mandatory input requests. However, to minimize the self-selection effect, we used a weighting approach to adjust for self-selection bias into one of the modes.
Second, we used data from a German panel survey. Previous research has shown that survey outcomes and the outcomes of design decisions vary between countries (e.g., Daikeler et al. 2021; Luijkx et al. 2021). Replicating our analyses for different countries, preferably in a cross-national study, could help test whether our findings generalize beyond Germany.
Third, we focused on the feasibility of implementing IRI attention checks in a probability-based, self-administered mixed-mode survey. Given our results, we see value in future studies comparing the use of attention checks across probability and non-probability samples.
Fourth, less than 10% of the sample finished the questionnaire with their smartphones; future research might take up this road of investigation and examine whether attention checks lead to similar results in smartphone surveys.
Fifth and last, we used an IRI attention check as it could be easily implemented in the mail mode and fitted the questionnaire of the panel well. However, we acknowledge that a diversity of different attention checks exists that will likely differ in how well they work in mixed-mode survey settings.
Footnotes
Declaration of Conflicting Interests
The author(s) declared no potential conflicts of interest with respect to the research, authorship, and/or publication of this article.
Funding
The author(s) received no financial support for the research, authorship, and/or publication of this article.
Correction (January 2025):
Article updated to correct the response quality indicator from “reliable” to “unreliable” for mail respondents in the abstract.
Supplemental Material
Supplemental material for this article is available online.
Notes
References
Supplementary Material
Please find the following supplemental material available below.
For Open Access articles published under a Creative Commons License, all supplemental material carries the same license as the article it is associated with.
For non-Open Access articles published, all supplemental material carries a non-exclusive license, and permission requests for re-use of supplemental material or any part of supplemental material shall be sent directly to the copyright owner as specified in the copyright notice associated with the article.