Abstract
In this study, we explored psychometric network analysis (PNA) as an alternative method for identifying item wording effects in self-report instruments. We examined the functioning of negatively worded items in the network structures of two math-related scales from the 2019 Trends in International Mathematics and Science Study (TIMSS); Students Like Learning in Mathematics (SLLM); and Students Confident in Mathematics (SCM). We also explored how the negatively worded items functioned in network structures across demographic subgroups. Data were drawn from eight countries that represented diverse levels of math performance and cultural attitudes toward school (n = 75,972). We found that negatively worded items were distinct from the positively worded items in the SLLM and SCM item networks, and that this effect was consistent across all age- and country-level subgroups. Based on these findings, we recommend PNA as a data-driven approach for detecting wording effects effectively.
Many self-report measures, such as psychological scales and surveys, contain negatively worded (NW) items through negations (e.g., no, not, none, and never) and negative connotations (e.g., bad, boring, unpleasant, and fearful). These items are phrased to reverse the polarity of a response scale, such that high endorsement represents low levels of the psychological trait. NW items are typically intended as “speed bumps” to encourage respondents to answer more carefully (e.g., Podsakoff et al. 2003). They may also help eliminate positive response bias (e.g., Hinz et al. 2007) and provide better domain coverage of the target trait (Weijters and Baumgartner 2012).
Despite the benefits of including NW items in self-report measures, such items may also lead to unintended measurement issues. Respondents tend to endorse less extreme response categories in NW items (e.g., Weems et al. 2006; Yang et al. 2012), suggesting that they interpret negative statements differently (Weems et al. 2006). Additionally, individuals at the midlevel of the target latent trait may tend to disagree with positively worded and NW items (Kam and Meyer 2023; Kam et al. 2021). As such, NW items can result in a misalignment of the response categories and decrease internal consistency (e.g., Roszkowski and Soven 2010; Zeng et al. 2020). NW items can also impact the factor structure of a scale, either by forming a different construct than was theorized or otherwise distorting it (DiStefano and Motl 2006; Kam and Meyer 2015; Weijters and Baumgartner 2012). These impacts of NW items on the psychometric quality of self-report measures are referred to as item wording effects. Notably, the severity of item wording effects depends on respondent characteristics such as age (Bulut and Bulut 2022; Michaelides 2019; Yang et al. 2012), race (Lindwall et al. 2012; Michaelides 2019; Yang et al. 2012), reading abilities (Bolt et al. 2020; Bulut 2021; Gnambs and Schroeders 2020; Michaelides 2019; Weems et al. 2006), and education level (Bolt et al. 2020).
For self-report instruments with an empirically validated factor structure, item wording effects can be detected using factor analytic methods (e.g., confirmatory factor analysis [CFA] and exploratory item factor analysis [IFA; Bock et al. 1988]) and other methods based on item response theory (IRT). In CFA models, NW items are modeled as a separate factor distinct from the theoretical factor structure. The rationale is that if item wording effects are present, models with a separate factor for NW items will outperform the theoretical model assuming no wording effects (e.g., Gu et al. 2015; Lindwall et al. 2012; Michaelides 2019; Roszkowski and Soven 2010). Similarly, exploratory IFA can be used for identifying the optimal number of latent traits and the item–trait relationship in relation to item wording; however, exploratory IFA, as a data-driven approach, does not require specifying an item–trait structure beforehand. In the IRT-based methods, respondents' latent trait levels and item statistics are examined to evaluate item wording effects (e.g., Sliter and Zickar 2014; Wang et al. 2015). For example, Wang et al. (2015) used the bifactor IRT model to examine item wording effects and found that they produced an overestimation of test reliability and biased estimates of the latent trait. Bolt et al. (2020) adapted IRT mixture modeling for item wording effects and found similar results.
Despite their ease of use, the factor analytic and IRT-based approaches have several limitations in detecting item wording effects. First, the factor analytic and IRT-based approaches focus exclusively on the relationship between the latent trait and the items rather than examining relationships among the items. Therefore, these approaches fail to offer insights into how the items interact and mutually influence each other depending on their wording. Second, both approaches make strong statistical assumptions. For example, the factor analytic approaches assume a linear relationship between the latent trait and the item response options. The IRT-based approach also has specific assumptions regarding the model used (e.g., all items must have equal discrimination in the Rasch model) (Sliter and Zickar 2014). Third, both CFA and IRT require a causal structure (i.e., item–trait relationship) to be specified based on prior knowledge (Marsman et al. 2018). However, if the item–trait relationship is not entirely known or misspecified, then model parameters and additional parameters associated with item wording effects may be erroneously estimated (DiStefano and Motl 2006; Jin and Wang 2014; Kam and Meyer 2015; Wang et al. 2015). Although exploratory IFA can avoid the problems caused by erroneous item–trait specification, it also has some drawbacks affecting its utility in detecting item wording effects, such as high redundancy due to unnecessary model parameters and lower generalizability (Huang et al. 2017).
Psychometric Network Analysis
Psychometric network analysis (PNA; Borsboom and Cramer 2013) is an alternative method that can be applied to model latent traits (e.g., psychological traits). PNA has gained significant use in psychology, including the subfields of clinical psychology (e.g., Borsboom and Cramer 2013; Christensen et al. 2019; Fried and Nesse 2015), personality research (e.g., Briganti and Linkowski 2020), and intelligence research (e.g., Bulut et al. 2021; Golino and Demetriou 2017; Kan et al. 2020). Researchers have also used PNA for scale development, scale validation, dimensionality analysis, and dimension reduction (e.g., Bansal et al. 2020; Briganti and Linkowski 2020; Christensen et al. 2020; Golino and Demetriou 2017; Golino and Epskamp 2017; McGrew et al. 2023).
The PNA approach involves three steps (Epskamp et al. 2018:196): (1) estimating a statistical model based on data, resulting in a weighted network between observed variables; (2) analyzing the weighted network structure using indices (e.g., node strength); and (3) assessing the accuracy of the network parameters and measures. The outcomes of PNA are presented visually in a network graph where nodes (i.e., circles) represent observed variables, whereas edges (i.e., lines connecting the nodes) represent the statistical relationships (e.g., partial correlations) between nodes. In PNA, there are several indices for nodes and edges indicating the importance of nodes or edges to the given network. Edge weights are the partial correlation between two nodes. Thicker edges show stronger correlations, and the length of edges shows how quickly a node affects another node.
In contrast to the CFA, IFA, and IRT methods, PNA offers several advantages in identifying item wording effects. First, PNA focuses exclusively on the correlations among the items and, thus, it may yield more accurate descriptions of expected and unexpected relationships among the items (Christensen et al. 2020). Second, PNA captures complex relationships, such as indirect connections among the items, thereby offering further insights into inconsistent interactions (e.g., item wording effects) that are not easily attainable through the factor analytic or IRT approaches (Borsboom et al. 2021). Third, PNA does not require any specification of item-trait relationships (i.e., factorial structure). Thus, researchers would not have to make assumptions about whether positively worded and NW items measure the same latent trait. Fourth, as a model-free approach, PNA enables the discovery of unexpected relationships and patterns in the data, making it particularly suitable for detecting anomalies, such as item wording effects. Lastly, PNA offers powerful visualizations that show the connections between items, making it easier to interpret findings effectively (Borsboom et al. 2021) compared to the factor analytic and IRT-based methods.
A noteworthy assumption of PNA is that networks are homogeneous across subgroups of a target population, such as demographic groups based on gender and race (Jones et al. 2020). As mentioned previously, the impact of item wording effects may vary depending on respondents' demographic characteristics (e.g., race, age, and gender). An extension of PNA, network model trees (Jones et al. 2020), provides a potential solution to examine the viability of this homogeneity assumption. Demographic variables can be treated as covariates in network trees and added to PNA to investigate the presence and intensity of item wording effects by subgroups. In summary, PNA offers greater flexibility in evaluating how the items are interconnected in the presence of item wording effects and whether the inter-item relationships depend on subgroup membership.
Current Study
In this study, we used PNA to examine item wording effects in two self-report measures related to students' psychological beliefs towards mathematics (i.e., Students Like Learning in Mathematics [SLLM] and Students Confident in Mathematics [SCM]). To our knowledge, this study represents one of the initial endeavors to leverage PNA for detecting item wording effects in self-reported measures. Additionally, it explores these effects across diverse groups utilizing network tree models. We investigated whether NW items in these scales constituted a different community (i.e., dimension) relative to the positively worded items. The study aimed to answer the following research questions: 1. Do the SLLM and SCM scales exhibit item wording effects due to NW items? 2. Can PNA detect item wording effects in SLLM and SCM? 3. Does the functioning of NW items in the network structures of SLLM and SCM vary based on country and grade level?
Method
Sample
Data were drawn from fourth and eighth graders (n = 75,972) who participated in the 2019 Trends in International Mathematics and Science Study (TIMSS). TIMSS is an international, large-scale assessment that evaluates students’ learning outcomes in mathematics and science every four years in the fourth and eighth grades. In addition to assessing student performance, TIMSS collects data on different aspects of students’ home and school lives, such as demographic information and contextual information (e.g., home learning environment, school climate, and attitudes toward learning mathematics and science).
The sample of this study included eight countries: Japan, Korea, Hong Kong, Chinese Taipei, Kazakhstan, Turkey, Morocco, and Saudi Arabia. These countries were selected to obtain a heterogeneous sample in terms of cultures, attitudes, and math achievement (Mullis et al. 2020). These countries were either at the bottom or top regarding their attitude scale scores in both grades, as reported in the TIMSS 2019 report (Mullis et al. 2020). For achievement, Japan, Korea, Hong Kong, and Chinese Taipei were the top performers; Turkey and Kazakhstan were in the middle range; and Morocco and Saudi Arabia were in the lower range of average mathematics scores. Sample sizes by country were as follows: 8,642 (50% female, 49% fourth grade) for Japan, 7,754 (49% female, 50% fourth grade) for Korea, 6,233 (46% female, 48% fourth grade) for Hong Kong, 8,680 (49% female, 43% fourth grade) for Chinese Taipei, 9,244 (49% female, 52% fourth grade) for Kazakhstan, 8,105 (51% female, 50% fifth grade) for Turkey, 16,181 (49% female, 48% fourth grade) for Morocco, and 11,133 (51% female, 49% fourth grade) for Saudi Arabia.
Instruments
The SLLM and SCM scales consist of nine items rated on a four-point Likert scale (1 = Agree a lot, 2 = Agree, 3 = Disagree, 4 = Disagree a lot). These scales were selected for this study because they were applied in both the fourth- and eighth-grade levels, with only minor modifications in two items. Also, both scales contained NW items; two on the SLLM and five on the SCM are phrased negatively (see Appendix A). Both scales demonstrated sufficient internal consistency in fourth- and eighth-grade samples (Yin and Fishbein 2020).
Data Analysis
Student responses to positively worded items were reverse coded so that higher scores would indicate greater confidence or liking for learning mathematics (i.e., 1 = Disagree a lot, 2 = Disagree, 3 = Agree, 4 = Agree a lot). To examine item wording effects, we applied Exploratory Graph Analyses (EGA; Golino and Epskamp 2017) to each scale separately to identify the number of dimensions in the networks of SLLM and SCM. EGA is a data-driven network analysis approach that can reveal communities (i.e., dimensions) in networks without pre-specifying a factorial structure (Christensen and Golino 2021). In this study, we anticipated that if substantial item-wording effects were present in SLLM and SCM, then positively worded and NW items in each scale would display distinctive communities in their networks.
In EGA, we used the polychoric correlations among the items to estimate a Gaussian Graphical Model (GGM) where edges represented partial correlations between the items in each scale, after controlling for all other relations among the items. To estimate the GGM, we used the Graphical Least Absolute Shrinkage and Selection Operator (GLASSO) algorithm in the EGAnet package (Christensen et al. 2020; Golino and Christensen 2022) in R (R Core Team 2022). To identify distinctive communities in the networks, we used the walktrap community detection algorithm (Pons and Latapy 2006), which performs iterative and random walks over the network, provides a similarity measure based on these random walks, and then identifies distinctive communities.
One of the network measures (node strength) in EGA is roughly equivalent to factor loading in CFA models (Christensen and Golino 2021), the good-fit indices produced by EGA analysis are identical, allowing for direct comparisons with CFA models (Golino and Demetriou 2017; Golino and Epskamp 2017). Previous studies indicated that EGA is a more effective approach for identifying the number of dimensions than factor analytic techniques such as parallel analysis (Golino and Demetriou 2017; Golino and Epskamp 2017). To confirm the findings of EGA, the factor structures of SLLM and SCM were also examined using a one-factor CFA model (i.e., a single factor based on positively worded items and NW items), a two-factor CFA model (i.e., two separate factors for positively worded items and NW items), and a bi-factor model (i.e., a general factor for all items and two additional factors for positively worded and NW items) using the Lavaan package (Rosseel 2012) in R (R Core Team 2022). The factor models were estimated using the weighted least square mean and variance adjusted estimator. Goodness-of-fit criteria, including root mean square error of approximation (RMSEA), Tucker-Lewis index (TLI), and comparative fit index (CFI), were used to confirm sufficient model-data fit for each model (RMSEA ≤ 0.06, TLI ≥ 0.95, and CFI ≥ 0.95; Hu and Bentler 1999).
To identify potential subgroups in the network of SLLM and SCM, we used network model trees based on the model-based recursive partitioning approach (MOB; Zeileis et al. 2008) available in the network tree package (Jones et al. 2020). The MOB algorithm uses covariates to split the network into subnetworks where the network model parameters are maximally heterogeneous (Jones et al. 2020). The package, specifically the comparetree function, offers an adjacency matrix illustrating the variances for each edge, facilitating the assessment of large discrepancies between the networks. With the network model trees, we examined whether the networks of SLLM and SCM would differ based on age groups and country for the students participating in TIMSS 2019. Age was selected as a covariate because previous research showed that age and reading comprehension (partly a function of age) could be associated with item wording effects (Bolt et al. 2020; Bulut 2021; Bulut and Bulut 2022; Michaelides 2019). Country was selected to explore the impact of different languages on the resulting networks, as each country included in the sample of this study speaks a different language. 1
Results
The Dimensionality of SLLM and SCM
The EGA analyses revealed two distinctive communities (one for positively worded items and another for NW items) for both the SLLM and SCM scales. As shown in Figure 1, the items with the same type of wording share stronger connections (i.e., thicker edges) with each other. It should be noted that responses to positively worded items were reverse coded before performing psychometric network analysis. Thus, all the edges in the networks shared the same color. In the network plot of SLLM, the strongest connection appears to be between the NW items across all connections. In the network plot of SCM, the distinction between the communities for the positively worded items and NW items seems more evident based on how the items are clustered together. Network plots of (a) SLLM and (b) SCM.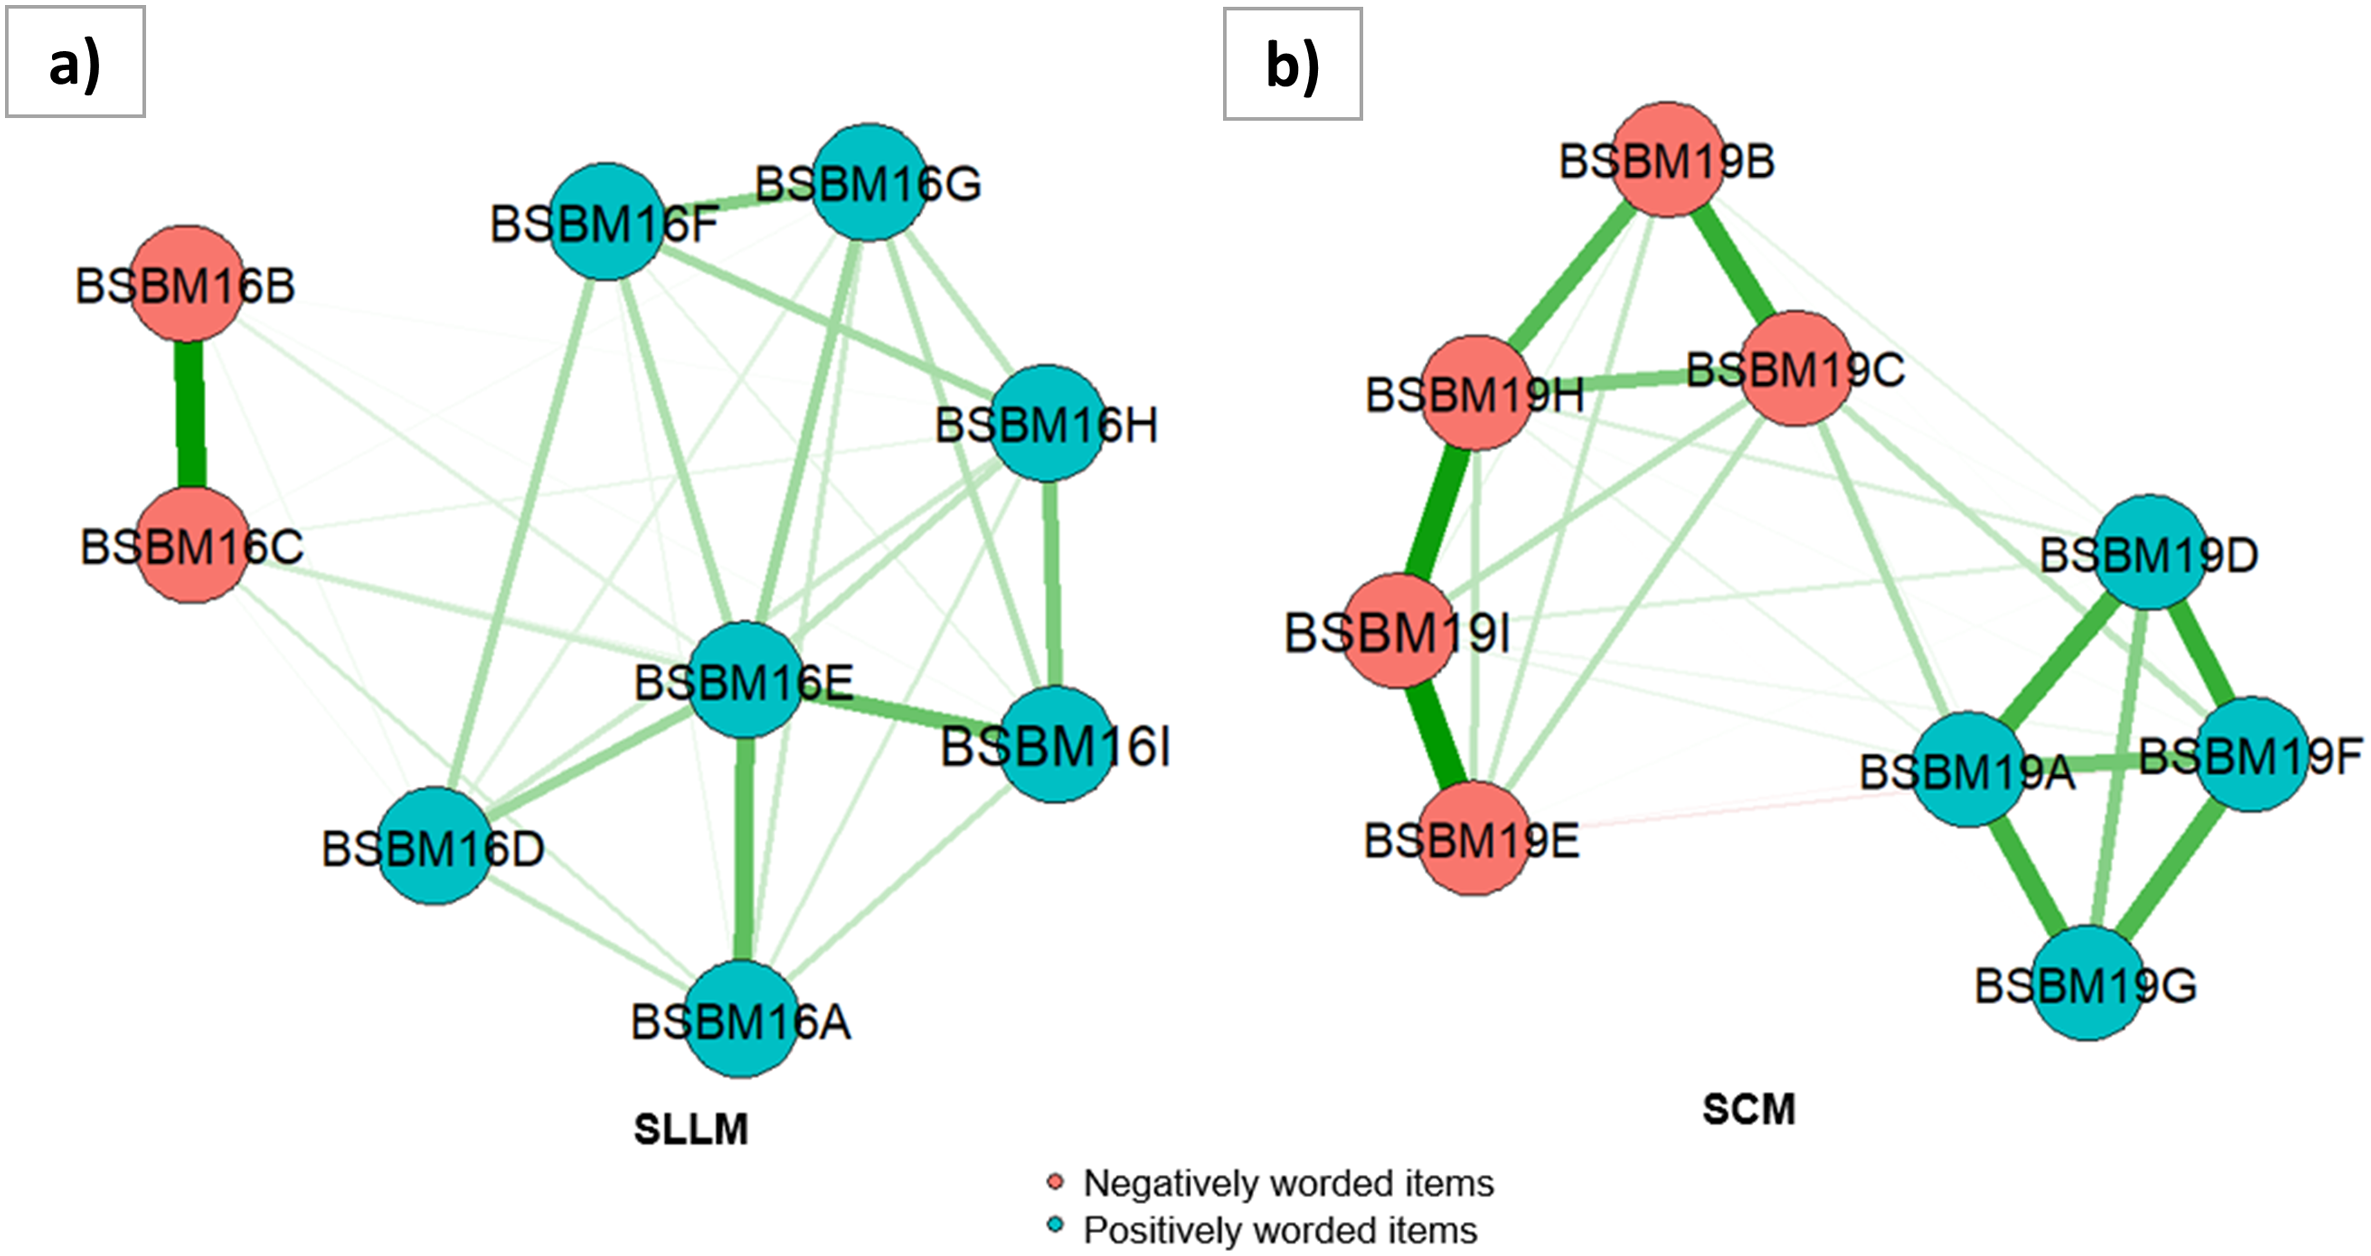
Model Fit Indices for the CFA and EGA Models for the SLMM and SCM Scales.
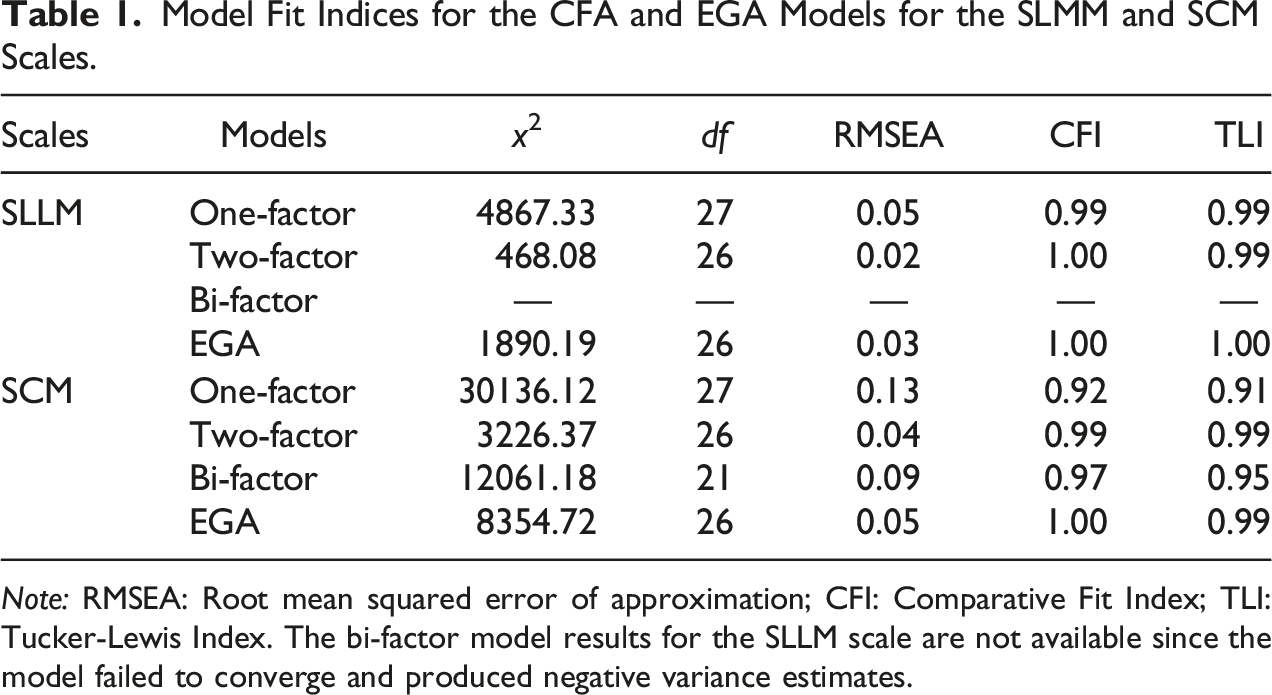
Note: RMSEA: Root mean squared error of approximation; CFI: Comparative Fit Index; TLI: Tucker-Lewis Index. The bi-factor model results for the SLLM scale are not available since the model failed to converge and produced negative variance estimates.
Network Model Trees of SLMM and SCM
The network tree models of SLMM and SCM are extensive networks characterized by numerous splits. The variances determine these splits observed for each edge, effectively depicting significant discrepancies between the subnetworks. Figure 2 shows the network tree of the SCM scale based on country and grade level. The primary split occurred between high-performing countries (except for Kazakhstan) and lower-performing countries, followed by additional splits based on the grade level. These findings indicate potential heterogeneity in the network of SCM due to differences at the country and grade levels. Despite these significant splits based on country and grade level, the NW items of SCM (red nodes) remained disconnected from the positively worded items (green nodes) in the network plots across all terminal nodes. However, there are some minor differences among the terminal nodes. For example, the item communities based on positively worded items and NW items were connected with negative edges (see the red lines) for some countries and grade levels, such as both fourth and eighth graders in Hong Kong and Saudi Arabia. Similar trends were also observed between the items of the SLLM scale (see Appendix B). Overall, the network tree analyses suggest that the NW items continue to produce a distinctive community in the network structures of SLLM and SCM, regardless of the two covariates, country and grade level. The network model tree of SCM.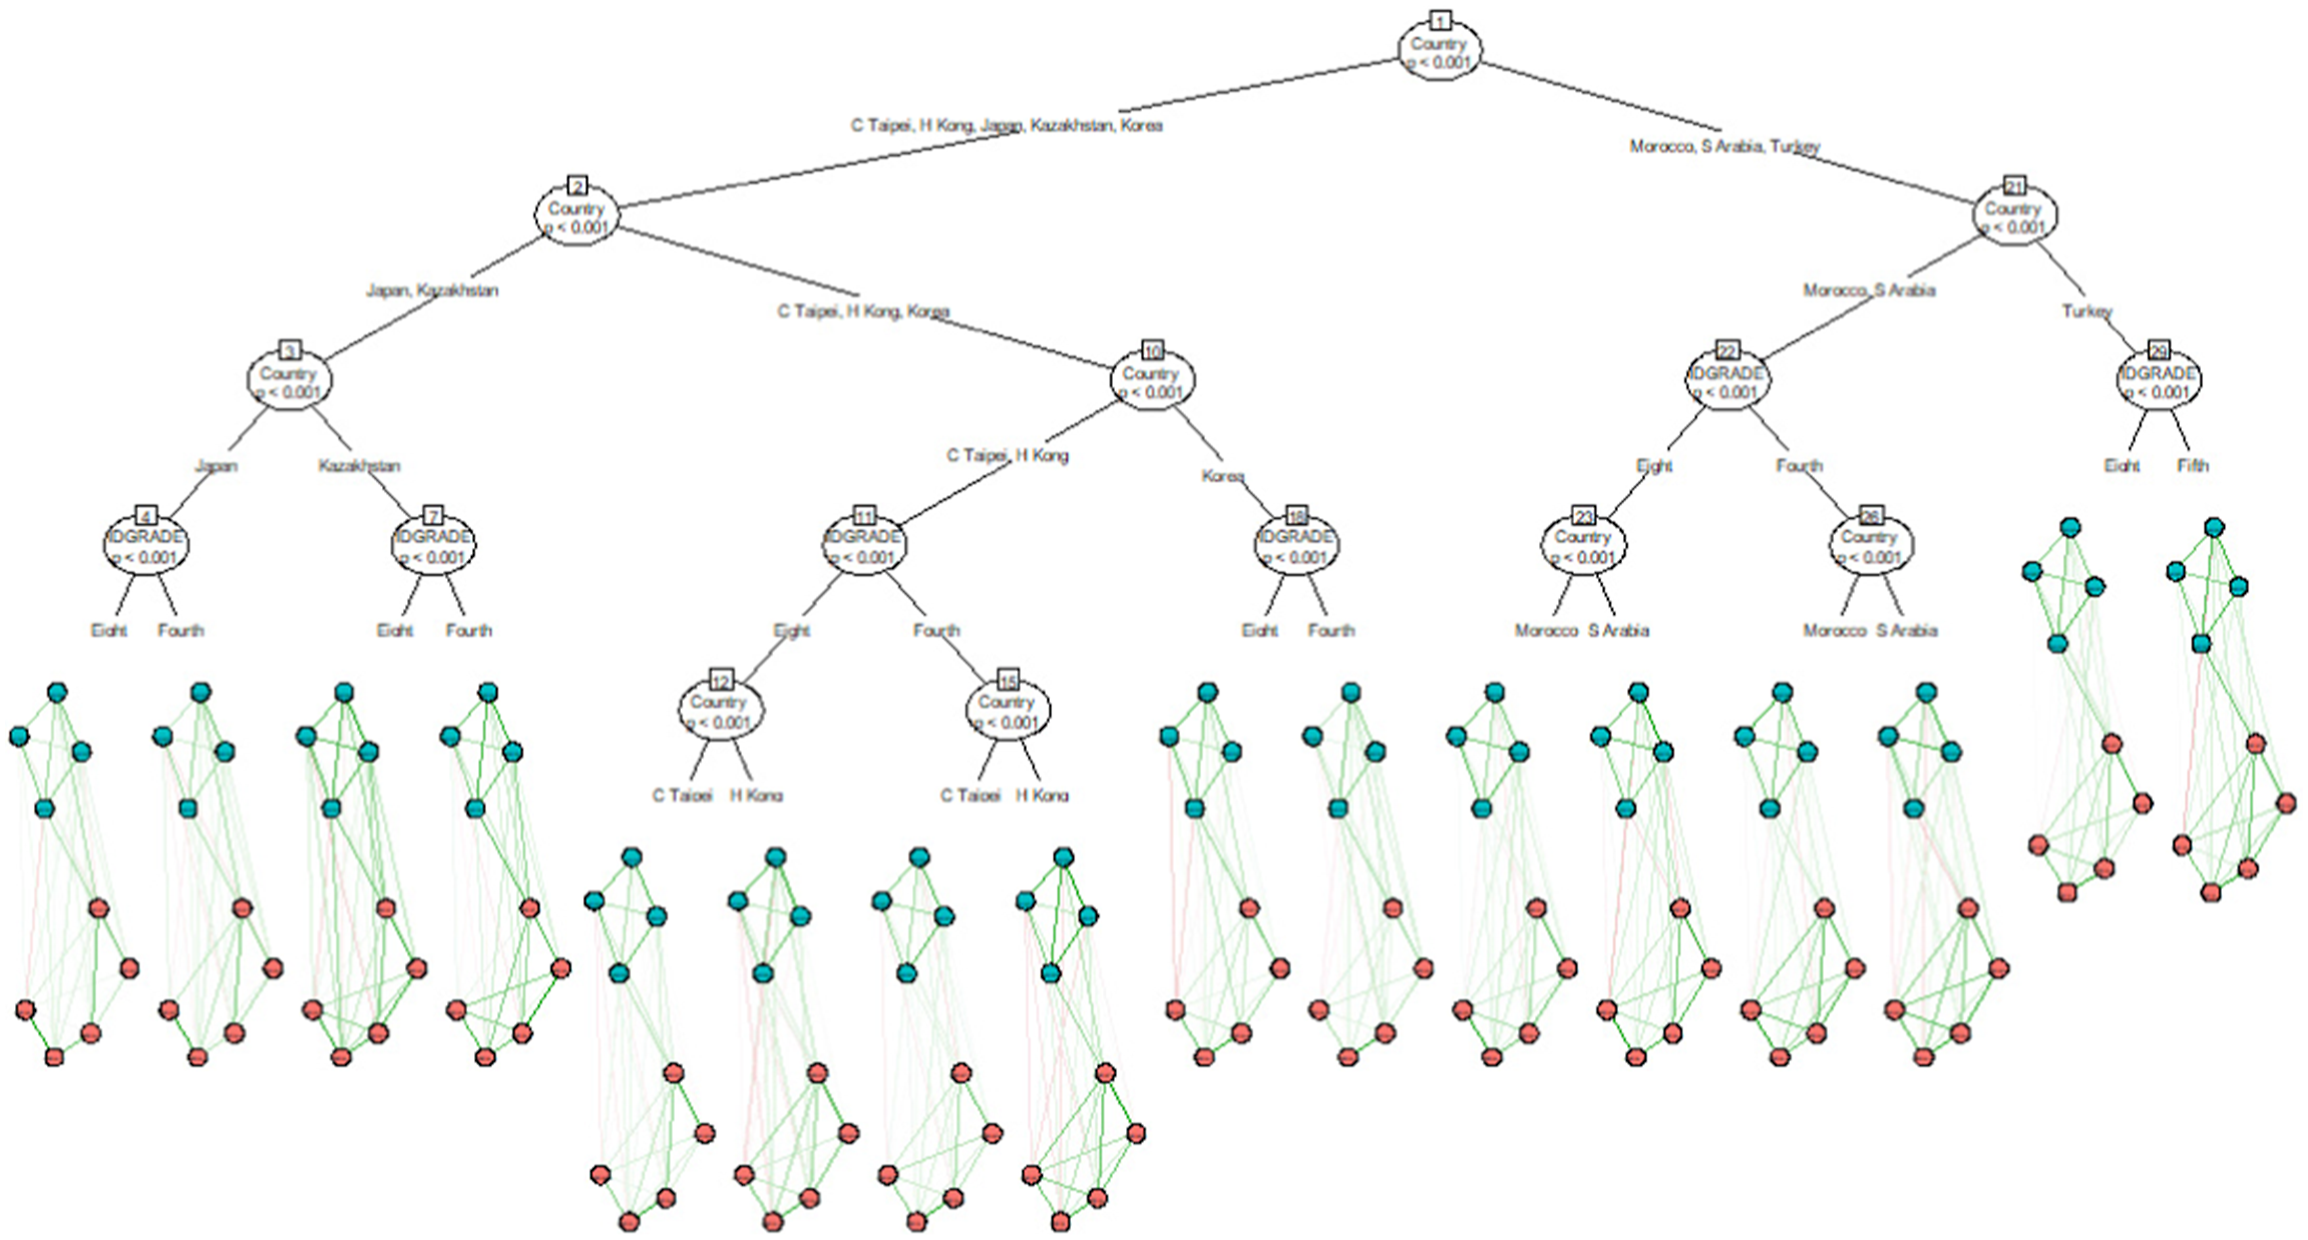
Discussion
This study used PNA to investigate the effects of item wording on the SLLM and SCM scales. By dividing the network model trees by country and age, we explored item wording effects among different student groups. The PNA approach allowed us to examine the relationships between positively worded and NW items and visualize item clusters based on their wording. Our findings provided evidence of item wording effects in both scales, with NW items forming a distinct community within the network structures. These items were also found to have stronger relationships with each other than positively worded items, suggesting that students may have different tendencies when endorsing them. These results were consistent with previous studies that employed different methods for detecting item wording effects (e.g., Bolt et al. 2020; DiStefano and Motl 2006; Gnambs and Schroeders 2020; Kam and Meyer 2023; Lindwall et al. 2012; Michaelides 2019; Wang et al. 2015) and demonstrate the usefulness of PNA in revealing such relationships. Network model trees helped us further examine the connectivity and importance of NW items by partitioning the network structures based on country and grade level. The partitioned network structures showed the unique interactions between negatively and positively worded items across different countries and grade levels. Of these two covariates, the country is the most significant one affecting initial splits. The findings of our study reinforce previous research regarding the impact of age and culture on item wording effects (e.g., Michaelides 2019; Weems et al. 2006).
Furthermore, our findings highlight the significant impact of cultural factors on the diversity observed within the network models, with cultural influences often overshadowing those of grade level or age. Considering the profound influence of culture on language, numerous studies also indicated that respondents’ cultural backgrounds could significantly shape their perception of NW items in different languages (Michaelides 2019; Schmitt and Allik 2005). Thus, cultural influences on the perception of NW effects may outweigh the influence of age on such perceptions. In another study conducted across five European countries, Lindwall et al. (2012) reported similar findings, with item wording effects models remaining consistent across different age groups but varying significantly across countries. This body of evidence underscores the necessity of considering cultural factors when interpreting perceptions and responses within network models.
Overall, compared to the methods utilized in previous studies (e.g., multi-group factor analysis), network model trees seem to detect significant group differences more easily, signaling the presence of wording effects for a particular demographic group (i.e., identifying meaningful subgroups in the data) (Jones et al. 2020; Zeileis et al. 2008).
Implications for Practice
Our findings suggest that it is possible to harness PNA to detect item wording effects. PNA offers unique, item-level insights into the functioning of NW items that cannot be examined through conventional models without specifying a causal relationship between the items and the target constructs being studied. Examining the network structure of a scale can help researchers and practitioners understand how NW items relate to other items in the scale. We also want to note that item wording effects may emerge due to careless and insufficient effort (C/IE) responses (Arias et al. 2020). 2 Therefore, researchers and practitioners should consider applying network methods and other methods to detect C/IE responses to better understand the functioning of NW items in their work.
Our findings also highlight the utility of network model trees in identifying wording effects across demographic subgroups. This presents an opportunity for researchers and practitioners to use network model trees to gain further insight into which covariates can reduce or exacerbate item wording effects in their own settings. A notable advantage of this method is that the impact of multiple demographic variables can be analyzed together within the same network model. That is, network model trees consider multiple covariates in the analysis and retain only the significant ones, instead of running the analysis separately for each covariate. This approach can also consider complex interactions among the covariates (e.g., age x gender) while examining item wording effects. Additionally, unlike multi-group CFA models, network model trees provide a tree-like structure that identifies which variables exhibit better importance in explaining the heterogeneity of network models. Thus, the network tree-based results offer a comprehensive view encompassing all covariates and facilitate a more nuanced understanding of item-level dynamics.
Limitations and Future Research
There are several limitations to our study. First, PNA was applied to two relatively short scales using a robust sample size. Consequently, the generalizability of the network approach to longer scales or smaller sample sizes remains uncertain. Additionally, both scales employed a four-point Likert scale in our study. However, as the number of response options increases, there is a likelihood of shifts in respondents’ interactions with positively worded and NW items. Thus, subsequent research is needed to elucidate the impact of varying response options on the detection of item wording effects in self-report measures.
Furthermore, our study presents initial findings on the comparison between PNA and factor analytic approaches in detecting item wording effects. To deepen our understanding, future studies should undertake a comprehensive examination encompassing multiple methodologies such as PNA, factor analysis, and IRT-based methods. A simulation study incorporating diverse conditions, such as the number of NW items, the proportion of these items to positively worded ones, sample size, and the total number of items in a self-report measure, would contribute substantially to refining our insights into the intricacies of detecting and interpreting item wording effects.
Footnotes
Declaration of Conflicting Interests
The author(s) declared no potential conflicts of interest with respect to the research, authorship, and/or publication of this article.
Funding
The author(s) received no financial support for the research, authorship, and/or publication of this article.
Notes
Appendix A
Items of SLLM and Their Codes. Note: For the fourth graders, item codes are ASBM02A to ASBM02I in the same order.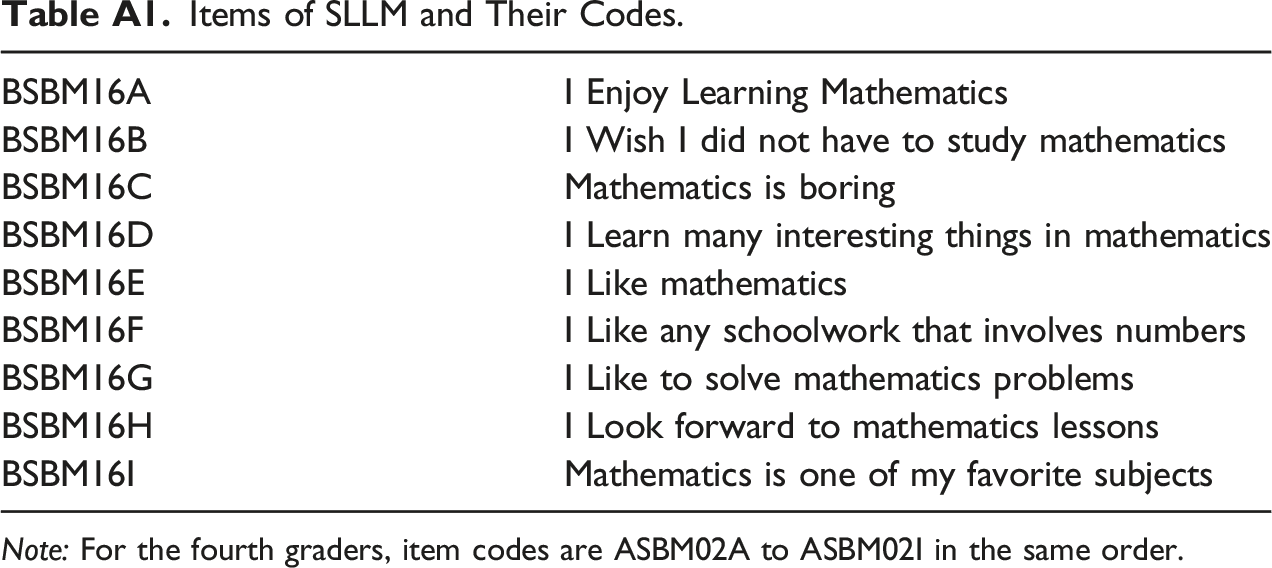
BSBM16A
I Enjoy Learning Mathematics
BSBM16B
I Wish I did not have to study mathematics
BSBM16C
Mathematics is boring
BSBM16D
I Learn many interesting things in mathematics
BSBM16E
I Like mathematics
BSBM16F
I Like any schoolwork that involves numbers
BSBM16G
I Like to solve mathematics problems
BSBM16H
I Look forward to mathematics lessons
BSBM16I
Mathematics is one of my favorite subjects
Items of SCM and Their Codes. Note: For fourth graders, item codes are ASBM02A to ASBM02I in the same order. aThe adjective is “harder”. bThe item is “I am just not good at mathematics” in the SCM scale for the fourth graders. SOURCE: IEA’s Trends in International Mathematics and Science Study - TIMSS 2019 Downloaded from https://timss2019.org/download Mullis, I. V. S., Martin, M. O., Foy, P., Kelly, D. L., & Fishbein, B. (2020). TIMSS 2019 International Results in Mathematics and Science. Retrieved from Boston College, TIMSS & PIRLS International Study Center website: https://timssandpirls.bc.edu/timss2019/international-results/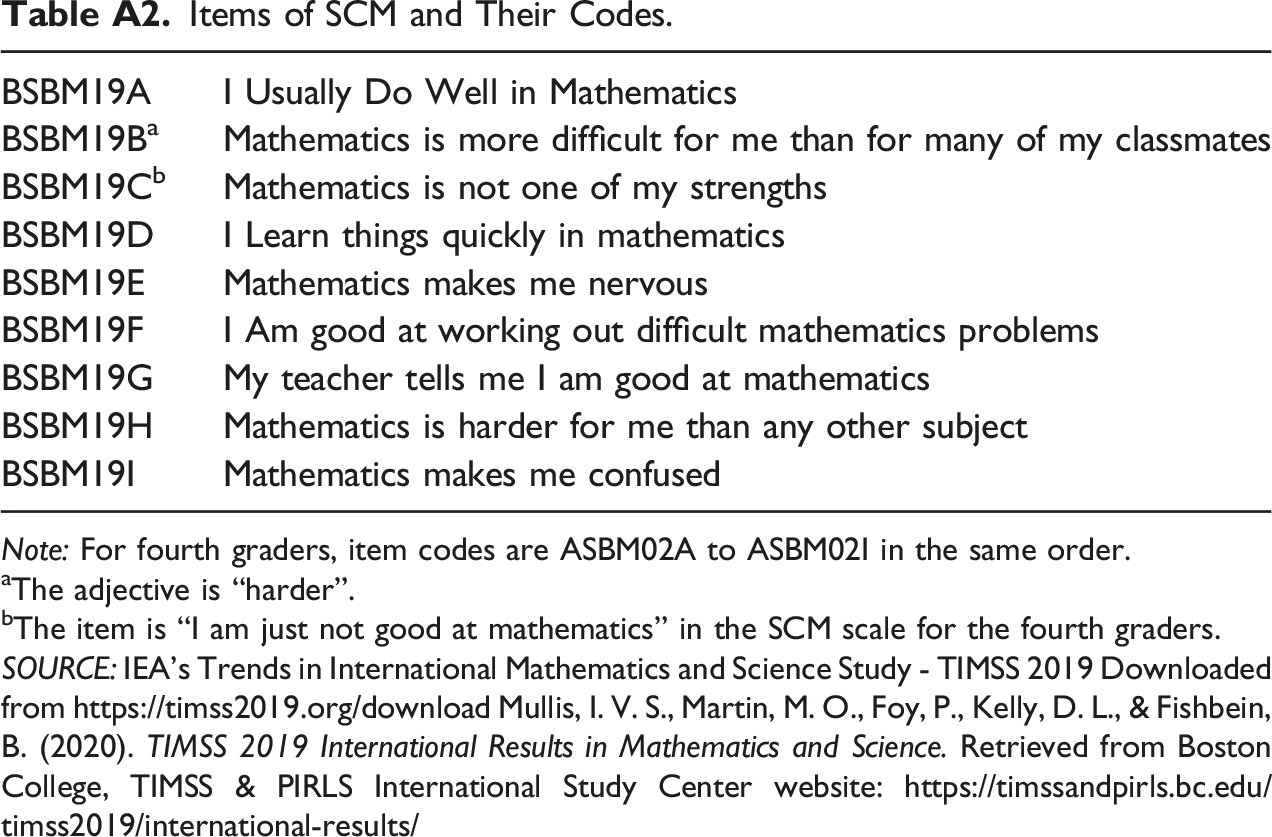
BSBM19A
I Usually Do Well in Mathematics
BSBM19B
a
Mathematics is more difficult for me than for many of my classmates
BSBM19C
b
Mathematics is not one of my strengths
BSBM19D
I Learn things quickly in mathematics
BSBM19E
Mathematics makes me nervous
BSBM19F
I Am good at working out difficult mathematics problems
BSBM19G
My teacher tells me I am good at mathematics
BSBM19H
Mathematics is harder for me than any other subject
BSBM19I
Mathematics makes me confused
Appendix B
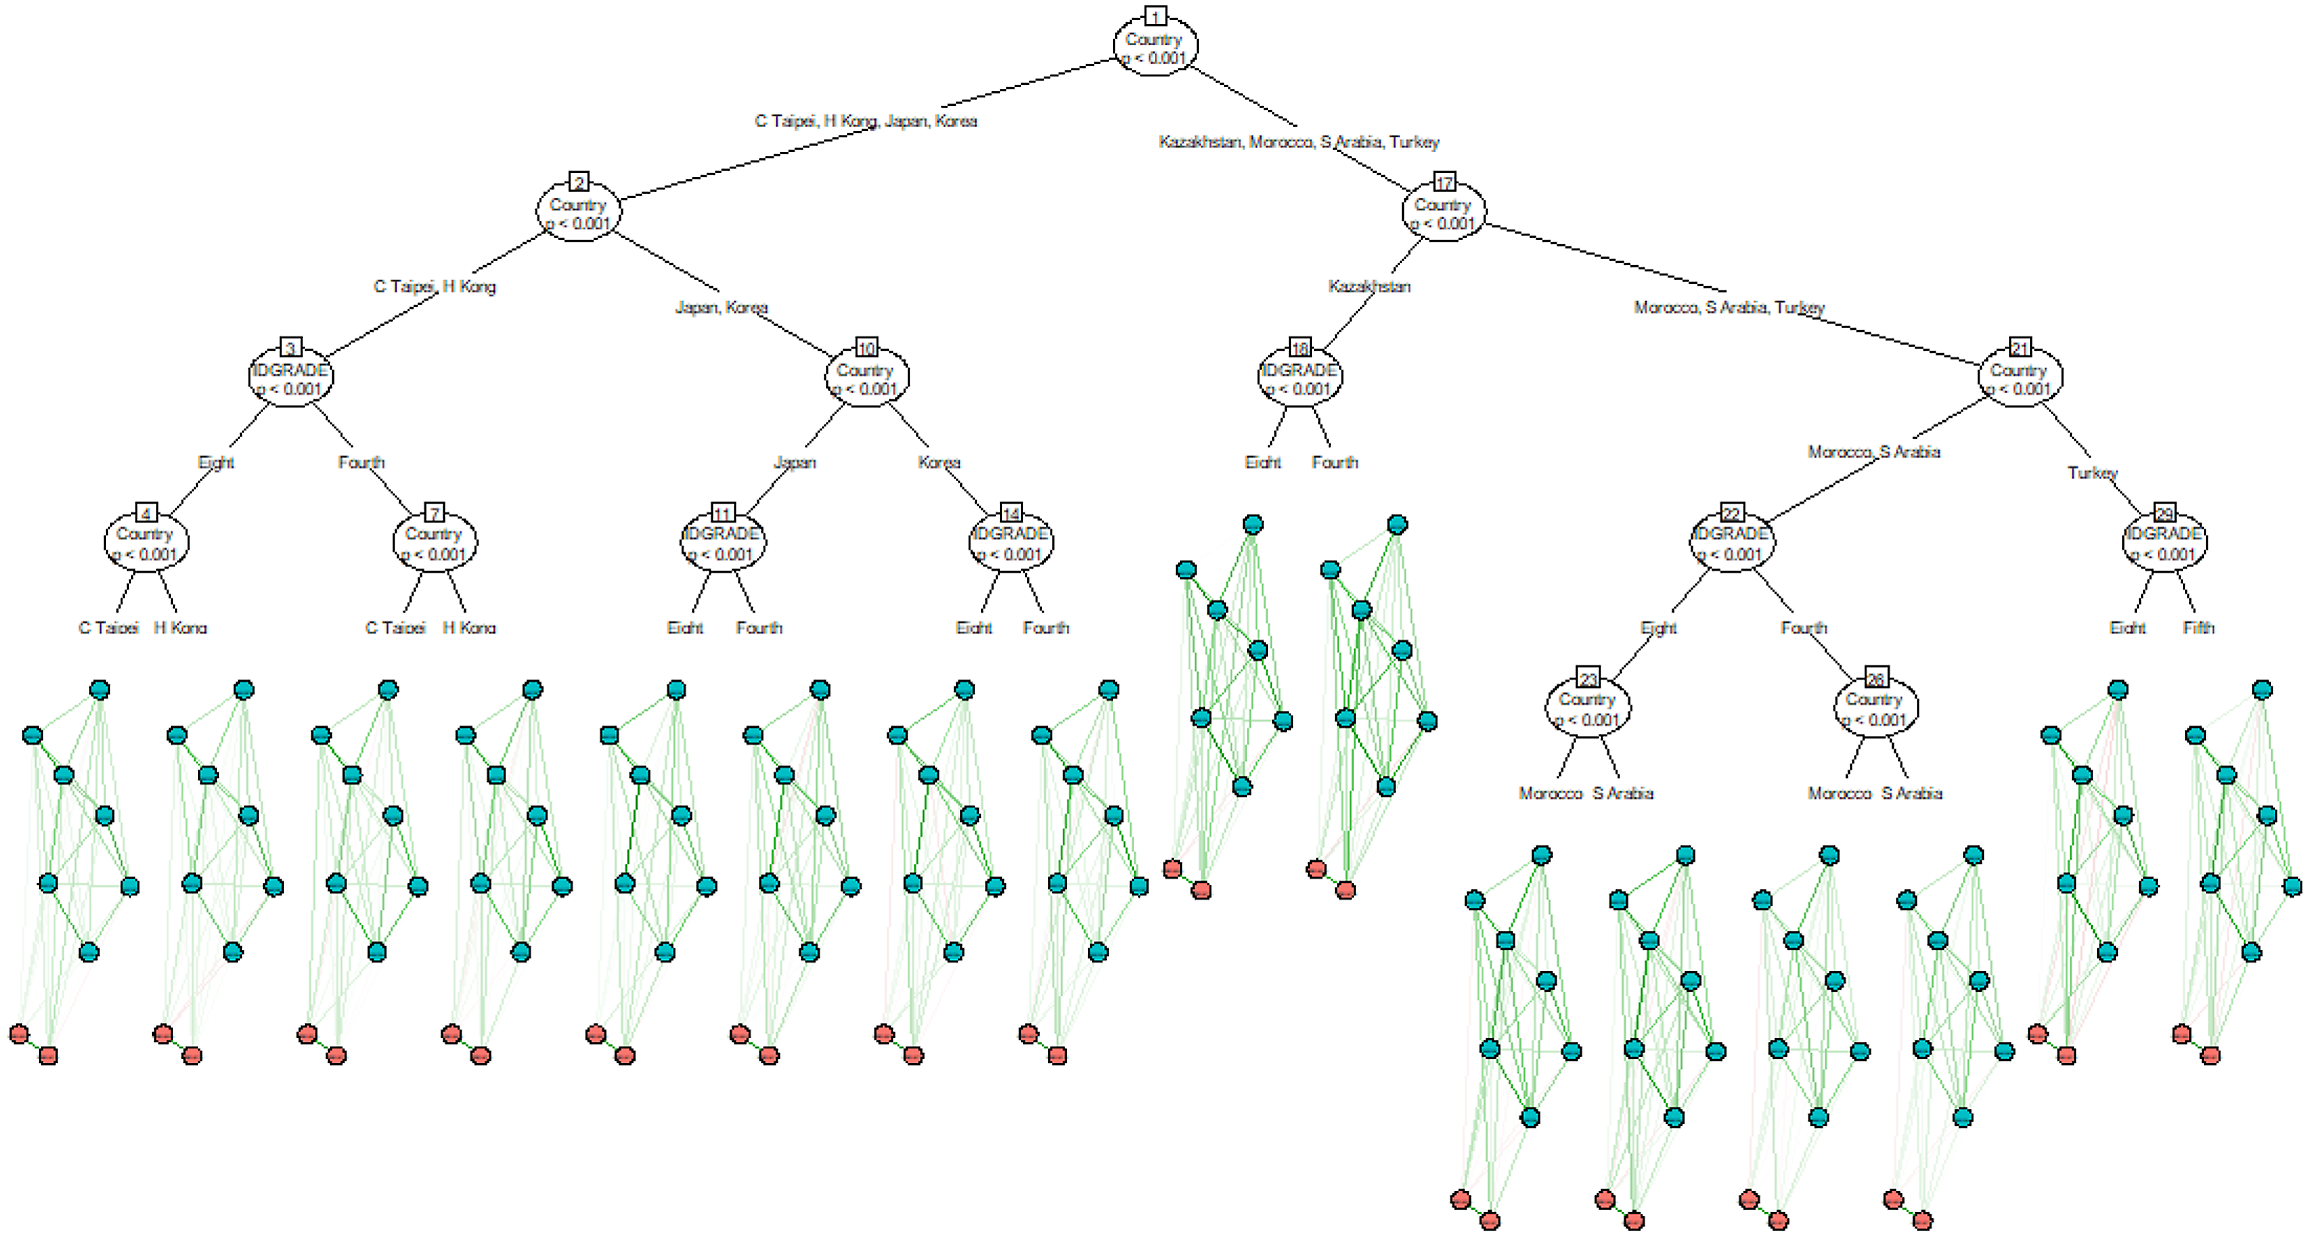
The network model tree of SLLM.