
Abstract
Although it has long been acknowledged that interviewers play a crucial role in the survey data collection process, there is little research concerning interviewer effects on how respondents perceive the interview. We investigate whether interviewer effects exist regarding how much respondents report having enjoyed the interview and whether these effects can be explained by interviewer characteristics. We use data from wave 9 of the German Family Panel pairfam, combined with data from an interviewer survey conducted prior to this wave. Applying multilevel models, we find large interviewer effects that can be explained only partly by interviewers’ sociodemographic characteristics, attitudes, and behavior. Interviewers’ gender, intrinsic work motivation, and their attitude toward respondents significantly affect how much respondents enjoy the interview.
Introduction
Interviewers play a crucial role in the survey data collection process. They elicit cooperation, establish rapport, manage the question-and-answer process, and help respondents perform their task (Fowler 2009). Accordingly, interviewer effects on survey outcomes such as survey cooperation, response behavior, and measurement quality have been reported (Groves et al. 2009; West and Blom 2017). Regarding measurement quality, Bell et al. (2016) argue that an interview situation in which respondents feel comfortable can help participants understand questions, remember accurately, and respond openly and honestly. This seems to be particularly important in the case of sensitive topics (Andersson et al. 2009). Regarding survey cooperation, not only current survey participation may be influenced, e.g., by interviewers’ doorstep behavior (Blom et al. 2010), but even participation in future surveys or panel waves (Pickery et al. 2001). As Pickery et al. (2001) argue, respondents’ experience of the interview influences their willingness to participate in subsequent panel waves, a mechanism supported by previous work linking past survey experiences with nonresponse in other surveys (Bergman and Brage 2008; DeMaio 1980; Nederhof 1987; Stocké and Langfeldt 2016).
Despite these studies that imply a relationship of interviewer, survey experience, and survey outcomes, no further efforts have been taken to explain the role of the interviewer in providing a pleasant survey experience. Thus, Pickery et al.’s (2001) argument that interviewers may influence the pleasantness of interviews (which may then affect participation and measurement quality) has thus far not been tested directly.
This study addresses this gap by investigating whether interviewer effects on respondents’ subjective assessment of the interview exist and how they can be explained. Our analysis is based on data from the German Family Panel (pairfam), a panel study with annual personal interviews (Brüderl et al. 2022a). Each year, at the end of the computer-assisted personal interview (CAPI), respondents are asked to rate how they enjoyed the interview. We use this interview assessment as a dependent variable and apply multilevel models to detect interviewer effects. Further, we attempt to explain these effects using data from an interviewer survey, focusing on interviewers’ demographic characteristics as well as attitudes and behaviors.
Background and Literature
How are respondents’ perceptions of an interview formed? Applying self-determination theory (Deci and Ryan 1985), respondents’ needs for competence, autonomy, and social relatedness must be fulfilled for an enjoyable interview experience. The same influence factors can be listed as in the decision to participate in a survey (Groves et al. 1992): societal-level factors, survey design, respondent and interviewer characteristics, and respondent–interviewer interaction. Interviewers play a role by establishing a relationship, explaining the survey, and providing guidance and assistance during the interview. In the following, we explain mechanisms through which interviewer effects on interview pleasantness may arise, building on the literature on interviewer effects on various survey outcomes that may be related to interview pleasantness.
Interviewer gender is often included in analyses of interviewer effects. Compared to male interviewers, female interviewers are perceived as “friendlier” (Fowler and Mangione 1998) and less threatening (Axinn 1989). Some authors argue that respondent–interviewer gender match may be more important than interviewer gender per se, as the theory of liking suggests that individuals prefer interactions with people similar to themselves (Groves et al. 1992). However, evidence is mixed, with some studies finding beneficial effects of gender matching on outcomes such as unit and item nonresponse (Catania et al. 1996; Tu and Liao 2007), while others find no or only partial support (Bruckmeier et al. 2015; Vercruyssen et al. 2017; Wilson et al. 2016). Taken together, these findings suggest that female interviewers' interviews may be perceived as more pleasant, particularly by female respondents due to the gender matching effect.
A second characteristic included in many studies is interviewer age. On the one hand, older interviewers may have more difficulties reading questions aloud (e.g., due to small font size) or handling electronic devices needed for CAPI interviews (West and Blom 2017). On the other hand, older interviewers may be more experienced and feel more comfortable with the interview situation (Cleary et al. 1981). Accordingly, empirical evidence is mixed (West and Blom 2017). For instance, older interviewers were found to collect smaller reported personal networks (Brüderl et al. 2013; Josten and Trappmann 2016) and gain less consent to data linkage or approaching secondary respondents (Korbmacher and Schroeder 2013; Schröder et al. 2016). Other studies suggest a positive link between interviewer age and factors such as survey precision (O’Muircheartaigh and Campanelli 2002) and completeness (Berk and Bernstein 1988). It is thus unclear whether interviewer age may affect interview pleasantness.
Moreover, interviewer education may play a role. For instance, higher educated interviewers may be better able to help respondents with difficult questions (Johann and Mayer 2021). Interviewers with higher education were found to achieve higher cooperation rates and higher consent rates to data linkage in some studies (Haunberger 2010; Korbmacher and Schroeder 2013), but in others not (Pickery and Loosveldt 2002; Sala et al. 2012). As with gender, the mechanism may be educational matching rather than level of education per se (Durrant et al. 2010; Lord et al. 2005; Tu and Liao 2007). Accordingly, we test both interviewer education and matching of interviewer and respondent education.
Interviewer experience may also contribute toward a more pleasant interview. More experienced interviewers were found to be better able to respond to interviewees' needs, resulting in better tailoring (Groves and Couper 1998). In CAPI interviews, less experienced interviewers may have difficulties handling the devices, which may disturb the interview progress. However, interviewers may become more careless in their administration of the questionnaire over time (Olson and Peytchev 2007). While the latter may compromise data quality, all in all a positive effect of interviewer experience on interview pleasantness can be expected.
Following prior research (Berk and Bernstein 1988; Jäckle et al. 2013; Pickery et al. 2001), we assume that interviewer performance, and hence interview pleasantness, is not (only) a function of characteristics such as experience or sociodemographic factors, but rather a culmination of the interviewers’ motivation, attitudes, and behavior during the interview.
Lewis and Graham (2007) report from qualitative interviews with individuals who had recently participated in face-to-face interviews that respondents value interviewers who show interest and respect, conduct the interview at an adequate pace, and provide assistance in case of difficulties with the questions. Research has discussed the role of rapport building in personal interviews, and acknowledged variance in interviewers' interpersonal skills and abilities to build rapport (Feldman et al. 1951; Garbarski et al. 2016; Goudy and Potter 1975). Moreover, interviewers may more or less strictly stick to standardized interviewing without providing additional help (Massing and Ackermann-Piek 2014). These behaviors may not only influence data quality (Bruckmeier et al. 2015; Haan et al. 2013), but also whether respondents enjoy the interview.
Finally, interviewers' motivation may also play a role. Intrinsically motivated employees work because they enjoy doing the tasks at hand (Ryan and Deci 2000). Research has shown that intrinsic motivation is positively linked to work performance and engagement, while negatively linked to undesirable behaviors such as absenteeism and deviant behavior (e.g., Chullen et al. 2010; Michel and Hargis 2017; Ryan and Deci 2000). Thus, interviewers with high intrinsic work motivation may make more of an effort to do a good job. As Cleary et al. (1981) argue, how enthusiastic an interviewer is in the interaction with the respondent may make a difference in the respondent’s perception of the interview.
Moreover, an interviewer’s motivation may spill over to respondents. Spillover effects not only relate to domains (e.g., from work to family), but also to people (Frey 1997), affecting motivation in coworkers, customers, or peers. Poorly motivated interviewers may broadcast their low levels of motivation to respondents, who will consequently perceive the interview as less pleasant. Research has shown that interviewees' and interviewers' response behavior are related (Pickery and Loosveldt 2001; Wuyts and Loosveldt 2017): Item nonresponse is higher if interviews are administered by interviewers who themselves did not answer this item in a related survey, and interview speed is higher if interviewers themselves were faster at completing the survey. This may be because interviewers who are not interested in the study may want to finish their task faster or presume that the respondent is also not interested and try to conduct the interview as quickly as possible. Respondents may sense this rush through the questionnaire and perceive the interview as less pleasant.
Data and Methods
Our analysis is based on data from pairfam, a randomly sampled German panel study with a focus on intimate relationships and family. The panel consists of initially more than 12,000 individuals of the three birth cohorts 1971–1973, 1981–1983, and 1991–1993 who have been interviewed face-to-face annually since 2008. For study details, see Huinink et al. (2011), and Brüderl et al. (2022b); for questionnaire content, see Pairfam Group (2022).
We use data from Release 13.0 (Brüderl et al. 2022a), combined with data from a survey of the pairfam interviewers that was conducted by the survey agency responsible for the fieldwork as an online survey before wave 9 in October 2016. Participation was voluntary and not incentivized. The survey included questions about the interviewers' background and experiences in the data collection as well as their attitudes and specific behaviors during the interview.
Of the 241 interviewers assigned to wave 9, 195 (81%) participated in the interviewer survey. The analysis is restricted to respondents of wave 9 who were interviewed by participating interviewers (4,479 out of 5,127 respondents). Due to missing values in the dependent variable (Nrespondents = 11), independent variables on respondent level (Nrespondents = 197) and independent variables on interviewer level (Ninterviewer = 9, Nrespondent = 173), the analytical sample comprises 4,111 respondents interviewed by 186 interviewers.
The dependent variable interview pleasantness is based on a question asked by the interviewer at the end of the interview whether respondents enjoyed the interview (“How did you like the interview”?) with a response scale from “not at all” (1) to “a lot” (5). As the distribution of the variable is skewed with the majority (75%) indicating that they liked the interview a lot (see Online Appendix, Figure A1), we construct a dichotomous variable differentiating between the maximum value (i.e., a very pleasant interview experience) and lower values.
To account for the hierarchical structure of the data (respondents are nested within interviewers) and for the dichotomous nature of the dependent variable, we apply a multilevel logistic regression model (e.g., Hox et al. 2010), which allows for residual components at the respondent and interviewer level. To measure interviewer effects, we calculate the intra-class correlation coefficient (ICC or ρ). In multilevel logistic models, the ICC is defined as
At the interviewer level, we include the following sociodemographic characteristics: sex, age (years), education (with dummies for low, middle, and high level 1 ), and interviewer experience (years). To test whether respondents' evaluation of the interview depends on the interplay between respondent and interviewer characteristic, we include an interaction term of interviewer’s and respondent’s sex as well as interaction terms of interviewer’s and respondent’s education. Interviewer’s and respondent’s age is not interacted, as most interviewers are much older than respondents so there is not enough overlap to test whether interviews are perceived more positively if interviewer and respondent are the same age. For descriptive statistics of interviewer characteristics, see Table A1 in the Online Appendix.
To capture interviewers’ intrinsic motivation (work motivation: interest), we use an item from a question concerning work motivation. Interviewers were asked how important several factors, such as “interesting task,” “income,” and “flexible work hours,” were for their decision to work as an interviewer, with an answer scale from “not at all important” (1) to “very important” (5). The interviewers' rating of the factor “interesting task” was used to capture their intrinsic motivation. Moreover, we assume interest in the specific questionnaire to be another dimension of intrinsic motivation and use the question “How interesting do you find the interview yourself”? with a 5-point response scale (“not at all interesting” [1] to “very interesting” [5]) as a measure.
Further, we include interviewers’ emotional attitude toward respondents measured with the item “With most panel respondents an amicable relationship develops” on a 4-point answer scale (“totally agree,” “somewhat agree,” “somewhat disagree,” “totally disagree”). The variable was recoded, so that higher values indicate a more positive attitude.
Interviewers’ behavior is captured by two variables: Supportive behavior is an additive index consisting of three items on supportive behavior: (1) “If a respondent has problems with a question I read the exact wording of the question again”; (2) “If I realize that the respondent has problems to understand the question I speak more slowly”; and (3) “If a respondent doesn’t understand a question I explain what is meant by the question” (4-point response scale: “not at all,” “rather not,” “somewhat,” “absolutely”). The resulting index ranges from 1 to 4, with higher values indicating more support by the interviewer. The second variable capturing behavior is chatting with respondents, measured by the item “Usually I chat with respondents also about things beyond the interview” (4-point response scale: “totally agree,” “somewhat agree,” “somewhat disagree,” “totally disagree,” recoded so that higher values indicate more chatting with respondents).
As pairfam has no interpenetrated design with random assignment of respondents to interviewers, we include respondent-level control variables in all models to avoid the possibility that estimated interviewer effects are biased by sample composition differences between the subsamples worked by different interviewers. For descriptive statistics of these variables, see Table A2 in the Online Appendix.
Similarly, we account for differences in questionnaire content and length due to routing in the interview. Variables are included to indicate whether the respondent was posed repetitive questions or questions that might be perceived as unpleasant. For instance, in the case of separation, questions concerning infidelity and domestic violence are asked. Moreover, we control for the presence of third persons during the interview, which might impact respondents' assessment of the interview (see Online Appendix, Table A2 for an overview of included variables).
The interviews conducted by 56 of the 241 interviewers (23%) were excluded from the analysis due to unit or item nonresponse in the interviewer survey. These interviewers do not differ significantly in sex and age from interviewers who are part of the analysis (see Table A3). However, they tend to be more educated, and interviews conducted by these interviewers are less often perceived as pleasant. This finding implies a potential self-selection of less educated and better performing interviewers into the interviewer survey. Therefore, we also run models with all interviewers, including those with nonresponse, as a robustness check. Results do not change substantially (see Online Appendix, Table A5).
Results
Table 1 shows the results of the multilevel logistic models. We present average marginal effects (AMEs) of the interviewer level variables. Logit coefficients of all variables can be found in Table A4 in the Online Appendix. Model 1 controls only for respondent and interview characteristics to estimate interviewer effects without bias from differences in sample composition between interviewers. The ICC in this baseline model is 0.32, indicating that pleasantness ratings are influenced by the interviewers to a substantive 2 degree: 32% of the residual variance in the underlying propensity to rate the interview as very pleasant are due to differences between interviewers, while the remaining 68% are attributable to differences between respondents (for a description of ICC interpretation, see, e.g., Austin and Merlo 2017).
Average Marginal Effects of Interviewer Characteristics on Respondents’ Assessment of Interview Pleasantness.
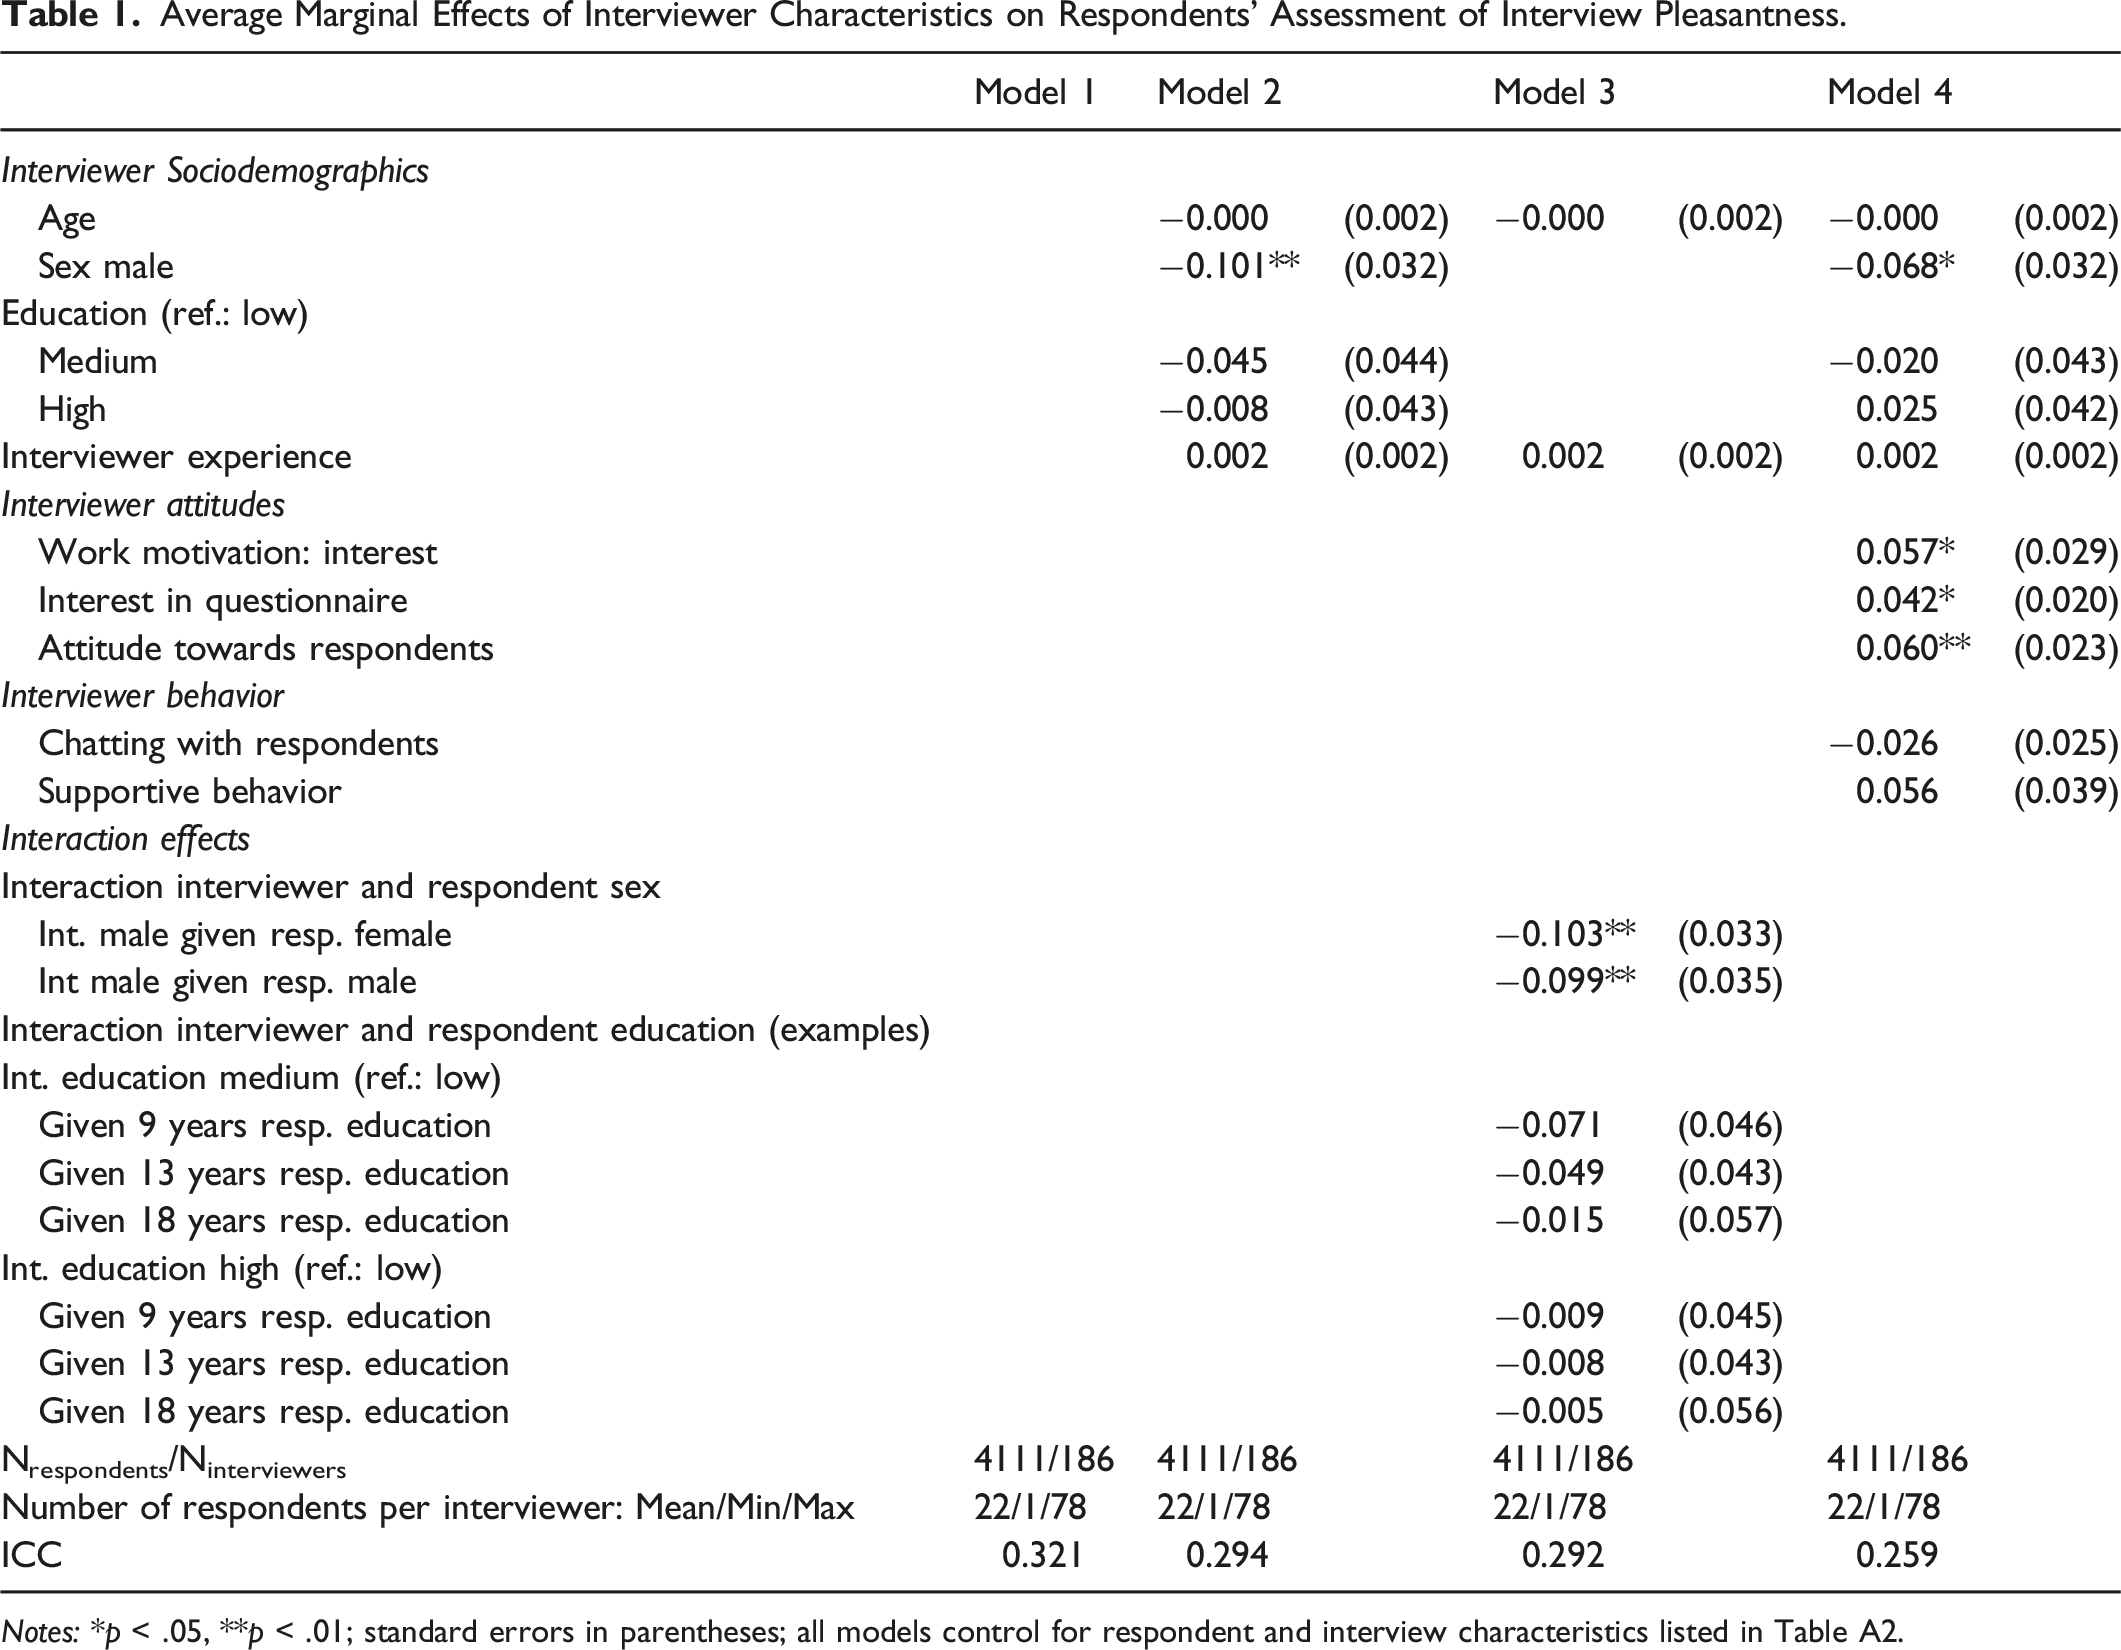
Notes: *p < .05, **p < .01; standard errors in parentheses; all models control for respondent and interview characteristics listed in Table A2.
Model 2 includes interviewer sociodemographic characteristics in addition to the variables of Model 1. We find no significant effects of interviewer age and education, but interviews are rated as less pleasant in the case of a male (compared to a female) interviewer. Specifically, the AME of −0.101 means that the probability of rating the interview as very pleasant is on average 10 percentage points lower if the interviewer is male. The inclusion of interviewer characteristics into the model reduces the ICC to 29%; thus, differences in respondents' pleasantness ratings are partly due to interviewers' sociodemographic characteristics.
Next, we consider interactions between interviewer and respondent characteristics (Model 3). Note that as AMEs cannot be calculated separately for the main effects and the interaction term, effects of the interviewer variable are calculated at different values of the respondent variable and compared (Mize 2019). In case of the sex interaction, the effect of interviewer’s sex is calculated for male and female respondents. Effects are almost equal, and a significance test indicates that the difference is not significant (Δ AME = 0.004; se = 0.025; p = .877). For the metric variable respondents’ years of education, we give examples for the AME of interviewers' level of education at three different levels of respondents' education in Table 1. The full results are displayed in Figure A2 in the Online Appendix. No significant interaction effects are found for education (significance tests not shown). Moreover, adding the interaction effects to the model decreases the ICC only marginally. Therefore, we do not include the interaction terms in the subsequent analyses.
In Model 4, we add interviewers' attitudes and behavior. The attitude variables show significant effects: If the interviewer scores higher on “work motivation interest” and is more interested in the questionnaire respondents are more likely to rate the interview as very pleasant. Similarly, the more positive an interviewer's attitude towards respondents in general, the more likely is a positive rating. Concerning the behavior variables, in contrast, we found no significant effects. Neither a general tendency of interviewers to chat with respondents nor supportive behavior during interviews affects interview pleasantness. The inclusion of interviewers' attitudes and behavior further reduces the ICC to 0.26 (Model 4). Hence, although interviewers' attitudes and behavior explain part of the interviewer effect, about 26% of the residual variance in the underlying propensity to enjoy the interview is still due to unobserved differences between interviewers.
Discussion
The aim of our analysis was to investigate interviewer effects on respondents' subjective assessment of the pleasantness of the interview and to explain these effects based on interviewer characteristics. We combined data from wave 9 of pairfam with an interviewer survey fielded before this wave and applied multilevel logistic models accounting for both respondent and interviewer influences.
We found that interviewers have a great impact on whether respondents enjoy the interview. About one-third of the variation in interview pleasantness is due to differences between interviewers. These results are consistent with the argument of Pickery et al. (2001) that interviewers may influence the pleasantness of interviews.
In a second step, we investigated whether these interviewer effects can be explained by interviewer characteristics. We found that respondents rate interviews conducted by women more positively, which is in line with evidence that female interviewers are more often perceived as “friendly” (Fowler and Mangione 1998). No other sociodemographic characteristics proved significant. This is not unexpected, as existing evidence on the effect of interviewers' sociodemographic characteristics on survey outcomes is ambiguous (e.g., Mensch and Kandel 1988; Nedelec 2017; for a review, see West and Blom 2017).
Interviewers' attitudes (i.e., work motivation and interest in the questionnaire), were found to positively affect interview pleasantness, presumably due to spillover effects (Frey 1997) of interviewers' motivation to respondents. We also found a positive effect of interviewers' positive emotional attitudes toward respondents in general. In contrast, interviewer behavior (chatting with respondents and supportive behaviors) had no significant effect on respondents' ratings of interview pleasantness.
By controlling for interviewer characteristics, the share of variation in the dependent variable due to unobserved differences between interviewers was reduced from initially 32%–26%. Hence, interviewer characteristics partly explain the interviewer effects in our model, but a substantial share of variation remains unexplained.
Our results imply that respondents' interview experience could be enhanced by improvements in interviewer selection and training. With the aim of optimizing interview pleasantness, hiring priority should be given to women and those with high intrinsic motivation and a positive attitude toward respondents. Regarding existing interviewer staff, interviewer training should aim at increasing intrinsic motivation and interest in the specific study.
Our study is not without limitations. First, our conclusion would be challenged if respondents' answers to the interview assessment question suffered from a social desirability bias associated with interviewer characteristics. If respondents were, for example, more likely to give socially desirable answers to female than to male interviewers, the effect of interviewers' sex could, in an extreme case, only reflect a bias in reporting behavior instead of capturing a real effect.
Second, the answers to the interviewer survey could also suffer from a social desirability bias. However, it seems unlikely that such a bias could cause the observed effects of interviewer characteristics. Rather, it might be a reason for the missing effect of interviewer behavior. Interviewers are certainly aware of desirable behavior, and some might edit their answers according to the trained interviewing standards, even if they do not behave accordingly. The statistical noise produced might conceal effects of interviewer behavior.
Moreover, as pairfam has no interpenetrated design, interviewer effects could be caused by confounding factors although we tried to minimize this bias by including a number of respondent-level variables. There are alternative approaches to modeling such data (e.g., Elliott et al. 2022) that may be promising.
Finally, a drawback of this study is the highly skewed distribution of the dependent variable. Besides social desirability, one factor contributing to this skewness may be that we use data from the ninth wave of the panel (pleasantness assessment is available from wave three on but interviewer survey data only for wave 9). Due to selective attrition, mainly respondents who enjoy being interviewed may be left after several waves. Therefore, it is remarkable that even at the ninth wave of the panel, with a largely stable question program, we find interviewer-influenced differences in respondents' pleasantness ratings.
Opportunities for future research arise from our results. First, this investigation should be repeated with a first panel wave or a cross-sectional survey, where we would expect more variance in respondents' survey assessments and larger interviewer effects. Second, in an experiment, the assessment question could be placed in a CASI module for some respondents while continuing it as part of the CAPI program for a control group to test whether respondents' assessment is affected by social desirability bias. Third, more detailed measures on respondents' perception of the interviewer, such as competency or friendliness, could shed light on additional factors driving interviewer effects in respondents' interview assessment.
Most importantly, only the first part of Pickery et al.’s (2001) argument has been tested here. After it has been confirmed that interviewers affect respondents' interview pleasantness perceptions, the link between interview pleasantness and survey outcomes such as data quality and future panel participation remains to be shown.
Footnotes
Declaration of Conflicting Interests
The author(s) declared no potential conflicts of interest with respect to the research, authorship, and/or publication of this article.
Funding
The author(s) received no financial support for the research, authorship, and/or publication of this article.