
Abstract
Agricultural studies mainly rely on quantitative research approaches. Despite growing interest in and uptake of qualitative, participatory, and visual methods due to their perceived advantages in gathering in-depth information and empowering participants, visual–digital research methods have yet to be largely applied. In our study on adaptation strategies to climate change among smallholder farmers in Uganda we compared different data collection methods, including: semi-structured interviews with manual note-taking, participatory impact diagrams, and adapted photovoice and cellphilm methodologies.
Introduction
Community-based participatory research (CBPR) has become a popular approach for identifying community needs and developing strategic plans to address those needs (Bulla and Steelman 2016; McOmber et al. 2022). Many CBPR methods rely on visualization techniques. The rise of inexpensive and small smartphones, including in low-income countries (GSMA 2019), now generates new potentials for further advancing visualization in CBPR.
In social sciences, smartphones and digital cameras have become a common research tool for visualization (e.g., Jarldorn 2019; Mitchell et al. 2016; Wilhoit and Kisselburgh 2016). Research on how farmers adapt to climate change, though, mainly relies on quantitative research methods like household surveys (e.g., Bernier et al. 2015; Bryan et al. 2009; Fisher et al. 2019). While these surveys are well suited for generating statistically representative data, they have a rather rigid and predetermined character, which can prevent the collection of unexpected but highly relevant information (Hinthorne 2012) that cannot be anticipated by the researchers when designing the method. Moreover, adaptation to climate change depends on environmental and geographic circumstances and therefore cannot easily be captured with generic surveys.
Qualitative participatory and visual (digital) methods can add more in-depth information to many research fields since they are flexible, can evoke tacit knowledge (Kariuki and Njuki 2013; Pain 2012; Warr et al. 2016) and produce unexpected, even surprising data (Berbés-Blázquez 2012). Visual methods can also enhance participants’ reflection on their behavior (Gotschi et al. 2009; Wilhoit and Kisselburgh 2016), and can foster knowledge exchange and empower participants (George et al. 2018; Jarldorn 2019; Koningstein and Azadegan 2021; Mapfumo et al. 2013).
In this case study on climate-smart agriculture (CSA) farming in Ugandan rural communities, we investigate the potential of visual digital methods (photovoice and cellphilms) that can be used in CBPR and compare them to a more traditional visual method (participatory impact diagrams) and a nonvisual method (interviews with manual note-taking). We examine their advantages and disadvantages specifically on aspects relevant to the adaptation to and mitigation of climate change in complex contexts of smallholder farmers.
Photovoice involves taking photographs and discussing them to better understand people’s perceptions and their community’s strengths and problems and to boost critical dialog and collective change (Wang and Burris 1997). Cellphilms are a subcategory of participatory video (Lunch and Lunch 2006). They are short videos (a few minutes) filmed by participants using mobile phones (Dennison 2019). Participatory impact diagrams or similar drawings are usually created by study participants or by facilitators in dialog with them and depict the impact of certain actions (Kariuki and Njuki 2013; McOmber et al. 2022). The particular implementation of each of these methods varies, which is considered a positive due to their flexibility (Kariuki and Njuki 2013). Consequently, definitions of these methods vary as well and will be expounded on in the literature section.
Many agricultural practices are visible and tangible (e.g., one can observe and measure the growth and development of crops). Therefore, combining agricultural research with visual methods is promising. Furthermore, people living in rural areas may be more familiar with visual descriptions than written ones.
Some studies on agriculture or environment have used photovoice, but just a few focused on climate change adaptation (e.g., Bulla and Steelman 2016). Cellphilms have, to our knowledge, not yet been applied in these research fields, thus their potential in this regard is relatively unknown (a noteworthy exception of a study using photovoice is Gervais and Rivard 2013).
In this article, we share our experience in implementing this approach and explore its value for future research designs.
Literature
In semistructured interviews, interviewers ask predetermined questions, but have the freedom to probe for further explanations from interviewees (Berg 2001). Usually, the facilitators take manual notes or record the interviews—visualization is rare. Such interviews are commonly used in agricultural research (e.g., Ayal and Leal Filho 2017; Gandure et al. 2013)
Participatory impact diagrams (PID) are visualization tools in participatory studies (Kariuki and Njuki 2013). These diagrams are often used for evaluating development programs; their main aim is to visualize the causal chains of effect of particular actions or events. PIDs are adaptable to various contexts, which makes them a highly flexible tool to work with. The diagram can be drawn by the facilitator or the participants themselves and can include qualitative as well as quantitative data and perspectives from different stakeholders.
Photovoice has been used in various parts of the world to identify, represent, and analyze issues within a community. Participants analyze their own lives, communities, and environments through photographs, which are then shared, along with the stories that they represent, to relevant stakeholders. Taking pictures and interpreting them does not require alphabetization, which makes it an attractive visualizing tool to work with people who cannot read or write. Pictures thus can serve as a bridge to overcome the gap of written expression (Pain 2012). Daum et al. (2019) found that people with low (digital) literacy as well as very old people had no problems using a smartphone app, which supports the suitability of smartphones for research in various contexts. The photovoice method was developed by Wang and Burris (1997) in a project with women in rural China, where they provided digital cameras to participants and used photovoice successfully to inform and influence improvements in women’s health.
Most photovoice studies used single-use or digital cameras (see Berbés-Blazquez 2012; Bulla and Steelman 2016; Gervais and Rivard 2013; Gotschi et al. 2009; Jarldorn 2019). The main goals of photovoice are to enable participants to identify and reflect on their community’s strengths and weaknesses, and to effectively influence policy-making (Wang and Burris 1997). However, little reflection about the ethical issue of providing short-term technology (like taking back distributed devices or using single-use cameras) could be found. An exception is the article by Jarldorn (2019). While she intended to provide participants with equal tools, most of her study participants rejected the provided cameras and used their own mobile phones instead. She found that the cameras would not provide long-term empowerment and recognize participants’ new-gained expertise.
Researchers using photovoice methods usually print the photographs and either organize an exhibition, or encourage participants to do so. Jarldorn (2019) describes photovoice as a “creative and inclusive approach[es], where research is seen as a two-way process between participant and researcher” (Jarldorn 2019:35) that aims at contextualizing the results and is of particular relevance for feminist research. Gotschi et al. (2009) highlight the benefit of pictures to initiate not only self-reflection among participants, but also enabling the researchers to gain insights into people’s concerns through their perspective. However, visual methods and videos in particular may offer the problem of surveillance (through the researcher) and therefore involve the risk of manifesting ethical imbalances between researchers and the researched (Wilhoit and Kisselburgh 2016).
According to MacEntee et al. (2016), Dockney and Tomaselli in 2009 invented the term cellphilm by combining two words—cellphone and film—to describe the combination of multiple communication technologies in one handheld device. It functions similarly to photovoice but relies on movies instead of pictures. Mitchell et al. (2016), for example, asked teachers in a rural community to document what they believed to be the most critical issues in their schools, or in the context of HIV and AIDS.
Methodology
Research Process
We conducted the study in five districts 1 in central Uganda, namely Nakasongola, Kalungu, Bukomansimbi, Mubende, and Kiboga. Our case study aimed to investigate if digital visual tools may be advantageous over analog tools in eliciting information about climate change adaptation strategies.
In consultation with the district production officer (DPO) in each district, we selected three active farmer groups (one women’s group, one men’s, and one youth group) from three different villages. The groups were located in different villages to minimize the possibility of random interaction between participants during the study.
The research process in each district was scheduled for six days: On the first two days, we met each group for an initial interview where we introduced the purpose of the study and the smartphone activity. On the following days, farmers recorded their adaptation strategies on photos and cellphilms. We watched the recordings of participants within each group during a second group discussion meeting and finally brought all three groups of a district together for a joint discussion at the end of the research week.
During the initial group interview, we asked members if they had noticed a change in weather patterns over time, how they had been experiencing these changes, and how this impacted their work as farmers and their daily lives. We explored participants' adaptation strategies and drew PIDs or took notes of their answers (without visualization). By asking how the farmers cope with climatic changes, we extended the original application of PIDs, which generally focuses on impacts and not on adaptation. Figure 1 shows an example PID. Example of a participatory impact diagram. Source: Author.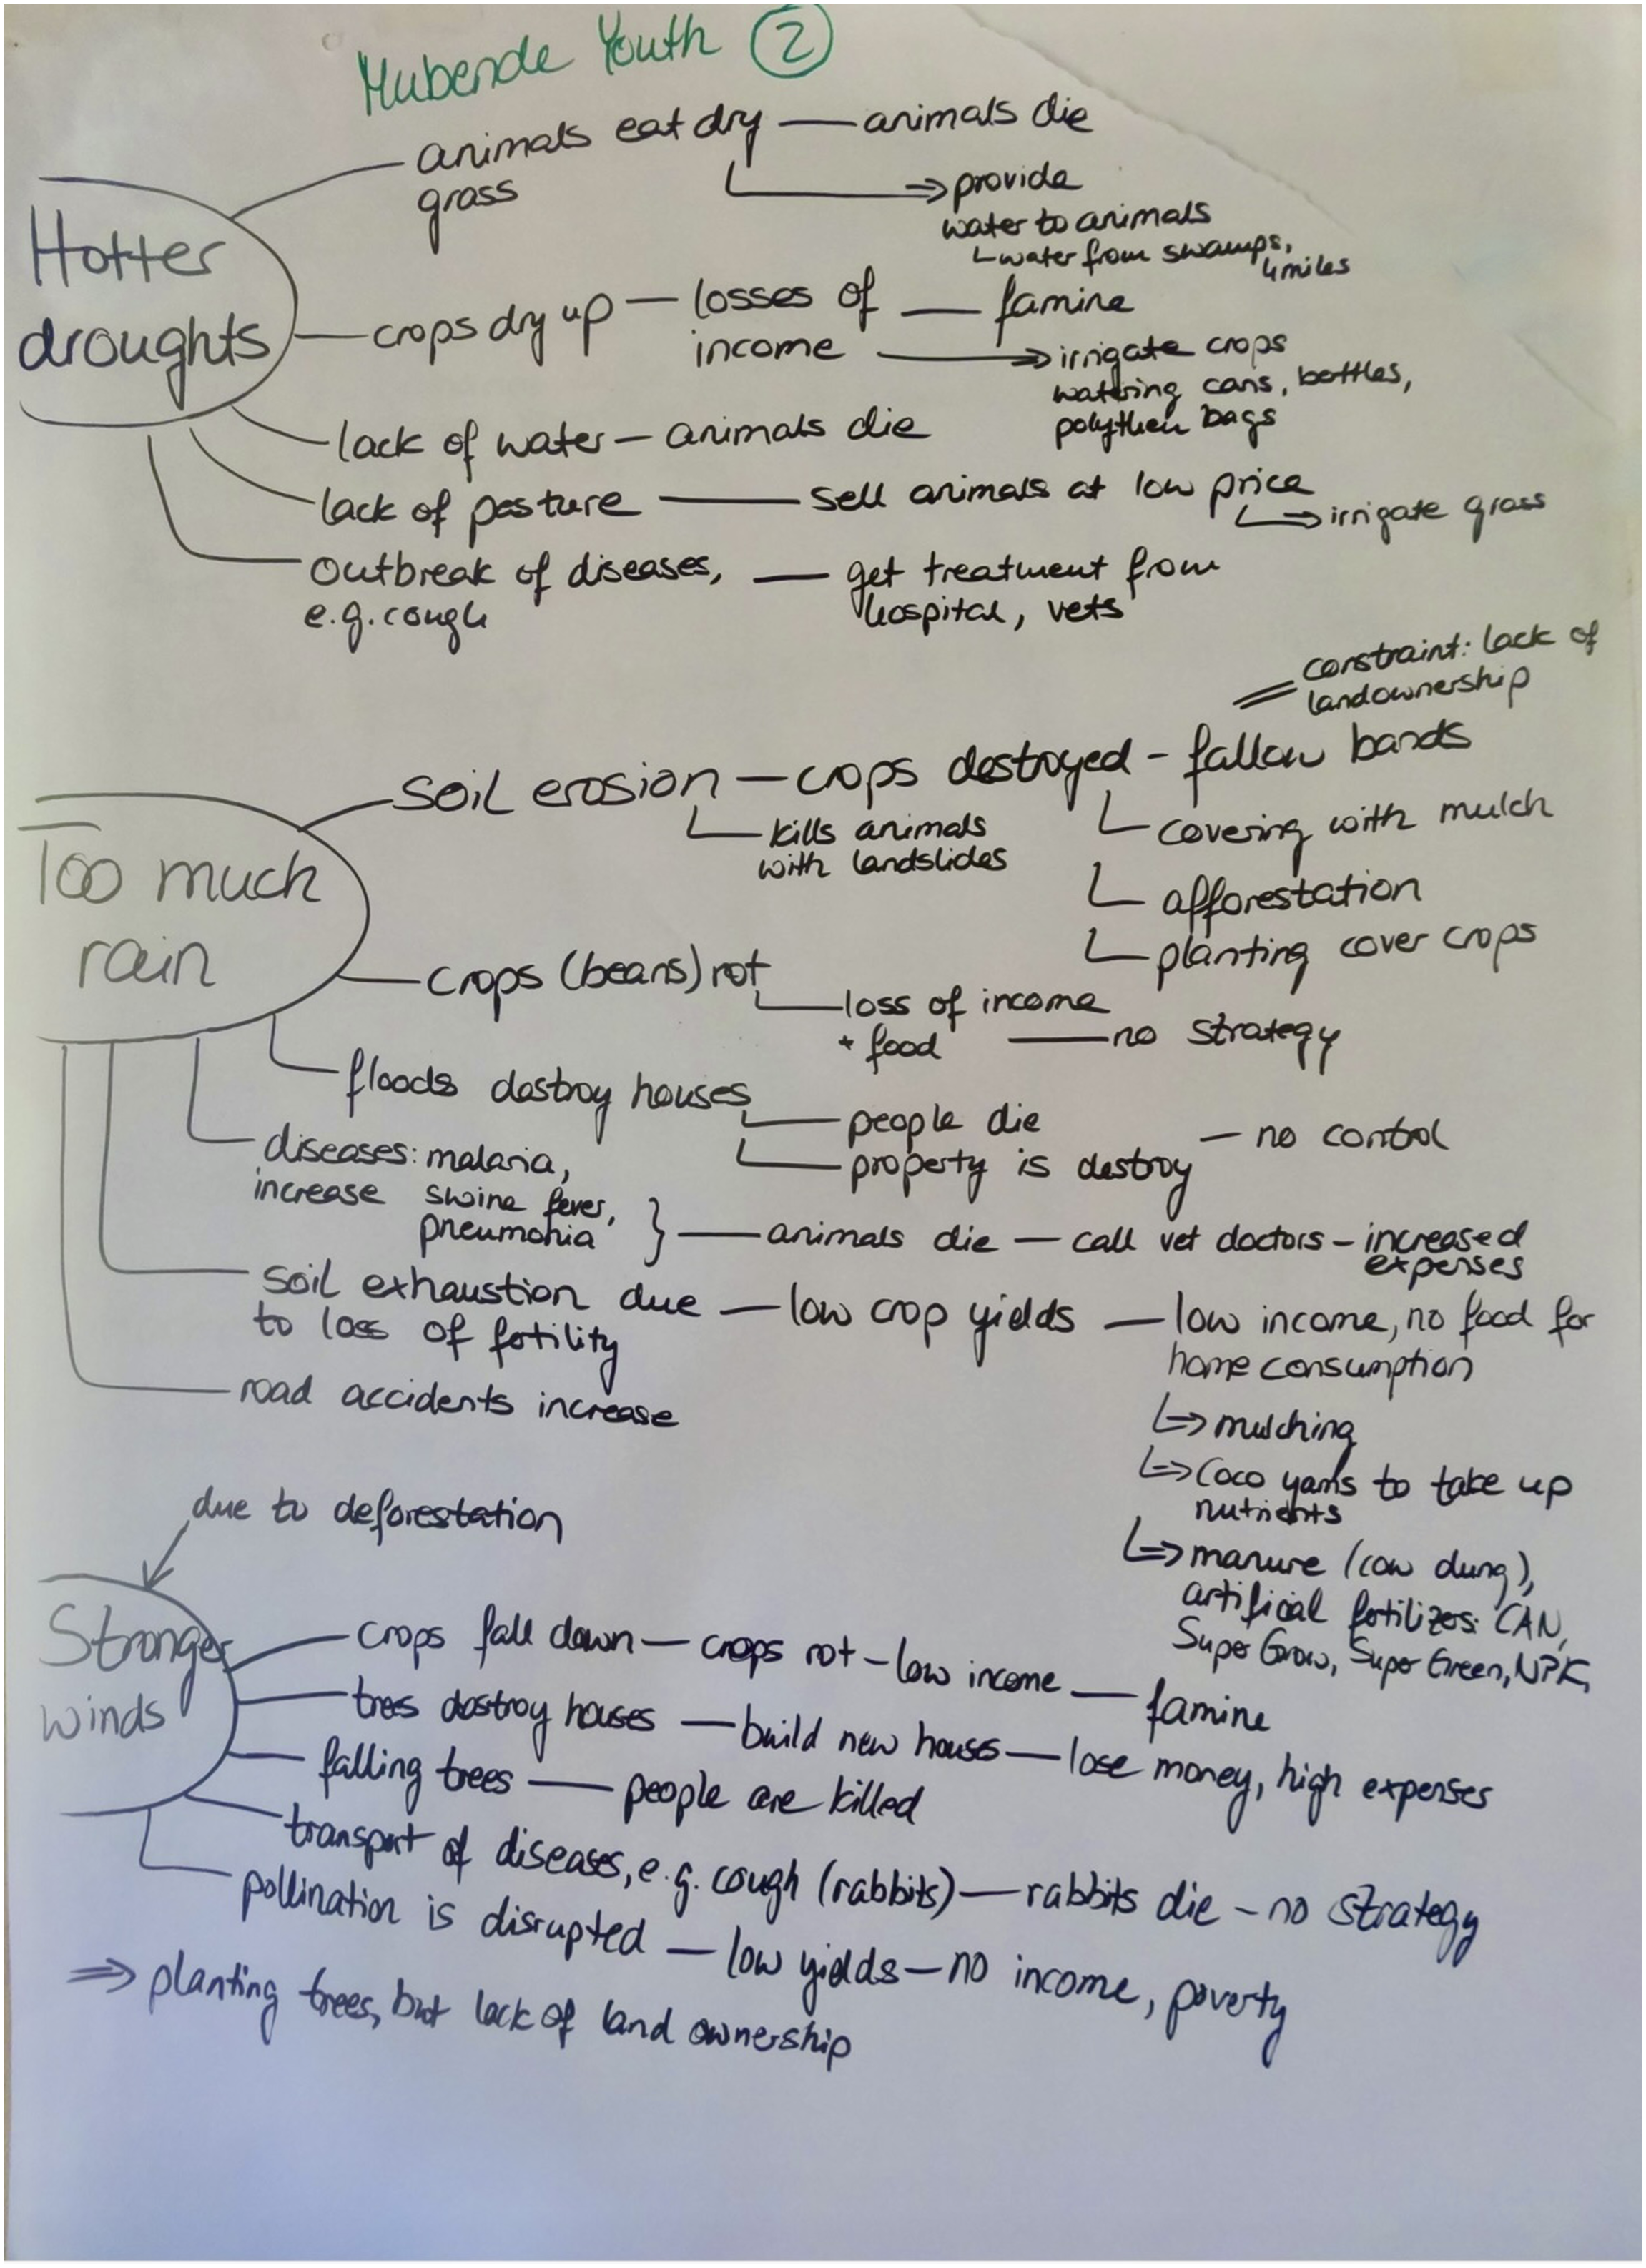
We then provided five–12 smartphones to volunteers of each group and showed them how to take photos and videos. We asked participants to record their adaptation strategies—those mentioned during the interview as well as methods that they may not have mentioned yet. We also talked about the ethics of taking photos, explaining that taking pictures or videos of people without their consent or recording private information should not be done.
On the second and third days, we visited the groups again to offer technical advice. We looked at some of the recordings and gave feedback on the quality (e.g., showing how to keep still when releasing the shutter) as well as the presentation of details (e.g., when they talked about a practice such as pest-prevention strategies, we suggested ways to show how they apply it). The next day, we collected the smartphones. For the second group discussions, our research team selected at least one photo or video from each participant for the screening. To avoid lengthy screenings, we kept the selections to about 20 recordings. We looked at the pictures and videos with participants using a portable and battery-run projector. After each recording, we asked participants questions such as “What/which practice do we see here?” to encourage them to further explain their practices and adaptation strategies. These explanations contributed to a first analysis of applied CSA practices.
In the last meeting, all three groups of a district came together for a joint discussion and presented their most preferred practices to each other. We encouraged members to ask questions and engage in discussions. A feedback round completed these meetings and the whole research week.
Analysis
We examined our different interviewing techniques based on criteria drawn from existing literature (Wang and Burris 1997) and inductively developed additional criteria based on both, literature review (e.g., Bulla and Steelman 2016) and our own observations. Wang and Burris (1997) framed “identification of strengths and weaknesses,” “promotion of critical dialog,” and “reaching policymakers” as the main goals of the photovoice technique—the first two of which we translated to our comparison criteria. Assessing the effectiveness in “reaching policymakers” was beyond the scope of our study design, as we did not present the results to decision-makers. The further criteria include “equal participation and empowerment,” “richness of information,” and “prerequisites” as these aspects emerged of particular importance.
Results
Methodological Comparison.
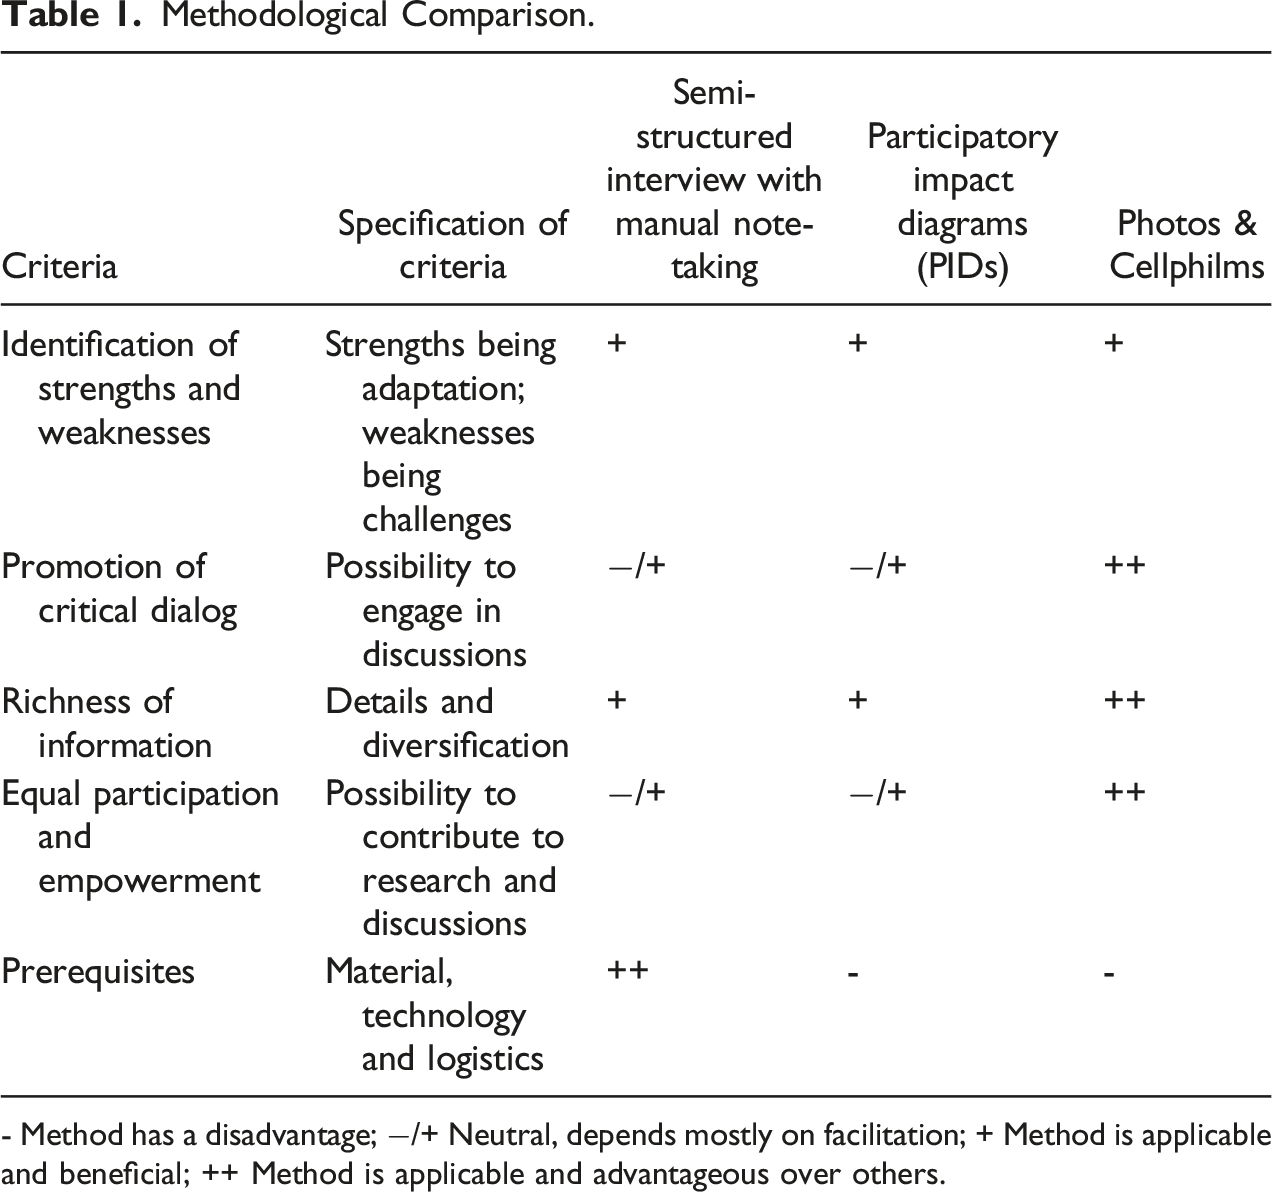
- Method has a disadvantage; −/+ Neutral, depends mostly on facilitation; + Method is applicable and beneficial; ++ Method is applicable and advantageous over others.
Identification of Strengths and Weaknesses
In our interviews, we asked participants how they experience climate change, how it affects them (“challenges”), and how they adapt to it (“strengths”). Afterward, we asked participants to record their adaptation strategies (strengths) in photos and videos, however, they also recorded their problems (weaknesses). Participants identified challenges regarding their farming as well as challenges concerning the community (see Gotschi et al. 2009). For example, some farmers used the cellphilms to tell their stories about how new pests have emerged and affected their crops and livestock, or how prolonged droughts have forced them to move longer distances in search of water. As adaptation strategies, they captured, for example, the application of self-made pesticides or digging trenches as a way to collect water and avoid soil erosion. Availability of water was often seen as both a personal and a communal challenge.
Promotion of Critical Dialog
In our second meeting with each group, participants engaged actively in the discussions around their photos and videos. The recordings stimulated the exchange of knowledge and experiences and revealed topics that would not have come up without the recordings. This observation resonates with study results by Gotschi et al. (2009) and emphasizes the additional value of visualization. Participants used these meetings to learn from each other (e.g., which trees are beneficial to integrate in agroforestry systems) and to exchange experiences with varying ingredients of homemade medicine for their livestock.
Apart from such technical details, participants encouraged each other to work collectively or to focus on certain practices in the future (e.g., water conservation techniques). The discussions thus enabled participants to reflect on common challenges, concerning the group or community—affirming Gotschi et al. (2009:305) and their conclusion: “Being able to ‘see’ and point at conditions and sections portrayed in pictures turned abstract discussions into concrete and comprehensive reality, and the pictures created a new frame of reference for both the farmers and the researcher.”
Richness of Information
Number of Climate-smart Practices Elicited by Different Methods within Different Gender Groups.
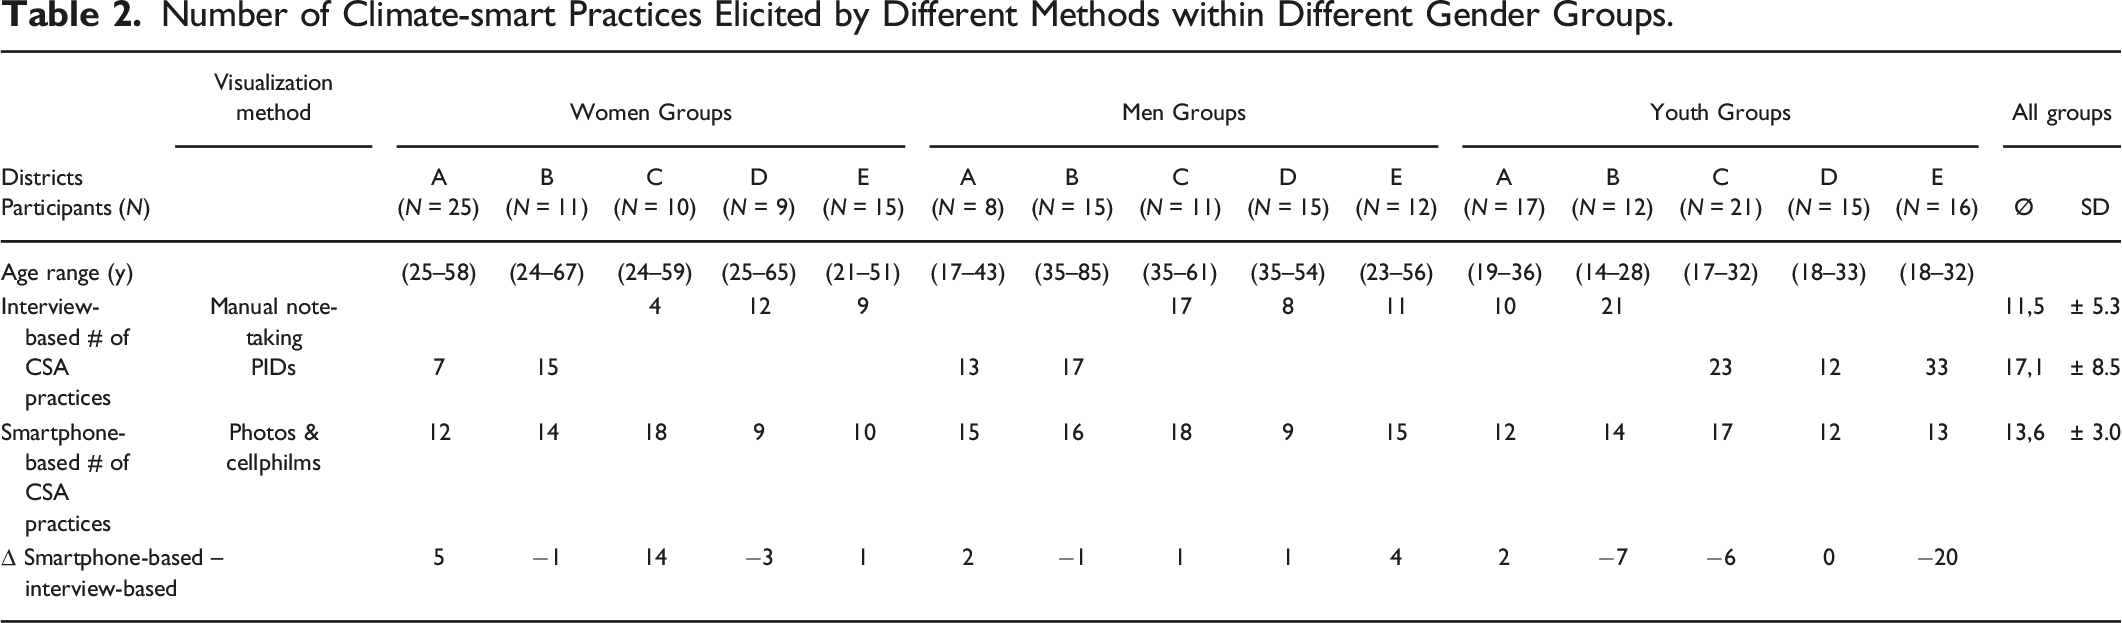
In seven of the groups, we used PIDs (participatory impact diagrams) as the interview method; in eight groups, no visualization technique (manual note-taking) was used during the interview. The smartphone-based method was carried out after the interviews in all 15 groups.
Using PIDs, participants reported the highest number of practices, on average 17.1, followed by the smartphone-based collection and interviews with manual note-taking. This could be due to the combined effects of collective brainstorming and visualization. However, the high score for PIDs is mostly due to the good performance in the youth groups. Women and men in most districts recorded more practices in videos and photos than reported in the interview sessions. Women especially reported fewer adaptation practices during the interviews, but the number of their recorded practices is similar to the ones of the other groups. For the youth groups, the photos and videos did not generate any new practice after the PIDs, only in one of the districts after the interview with manual note-taking. A reason might be that the youth groups were very efficient in collecting ideas and communicating them.
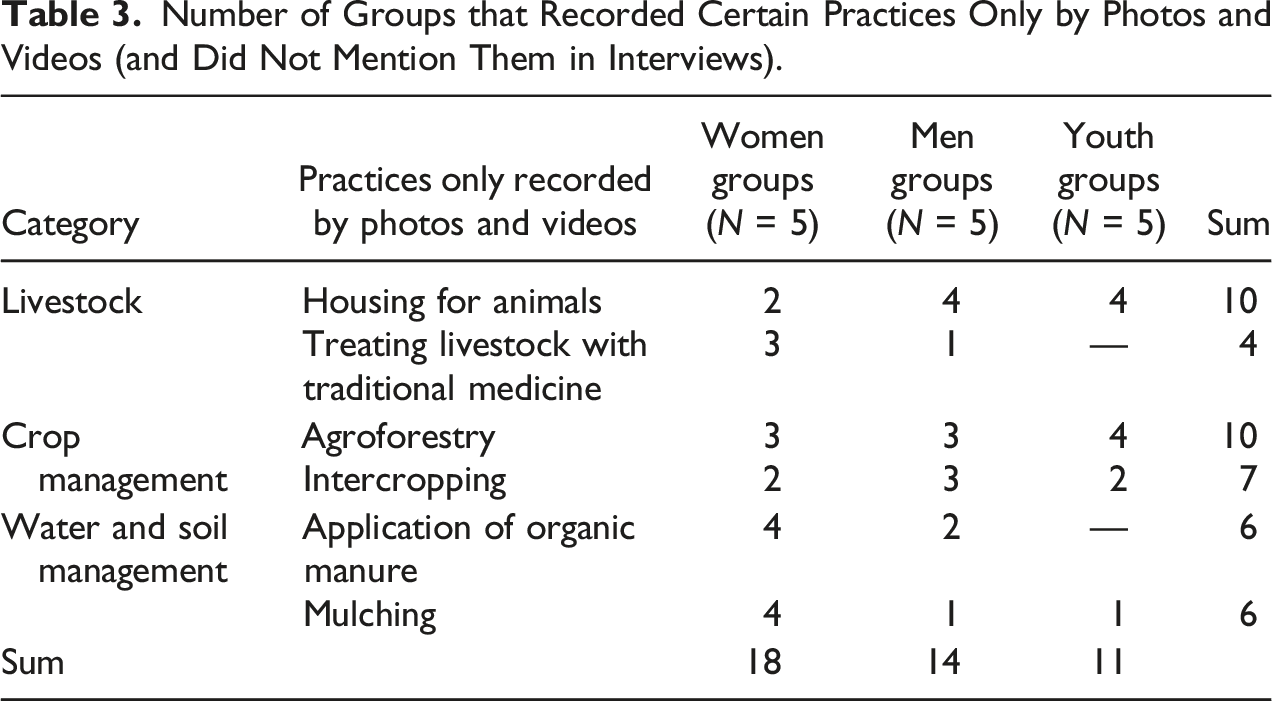
However, the photos and cellphilms revealed further (individually different) strategies and more details about the strategies in all groups, which resonates with findings from Gotschi et al. (2009). Unlike PIDs, which trigger swarm intelligence, the digital tools evoked the individual tacit “how”-knowledge, beyond the explicit “what”-knowledge, as defined by Ryle (1946) and confirmed by Masterson et al. (2018). For example, participants told us that they collect manure from their livestock. That some collect it in holes and add other organic matter to it—producing a kind of compost—became clear only after they had taken pictures or a video of it. Also, participants viewed agroforestry as a diversification strategy, not as a climate-smart practice. Therefore, many groups did not mention agroforestry as an adaptation practice during the interviews—however, participants took photos and videos of their trees and agroforestry systems.
Number of Groups that Recorded Certain Practices Only by Photos and Videos (and Did Not Mention Them in Interviews).
Pictures and videos visualize very complex information, which can challenge external analysis. This challenge is met by the photovoice technique by including the participants in the analysis process. In our study, participants were involved in a first analysis of the data by explaining their practices in more detail during the second group meetings and by exchanging related knowledge in the final discussion. Furthermore, photovoice “offers an opportunity to develop significant theoretical insights related to place-based understandings of extreme events not accessible via conventional methods,” as Schumann et al. (2019:286) put it. The individual details of farmers’ practices significantly contribute to the richness of information gathered—this may be true for any research field, especially for environmental, geographical and agricultural research.
While participating farmers were not able to show all their adaptation strategies in the cellphilms and pictures due to the seasonal aspect of farm chores, many used the videos to verbally explain what they had done earlier in the year or were planning to do in future. The limiting aspect of seasonality could, however, be overcome by longer-term studies with repeated smartphone excercises. Despite the impossibility of recording everything that seemed relevant to them, farmers showed great enthusiasm for participation. This, however, also led to a high number of recordings, although we had asked participants to limit it to 20 recordings each. A greater number of recordings did not result in more adaptation strategies being captured, but rather many pictures of the same situations.
Equal Participation and Empowerment
We motivated and let all farmers participate in the interviews equally. The smartphone-based task put a higher focus on individuals’ perceptions and experiences, which could not always be included in the group interviews. The screening sessions consisted of at least one recording of each participant, thereby creating space for every farmer to participate actively. Participants who were rather silent during the first interviews now contributed to the discussions—the smartphones helped them participate and express themselves, demonstrating that spoken words are not everyone’s preferred means of expression. As participants had almost two days to record their practices, it extended their reflection phase, which potentially added information that otherwise would have stayed unobserved. A different interpretation following Oldrup and Carstensen (2012), may be that images always reflect reality from the photographer’s perspective plus in a certain moment, enabling the recording of sudden ideas.
Using a smartphone does not require a high level of technical skills or literacy, which makes it an inclusive approach for disadvantaged groups, as Schumann et al. (2019) or Daum et al. (2019) also concluded.
The general participation seemed to have a positive influence on the perception of women: “Even our husbands no longer undermine us” (interviewed woman from Mukono). 2
Concerning women’s empowerment, one woman commented: “I made friends in this session; even I was able to learn how to use a smartphone” (interviewed woman from Kalungu).
Most farmers taught a family member or friend to use the smartphone, so that they could capture the farmer (participant) demonstrating a practice. They also realized how much they already knew: “We found out that it was us who had all the information that we shared, so it was us teaching you [the research team] and we just fail to practice what we know” (interviewed woman from Kiboga).
These quotes confirm Koningstein and Azadegan’s (2021:229) observation that participatory methods “encouraged participants to try something new, promoting a perspective that views mistakes as learning opportunities, and bolstering their confidence in their ability to master new skills.”
Prerequisites
For visualizing data on PIDs we used flipchart paper and marker pens. Implementing the smartphone-led activity we needed a projector besides the phones. Charging them and managing the large data, required considerably more time and logistical planning.
Training study participants how to use the phones was time consuming, and especially women tended to need additional assistance.
Reflection
The comparison of the different research methods highlights the potential of visual tools. In particular, the photos and cellphilms generated more individually different and detailed information. With smartphones, groups identified additional adaptation strategies to the ones mentioned during the interviews. The method also enabled individual participants to share their personal knowledge and experience. This resonates with the results from previous photovoice studies. Wang and Burris (1997) found that the technique enables participants to document their individual perceptions of problems and assets, which is an aspect of sustainable empowerment. Jarldorn (2019) showed how women experiencing domestic violence regained self-confidence, pride, and the ability to express themselves using photovoice. Gervais and Rivard (2013) and Schumann et al. (2019) emphasize photovoice’s applicability independent of age, literacy levels, or gender, which is supported by our results as well since women especially seemed to benefit from using the digital tools—after needing some more time to learn how to use it.
The majority of participants gave positive feedback regarding the use of smartphones in this study. While most participating farmers did not own smartphones, they were familiar with the technology and appreciated the educational aspect of our research. One farmer, who conducts agricultural training himself, explicitly told us that he will save money for a smartphone to use in his training programs. Many participants emphasized the methodology’s suitability for sharing agricultural knowledge; once recorded, photos and videos of practices can be watched independently of weather and season. The educational benefit serves as another entry point for empowerment on a community level and confirms what George et al. (2018) found with their application of participatory video—that it served well in an educational aspect of agricultural push-and-pull technologies. In view of climate change and the need to adapt to more extreme weather and natural disasters, it is critical to thoroughly observe effective land-use practices that are well adapted to geographical circumstances (e.g., agroforestry) and to exchange experiences (e.g., planting certain trees). Mapfumo et al. (2013) point this out by strengthening the need for local responses to climate change adaptation as a local phenomenon.
The additional more detailed and more complex information gathered through the photos and cellphilms therefore cannot be underestimated, as it revealed crucial information like in the example of agroforestry (see Richness of Information) and as it furthermore may aid in developing risk management strategies (see Schumann et al. 2019) and increasing resilience of individuals and communities. Comparing and exchanging local knowledge on practices like composting, planting certain tree species, and handling pathogens strengthens women’s self-confidence, as their feedback to us confirms. Participants’ role as co-researcher adds to this empowering effect, as the quoted women affirm (see Equal Participation and Empowerment). Their statements emphasize the methodologies’ valuable contribution to participatory research in general. Since participants were members of active farmer groups, they might have been more motivated and educated than the average farmer, which may have influenced our perception of farmers’ willingness to participate.
As smartphones become increasingly more accessible, researchers might consider using these tools. This raises an important and sensitive ethical issue, which has received attention in previous studies using visual methodologies (see Kindon 2003; Milne 2016; Wilhoit and Kisselburgh 2016). As Mitchell (2008) describes, research using the visual is often scrutinized with special care by ethics boards. This is reasonable, since visual data can be highly personal—sometimes more so than words. In combination with digital technologies like smartphones, ethical considerations deserve even higher sensitivity. The smartphones used did not contain SIM cards and were set on flight mode to avoid participants using the phones for other purposes. However, participants could put in their personal SIM cards, which some did against our advice. Sharing the photos or cellphilms via social media or messenger services could provide both an advantage (when aiming for agricultural advice without the need to visit farmers in areas that are difficult to access) and a disadvantage, if private or inappropriate, sensitive, political content is shared.
The blurring of power relations in research designs using visual and digital technologies—meaning that participants become researchers themselves to a certain extent—should be considered, too, especially in research settings with marginalized groups. The situations or objects captured will depend on participants’ relationships to them and in how far they can now execute power over the subject, as holding a camera is associated with having control and power over the subject looked at (Truong et al. 2020). Participants may be able to, even unintentionally, record a third person without their consent (Wilhoit and Kisselburgh 2016). This calls for careful planning and sensitive execution of camera-based studies and a reflection of this limitation in the discussion of results. In our study, we only lent the smartphones to participants for a couple of days, which can be critically assessed as determining a power hierarchy, as Milne (2016) criticizes. As ownership of smartphones continues to increase, we suggest that future studies focus on personal cellphones. Jarldorn (2019) observed that her participants intuitively used their smartphones instead of the single-use cameras provided. This may also help reduce the logistical organization and workload for the research. Additionally, using personal smartphones could be used for carrying out longer-lasting studies (e.g., collecting data multiple times in the season).
Conclusion
The use of digital visualization tools, photovoice, and especially cellphilms in agricultural research is still nascent but can be effective in collecting valuable data about how farmers adapt to climate change in rural communities. Compared to interviews with taking notes, visualization using PIDs and digital visual tools (capturing videos and photos) helped generate more comprehensive data. The digital visual tools increased the richness of information—a central goal of scientific research—and context-specific information compared to the group interviews. Farmers showed enthusiasm in participating and contributing to the study using smartphones, enabling shy individuals to share their views, too. Women especially seemed to feel confident in sharing their knowledge using digital devices. Women recorded additional adaptation strategies than those mentioned during the interviews. Their feedback highlighted the empowering aspect of being enabled to use a smartphone and to “teach the researcher” as co-researchers about their practices. Using such methods, which help give voice to women, is key for sustainable development given the share of female farmers and the urgent need for gender equality.
However, using digital visual tools is more time consuming and comes with some new ethical considerations—such as the potential dissemination of the recordings through the Internet and the careful and conscious handling of power relations. In situations where more abstract thinking is possible and time is scarce, group interviews with PIDs, using the principle of visualization combined with swarm intelligence, might be a good alternative to cellphilm and photovoice, as we observed in most of the youth groups. However, individual empowerment is limited.
If ethical aspects are adequately considered, digital tools like smartphones have great potential to aid in complex research (e.g., climate change and adaptation strategies) in rural communities in developing countries. The additional value these technologies bring to empowering and solution-driven research in varying disciplines are, in our experience, worth the additional efforts taken by research teams using digital visual tools.
Footnotes
Acknowledgments
We would like to thank Dr. Patience Rwamigisa for his continuous support during and after fieldwork. Our special gratitude goes to all farmers who participated in this study and donated their time and knowledge to us. We gratefully acknowledge the financial support for this study by the German Federal Ministry for Economic Cooperation and Development and the CGIAR Research Program on Policies, Institutions, and Markets.
Declaration of Conflicting Interests
The author(s) declared no potential conflicts of interest with respect to the research, authorship, and/or publication of this article.
Funding
The author(s) disclosed receipt of the following financial support for the research, authorship, and/or publication of this article: This work was supported by the financial support for this study by the German Federal Ministry for Economic Cooperation and Development (2019X313.UOH, CGIAR) and the CGIAR Research Program on Policies, Institutions, and Markets.
Data Availability Statement
The data that support the findings of this study are available on request from the corresponding author.